life sciences p2 feb march 2014 eng
TRANSCRIPT

Copyright reserved Please turn over
MARKS: 150 TIME: 2½ hours
This question paper consists of 15 pages.
LIFE SCIENCES P2
FEBRUARY/MARCH 2014
NATIONAL SENIOR CERTIFICATE
GRADE 12

Life Sciences/P2 2 DBE/Feb.–Mar. 2014 NSC
Copyright reserved Please turn over
INSTRUCTIONS AND INFORMATION Read the following instructions carefully before answering the questions. 1. 2. 3. 4. 5. 6. 7. 8. 9. 10. 11.
Answer ALL the questions. Write ALL the answers in the ANSWER BOOK. Start the answers to EACH question at the top of a NEW page. Number the answers correctly according to the numbering system used in this question paper. Present your answers according to the instructions of each question. Do ALL drawings in pencil and label them in blue or black ink. Draw diagrams or flow charts only when asked to do so. The diagrams in this question paper are NOT necessarily drawn to scale. Do NOT use graph paper. You must use a non-programmable calculator, a protractor and a compass where necessary. Write neatly and legibly.

Life Sciences/P2 3 DBE/Feb.–Mar. 2014 NSC
Copyright reserved Please turn over
SECTION A QUESTION 1
1.1 Various options are given as possible answers to the following questions.
Choose the correct answer and write only the letter (A to D) next to the question number (1.1.1 to 1.1.10) in the ANSWER BOOK, for example 1.1.11 D.
1.1.1 Which of the following is an example of parasitism? A
B C D
Bees visiting a flower A bird's nest in a tree A spider eating an insect Ticks living on a dog
1.1.2 Which ONE of the following statements is TRUE about the
relationship between a predator and its prey?
A
B C D
There is interspecific competition. The size of the predator population is regulated by the size of the prey population. An increased number of predators leads to an increased number of prey. A decreased number of predators leads to a decreased number of prey.
A
B C D
Amnion Chorion Fallopian tube Cervix
1.1.4 Defence mechanisms that plants have against insects include
the ...
A
B C D
cell walls of cellulose. production of toxic chemicals. presence of an internal vascular system. ability of stomata to close both day and night.
1.1.5 In order to maintain a stable population in an area where
emigration and immigration do not occur ...
A
B C D
the food supply must be limited. predators must be introduced. the natality rate must be lower than the mortality rate. the mortality rate must be equal to the natality rate.
1.1.3 Which part below forms part of the placenta?

Life Sciences/P2 4 DBE/Feb.–Mar. 2014 NSC
Copyright reserved Please turn over
QUESTIONS 1.1.6 AND 1.1.7 ARE BASED ON THE GRAPH BELOW.
1.1.6 If fertilisation was to occur, the level of hormone Z from day 18
would ...
A
B C D
decrease as shown in the graph. first decrease and then increase. not decrease. follow the same pattern shown in the graph for hormone X.
A
B C D
1, 2, 3. 2, 3, 1. 2, 1, 3. 3, 2, 1.
1.1.7 Structures 1, 2 and 3 below show different stages in the development of the follicle during the menstrual cycle.
The sequence of the structures that correspond to A, B and C on the graph above is …
0 2 4 6 8 10 12 14 16 18 20 22 24 26
B
A
C
Hor
mon
e le
vel
Hormone X Hormone Z
Day
Structures
1 2 3

Life Sciences/P2 5 DBE/Feb.–Mar. 2014 NSC
Copyright reserved Please turn over
1.1.8 Which ONE of the following set of conditions will most likely result
in a great increase in the population size of prey?
A B C D
PREDATION FOOD SUPPLY DISEASE Decrease Increase Decrease Increase Increase Decrease Decrease Decrease Increase Increase Decrease Increased
QUESTIONS 1.1.9 AND 1.1.10 ARE BASED ON THE DIAGRAM BELOW. 1.1.9 Which combination of labels for 2, 3 and 4 respectively is
CORRECT?
A
B C D
Hypothalamus, cerebrum, cerebellum Cerebrum, cerebellum, hypothalamus Hypothalamus, medulla oblongata, cerebellum Medulla oblongata, cerebrum, cerebellum
1.1.10 What is the function of the part numbered 1? A
B C D
Responsible for muscle tone Responsible for all voluntary muscular movements Controls important reflex actions Regulates the rate of the heartbeat (10 x 2)
(20)
1 2 3
4

Life Sciences/P2 6 DBE/Feb.–Mar. 2014 NSC
Copyright reserved Please turn over
1.2 Give the correct biological term for each of the following descriptions.
Write only the term next to the question number (1.2.1 to 1.2.6) in the ANSWER BOOK.
1.2.1
1.2.2 1.2.3 1.2.4 1.2.5 1.2.6
The maintenance of a constant internal environment in living organisms Transfer of a pollen grain from an anther to a stigma The production of offspring from a single plant without the fusion of gametes Barriers that prevent members of two species from producing offspring The development of the adult form from a fertilised egg without going through a larval stage in some insects Neurons that carry impulses from receptors
(6)
1.3 Indicate whether each of the statements in COLUMN I applies to A ONLY,
B ONLY, BOTH A AND B or NONE of the items in COLUMN II. Write A only, B only, both A and B or none next to the question number (1.3.1 to 1.3.8) in the ANSWER BOOK.
COLUMN I COLUMN II
1.3.1 A relationship in which both species benefit from the association
A: Commensalism B: Mutualism
1.3.2 Consumers in a food chain A: Herbivores B: Omnivores
1.3.3 Use of the same resource by two species, but in different ways
A: Resource partitioning B: Competitive exclusion
1.3.4 Colonisation of a habitat that was previously unoccupied
A: Primary succession B: Secondary succession
1.3.5 The part of the nervous system that controls the activity of the internal organs such as the heart
A: Sympathetic B: Parasympathetic
1.3.6 Place where sound stimuli are converted into nerve impulses
A: Semi-circular canals B: Oval window
1.3.7 Importance of seeds A: Contains food for the embryo B: Protects the embryo
1.3.8 The structure that develops from an ovary
A: Seed B: Fruit
(8 x 2) (16)

Life Sciences/P2 7 DBE/Feb.–Mar. 2014 NSC
Copyright reserved Please turn over
1.4 The diagrams below show the human male and female reproductive systems. Write the LETTER (A–H) and NAME of the part: 1.4.1
1.4.2 1.4.3 1.4.4
Which transports urine to the outside of the body Where fertilisation occurs Where sperms are produced Where ova are produced
(2) (2) (2) (2) (8)
TOTAL SECTION A: 50
A
B C D
E F G H

Life Sciences/P2 8 DBE/Feb.–Mar. 2014 NSC
Copyright reserved Please turn over
SECTION B QUESTION 2
2.1 The diagram below represents a cross-section of a human seminiferous
tubule in which a process is occurring.
2.1.1
2.1.2 2.1.3
Name the specific process illustrated in the seminiferous tubule which leads to the formation of structure A. Name the hormone produced by the organ containing seminiferous tubules. Give ONE function of the hormone named in QUESTION 2.1.2.
(1) (1) (1)
2.1.4 How many chromosomes are there in each: (a)
(b)
Spermatogonium cell Spermatid
(1) (1)
2.1.5 Make a labelled drawing to show the structure of the cell
labelled A.
(5) (10)
spermatogonium
spermatid
A
Connective tissue
between adjacent
seminiferous tubules
Portion of the wall of the seminiferous tubule
Cross section of part of a seminiferous tubule showing a process

Life Sciences/P2 9 DBE/Feb.–Mar. 2014 NSC
Copyright reserved Please turn over
2.2 The graph below shows changes in a person's body temperature over
a period of 30 minutes.
[Adapted from Biology 2, Cambridge, 2007] 2.2.1
2.2.2
By how many °C did the temperature change during this period of 30 minutes? Account for the changes in the body temperature during period X.
(2) (8) (10)
Bod
y te
mpe
ratu
re (°
C)
Time (minutes)
0
0.2
0.4
0.6
0.8
1
1.2
0 5 10 15 20 25 30
39,0 38,5 38,0 37,5 37,0 36,5 36,0
X
exer
cise
sta
rts
exer
cise
end
s
cold
sho
wer
sta
rts
cold
sho
wer
end
s

Life Sciences/P2 10 DBE/Feb.–Mar. 2014 NSC
Copyright reserved Please turn over
2.3 Study the diagram and the graph below and answer the questions that follow.
2.3.1
2.3.2 2.3.3 2.3.4 2.3.5
Explain ONE way in which part B is suitable for its function. Explain how and why the part labelled A makes adjustments when a person moves from bright light into a dark room. Which NUMBER (1–4) on the graph represents C in the diagram? Give a reason for your answer to QUESTION 2.3.3. Name the part of B in the diagram which corresponds to number 2 on the graph.
(2) (5) (1) (1) (1) (10)
[30]
A B
C
Section of the human eye
1 2 3 4
Rel
ativ
e cl
arity
of t
he im
age
Graph of clarity of image and areas on retina
Areas on the retina

Life Sciences/P2 11 DBE/Feb.–Mar. 2014 NSC
Copyright reserved Please turn over
QUESTION 3
3.1 The table below shows the changes in the population size of a type of insect over 14 weeks.
Time
(weeks) Population size
0 200 2 500 4 3 200 6 7 800 8 11 400
10 12 200 12 12 200 14 12 200
3.1.1
3.1.2 3.1.3
Plot a line graph using the information in the table above. On your graph, label the different phases of growth represented. How is the pattern of growth in the graph you have drawn different from a geometric growth form?
(6) (3) (1) (10)
3.2
An investigation was done to find out more about competition among pea plants. Five groups of pea plants were grown in similar soil in areas of one square metre (1 m2) each, under the same environmental conditions. The results are shown in the table below.
Group Number of plants
per area of 1 m2 Average number of pods per plant
Average number of seeds per pod
1 20 8,3 6,0 2 40 6,8 5,9 3 60 3,9 6,2 4 80 2,7 5,9 5 100 2,1 6,0
3.2.1
3.2.2 3.2.3 3.2.4
Identify TWO dependent variables for the above investigation. Which variable in the table appears to be greatly affected by competition between neighbouring plants? State ONE way in which the variable in QUESTION 3.2.2 was affected as the density of plants in a 1 m2 area increased. State TWO resources for which the pea plants in this investigation might have competed.
(2) (1) (1) (2)

Life Sciences/P2 12 DBE/Feb.–Mar. 2014 NSC
Copyright reserved Please turn over
3.2.5 3.2.6 3.2.7 3.2.8
Calculate the total number of seeds produced in the area where 20 plants were grown on a 1 m2 area. Show ALL working. Which group (1 or 5) produced a greater yield of seeds per plant? Explain your answer to QUESTION 3.2.6. Apart from the environmental conditions, state TWO other factors that had to be kept constant to ensure that the results obtained were valid.
(2) (1) (2) (2) (13)
3.3 The diagrams below represent graphs of age and gender distribution for
a developed country and a developing country.
3.3.1 Explain the value of the information provided by the graphs above
when planning for education.
(2)
3.3.2 State TWO effects that a high population growth has on the environment.
(2)
3.3.3
3.3.4
Which graph (A or B) represents the population distribution of a developing country? Give TWO reasons for your answer to QUESTION 3.3.3.
(1) (2) (7)
[30]
TOTAL SECTION B: 60
Percentage of females
Percentage of males
GRAPH A GRAPH B
Age groups in years Age groups in years
Percentage of males
Percentage of females

Life Sciences/P2 13 DBE/Feb.–Mar. 2014 NSC
Copyright reserved Please turn over
SECTION C QUESTION 4
4.1 Read the passage below and answer the questions that follow.
THE DESTINY OF CHINA
In 1978, the Chinese government decided that it was necessary to use its influence to slow down the population growth rate in order for all people to have sufficient food and a reasonable quality of life. The population growth rate in 1971 was 2,3%. The government goals were to reduce it to 0% by the year 2000. By 1986 it was at 1%. A one-child policy was introduced in which couples with one child would be rewarded with good jobs, good housing, a bonus of an extra month's salary, as well as free education and medical care for the child.
[Adapted from Integrated Science, Systems and Diversity, 1995]
4.1.1
4.1.2
State a method that is used to determine the human population size. From the passage above, give TWO reasons why the Chinese government decided it was necessary to slow down the population growth rate.
(1) (2)
4.1.3
4.1.4
Explain how the one-child policy can influence the population size over many generations. In a country that values the birth of a son more than that of a daughter, explain how the one-child policy could influence the gender structure of the population.
(2) (2) (7)

Life Sciences/P2 14 DBE/Feb.–Mar. 2014 NSC
Copyright reserved Please turn over
4.2 An investigation was carried out to determine the effect of two plant hormones
(A and B) on the accumulation of starch in the cells of tobacco plants. The investigation was set up as follows: • 30 tobacco plants of the same species, size and age were used. • They were divided into 3 groups, each treated in a different way as
follows: Group 1: 10 plants were treated with hormone A Group 2: 10 plants were treated with hormone B Group 3: 10 plants were given no hormone treatment
• All the plants were then left under the same conditions. The starch content in the cells was measured after every 6 hours for each group.
The graph below shows the results of the treatments for a period of 48 hours.
Changes in the starch content of three groups of tobacco plants over 48 hours
0
0.1
0.2
0.3
0.4
0.5
0.6
0.7
0.8
0 6 12 18 24 30 36 42 48
Time (hours)
Star
ch c
onte
nt (m
g/10
6 cel
ls)
Group 1
Group 2
Group 3
4.2.1
4.2.2
Explain the purpose of Group 3 in the investigation. Using the results, indicate the function of:
(2)
(a)
(b)
Plant hormone A Plant hormone B
(2) (2) (6)
Life Sciences/P2 15 DBE/Feb.–Mar. 2014 NSC
Copyright reserved
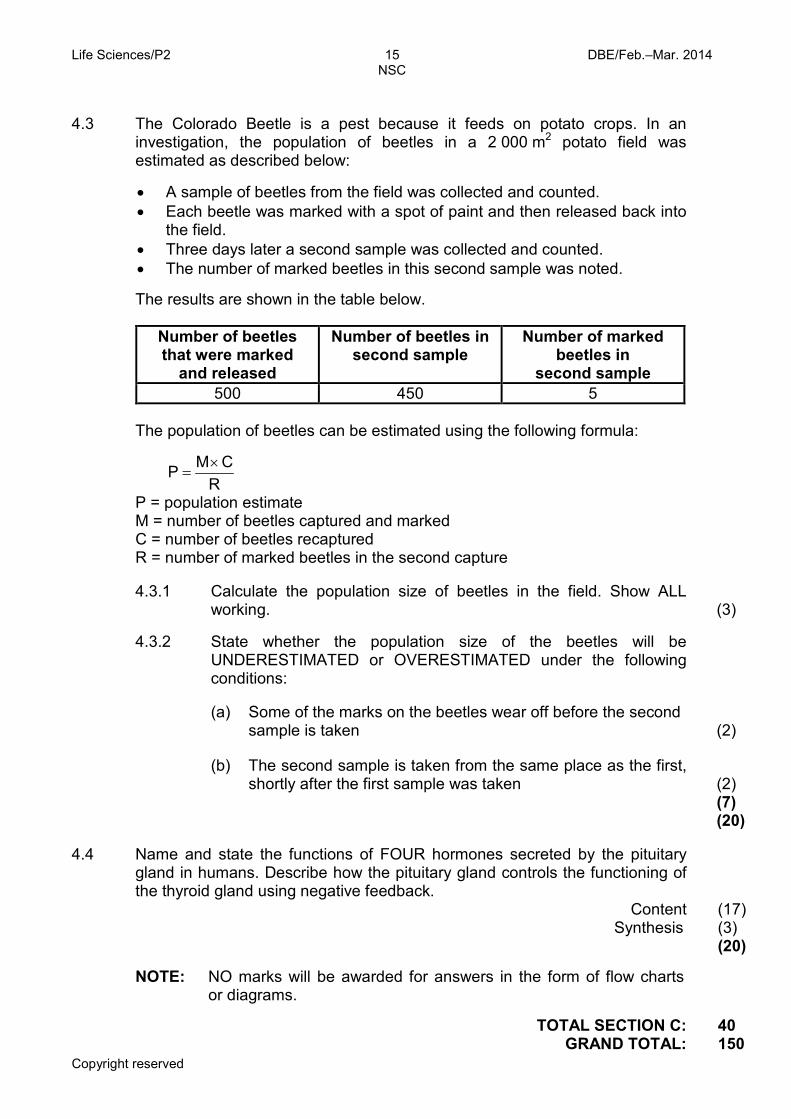
4.3 The Colorado Beetle is a pest because it feeds on potato crops. In an
investigation, the population of beetles in a 2 000 m2 potato field was estimated as described below:
• A sample of beetles from the field was collected and counted. • Each beetle was marked with a spot of paint and then released back into
the field. • Three days later a second sample was collected and counted. • The number of marked beetles in this second sample was noted. The results are shown in the table below.
Number of beetles that were marked
and released
Number of beetles in second sample
Number of marked beetles in
second sample 500 450 5
The population of beetles can be estimated using the following formula:
R
CMP ×=
P = population estimate M = number of beetles captured and marked C = number of beetles recaptured R = number of marked beetles in the second capture
4.3.1
4.3.2
Calculate the population size of beetles in the field. Show ALL working. State whether the population size of the beetles will be UNDERESTIMATED or OVERESTIMATED under the following conditions:
(3)
(a)
(b)
Some of the marks on the beetles wear off before the second sample is taken The second sample is taken from the same place as the first, shortly after the first sample was taken
(2) (2) (7) (20)
4.4 Name and state the functions of FOUR hormones secreted by the pituitary
gland in humans. Describe how the pituitary gland controls the functioning of the thyroid gland using negative feedback.
Content Synthesis
(17) (3) (20)
NOTE: NO marks will be awarded for answers in the form of flow charts
or diagrams.
TOTAL SECTION C:
GRAND TOTAL: 40
150