eprints.uwe.ac.ukeprints.uwe.ac.uk/29452/1/measuring life satisfaction... · web viewusing the...
TRANSCRIPT

Using the Bristol City Council Quality of Life Survey (2011-2013) – Preliminary analysis of life satisfaction and recommendations for
further analysesJanet Mundy & Issy Bray
Summary
The purpose of this report is to explore the utility of the Bristol Quality of Life (QoL) Survey for measuring levels of life satisfaction (as a measure of well-being and mental health) in Bristol’s population aged 55 and over. An earlier report1 examined the variables available to measure levels of physical activity. This report focuses on life satisfaction and its association with physical activity and other variables. Life satisfaction was higher for women (73.5%) than for men (72.2%), higher amongst non-BME (Black Minority Ethnic) (73.4%) than for BME (63.3%) respondents and highest in the most affluent North & West (Inner) sub-locality (81.1%) and lowest in Inner City (East) (67.6%). Across age groups, life satisfaction rose from 68.3% overall for those aged 55-59, through the 60-64 age group (72.8%), remained around 75% through ages 65 to 84 before falling again to 66.5% for those aged 85-89 and to a low of 65.4% overall for those aged 90+.
There was an association between life satisfaction and physical activity, with 76.7% of those that undertook moderate physical exercise at least once per week reporting positive life satisfaction, compared with 56.4% of those who took moderate exercise less than once per week. This held across all age groups studied here (55-59 up to 90+). Life satisfaction amongst those who remained physically active at age 85-89 was high (78.3% for men and 78.8% for women). Life satisfaction amongst the least active (moderate exercise less than once per week) was only 46.7% among men in age group 85-89 and 49.4% for women.
General health in the past 12 months was positively associated with life satisfaction, while having a limiting long-term illness, having had an accidental fall in the last 12 months and being underweight or obese were all associated with lower levels of life satisfaction. There is a negative association between deprivation and both life satisfaction and physical activity. Social interaction (e.g. meeting family and friends), neighbourhood satisfaction and a sense of belonging to the neighbourhood were positively associated with life satisfaction. Reporting that ‘something prevents me leaving that house’ and feeling unsafe outdoors were associated negatively with life satisfaction.
Background1 Using the Bristol City Council Quality of Life Survey (2011-2013) to support the Bristol Health partners Health Integration Team ‘Active People: Promoting Healthy Life Expectancy’ – Preliminary Analysis and Recommendations for Further Analyses (http://eprints.uwe.ac.uk/27912/)
1

Bristol’s population is estimated to be approximately 437,500 (ONS mid-year population estimate 2013) with older people (aged 55 and over) representing 22% (97,900) of that total. More than 9,000 Bristol residents are aged 85 and over – an age group that increased by 22.3% between 2001 and 2012 reflecting the ageing population trend in England& Wales. The implications of the ageing population are well-documented2. An estimated 4,100 people in Bristol have dementia, and the number of people with dementia in Bristol is predicted to rise by 51% by 20373. Maintaining physical activity levels and positive mental health are both important strategies to promote health and well-being amongst older people. The positive effect of physical activity on physical and mental health is associated with increases in life satisfaction4. Life satisfaction is a subjective measure of well-being, and an important predictor of both morbidity and mortality5.
The UK Office for National Statistics6 reported in 2013 that “between 2011/12 and 2012/13 the proportion of people rating their life satisfaction as medium or high rose from 75.9% to 77.0%…People aged 45 to 49 rated their life satisfaction lower than any other age group and Black people lower than any other ethnic group…”. An association between low deprivation score and higher life satisfaction was noted in the ONS national report. Survey data suggests that, compared with other large cities, a relatively high proportion of residents of Bristol have self-rated life satisfaction scores of high or very high, but this conceals inequalities within the city in terms of geography, gender and age4.
The Bristol City Council Quality of Life Survey
The Bristol City Council Quality of Life (QoL) survey has been administered since 2001 by Bristol City Council. The purpose is to collect information from Bristol residents about a wide range of factors related to quality of life including life satisfaction, social-interaction/isolation, connectedness with neighbourhood, health, and participation in physical exercise. This data is recorded together with demographic variables including age, gender, postal address and Index of Multiple Deprivation (IMD2010) for that address.
An earlier report1 presented an analysis of recent data (2011-2013) for physical activity levels amongst people aged 55 years and over, by gender, 5 year age band, ethnicity and sub-locality. The 35 wards of Bristol were divided into five sub-localities (in line with Clinical Commissioning Group (CCG) divisions) to provide meaningful categorisation in terms of geography and socio-economic context (See Appendix 1). This report extends that analysis by including life satisfaction as a measure of well-being.
Response rates to the questionnaire
2 Cylus J, Richardson E, Findley L, Longley M, O'Neill C, Steel D, 2015. United Kingdom: Health System Review. Health Syst Transit, 17(5), pp 1-1263 Bristol Clinical Commissioning Group, 2015. Joint Strategic Needs Assessment4 Maher JP, Pincus AL, Ram N, Conroy DE, 2015. Daily physical activity and life satisfaction across adulthood. Dev Psychol, 51(10), pp 1407-19 5 Boehm JK, Winning A, Segerstrom S, Kubzansky LD, 2015. Variability Modifies Life Satisfaction's Association With Mortality Risk in Older Adults. Psychol Sci, 26(7), pp 1063-706 ONS Personal Well-being in the UK 2012/2013 July 2013
2

The overall response rates were 23% in 2011, 20% in 2012 and 19% in 2013. The relatively low response rate means that the survey results may not be representative of the Bristol population, but it should be noted that response rates are higher amongst the older age groups of interest here. For a breakdown of the number of responses by age, gender, year and sub-locality, see Appendix 2.
Individual questions and response rates
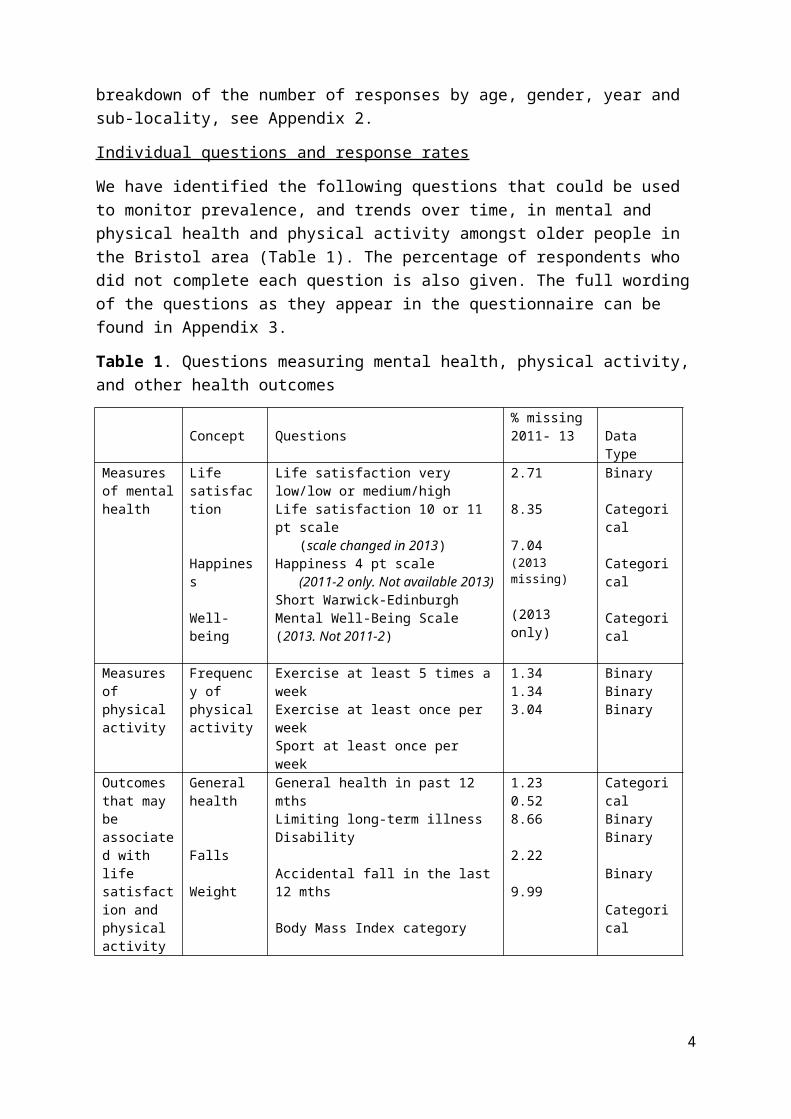
We have identified the following questions that could be used to monitor prevalence, and trends over time, in mental and physical health and physical activity amongst older people in the Bristol area (Table 1). The percentage of respondents who did not complete each question is also given. The full wording of the questions as they appear in the questionnaire can be found in Appendix 3.
Table 1. Questions measuring mental health, physical activity, and other health outcomes
Concept Questions% missing 2011- 13 Data Type
Measures of mental health
Life satisfaction
Happiness
Well-being
Life satisfaction very low/low or medium/highLife satisfaction 10 or 11 pt scale (scale changed in 2013)Happiness 4 pt scale (2011-2 only. Not available 2013)Short Warwick-Edinburgh Mental Well-Being Scale (2013. Not 2011-2)
2.71
8.35
7.04 (2013 missing)
(2013 only)
Binary
Categorical
Categorical
Categorical
Measures of physical activity
Frequency of physical activity
Exercise at least 5 times a weekExercise at least once per weekSport at least once per week
1.341.343.04
BinaryBinaryBinary
Outcomes that may be associated with life satisfaction and physical activity
General health
Falls
Weight
General health in past 12 mthsLimiting long-term illnessDisability
Accidental fall in the last 12 mths
Body Mass Index category
1.230.528.66
2.22
9.99
CategoricalBinaryBinary
Binary
Categorical
Of the four measures of mental health available, we focus here on the binary life satisfaction variable (‘very low/low’ or ‘medium/high’). This variable was selected because the question format was consistent during the period 2011-2013 and it had least missing data. The variable ‘Happiness’ was excluded because it was not asked in the 2013 survey and the variable ‘Warwick-Edinburgh Mental Well-Being Scale’ was only included in 2013.
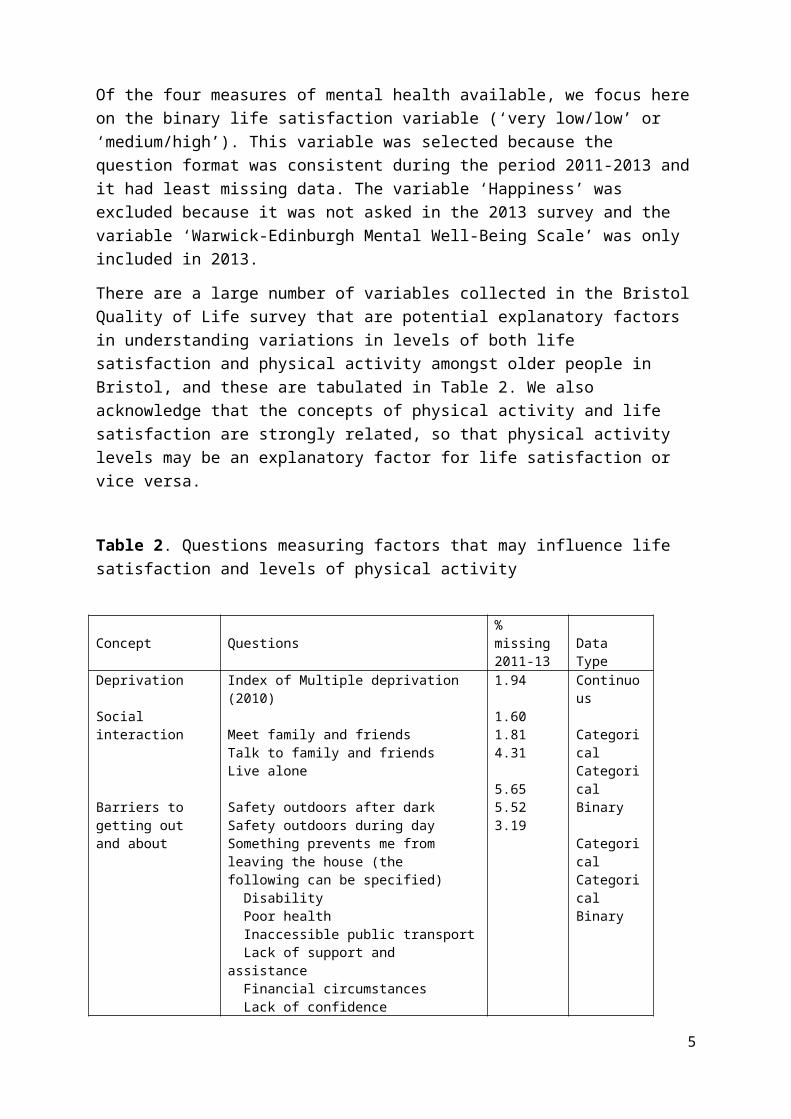
There are a large number of variables collected in the Bristol Quality of Life survey that are potential explanatory factors in understanding variations in levels of both life satisfaction and physical activity amongst older people in Bristol, and these are tabulated in Table 2. We also acknowledge that the concepts of physical activity and
3
life satisfaction are strongly related, so that physical activity levels may be an explanatory factor for life satisfaction or vice versa.
Table 2. Questions measuring factors that may influence life satisfaction and levels of physical activity
Concept Questions% missing2011-13
Data Type
Deprivation
Social interaction
Barriers to getting out and about
Enablers to getting out and about
Connectedness with neighbourhood
Index of Multiple deprivation (2010)
Meet family and friendsTalk to family and friendsLive alone
Safety outdoors after darkSafety outdoors during daySomething prevents me from leaving the house (the following can be specified) Disability Poor health Inaccessible public transport Lack of support and assistance Financial circumstances Lack of confidence Fear of crime Caring responsibilities
Quality of parks and green spacesRange/quality outdoor events
Satisfaction with neighbourhoodI belong to my neighbourhood
1.94
1.601.814.31
5.655.523.19
10.172.32
2.144.40
Continuous
CategoricalCategoricalBinary
CategoricalCategoricalBinary
CategoricalCategorical
CategoricalCategorical
Describing levels of life satisfaction
Based on pooled data for 2011-2013, we present headline figures for the key variables identified above. Figure 1 shows the percentage of males and females in each age band who report positive (medium/high) life satisfaction. Overall, for this Bristol QoL sample aged 55 and over, life satisfaction was similar for men (73.5%) and women (72.2%). For men, life satisfaction rose from 67.3% aged 55-59, through 70.3% aged 60-64 to 75.4% aged 65-69 possibly reflecting the transition to retirement. It peaked at 75.9% aged 80-84 then fell again to 66.1% for aged 85 and over. For women life satisfaction rose from 69.1% aged 55-59, to 75.0% aged 60-64 possibly reflecting an earlier transition to retirement. It peaked at 76.0% aged 75-79,
4
with the decline also starting earlier – 73.5% for ages 80-84 and 66.1% for ages 85 and over.
Figure 2 shows the percentage of respondents who reported positive life satisfaction by CCG sub-locality and ethnicity (BME/non-BME). Overall, life satisfaction was higher amongst non-BME (73.4%) than BME (63.3%) respondents and highest in the most affluent North & West (Inner) sub-locality (81.1%) and lowest in neighbouring Inner City (East) (67.6%). Life satisfaction was highest in the Bristol North & West (Inner) sub-locality for both non-BME (81.3%) and BME (77.1%) respondents.
Figure 1. Percentage of respondents who reported medium/high life satisfaction, by age group and gender (actual numbers shown in Appendix 4)
55-59 60-64 65-69 70-74 75-79 80-84 85-89 90+0
10
20
30
40
50
60
70
80
90
100
5 year age band
MaleFemaleP e r c e n t
Figure 2. Percentage of respondents who reported medium/high life satisfaction, by sub-locality and ethnicity (actual numbers shown in Appendix 3)
5

South N&W Outer N&W Inner Inner City East0
10
20
30
40
50
60
70
80
90
100
CCG Sublocality
BME
Non-BMEP e r c e n t
It was lowest for BME respondents in Bristol South (52.0%) and for non-BME respondents in Bristol Inner City and East (East) (68.4%). The difference in life satisfaction between BME and non-BME groups was least in Inner City & East (East) with non-BME 68.4% and BME group and 67.1%, and was greatest for Bristol South with non-BME 72.5% only 52.0% for BME. We note however that the numbers of BME respondents in some sub-localities was quite small (<50), so the results should be interpreted with caution.
Association between life satisfaction and physical activity
Life satisfaction was highest for those who engaged with physical activity compared with those who did not (see Figure 3). Overall, life satisfaction amongst those that undertook moderate physical exercise (e.g. brisk walk, leisure activity, heavy gardening, heavy housework or DIY) at least once a week was 77.1% and was only marginally higher (77.5%) for those who undertook such activity at least 5 times a week. Life satisfaction was higher (83.7%) for participants who reported that they took part in a sporting activity (e.g. football, running, swimming) for 30 minutes or more at least once per week. These percentages compare with only 57.2% of those in the least active group (exercise less than once per week) reporting positive life satisfaction.
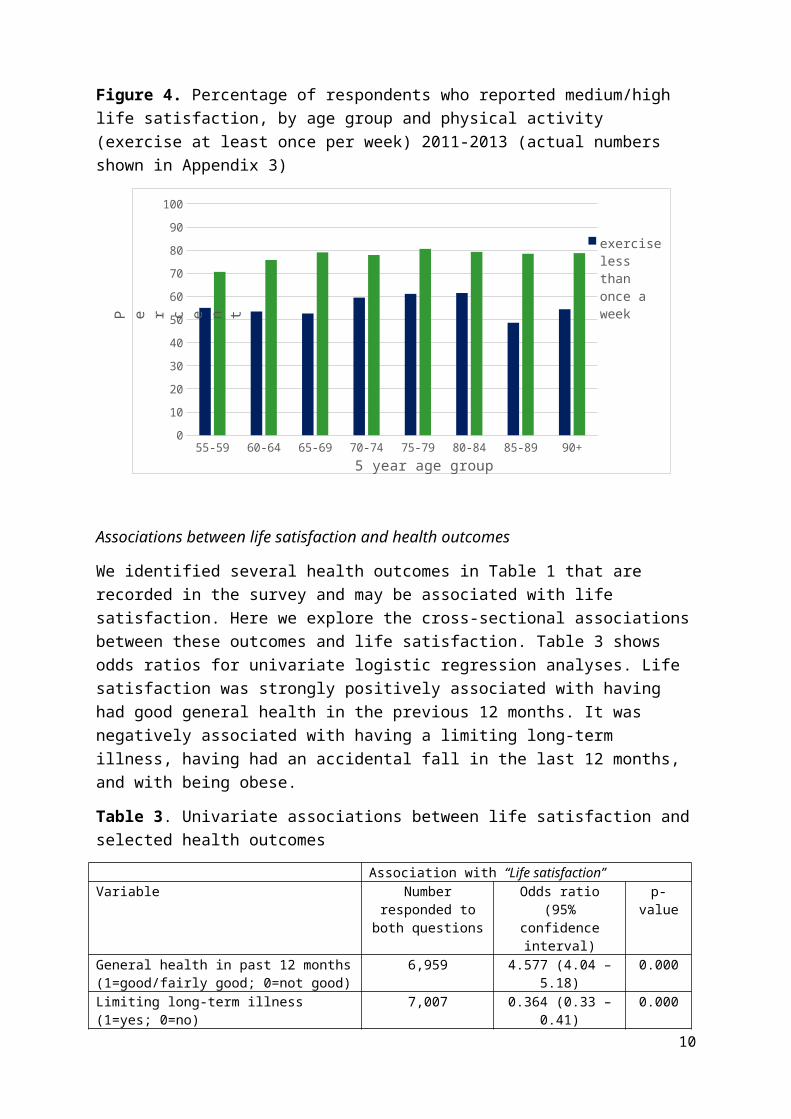
Figure 4 illustrates that Bristol QoL respondents that undertook moderate physical exercise (e.g. brisk walk, leisure activity, heavy gardening, heavy housework or DIY) at least once per week reported higher life satisfaction across all age groups than those who did not. The proportion reporting medium/high life satisfaction was maintained with increasing age (79.1% for active men and 80.8% for active women of 85 and over). Conversely, life satisfaction amongst those who took moderate exercise less than once per week was only 48.6% for those aged 85-89.
6
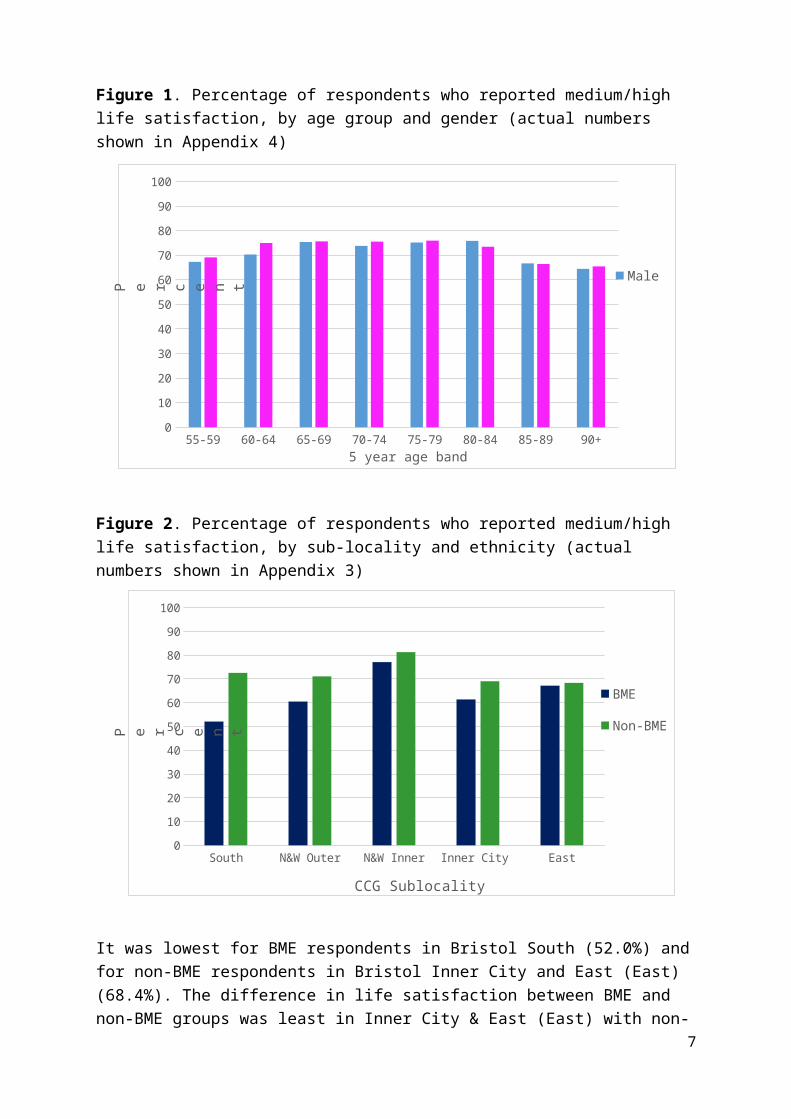
Figure 3. Number (%) of respondents who reported medium/high life satisfaction according to different measures of physical activity 2011-2013
Exercise at least once? Exercise at least 5 times? Play sport at least once?0
10
20
30
40
50
60
70
80
90
100
Medium/high life satisfaction by weekly physical activity level
Yes No
P e r c e n t
7
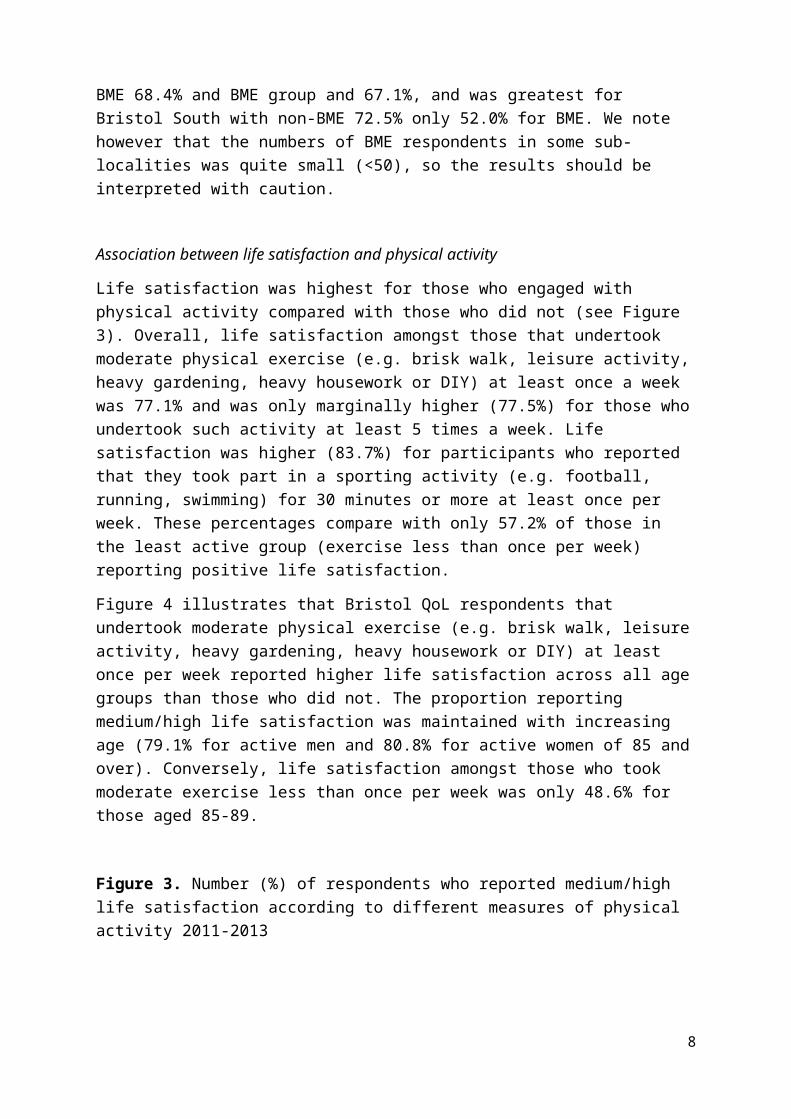
Figure 4. Percentage of respondents who reported medium/high life satisfaction, by age group and physical activity (exercise at least once per week) 2011-2013 (actual numbers shown in Appendix 3)
55-59 60-64 65-69 70-74 75-79 80-84 85-89 90+0
10
20
30
40
50
60
70
80
90
100
5 year age group
exercise less than once a week
exercise at least once a weekP e r c e n t
Associations between life satisfaction and health outcomes
We identified several health outcomes in Table 1 that are recorded in the survey and may be associated with life satisfaction. Here we explore the cross-sectional associations between these outcomes and life satisfaction. Table 3 shows odds ratios for univariate logistic regression analyses. Life satisfaction was strongly positively associated with having had good general health in the previous 12 months. It was negatively associated with having a limiting long-term illness, having had an accidental fall in the last 12 months, and with being obese.
Table 3. Univariate associations between life satisfaction and selected health outcomes
Association with “Life satisfaction”Variable Number
responded to both questions
Odds ratio (95% confidence
interval)
p-value
General health in past 12 months (1=good/fairly good; 0=not good)
6,959 4.577 (4.04 – 5.18)
0.000
Limiting long-term illness (1=yes; 0=no)
7,007 0.364 (0.33 – 0.41)
0.000
Accidental fall last in last 12 months (1=yes; 0=0)
6,888 0.548 (0.49 – 0.62)
0.000
Overweight or obese (1=yes; 0=no) 6,347 0.906 (0.81 – 1.02)
0.089
Obese (1=yes; 0=no) 6,347 0.668 (0.59 – 0.76)
0.000
Table 4 shows these associations adjusted for age, gender, BME status, sub-locality and deprivation. The results are similar to the univariate analyses shown in Table 3, and slightly attenuated except for the association with limiting long-term illness and
8

accidental fall in the last 12 months, which are stronger after adjustment. While being obese is associated with poorer life satisfaction, there is no evidence of an association between life satisfaction and being ‘overweight or obese’ after adjusting for potential confounders.
Table 4. Adjusted associations* between life satisfaction and health outcomes, adjusted for age, sex, BME status, sub-locality and deprivation
Association with “Life satisfaction”Variable Number of
respondentsOdds ratio p-value
General health in past 12 months (1=good/fairly good; 0=not good)
6,749 4.549 (3.99 – 5.19) 0.000
Limiting long-term illness (1=yes; 0=no)
6,800 0.356 (0.32 – 0.40) 0.000
Accidental fall last in last 12 mths (1=yes; 0=0)
6,685 0.539 (0.48 – 0.61) 0.000
Overweight or obese (1=yes; 0=no) 6,163 0.957 (0.85 – 1.08) 0.465Obese (1=yes; 0=no) 6,163 0.722 (0.63 – 0.83) 0.000*adjusted for age, gender, BME status, sub-locality and deprivation
Describing associations between life satisfaction and potential explanatory factors
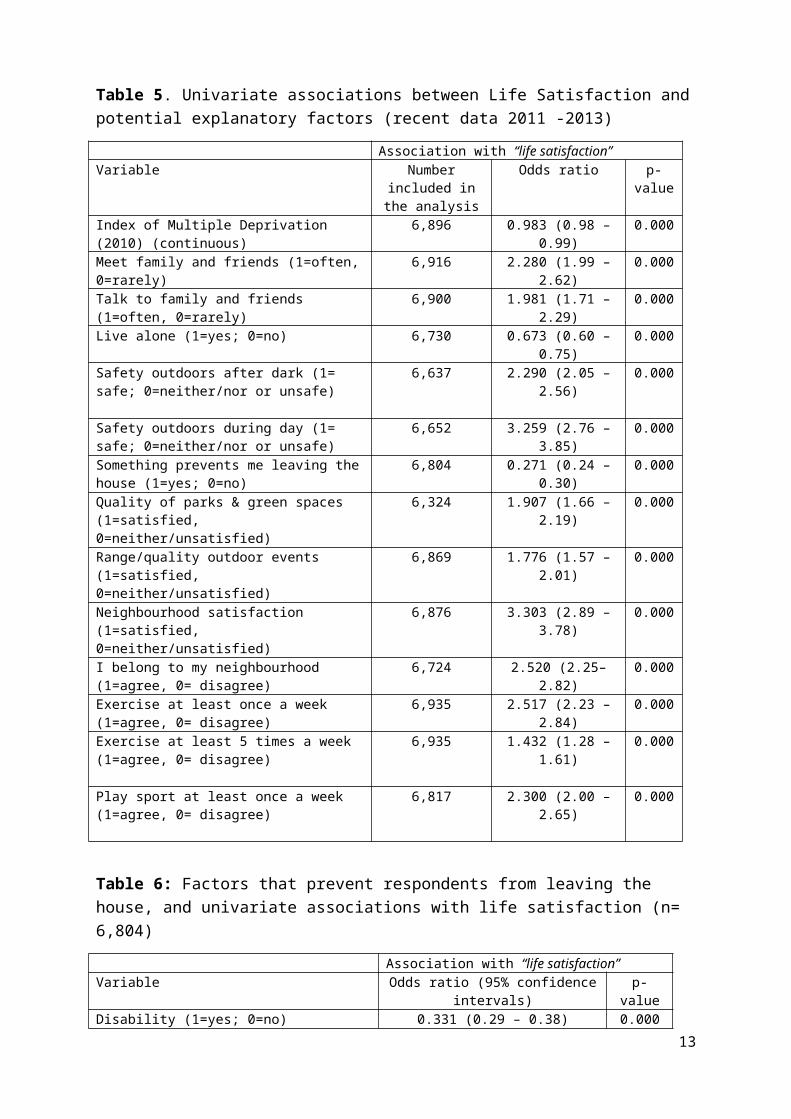
We were also interested in a number of variables that could potentially explain levels of life satisfaction reported by individuals aged 55 and over. Odds ratios for univariate tests of association are shown in Table 5. Of the 14 variables considered, all had a strong association with life satisfaction. As expected there is a negative association between deprivation and life satisfaction. Meeting family and friends has a more important relationship with life satisfaction than talking to family and friends. Reporting that ‘something prevents me leaving that house’ and feeling unsafe outdoors (during the day or after dark) is associated negatively with life satisfaction. Satisfaction with parks, green spaces and with the range/quality of outdoor events were associated positively with life satisfaction, as was a sense of belonging to the neighbourhood. Of all the binary variables considered (i.e. excluding deprivation), the strongest predictor of positive life satisfaction was neighbourhood satisfaction (OR 3.30; 95% CI 2.9-3.8), and the factor most strongly associated with negative life satisfaction was ‘something prevents me leaving the house’ (OR 0.27; 95% CI 0.24-0.30). This analysis confirmed the increase in life satisfaction associated with taking regular exercise and playing sport. Of the three measures of physical activity considered, the association with life satisfaction was strongest for exercising at least once a week (rather than exercising 5 times a week or for playing sport at least once a week).
Respondents who stated that something prevented them leaving the house could select from a number of possible reasons. These are listed in Table 6 below, along with the results of univariate tests of association with life satisfaction. All the barriers to leaving the house listed are associated with substantial decreases in life satisfaction, most notably lack of support and assistance (OR 0.23; 95% CI 0.15-0.36) and poor health (OR 0.29, 95% 0.25-0.34).
9
10

Table 5. Univariate associations between Life Satisfaction and potential explanatory factors (recent data 2011 -2013)
Association with “life satisfaction”Variable Number
included in the analysis
Odds ratio p-value
Index of Multiple Deprivation (2010) (continuous)
6,896 0.983 (0.98 – 0.99)
0.000
Meet family and friends (1=often, 0=rarely)
6,916 2.280 (1.99 – 2.62)
0.000
Talk to family and friends (1=often, 0=rarely)
6,900 1.981 (1.71 – 2.29)
0.000
Live alone (1=yes; 0=no) 6,730 0.673 (0.60 – 0.75)
0.000
Safety outdoors after dark (1= safe; 0=neither/nor or unsafe)
6,637 2.290 (2.05 – 2.56)
0.000
Safety outdoors during day (1= safe; 0=neither/nor or unsafe)
6,652 3.259 (2.76 – 3.85)
0.000
Something prevents me leaving the house (1=yes; 0=no)
6,804 0.271 (0.24 – 0.30)
0.000
Quality of parks & green spaces (1=satisfied, 0=neither/unsatisfied)
6,324 1.907 (1.66 – 2.19)
0.000
Range/quality outdoor events (1=satisfied, 0=neither/unsatisfied)
6,869 1.776 (1.57 – 2.01)
0.000
Neighbourhood satisfaction (1=satisfied, 0=neither/unsatisfied)
6,876 3.303 (2.89 – 3.78)
0.000
I belong to my neighbourhood (1=agree, 0= disagree)
6,724 2.520 (2.25– 2.82)
0.000
Exercise at least once a week (1=agree, 0= disagree)
6,935 2.517 (2.23 – 2.84)
0.000
Exercise at least 5 times a week (1=agree, 0= disagree)
6,935 1.432 (1.28 – 1.61)
0.000
Play sport at least once a week (1=agree, 0= disagree)
6,817 2.300 (2.00 – 2.65)
0.000
Table 6: Factors that prevent respondents from leaving the house, and univariate associations with life satisfaction (n= 6,804)
Association with “life satisfaction”Variable Odds ratio (95% confidence
intervals)p-value
Disability (1=yes; 0=no) 0.331 (0.29 – 0.38) 0.000Poor health (1=yes; 0=no) 0.289 (0.25 – 0.34) 0.000Inaccessible public transport (1=yes; 0=no)
0.469 (0.36 – 0.60) 0.000
Lack of support and assistance (1=yes; 0=no)
0.234 (0.15 – 0.36) 0.000
Financial constraints (1=yes; 0=no) 0.350 (0.28 – 0.44) 0.000Lack of confidence (1=yes; 0=no) 0.331 (0.26 – 0.43) 0.000Fear of crime (1=yes; 0=no) 0.372 (0.30 – 0.47) 0.000Caring responsibilities (1=yes; 0=no) 0.469 (0.37 – 0.60) 0.000
11

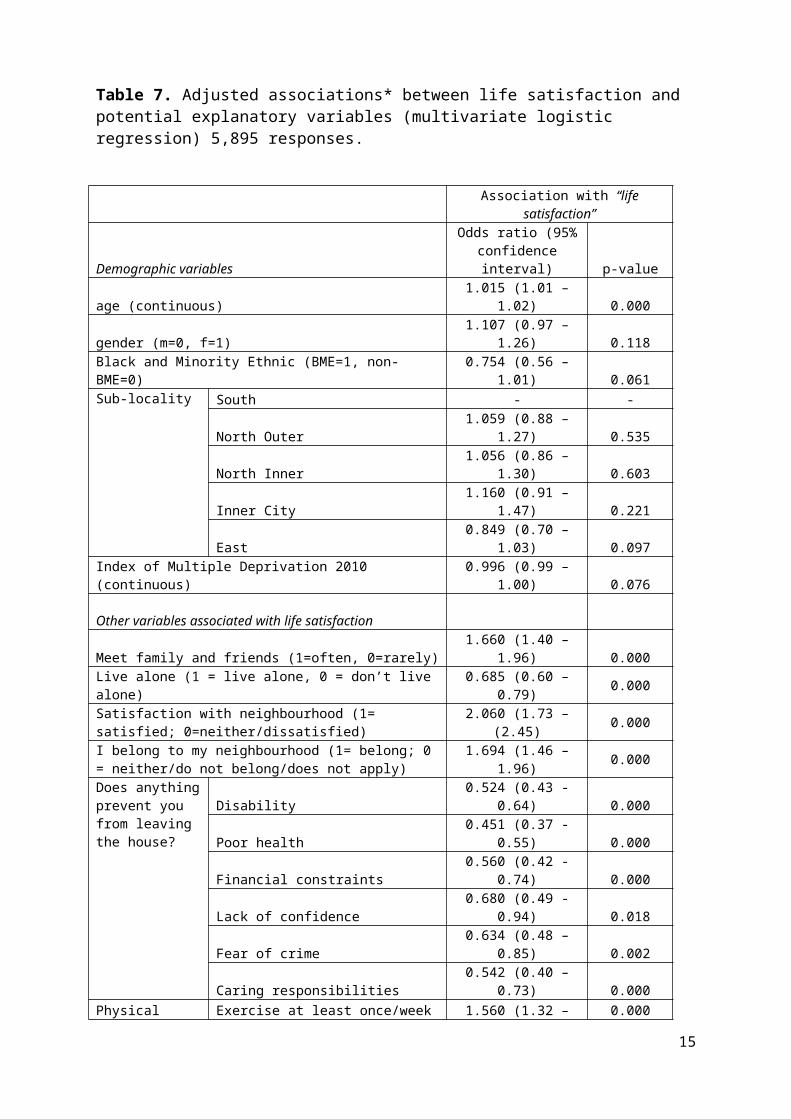
A multivariate analysis of factors in Tables 5 and 6 that may be associated with life satisfaction, along with the demographic variables of age, sex, BME status and sub-locality, was carried out (excluding those factors with greater than 5% missing data). A final model of those variables which remained significant (p<0.1) in the multivariate model is presented in Table 7 (all demographic variables were retained).
For the demographic variables, this analysis confirms that amongst older people in Bristol there is an overall increase in life satisfaction with increasing age. Life satisfaction is higher amongst non-BME than BME groups (though this is only marginally statistically significant). There is no evidence that life satisfaction differs between the South sub-locality (baseline) and the other sub-localities, with the exception of the East sub-locality which appears to have lower life satisfaction (p=0.10). Index of Multiple Deprivation is not significantly associated with life satisfaction. Other factors which are positively associated with life satisfaction are meeting family and friends often, being satisfied with the neighbourhood and reporting a sense of belonging to the neighbourhood, exercising at least once a week and playing sport at least once a week. Factors which are negatively associated with life satisfaction are living alone, and being prevented from leaving the house by disability, poor health, financial constraints, lack of confidence, fear of crime or caring responsibilities.
Table 7. Adjusted associations* between life satisfaction and potential explanatory variables (multivariate logistic regression) 5,895 responses.
Association with “life satisfaction”
Demographic variables
Odds ratio (95% confidence interval) p-value
age (continuous) 1.015 (1.01 – 1.02) 0.000gender (m=0, f=1) 1.107 (0.97 – 1.26) 0.118Black and Minority Ethnic (BME=1, non-BME=0) 0.754 (0.56 – 1.01) 0.061Sub-locality South - -
North Outer 1.059 (0.88 – 1.27) 0.535North Inner 1.056 (0.86 – 1.30) 0.603Inner City 1.160 (0.91 – 1.47) 0.221East 0.849 (0.70 – 1.03) 0.097
Index of Multiple Deprivation 2010 (continuous) 0.996 (0.99 – 1.00) 0.076
Other variables associated with life satisfactionMeet family and friends (1=often, 0=rarely) 1.660 (1.40 – 1.96) 0.000Live alone (1 = live alone, 0 = don’t live alone) 0.685 (0.60 – 0.79) 0.000Satisfaction with neighbourhood (1= satisfied; 2.060 (1.73 – 0.000
12
0=neither/dissatisfied) (2.45)I belong to my neighbourhood (1= belong; 0 = neither/do not belong/does not apply) 1.694 (1.46 – 1.96) 0.000Does anything prevent you from leaving the house?
Disability 0.524 (0.43 - 0.64) 0.000Poor health 0.451 (0.37 - 0.55) 0.000Financial constraints 0.560 (0.42 -0.74) 0.000Lack of confidence 0.680 (0.49 -0.94) 0.018Fear of crime 0.634 (0.48 – 0.85) 0.002Caring responsibilities 0.542 (0.40 – 0.73) 0.000
Physical activity
Exercise at least once/week 1.560 (1.32 – 1.84) 0.000Play sport at least once/week 1.470 (1.24 – 1.74) 0.000
*adjusted for age, gender, BME status, sub-locality, deprivation, and other variables in the table
Discussion
We have carried out a preliminary analysis of life satisfaction amongst older people in Bristol, based on the Bristol City council Quality of Life survey. We have described life satisfaction for different groups, according to age group, gender, ethnicity and sub-locality within the city.
Life satisfaction increases steadily between the ages of 55-59 and 75-79 years for women and 80-84 years for men, with lower levels in the older age groups. It seems unlikely that men of 80-84 and women of 75-79 have the best quality of life compared with other age groups, but they are most satisfied with their life, and this may be explained as a cohort effect. These people were young children during the 2nd World War, and may consequently have a different perspective on life, with different expectations to younger generations. Other studies have reported a positive association between life satisfaction and age7, and evidence of associations between childhood exposures and life satisfaction later in life7,8.
In this sample, women tend to report higher levels of life satisfaction than men, although the result is not statistically significant. Other studies have found no difference in life satisfaction between men and women at age 60–64 years9. We identified inequalities in life satisfaction between sub-localities of Bristol and, within sub-localities, between non-BME and BME groups, although these results did not reach conventional levels of statistical significance.
It is interesting that IMD scores are not significantly associated with life satisfaction in the multivariate models. This may partly be explained by the fact that they are based
7 Kendig H1, Loh V2, O'Loughlin K3, Byles J4, Nazroo JY5.2016. Pathways to Well-Being in Later Life: Socioeconomic and Health Determinants Across the Life Course of Australian Baby Boomers. J Popul Ageing. 2016;9:49-67 8 Stafford M1, Gale CR2, Mishra G3, Richards M1, Black S1, Kuh DL1, 2015. Childhood Environment and Mental Wellbeing at Age 60-64 Years: Prospective Evidence from the MRC National Survey of Health and Development. PLoS One, 10(6):e01266839 Lacey R, Stafford M, Sacker A, McMunn A, 2016. Work-Family Life Courses and Subjective Wellbeing in the MRC National Survey of Health and Development (the 1946 British birth cohort study), J Popul Ageing, 9, pp 69-89
13

on postcodes rather than households, but it may also be that the other variables included are more important in explaining life satisfaction than material deprivation. For example, the importance of the social environment in determining self-reported life satisfaction is clear – there are strong protective effects for frequency of meeting family and friends and being satisfied with, and having a sense of belonging to, the neighbourhood. Living alone and feeling prevented from leaving the house were associated with lower life satisfaction. The variables considered here as potential explanatory factors for life satisfaction (deprivation, social interaction, barriers and enablers to getting out and about, and connectedness with neighbourhood) were generally found to be more strongly related to life satisfaction than to physical activity in the earlier report1.
Doing regular exercise and playing sport have a positive association with life satisfaction, but we have found that exercising at least once a week is sufficient to improve life satisfaction. This is an important finding for planning interventions and suggests that where we can make a difference is in helping people achieve physical activity at least once per week.
The strong associations noted here between both physical health and obesity and life satisfaction fit with earlier research. For example, it was found in a large population-based cohort of women aged 57-66 years that morbidity has a strong inverse association with life satisfaction10. There was also some evidence from this study that overweight and high BMI were associated with lower levels of life satisfaction. Although it seems likely that the observed associations are multi-directional (i.e. increased life satisfaction improves physical health and vice versa), potential confounders such as physical activity could partially explain these associations, and further research is needed to understand the complex relationship between physical activity, physical health and life satisfaction.
Future Analyses
A further report will describe trends in life satisfaction from 2005 to 2015. The increase in sample size from pooling data across this period will also allow a more detailed breakdown of life satisfaction by socio-demographic subgroups (i.e. the 14 neighbourhood areas used by Local Authorities, quintiles of deprivation). It may also be possible to repeat the analyses presented here for subgroups, in other words to explore the most important explanatory factors associated with life satisfaction for different sections of the older population of Bristol (e.g. by gender and ethnicity), and also to examine the associations with physical health separately by subgroup.
10 Lukkala PS, Honkanen RJ, Rauma PH, Williams LJ, Quirk SE, Kröger H, Koivumaa-Honkanen H., 2016. Life Satisfaction and Morbidity among Postmenopausal Women. PLoS One. 2;11(1):e0147521
14
Appendix 1: Maps showing sub-localities and wards of Bristol, and Index of Multiple Deprivation (IMD) scores across the city
IMD 2010 scores by lower layer super output area of Bristol, Office of National Statistics
Clinical Commissioning Group (CCG) sub-localities and constituent wards
Appendix 2: Number of responses by age group (55+ years) and gender (2011-2013)
Age Male Female Total55 – 59 574 721 1,29560 – 64 633 798 1,43165 – 69 646 692 1,33870 – 74 482 540 1,02275 – 79 386 455 84180 – 84 321 348 66985 – 89 154 173 32790 - 94 40 69 10995 - 99 6 14 20100+ 1 0 1Total 3,243 3,810 7,053
15

Appendix 3: Survey questions (Bristol City Council Quality of Life Survey)
Question reference Original questionSatisfaction with neighbourhood How satisfied are you with your local area as a place
to live? (tick one box) (very satisfied; fairly satisfied; neither satisfied nor dissatisfied; fairly dissatisfied; very dissatisfied)
Safety outdoors after darkSafety outdoors during day
How safe or unsafe do you feel in your neighbourhood: (please tick one box in each case)
a) Outdoors after dark (very safe; fairly safe; neither safe nor unsafe; fairly unsafe; very unsafe; does not apply)
b) Outdoors during the day (very safe; fairly safe; neither safe nor unsafe; fairly unsafe; very unsafe; does not apply)
Meet family and friends How often do you meet friends and family? (tick one box) (most days; every week; every month; a few times a year; never)
Talk to family and friends How often do you talk to, text or email friends and family (tick one box) (most days; every week; every month; a few times a year; never)
I belong to my neighbourhood Do you agree or disagree with the following statements? (please tick one box in each case)
a) “I feel I belong to my neighbourhood” (strongly agree; tend to agree; neither/nor; disagree; strongly disagree)
Quality of parks and green spaces How satisfied or dissatisfied are you with the following? (please tick one box in each case)
a) Quality of parks and green spaces (very satisfied; fairly satisfied; neither/ nor; fairly dissatisfied; very dissatisfied; does not apply)
Exercise at least 5 times a weekExercise at least once per week
How often do you take moderate exercise? (e.g. brisk walk, leisure activity, heavy gardening, heavy housework or DIY) (please tick one box) (5 times a week or more; 3-4 times a week; 1-2 times a week; about once a month; within the last 6 months; over a year ago/never; never, due to health reasons)
Sport at least once per week How often do you take part in active sport (when you are active for 30 minutes or more)? (e.g. football, running, swimming) (please tick one box) (5 times a week or more; 3-4 times a week; 1-2 times a week; about once a month; within the last 6 months; over a year ago/never; never, due to health reasons)
Life Satisfaction
Life Satisfaction Scale (1-10 2006-2012, 0-10 2013)
Happiness (2006-2012 only. Not included 2013)
Overall, how satisfied are you with your life nowadays? (very low, low, medium or high)Overall, how satisfied are you with your life nowadays? (scale from 0(2013) 1(2006-2012) very low to 10 very high)Overall, how happy are you nowadays?) (please tick one box) (very happy; quite happy; not very happy; not at all happy)
Something prevents me from leaving the house (the following can be specified) Fear of crime Lack of confidence Inaccessible public transport Lack of support and assistance Financial circumstances Disability Poor health Caring responsibilities
Does anything prevent you from leaving the home when you want to or need to? (please tick any that apply) (nothing/never; fear of crime; lack of confidence; inaccessible public transport; lack of support and assistance; financial circumstances; disability; poor health; caring responsibilities; fear of losing parking space)
16
Range/quality outdoor events How satisfied are you with the range and quality of outdoor events in Bristol? (e.g. Bristol Harbour Festival, Bristol Balloon Fiesta, Bristol’s Biggest Bike Ride, and events in local parks) (tick one box only) (very satisfied; fairly satisfied; neither/ nor; fairly dissatisfied; very dissatisfied; does not apply)
Live alone Including yourself how many people live in your home? (if you live by yourself write 1 in the box)
General health in past 12 months In the last 12 months, how would you say your health has been on the whole? (please tick one box) (good; fairly good; not good)
Limiting long-term illness Do you have any long-term illness, health problem or disability which limits your daily activities or work you can do? (include problems which are due to old age) (yes; no)
Accidental fall last in last 12 months Have you accidentally fallen in the last 12 months? (yes; no)
Overweight or obese Weight is a current health concern. (if you are able to weigh yourself or measure your height, please do so wearing light clothing and without shoes)What is your weight (you can use stone & pounds or kilograms)What is your height (you can use feet and inches or meters)
Sex Are you? (male; female)
Age What age are you?
BME (Black or Ethnic Minority) How would you describe your ethnic origin? (please tick 1 box) (white or white British; black or black British; Asian or Asian British; mixed background (please describe); other ethnic group (please describe))
17
Appendix 4: Tables corresponding to figures
Figure 1. Number (%) of respondents who reported medium/high life satisfaction rating, by age group and gender 2011-2013
Males Females
Age band n / N% positive life satisfaction n / N
% positive life satisfaction
55 – 59 385 / 572 67.31 497 / 719 69.1260 – 64 445 / 633 70.30 597 / 796 75.0065 – 69 484 / 642 75.39 522 / 690 75.6570 – 74 355 / 481 73.80 405 / 536 75.5675 – 79 288 / 383 75.20 341 / 449 75.9580 – 84 239 / 315 75.87 252 / 343 73.4785 – 89 100 / 150 66.67 111 / 167 66.4790 + 29 / 45 64.44 53 / 81 65.43
Total2,325 / 3,221 72.18 2,778 / 3,781 73.47
Figure 2. Number (%) of respondents who reported medium/high life satisfaction rating, by sub-locality and ethnicity 2011-2013
BME Non-BME
Sub-locality n / N% positive life satisfaction n / N
% positive life satisfaction
Bristol South 26 / 50 52.00 1,817 / 2,469 72.54Bristol N & W (Outer) 26 / 43 60.47 878 / 1,199 71.06Bristol N & W (Inner) 37 / 48 77.08 1,268 / 1,515 81.25Inner City & E (Inner) 81 / 132 61.36 477 / 574 68.99Inner City & E (East) 47 / 70 67.14 639 / 866 68.36Total 217 / 343 63.27 4,862 / 6,623 73.41
Figure 3. Number (%) of respondents who reported medium/high life satisfaction according to different measures of physical activity 2011-2013Physical Activity n/N % positive life
satisfactionExercise: At least 1 x week Less than 1 x week
4,243 / 5,506 817 / 1,429
77.0657.17
Exercise: At least 5 x week Less than 5 x week
1,816 / 2,3433,244 / 4,592
77.5170.64
Play sport: At least 1 x week Less than 1 x week
1,445 / 1,7273,512 / 5,090
83.6769.00
Figure 4. Number (%) of respondents who reported medium/high life satisfaction, by age group and physical activity (exercise at least once per week) 2011-2013
Exercise 1+ x week Exercise < 1 x week
Age band n / N% positive life satisfaction n / N
% positive life satisfaction
55 – 59 767 / 1,086 70.63 114 / 207 55.0760 – 64 936 / 1,235 75.79 100 / 187 53.4865 – 69 904 / 1,143 79.09 100 / 190 52.6370 – 74 642 / 824 77.91 110 / 185 59.4675 – 79 486 / 603 80.60 140 / 229 61.1480 – 84 336 / 424 79.25 139 / 226 61.5085 – 89 135 / 172 78.49 71 / 146 48.6390 + 37 / 47 78.72 43 / 79 54.43
Total4,243 / 5,534 76.67 817 / 1,449 56.38
18