life on the margins: the inequality of food and nutrition security poverty, vulnerability and health...
TRANSCRIPT
Life on the margins: the inequality of food and nutrition security
POVERTY, VULNERABILITY AND HEALTH INEQUALITIES
PowerPoint presentation by Médecins Sans Frontières / Doctors Without
Borders (MSF) UKSchools Team: Mary Doherty and Severa von Wentzel
January 2014
Left behind, left out
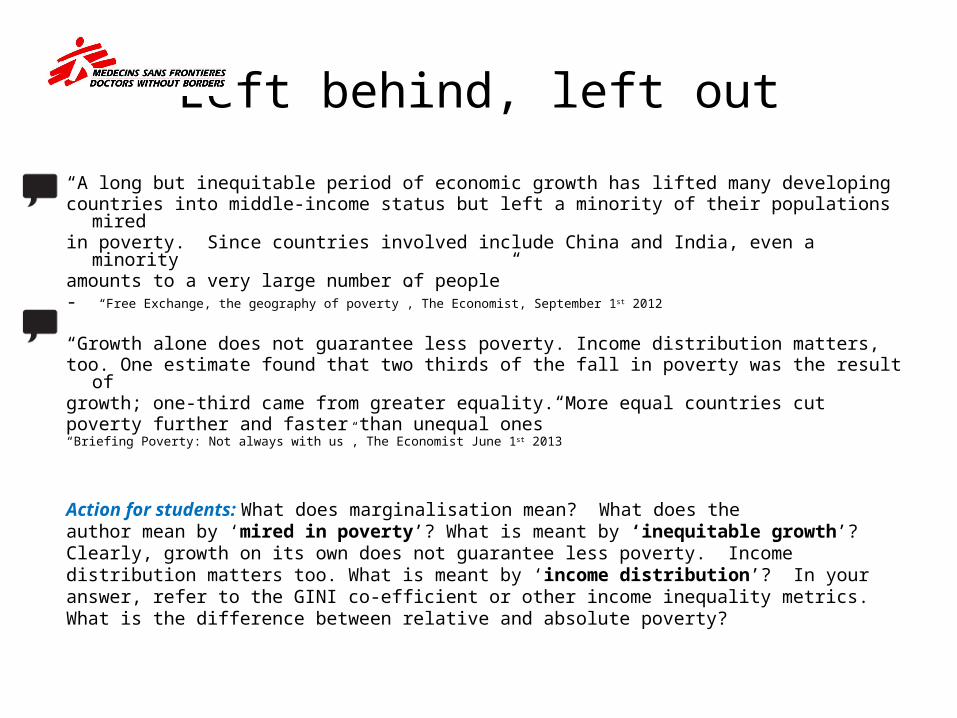
“A long but inequitable period of economic growth has lifted many developingcountries into middle-income status but left a minority of their populations
miredin poverty. Since countries involved include China and India, even a minorityamounts to a very large number of people” - “Free Exchange, the geography of poverty”, The Economist, September 1st 2012
“Growth alone does not guarantee less poverty. Income distribution matters,too. One estimate found that two thirds of the fall in poverty was the result ofgrowth; one-third came from greater equality. More equal countries cut poverty further and faster than unequal ones” “Briefing Poverty: Not always with us”, The Economist June 1st 2013
Action for students: What does marginalisation mean? What does the author mean by ‘mired in poverty’? What is meant by ‘inequitable growth’? Clearly, growth on its own does not guarantee less poverty. Income distribution matters too. What is meant by ‘income distribution’? In your answer, refer to the GINI co-efficient or other income inequality metrics. What is the difference between relative and absolute poverty?

Life on the marginsOverview slide
Why do so many people live on the edge of survival whilst there is enough food globally? Growing inequality poses one of the biggest social, economic and political challenges. Today’s disparities and their dangerous likely trajectory reduce the pace of human development most markedly for education and health.
Why does some form of hunger and malnutrition exist in every country? Hunger and obesity, which can both be forms of malnutrition*, are complex conditions and a serious worldwide problem. The deadly cycle of poverty, malnutrition and disease is also largely preventable.• Malnutrition is directly affected by physical factors such as low nutrition.• It is indirectly affected by social inequality, poverty, education, social
status of women, food systems, climate change and the resilience of vulnerable populations to stressors such as drought, floods, price hikes and conflict.•Malnutrition: An abnormal physiological condition caused by inadequate, unbalanced or excessive consumption of
macronutrients and/or micronutrients.
Source: The Lancet “The complex challenge of hunger” http://www.thelancet.com/journals/lancet/article/PIIS0140-6736%2813%2962198-4/fulltext
Left out, left behind
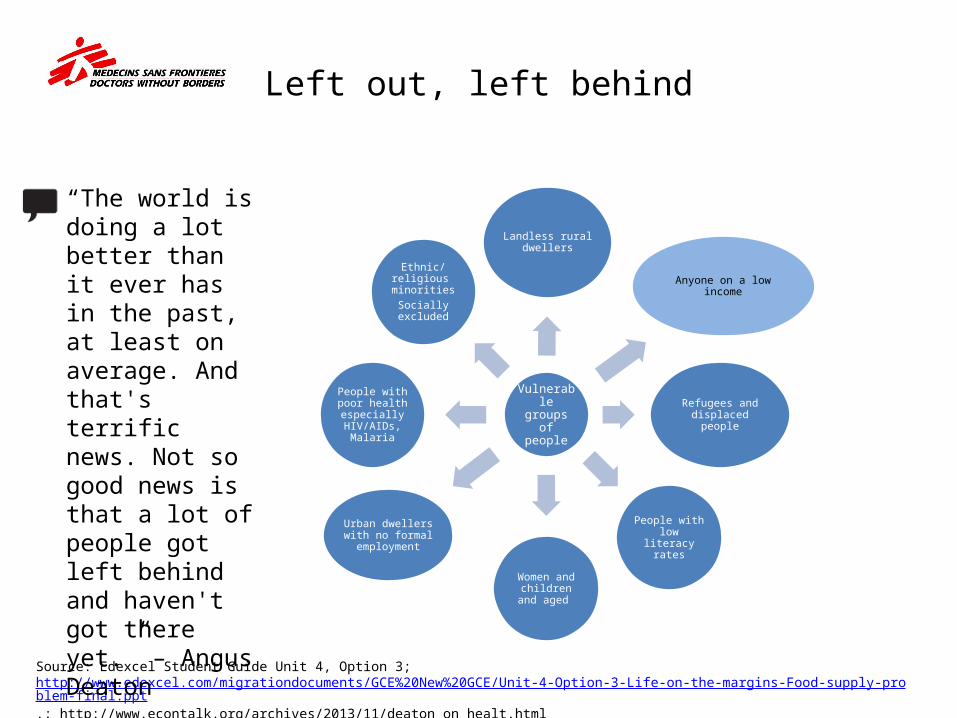
Vulnerable groups of people
Landless rural dwellers
Anyone on a low income
Refugees and displaced people
People with low literacy rates
Women and children and aged
Urban dwellers with no formal employment
People with poor health especially HIV/AIDs,
Malaria
Ethnic/religious minorities
Socially excluded
Source: Edexcel Student Guide Unit 4, Option 3; http://www.edexcel.com/migrationdocuments/GCE%20New%20GCE/Unit-4-Option-3-Life-on-the-margins-Food-supply-problem-final.ppt.; http://www.econtalk.org/archives/2013/11/deaton_on_healt.html
“The world is doing a lot better than it ever has in the past, at least on average. And that's terrific news. Not so good news is that a lot of people got left behind and haven't got there yet.” – Angus Deaton
Factors of peopleon the margins
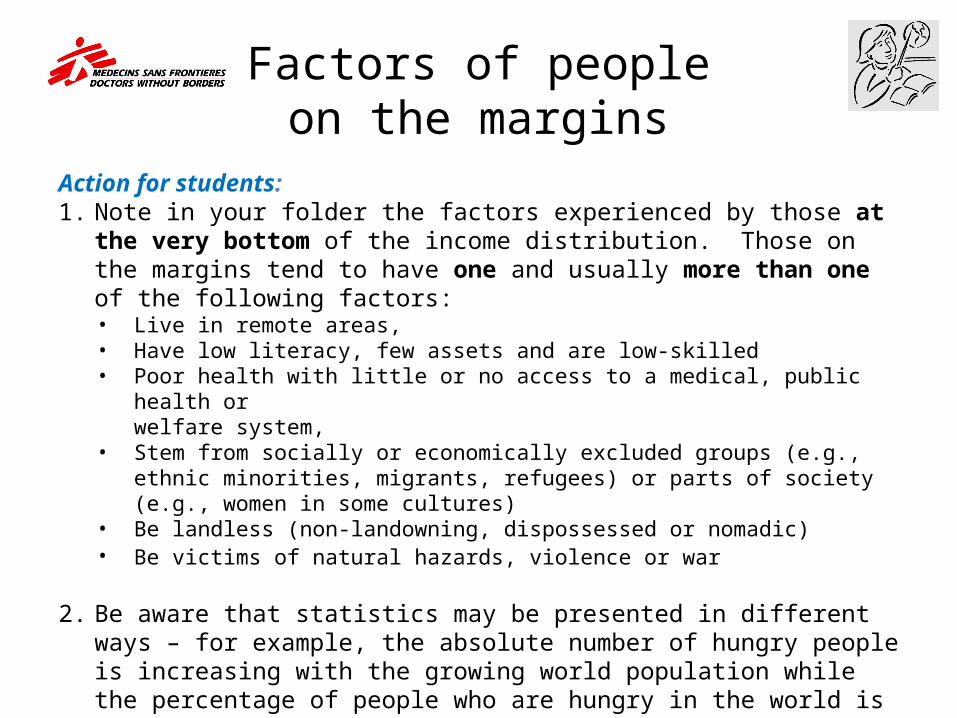
Action for students: 1. Note in your folder the factors experienced by those at the very
bottom of the income distribution. Those on the margins tend to have one and usually more than one of the following factors:• Live in remote areas, • Have low literacy, few assets and are low-skilled • Poor health with little or no access to a medical, public health or
welfare system,• Stem from socially or economically excluded groups (e.g., ethnic
minorities, migrants, refugees) or parts of society (e.g., women in some cultures)
• Be landless (non-landowning, dispossessed or nomadic)• Be victims of natural hazards, violence or war
2. Be aware that statistics may be presented in different ways – for example, the absolute number of hungry people is increasing with the growing world population while the percentage of people who are hungry in the world is declining.
.

VulnerabilityVulnerability can be variable within a country, within communities and even within households. It is not defined by income or wealth alone, but the key factor in the food insecurity cycle is wealth. There is a range of people more vulnerable to food insecurity.
Source: http://siteresources.worldbank.org/EXTPREMNET/Resources/EP125.pdf
Well-being:Health, wealth and inequality
Well-being is not defined merely in terms of material living standards, which is one of its parts. It is judged by looking at the whole, not one or more of its parts. Above and beyond an average, inequality must be taken into account to judge well-being.
The concept includes:•Income and wealth
• Physical and psychological state (health and happiness). These are about how people are when they are alive, not just living and dying.•Education •Ability to participate in society. Action for students: Watch the Financial Times interview with
Angus Deaton on health, wealth and inequality. What has been the trend in the last decades and how is progress measured? http://press.princeton.edu/titles/10054.html

Inequality by regionfor health, education and income
Source: 2013 Human Development Report http://hdr.undp.org/en/reports/global/hdr2013/; Joseph Rowntree Foundation “Does income inequality cause health and social problems?” http://www.jrf.org.uk/sites/files/jrf/inequality-income-social-problems-summary.pdf
Income inequality is correlated with health / social problems
Individual income / circumstances, background (culture, ethnicity and history) and welfare state institutions and social policies can also be correlated with well-being.
Note to students: correlation does not equal causation (producing an effect). A correlation (mutual relationship) between variables does not mean that one causes the other(s).
K

The causes of health inequalities
Source: http://www.nao.org.uk/wp-content/uploads/2010/07/1011186es.pdf; http://www.economist.com/news/business-books-quarterly/21587755-measuring-fairness-sickness-and-health
More inroads are being made into global inequality, if you take improvements in health into account. The gap between life expectancy between countries has shrunk since the second world war.

Inequality and poverty globally and locally
• One of the world’s great challenges today, poverty and inequality (income, gender, etc.) affect the well-being of populations or parts of populations.
• A triad that holds true for all populations, Poverty reduces Dietary Quality/Adequacy and lowers Health.
• The development gap describes the social and economic disparity between the wealthy and the poor between and within countries
• The global development discourse has moved from the Brandt Line and indicators on income (e.g., GNI, GDP, PPP) to – Social indicators, deprivation, adult literacy, access to fresh water.– Qualitative indicators dealing with vulnerability, Inequality,
empowerment and human rights.BUT the global measures of inequality and poverty are fraught with difficulties.
• In terms of inequality, the development discourse refers to gender and malnutrition mostly in LEDCs countries.
• Adverse political and social policies, instability and conflict are at the root causes countries of countries on the wrong top ten (e.g, DRC, North Korea).

Income groups
Source: http://passthrough.fw-notify.net/download/253468/http://www.grida.no/files/publications/FoodCrisis_lores.pdf
Inequality
Inequality can emerge as a consequence of progress and affect progress. Inequality also has its own effects.
Modern inequality was brought about by modern economic growth. North-West Europe and North America started experiencing sustained economic growth about 250 years ago and pulled away from the rest of the world. This ‘Great Divergence’ set the stage for the persistent gaps, the hugely inequalities of the present day. The starkest evidence: around a billion people still have low life expectancy and live in abject poverty.
Overall, the trend is encouraging, but the list of countries falling behind is getting longer. Source: Deaton, Angus, The Great Escape: Health, Wealth and the Origins of Inequality, Princeton University Press, 2013.
Comparing livingstandards
How do we compare who is poor, to what extent and who is not? Does being poor mean being hungry?
The rhetorical link between poverty and hunger remains firmly established even though the only the poorest in poor countries actually spend most of their money on food. Economic growth means that: • People become better-off, and even while they are still poor by
most standards, they spend a smaller fraction of their budgets on food.
• Economic growth makes it increasingly difficult to think of poverty entirelyin terms of food.
How to compare living standards around the world and count the number of poor people on the basis of those comparisons? Source: Deaton, Angus, The Great Escape: Health, Wealth and the Origins of Inequality, Princeton University Press, 2013.;; http://siteresources.worldbank.org/EXTPREMNET/Resources/EP125.pdf; http://www.rrojasdatabank.info/deaton_povertymeasured.pdf

Comparing income between countries
Comparisons between countries that are broadly similar such as USA
and Canada or OECD countries can stand on relatively firm ground. PPP comparisons made between broadly similar regions or countries can be useful.
It is very difficult to compare real income between countries, particularly where countries have markedly different relative prices and economic structures.
Though these measures will be contested and debated, they can serve as the basis for global and national policy to allocate funds to the poor. They are adjusted from time to time.

Measures of income:Purchasing power parity
In order to measure poverty, we need to measure income. Doing so across countries is difficult. Using foreign exchange rate of the local currency is basically meaningless.• PPP Purchasing power parity helps compare living
standards across the world. It is used instead of the official exchange rate to calculate the poverty line.
• Simply put, PPP can better account for how price levels vary across settings. For example, a price level for a bundle of goods will cost only 40% of what it would cost in the USA, so the PPP rate will be lower than the foreign exchange rate in India.
• Teams of international researchers and statisticians collect and average out data on the prices of comparable items in different countries to determine price levels around the world. The measure is far from perfect, because there are no market prices for a substantial share of what people spend.
Source: Deaton, Angus, The Great Escape: Health, Wealth and the Origins of Inequality, Princeton University Press, 2013.

Measures of income:poverty line
• Poverty line – is about defining a minimal standard of living, especially having enough to eat. Choosing a poverty line is fraught with difficulties and is almost always controversial. When states recognise poverty, they may also have to accept responsibility to offset its worst impacts by distributing funds to the poor.
• Originally conceived as calorie-based poverty lines in many countries around the world. The association with food also gives more political support to anti-poverty programmes. Lines have tended to be updated for inflation and changes in prices, so have usually been held constant in real terms.
• $ 1.25 / day – originally $1 / day, the World Bank Global Poverty Count number of people in the world who live on less than a dollar a day, where the international differences in prices are adjusted using purchasing power parity exchange. It gained currency with the World Development Report 1990 and was incorporated into the Millennium Development Goals.
Source: Deaton, Angus, The Great Escape: Health, Wealth and the Origins of Inequality, Princeton University Press, 2013.
Poverty
Source: Deaton, Angus, The Great Escape: Health, Wealth and the Origins of Inequality, Princeton University Press, 2013.;; http://siteresources.worldbank.org/EXTPREMNET/Resources/EP125.pdf
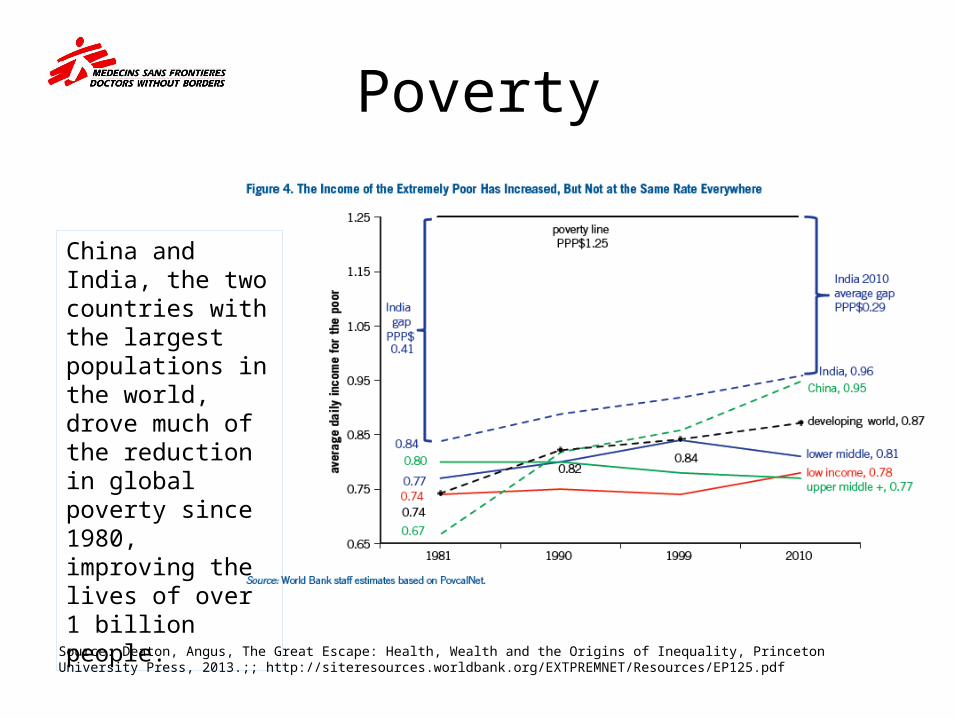
China and India, the two countries with the largest populations in the world, drove much of the reduction in global poverty since 1980, improving the lives of over 1 billion people.

Poverty line
Although the trend has gone down, poverty reduction measures have tended to help people living close to the poverty line, not the very poorest persons living on the margins.
Graphs: http://siteresources.worldbank.org/EXTPREMNET/Resources/EP125.pdf

Global inequality cartogram
Source: http://www.worldmapper.org/display.php?selected=173
* A cartogram depicts values by areas while preserving the aesthetics of relative geographic position in striking images depicting global inequalities.
Equal area cartogram*

GINI co-efficientAction for students: What does the GINI coefficient measure?
Explain the global index measure. Explain the key for this map of income distribution and give examples of most, medium and least equal
countries.
K

North-South Divisionand the “Rise of the South”
Action for students: 1. What are the strengths and weaknesses of the Brandt line as an indicator? 2. Read Hans Rosling’s Debunking myths about the “third world”
http://www.gapminder.org/videos/hans-rosling-ted-2006-debunking-myths-about-the-third-world/Source: 2013 Human Development Report http://hdr.undp.org/en/reports/global/hdr2013/
Image success stories: http://www.economist.com/news/international/21573613-growth-national-income-poor-predictor-welfare-not-bread-alone
In the past the world was divided into North and South, also called the Brandt line after an 1980s report on the rich North and the poor South, the UNDP now reports on the “Rise of the South” with significant advances in countries like Brazil, China, India, Indonesia, Mexico, South Africa and Turkey. (See http://hdr.undp.org/en/reports/global/hdr2013/.)

Southern success stories
Source: 2013 Human Development Report http://hdr.undp.org/en/reports/global/hdr2013/

Poverty line in the UK
Source: http://www.trusselltrust.org/foodbank-projects
Action for students: 1. Find out what is meant by the poverty line. Why is it useful?
Where is it set? Who sets it? Is it relative in relation to different countries?
2. Is the experience of poverty the same in the UK and the developing world? Note some of the similarities and differences relating back to the factors. Start your research with the Trussell Trust.

English North-South divide?
K
Crown copyright and database rights 2012 Ordnance Survey 100020290 Source: http://www.noo.org.uk/uploads/doc/vid_16966_AdultSocioeconSep2012.pdf
Action for students: Read The Guardian article on “Deprivation mapped: how you show the poorest (and richest) places in England” including an animation on the English indices of deprivation. How and why do you map micro-level deprivation?What are the limitations, inaccuracies of scale (e.g., South Africa – Lesotho) on maps?• http://www.theguardian.com/news/
datablog/2011/mar/31/deprivation-map-indices-multiple

Living on the margins in the UK
http://www.poverty.org.uk/09/bh.png
Being left behind is not only confined to countries with low income as indicated by the graphs on growing income inequality and the poorest tenth in the UK, for example.
Graphs: http://www.poverty.org.uk/09/bh.png

Poorest closer to home
3.8 million children estimated to be living below the poverty line
Image of report: http://www.cpag.org.uk/sites/default/files/Going%20Hungry%20young%20peoples%20experiences%20of%20Free%20School%20Meals.pdfImage and graph from “Measuring Poverty: The end of the line”, The Economist November 17th 2012,http://www.economist.com/news/britain/21566691-government-sets-out-redefine-what-it-means-be-poor-end-lineSource: http://news.bbc.co.uk/1/hi/health/7879201.stm; Report: http://www.cpag.org.uk/sites/default/files/Going%20Hungry%20young%20peoples%20experiences%20of%20Free%20School%20Meals.pdf
“The long economic slump and the rising price of food and energy have already made life harder for the very poorest. At a church in Brixton, South London, desperate flock wait for parcels of donated food....In the past, children collected food for the elderly, remarks the vicar. Now they collect it for their classmates”
3 million people estimated to be suffering from malnutrition in the UK3.8 million children in the UK currently living below the poverty line.Nutritious food perceived as too expensive and out of reach
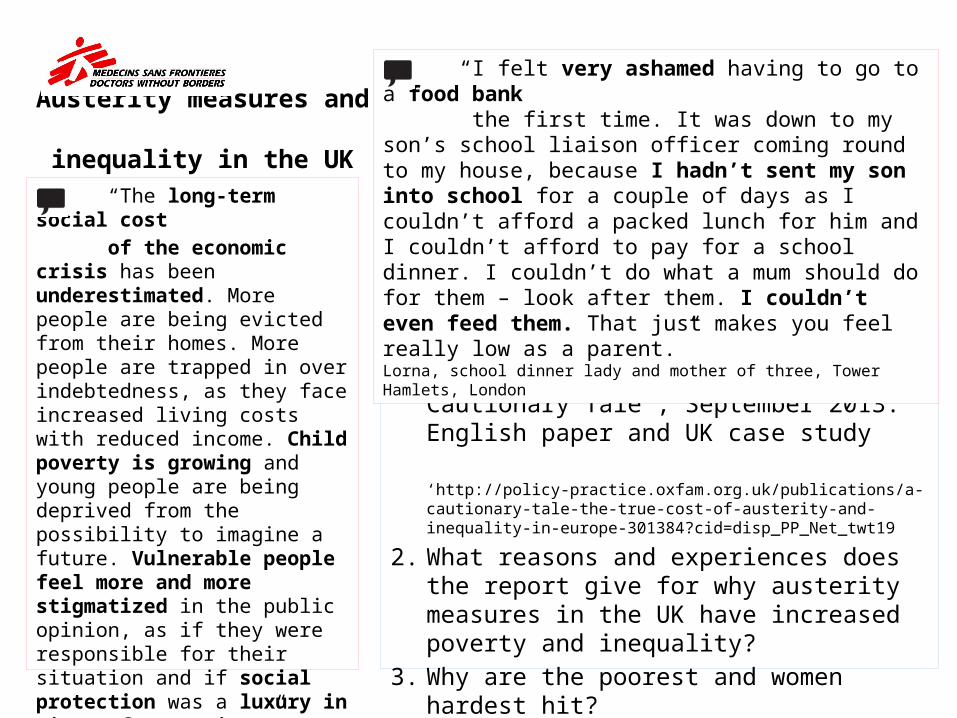
Austerity measures and
inequality in the UK
Action for students: 1. Read Oxfam’s Briefing Paper “A
Cautionary Tale”, September 2013: English paper and UK case study ‘http://policy-practice.oxfam.org.uk/publications/a-cautionary-tale-the-true-cost-of-austerity-and-inequality-in-europe-301384?cid=disp_PP_Net_twt19
2. What reasons and experiences does the report give for why austerity measures in the UK have increased poverty and inequality?
3. Why are the poorest and women hardest hit?
“The long-term social cost of the economic crisis has been underestimated. More people are being evicted from their homes. More people are trapped in over indebtedness, as they face increased living costs with reduced income. Child poverty is growing and young people are being deprived from the possibility to imagine a future. Vulnerable people feel more and more stigmatized in the public opinion, as if they were responsible for their situation and if social protection was a luxury in times of austerity.”European Anti-Poverty Network, August 2013, as quoted in Oxfam’s ‘ A Cautionary Tale’
“I felt very ashamed having to go to a food bank the first time. It was down to my son’s school liaison officer coming round to my house, because I hadn’t sent my son into school for a couple of days as I couldn’t afford a packed lunch for him and I couldn’t afford to pay for a school dinner. I couldn’t do what a mum should do for them – look after them. I couldn’t even feed them. That just makes you feel really low as a parent.” Lorna, school dinner lady and mother of three, Tower Hamlets, London

LIFE ON THE MARGINS:URBAN – RURAL LINKS
28
Rural – urban food and nutrition (in)security
• There is a myth that food insecurity is a rural problem that will be resolved through technical innovation among smallholders. Actually, rapid urban growth in developing countries and informal settlement expansion have been correlated with a significant rise in undernutrition in urban populations.
• Rural and urban areas also tend to be perceived as separate spheres with a deep divide between them.. Actually, it’s a two-way flow where rural-urban contexts and households are highly interconnected. People, goods and money move in and out along a spectrum. Financial remittances can play an important part in rural development. Rural households buy some or most of their food with cash from family members who have moved within the country or across borders to earn income
• Migration and urbanisation can have ambiguous consequences for nutrition security, as they can help poverty alleviation, but also obstruct it.
• In town and village, increased production rather than more equal access to food is often assumed to be the answer to food security; actually, access to food – notably, lacking means to purchase food buy it - can be a greater issue. Urban households are more dependent on food purchase.
Source: http://www.cigionline.org/articles/2012/07/migration-must-be-food-security-agenda

Urban terms
• “Megacities: A city with a population of 10 million or more residents – largest are Delhi, Shanghai, Mexico City, New York and Tokyo with over 20 million.
• Metropolitan area: A large concentration of population, usually an area with 100,000 or more people. The area typically includes an important city with 50,000 or more inhabitants and the administrative areas bordering the city that are socially and economically integrated with it.
• Urban: Countries differ in the way they classify population as "urban" or "rural." Typically, a community or settlement with a population of 2,000 or more is considered urban. A listing of country definitions is published annually in the United Nations Demographic Yearbook.
• Urban agglomeration: Refers to the population contained within the contours of a contiguous territory inhabited at urban density levels without regard to administrative boundaries. It usually incorporates the population in a city or town plus that in the sub-urban areas lying outside of but being adjacent to the city boundaries.
• Urbanization: Growth in the proportion of a population living in urban areas.” Peri-urban are located in-between consolidated urban and rural regions and have also been traditionally important in food supply. Outskirts of large cities (e.g. Beijing) are under constant threat from urban sprawl. Peri-urban areas tend to be defined by mixed land use, poorer urban infrastructure and lower demographic density.Source: Definitions taken verbatim from http://www.prb.org/Educators/TeachersGuides/HumanPopulation/Urbanization.aspx

Place of residence
Urban versus rural• Usually has a modern health care system, facilitating public health
interventions (vaccinations, control of epidemic diseases, mother-to-child programmes)
• Usually more advantageous environmental conditions – better electricity and water supply.
• Road and rail links usually ensure more constant and abundant food supply
• But population explosion not matched by increase in services in recent decades and access to services is uneven (proximity ≠ access)
• Traditional and cultural norms changed by more wide spread schooling, greater access to information and ethnic melting pot
Recent studies indicate that socio-economic factors determine health status (indicator: child mortality) more than residence per se, so differences at the household level have a greater effect than at the community level.
Source: Lalou, Richard and Thomas LeGrand Child mortality in the urban and rural Sahel http://webcache.googleusercontent.com/search?q=cache:E-GASt37RWQJ:www.researchgate.net/publication/236495789_Child_Mortality_in_the_Urban_and_Rural_Sahel/file/9c960517fb06a8fd4f.pdf+sahel+rural+urban+health+differences&cd=4&hl=en&ct=clnk&gl=ukhttp://www.ons.gov.uk/ons/rel/hsq/health-statistics-quarterly/no--39--autumn-2008/differences-in-mortality-between-rural-and-urban-areas-in-england-and-wales.pdf.; http://www.ncbi.nlm.nih.gov/pmc/articles/PMC2831359/

Urbanisation and urban rural change
1. Look at “Rural-Urban Links for Growth and Poverty Reduction”, Joachim von Braun, World Bank slideshare, http://www.slideshare.net/jvonbraun/ruralurban-linkages-for-growth-employment-and-poverty-reduction
2. Watch clip on megatrends: population growth, urbanisation are displacement factors http://www.youtube.com/watch?v=BhBVm590Q7Qhttp://www.youtube.com/watch?v=BhBVm590Q7Q
3. Article on urbanisation http://siteresources.worldbank.org/INTPROSPECTS/Resources/334934-1327948020811/8401693-1355753354515/8980448-1366123749799/GMR_2013_Overview.pdf
4. On England’s big cities. Urban Living: The city roars back, http://www.economist.com/node/21559338
5. Construct a mind map or spider diagram on urbanisation and urban-rural migration, compare your diagram with a partner and then another pair, add in additional detail which you consider relevant from the diagrams of other students.
Image: http://www.fig.net/pub/figpub/pub33/fig_1.jpg
Action for students:What are displacement factors? How can rural-urban links relate to life on the margins?

MigrationHuge urban growth is connected to urban-rural migration, and most urban growth is projected to take place in less developed countries. Magnitudes of migration varied greatly• Negative net-migration is most likely in rural areas. • Positive net migration concentrates around urban areas (e.g.,
New Delhi) • Africa and Latin America’s population has declined due to out-
migration across all decades.• Asia has experienced fluctuations, but with overall out-migration.• In Europe there was out-migration in 1970s and 1980s, which
reversed in the 1990s. • North America has had an increase in migrants. The positive net
migration in North America and to some extent also in Europe may be for non-economic reasons, a move to drier and sunnier areas with good amenities like Arizona or the Mediterranean.
Image and source: Center for International Earth Sciences Network, “Migration in Risk-Prone Areas” http://blogs.ei.columbia.edu/2013/02/04/migration-in-risk-prone-areas/

Urban and
rural populations
Source: http://esa.un.org/unup/pdf/WUP2011_Highlights.pdf; http://www.nutritionworks.org.uk/our-publications/programme-review-and-evaluation/2011/153-urban-malnutrition-a-review-of-food-security-and-nutrition-among-the-urban-poor
K
Action for students: Watch the TED Talk by Carolyn Steel on how advances in transport and technology have emancipated cities from geography such that they can grow to any size. Discuss why this has also distanced us from nature. •http://www.2learn.ca/specialedition/worldfood/worldfood.aspx Urban and rural populations by
population group 1950 - 2050
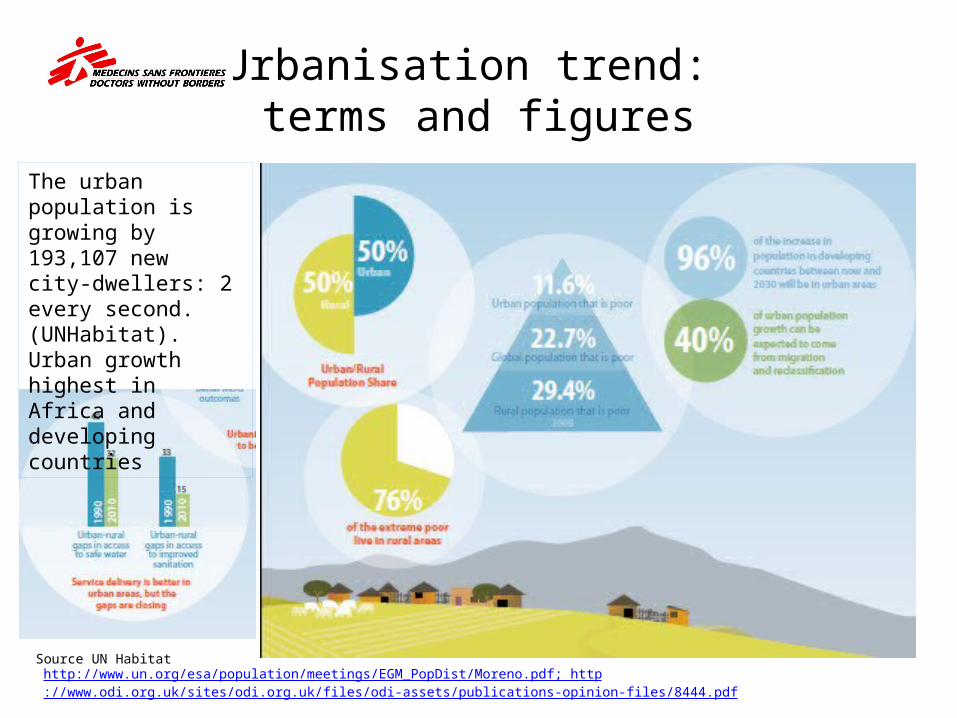
Urbanisation trend: terms and figures
http://www.un.org/esa/population/meetings/EGM_PopDist/Moreno.pdf; http://www.odi.org.uk/sites/odi.org.uk/files/odi-assets/publications-opinion-files/8444.pdf
Source UN Habitat
The urban population is growing by 193,107 new city-dwellers: 2 every second. (UNHabitat). Urban growth highest in Africa and developing countries
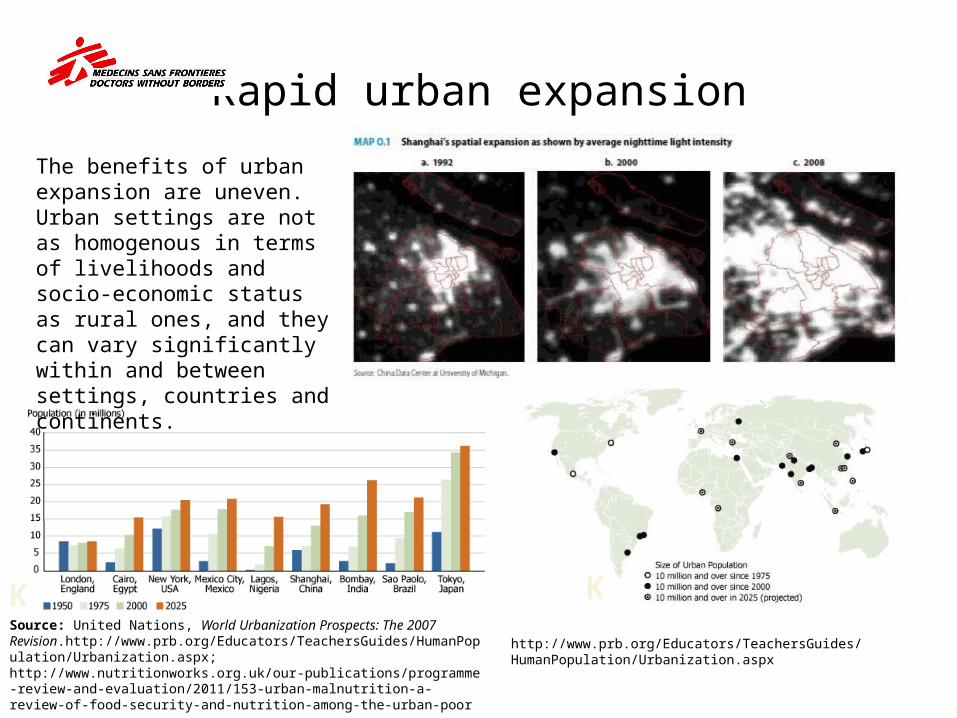
Rapid urban expansion
Source: United Nations, World Urbanization Prospects: The 2007 Revision.http://www.prb.org/Educators/TeachersGuides/HumanPopulation/Urbanization.aspx; http://www.nutritionworks.org.uk/our-publications/programme-review-and-evaluation/2011/153-urban-malnutrition-a-review-of-food-security-and-nutrition-among-the-urban-poor
http://www.prb.org/Educators/TeachersGuides/HumanPopulation/Urbanization.aspx
KK
The benefits of urban expansion are uneven. Urban settings are not as homogenous in terms of livelihoods and socio-economic status as rural ones, and they can vary significantly within and between settings, countries and continents.

World urban population
Cities of different sizes play important role. People also move from one city to another, not just from country to town.
Source: http://esa.un.org/unup/pdf/WUP2011_Highlights.pdf
K
Agriculture has to compete for water and land with sprawling urban areas and populations.
K
Population by city size in millions in 1970, 1990, 2011 and 2025
Distribution of the world urban population by major area 1950, 2011, 2050
City size
% of world urban population
Major area

Urban poorWhilst very diverse across regions, countries and even within cities, the urban poor tend to share deprivations day to day, including: • Limited access to employment and income: urban poor are usually
more dependent on informal sector jobs that do not meet their consumption needs. Women least likely to have secure jobs.
• Insecure and inadequate living conditions,• Limited access to basic services and poor infrastructure, • Vulnerability to risks (e.g., environmental hazards, natural
disasters and health risks particular to living in slums) which impact household health
• Barriers to mobility and transport• Problems of inequality and exclusion, as the (World Bank 2007)
Source: http://www.nutritionworks.org.uk/our-publications/programme-review-and-evaluation/2011/153-urban-malnutrition-a-review-of-food-security-and-nutrition-among-the-urban-poor; WB 2007. Bangladesh, Dhaka: improving living conditions for the urban poor. Report No. 35824-BD World Bank; Sustainable Development Unit, South Asia Region.
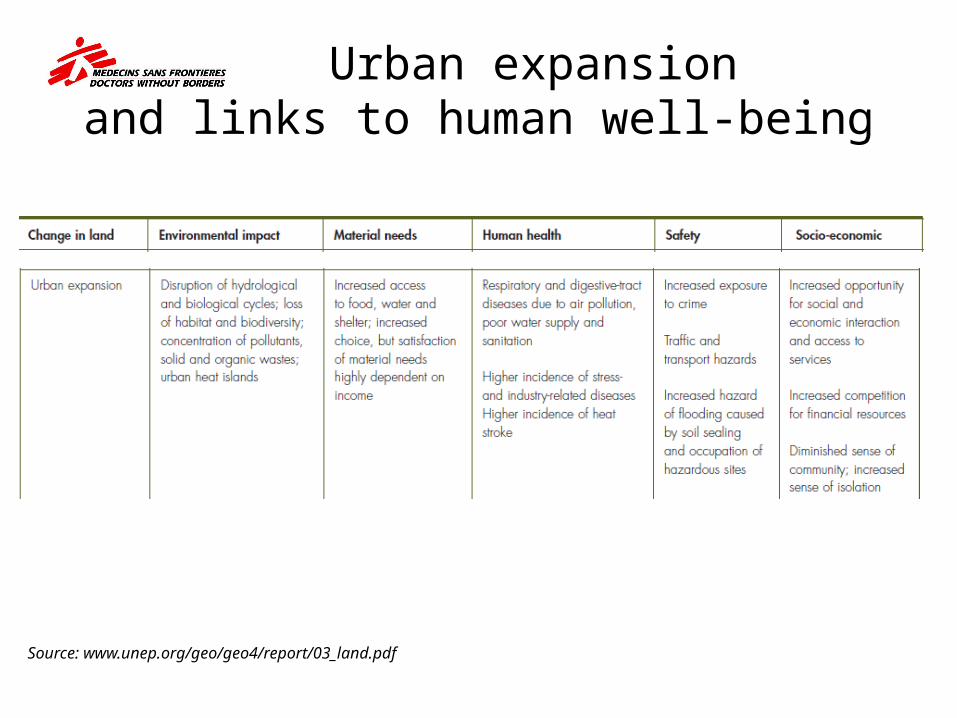
Urban expansion and links to human well-being
Source: www.unep.org/geo/geo4/report/03_land.pdf

Migration to cities:urban displacement
• Scale is growing: numbers estimated at 72 million, with growing numbers moving into urban areas rather than camps
• Urban displacement trend becoming more protracted• Causes complex, manifold and overlapping• Low and middle income countries send and receive disproportionate
number of urban displaced• Migration not always rural to urban, also between urban areas• Urban arrivals not homogenous group• New arrivals exacerbate local vulnerability, as they compete with
already resident urban poor for resources and livelihoods, which can lead to conflict
• Response to challenges beyond the scope of any one actor or sector: urban displaced people often beyond the reach of humanitarian and development agencies and other formal assistance structures
Source: http://www.fmreview.org/en/urban-displacement/FMR34.pdf Simone haysome, “Sanctuary in the city?Urban displacement and vulnerability” http://siteresources.worldbank.org/INTPROSPECTS/Resources/334934-1327948020811/8401693-1355753354515/8980448-1366123749799/GMR_2013_Overview.pdf
Displaced people = refugees (migrants who cross borders) and internally displaced people (migrants within country)

Internally Displaced People (IDP) collective centre in former hospital building, Tbilisi, Georgia. An estimated 148 families live in this hospital complex which suffers from widespread rat and insect infestation and falling masonry
Image and text: http://www.fmreview.org/en/urban-displacement/FMR34.pdf
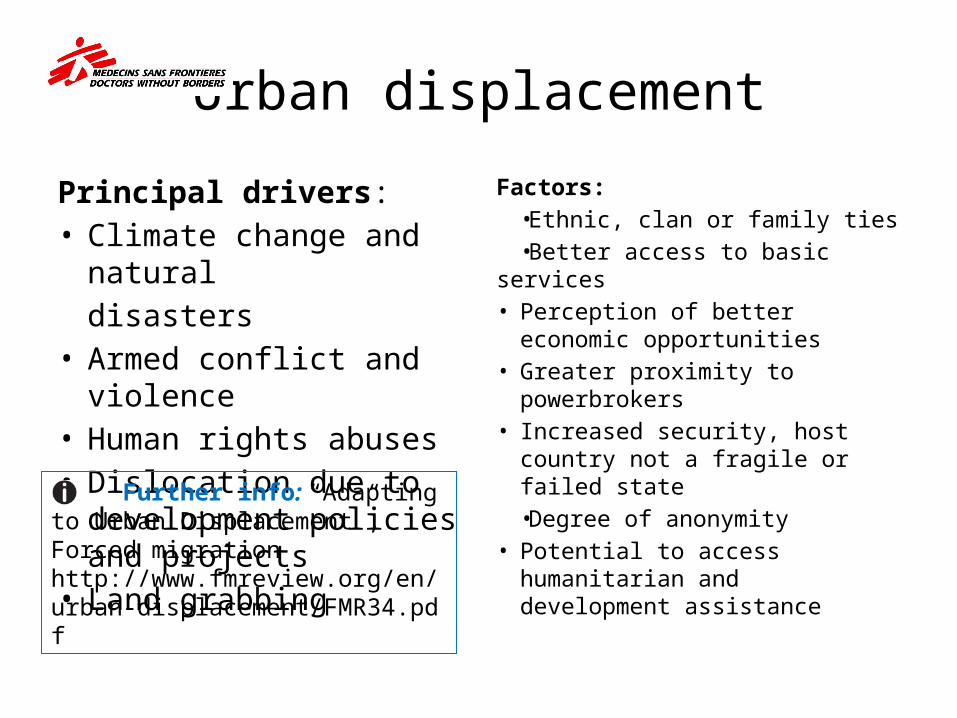
Urban displacement
Principal drivers:• Climate change and
natural disasters
• Armed conflict and violence
• Human rights abuses• Dislocation due to
development policies and projects
• Land grabbing
Factors:•Ethnic, clan or family ties•Better access to basic
services• Perception of better
economic opportunities • Greater proximity to
powerbrokers• Increased security, host
country not a fragile or failed state•Degree of anonymity
• Potential to access humanitarian and development assistance
Further info: “Adapting to Urban Displacement”, Forced migration http://www.fmreview.org/en/urban-displacement/FMR34.pdf

Urban survivors: chronic vulnerability
As of 2010 more than half of the world’s population lives in cities compared to 20% one hundred years ago.
Urban growth rates and slum growth rates are nearly identical (UN Habitat)
One in 10 lives in a slum, which have grown in numbers and size with urbanisation.
• Video life in megaslum Kiberia http://www.stwr.org/megaslumming/film/
• Article 7 myths of slums http://www.stwr.org/health-education-shelter/the-seven-myths-of-slums.html A train, known locally as 'The Lunatic
Express' passes through the centre of Kibera. © Francesco Zizola/Noor
Urban rural graph: http://www.grida.no/graphicslib/detail/biofuels production-2005-by-country
ethanol-and-biodiesel_1353#; UNHABITAT http://www.un.org/esa/population/meetings/EGM_PopDist/Moreno.pdf

Slum populations
Source: http://geodev.grid.unep.ch/extras/geg_slider.php; * Quote: http://www.fmreview.org/en/urban-displacement/FMR34.pdf
in developing countries 1990- 2010
“Although nowhere is immune from urban disasters and humanitarian crises, cities in the developing world are far more vulnerable to the consequences than those in the developed world. The risk of disaster [and humanitarian crises] is sharply increased by rapid urbanisation, and poorly managed or uncontrolled urbanisation and inadequate governance...” with less well-resourced small and medium-sized cities particularly vulnerable*

The Sahel: growth ininformal urban settlements
• The Sahel is not only rural – a common misconception. The region with a population of about 50 million people has experienced unprecedented urban population explosion and most future growth is set to occur in cities.
• Urban environments are more heterogeneous than rural ones.• Many of the newcomers are from most disadvantaged rural backgrounds,
and thus have fewest resources to help them cope in cities.• Economic decline or slowdown (stagnating or declining gross domestic
product annually),results in urban economies strained with limited ability of local and national governments to provide minimally decent living conditions, basic social services and livelihood opportunities.
• Overcrowded and extremely unsanitary slums and shantytowns which leads to epidemics and outbreaks of diseases – pockets of severe deprivation, poverty and concentration of ill health.
• Health care systems affecting health and mortality tend to be better for urban than rural populations. However, overall the rural-urban gap in child health is narrowing due to increase in urban malnutrition, and health and nutritional outcomes for poor urban children can be worse in cities.
Source: Lifland, Amy. Starvation in the Sahel http://hir.harvard.edu/crafting-the-city/starvation-in-the-sahelUrban-Rural Differentials in Child Malnutrition Trends and Socioeconomic Correlates in Sub-Saharan Africa http://irnegotiation0708.pbworks.com/f/download+malnutrit.pdf

Growing urban poverty:Mali, Chad, Burkino Faso
Action for students: How do growing poverty and a breakdown of the country’s social fabric relate to growing urban settlements and malnutrition in the Sahel?•Bamako, Mali http://www.irinnews.org/report/76375/mali-urbanisation-fuelling-begging-on-streets-of-capital
• BBC Photo journal on Chad urban migrant story http://news.bbc.co.uk/1/shared/spl/hi/picture_gallery/06/africa_chad_urban_migrant0s_story/html/1.stm
•Burkino Faso’s urban hungerhttp://www.irinnews.org/report/85854/burkina-faso-hunger-stings-worse-in-the-city
What do the slums look like in the Sahel? More on Chad’s N’Djamena, for example, pictured here:http://tripwow.tripadvisor.com/slideshow/chad/n-djamena.html
Image: http://tchadonline.com/index.php/monde-ndjamena-vitrine-du-neant/

LIFE ON THE MARGINS: SUDAN, BANGLADESH AND
KENYA

Urban and rural Sudan
Action for students: 1. Create a mini country profile and fact file on what is meant by life
at the margins to someone in Sudan’s western region of Darfur region versus someone in a city such as Djibouti City. – MSF Starved for Attention “Frustration” Urban malnutrition in Djibouti
http://www.starvedforattention.org/– BBC country profile Djibouti http://www.bbc.co.uk/news/world-africa-13231761– Food insecurity looms in Djibouti
http://www.irinnews.org/report/98408/food-insecurity-looms-in-djibouti– BBC Sudan timeline http://www.bbc.co.uk/news/world-africa-14095300
Darfur Image Derk Segar / IRIN

Bangladeshand Kenya urban case studies
Action for students: 1. Watch Urban survivor film series and related material:
http://www.msf.org.uk/article/urban-survivors-voices-worlds-slums in: •Dhaka, Bangladesh. •Kibera, Nairobi, Kenya.
–See also MSF account http://www.msf.org.uk/article/kenya-escaping-death-africas-largest-urban-slum
2. Relate these case studies to quality and adequacy of food, food production, increased vulnerability and life on the margins. Why can it be harder to reach vulnerable people in urban settings? Why can be well-being be variable at the sub-state level?
Further info: Series also covers:–Karachi, Pakistan; –Johannesburg, South Africa. See also reporthttp://www.msf.org.uk/sites/uk/files/2009_No_Refuge_Access_Denied__Medical_and_humnitarian_needs_of_Zimbabweans_in_South_Africa_200907234924.pdf–Port au Prince, Haiti

Kamrangirchar slumHouses in the Boubazar slum near Kamrangirchar and children playing (inset)
In the Kamrangirchar slum of Dhaka - on the banks of one of the most polluted rivers in the world - MSF runs a primary healthcare centre that provides care to children under five and pregnant and lactating women. Nearby, MSF also runs a therapeutic feeding centre. Through a largely home-based programme, these children are being fed with Plumpy Nut, a thick nutrient-rich peanut paste which helps children regain normal body weight.
Photos: Julie Remy
Action for students: read this slide and the next one, and extract the key information for your own fact sheet. Find out where the Kamrangirchar Peninsula is, the name of the river and make a sketch map showing the locations.
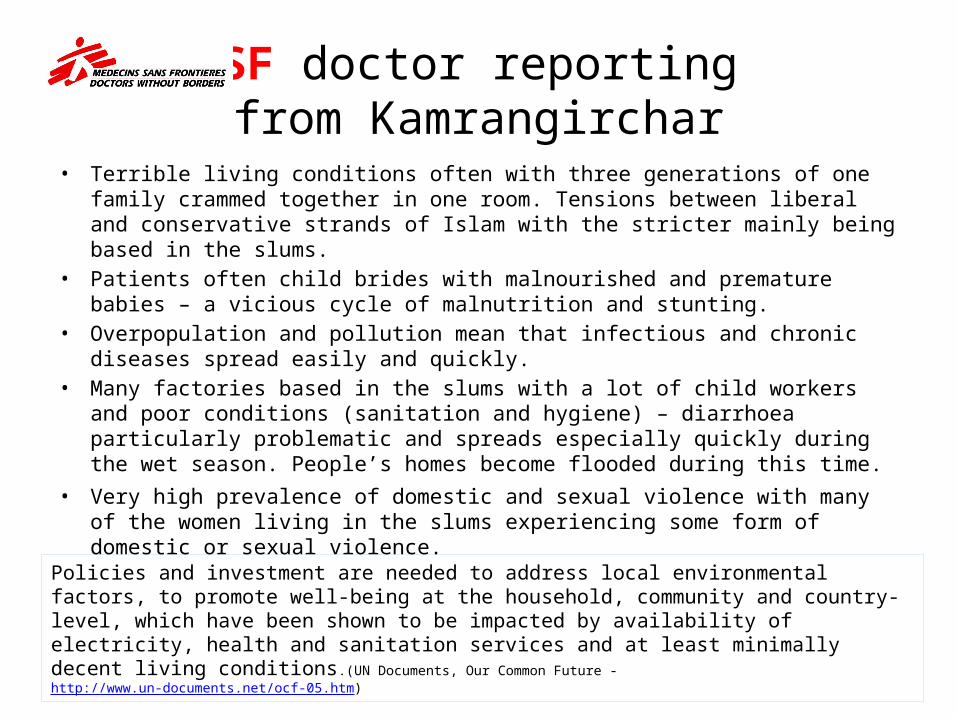
MSF doctor reporting from Kamrangirchar
• Terrible living conditions often with three generations of one family crammed together in one room. Tensions between liberal and conservative strands of Islam with the stricter mainly being based in the slums.
• Patients often child brides with malnourished and premature babies – a vicious cycle of malnutrition and stunting.
• Overpopulation and pollution mean that infectious and chronic diseases spread easily and quickly.
• Many factories based in the slums with a lot of child workers and poor conditions (sanitation and hygiene) – diarrhoea particularly problematic and spreads especially quickly during the wet season. People’s homes become flooded during this time.
• Very high prevalence of domestic and sexual violence with many of the women living in the slums experiencing some form of domestic or sexual violence. Policies and investment are needed to address local environmental factors, to
promote well-being at the household, community and country-level, which have been shown to be impacted by availability of electricity, health and sanitation services and at least minimally decent living conditions.(UN Documents, Our Common Future - http://www.un-documents.net/ocf-05.htm)

Kamrangirchar malnutrition
An MSF nurse measures the height and weight of a child to determine the level of malnutrition. MSF hopes to bring its expertise and experience in treating malnutrition so that more children and their mothers can continue to live and grow up healthily.
Photos above Alfons Rodriguez
The MUAC (middle upper arm circumference) bracelet is used in conjunction with the height to prescreen children for malnutrition directly in the community
Photo: Julie Remy

URBAN SURVIVORS:Kibera, KENYA
A rooftop view of Kibera during the day. Kibera is one of the biggest slums in Nairobi, and the second largest urban slum in Africa.
Photo: Charlie Dailey
Geographically divided into 12 ethnically heterogeneous villages of similarly poor conditions, this sprawling slum it is one of the most densely populated districts of Nairobi, home to an estimated 220,000 to 250,000 people. The land is owed by the Kenyan Government, but private housing is owned by individuals who rent them out to inhabitants. These buildings are made of mud and corrugated iron sheeting that make up small, narrow rooms to house whole families. Some shelters are even used in shifts, people working during the day outside the slum sub-let their rooms for others who work at night. Poor sanitation, open sewers, overcrowded accommodation and a lack of access to free healthcare all contribute to the spread of diseases.

MSF clinic Kibera South
Inaugurated in 2013, the centre offers comprehensive primary healthcare and maternity services integrated with the management of chronic diseases
Photos above: MSF
Photo: Andre Francois

Walking to the MSF centreKibera, Nairobi, Kenya
Photo: Charlie Davy
Photo: Andre Francois
Photo: Charlie Davy
Photo: Charlie Davy

Rural householdsRural households are most affected by poverty and hunger.
They account for 75% of the world’s hungry
Agriculture is the main source of income in more than 60% of rural households
Thirty per cent of these households live in extreme poverty.
Source: http;//www.ifad.org./rpr2011/report/a/rpr2011.pdf; International Assessment of Agricultural Knowledge, Science and Technology for Development (2009). Agriculture at a Crossroads: A Global Report. IAASTD. Washington; http://siteresources.worldbank.org/EXTPREMNET/Resources/EP125.pdf

Rural changeAs economies grow, so does the importance of non-agricultural income in the rural economy as a whole.• Developmental transition• More people buying food
rather than growing it
Source: http://www.fao.org/publications/sofi/en/
Cloke’s 1971 Index of Ruralityhelps to understand the changing features on the rural-urban continuum. It is composed of: •Occupancy rates•Commuting•Female population (15-44)•Amenities•Population density•Agricultural employment•Elderly population
• Remoteness (distance to 50,000)
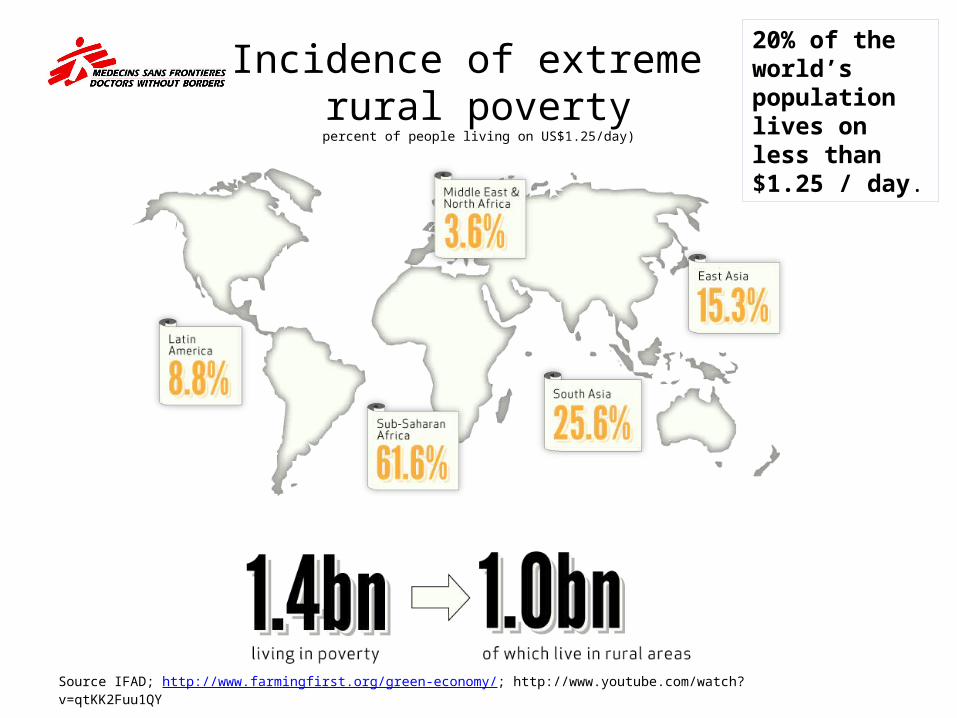
Incidence of extreme rural poverty
percent of people living on US$1.25/day)
Source IFAD; http://www.farmingfirst.org/green-economy/; http://www.youtube.com/watch?v=qtKK2Fuu1QY
20% of the world’s population lives on less than $1.25 / day.
Rural vulnerabilities
Action for students:
1. Discuss with other students and taking an evidenced based view, draw conclusions to agree or disagree whether “The Urban Rural divide: Is it a Myth or Reality” http://www.macaulay.ac.uk/economics/research/SERPpb2.pdf
2. Debate the issues in “Managing Risk and Vulnerability in the Rural Space”, Joachim von Braun, World Bank slideshare http://www.slideshare.net/jvonbraun/managing-vulnerability-and-risk-in-the-rural-space
3. Discuss and map the physical and socioeconomic impact of climate change and globalisation (integration of the world) on farmers in “Climate Change, Rural Vulnerabilities and Migration” http://www.prb.org/Publications/Articles/2007/ClimateChangeinRuralAreas.aspx
Source: http;//www.ifad.org./rpr2011/report/a/rpr2011.pdf; International Assessment of Agricultural Knowledge, Science and Technology for Development (2009). Agriculture at a Crossroads: A Global Report. IAASTD. Washington.