life cycle cost analysis of - smartnet cycle...life cycle cost analysis of five urban ... rolling...
TRANSCRIPT
Life Cycle Cost Analysis of Five Urban
Transport Systems
Funded by
Bangalore Metro Rail Corporation Ltd.
BUS METRO RAIL MONORAIL LIGHT RAIL TRANSIT BUS RAPID TRANSIT
Prepared by
Institute of Urban Transport (India)
2012

LIFE CYCLE COST ANALYSIS OF FIVE URBAN TRANSPORT SYSTEMS
Bangalore Metro Rail Corporation Limited
1
EXECUTIVE SUMMARY
It is crucial that India implement efficient and reliable Urban Passenger Transport Systems
to ensure the sustenance of a high growth rate and alleviation of poverty. According to a
study, by 2030, India will have more than 68 cities having a population of above a million
people and 590 million Indians will be staying in cities and towns, twice the American
population today. Further, cities’ contribution to the GDP growth will be nearly 3/4th and
more than 70% of new employment will be generated there. McKinsey’s assesses that
India need to construct 2.5 billion square meters of roads and 7,400 Km of Metro and
Subways in the twenty year time-frame ending 2030. The urban transport scenario in India
is unsatisfactory - there is severe quantity and quality deficit. The country is unmistakingly
on the path of rapid increase of motorisation, which has accelerated in the past two
decades.
The choice of the Urban Transport System is the key decision point for cities, states and the
central government. It is most relevant because different classes of cities and different
corridors in the same city require different public transport solutions. The country has so far
failed to develop objective criteria for the selection of public transport modes. The
Working Group for Urban Transport for the 12th Five Year Plan has suggested a shift from
the current DPR based approach selection criteria to PHPDT, City/Town Population and
Average Motorised Trip Length based.
Nonetheless, it will be appropriate if PHPDT, population and trip length criteria can also be
clubbed with the “Cost Based Comparative Approach” to arrive at the proposed
appropriate mix of public transport systems.
This study focussed at introducing a scientific cost based approach of arriving at “The Full
Life Cycle Cost of different systems”- thereby making “Life Cycle Costs of the Systems”
integral to informed decision taking. From this perspective the study marks a paradigm
shift and IUT believes that the final outcome of the report shall be first tool available for
informed decision making in the country by the policy planners and the union/state/city
governments to make the choice of a particular urban transport mode or a combination
of that.
Equally importantly, the study has focused on seeing the impact of external environment
changes like changing inflation index, variation in interest rates and fluctuation of interest
rates etc. that often influence and impact the systems stability and cost over its
operational life. The purpose of this exercise has been to ensure that commercial
decision-making is informed more particularly from the point of view of appropriate price
discovery and consequent transparent subsidy regime definition, if such a situation
emerges.

LIFE CYCLE COST ANALYSIS OF FIVE URBAN TRANSPORT SYSTEMS
Bangalore Metro Rail Corporation Limited
2
In this report, IUT has evaluated five urban transport systems namely Metro Rail, Mono Rail,
Light Rail (both at grade and elevated), Bus Rapid Transit System and Ordinary bus
Services.
It is important to note that a system like metro rail has a civil structure (approximate 50%
of CAPEX) whose life span runs in many decades (more than 50 years), whereas a system
like normal urban bus service has a life span of just 10 years. Various components of
different systems show substantial variability in terms of their life and such variability has
been carefully accounted for. As a part of analysis due care has also been taken to
emphasise how different systems with varying life and varying capacity limitation behave
for life cycle cost analysis.
At the beginning of this research, a hypothetical case was assumed based on which the
initial LCC of the urban transport systems has been calculated. A hypothetical case of 20
km corridor having a PHPDT of 15,000 is considered for which the LCC has been
calculated for 30 year duration for each chosen system. Towards the end of the study, the
results have been applied to real life scenarios.
Metro Rail System
Metro Rail is the most prevalent urban transport system in the world after urban bus and
has gained further momentum in the recent years particularly due to upswing in the
global crude prices. At present more than 175 cities in the world have operational metro
rail, while 50 more are in the process of constructing it – 25 of them in China and 9 of them
in India itself. The system has a flexible PHPDT carrying capacity and it varies from 20,000 to
up to 90,000 depending upon the type of systems used (which impacts the minimum
headway), rolling stock and train set configurations (depend upon the design of civil
structures like station length).
System Coach
Configuration
Train Set
Capacity
Maximum PHPDT at
2.5 minute headway
Maximum PHPDT at
1.5 minute headway
Metro Rail
4 1,100 26,400 44,000
6 1,650 39,600 66,000
8 2,200 52,800 88,000
For the purpose of this study, to understand the Capital Expenditure (CAPEX) requirements
of this system, the actual construction costs as well as the DPR costs of Delhi Metro Rail
Corporation (DMRC) Ph II, DMRC Ph III, Hyderabad Metro Rail Limited (HMRL), and Kochi
Metro have been analysed. Post analysis of detailed aspect wise construction and
implementation cost, CAPEX assumptions taken for this system (at 2012 prices) for the
hypothetical 20 km corridor. The O&M cost data of this system has been assumed from
the time series O&M data of DMRC which is currently the only operational large scale
metro rail system in India.

LIFE CYCLE COST ANALYSIS OF FIVE URBAN TRANSPORT SYSTEMS
Bangalore Metro Rail Corporation Limited
3
Mono Rail System
Monorail is a sleek, elevated transit system which can be built to efficiently serve areas
where metro rail cannot penetrate. As it requires a very narrow right of way, and navigate
such areas which Metro Rail cannot, it can comfortably be built in an area dominated by
high-rises and sharp turns.
Mumbai monorail which is under construction has an assumed PHPDT in first and last year
of Project life between 7000-8500 PHPDT whereas the latest DPR of Kozhikode puts the first
and last year peak PHPDT as 7000-11500 approximately. A three car mono rail system has
been planned both for Mumbai and Kozhikode. A three car system depending upon
specification can carry between 400-500 passengers. A monorail can carry a maximum
PHPDT of about 28,000 if the highest possible system configuration is taken into account.
System Coach Configuration Train Set Capacity Maximum PHPDT at 2.5
minute headway
Mono Rail
3 384 9,216
6 768 18,432
9 1,152 27,648
To understand the CAPEX requirements for this system, the available costs of Kozhikode
Monorail, the proposed three corridors of Delhi Monorail and under construction Mumbai
Monorail system have been used. The cost data of Kozhikode Monorail which is latest has
been used as the basis of making assumptions in this study.
As no monorail system is presently operating in the country, the O&M costs data has been
approximated by IUT using available number from project reports, emerging international
trends and O&M cost benchmarks. Also the O&M cost data of first year of Kozhikode
(2015-16) has been used to derive the O&M cost for the first year in this study for the
hypothetical case.
Light Rail System
Light Rail or LRT is a preferred mode where ample right of way is available. Built at-grade
or elevated (in portions of narrow right of way). Since LRT is generally built at-grade, they
take away the pavement size thereby leaving less space for other modes of commute
and may also have interfering space with bus and personalised vehicles. Unless
segregated, they tend to ply at slower speeds as their speeds are restricted by other
traffic flows, especially at junctions. In the Indian context, with the unplanned spread of
the cities, providing the right of way at-grade may not be easy.
The Light Rail System is a preferred mode of transport in areas with a maximum PHPDT of
around 23,000 for elevated structure. At grade LRT because of the inherent limitations of a
mixed used traffic has a lesser systems capacity.

LIFE CYCLE COST ANALYSIS OF FIVE URBAN TRANSPORT SYSTEMS
Bangalore Metro Rail Corporation Limited
4
System Coach Configuration Train Set Capacity Maximum PHPDT at 2.5 minute
headway
Light Rail 2 484 11,616
4 968 23,232
Elevated LRTS is known for being more efficient and has higher carrying capacity than
monorail. Modern Light Rail has in recent decades made a comeback in Europe,
Australia, and Americas and in recent years even in Asia.
Only 2007-08 price level CAPEX data is available for Delhi LRT and the same has been
escalated to arrive at the cost of the hypothetical 20 km LRTS at 2012-13 levels. The O&M
data of no Light Rail System is available as on date in the Indian context and thus for the
sake of simplification per km O&M Cost of Elevated Light Rail has been assumed at the
same level as that of Elevated Monorail
Bus Rapid Transit System
The Bus Rapid Transit System or BRTS is generally a closed mass rapid transit system with
dedicated lanes for bus operations. Since its conception as a viable option in Latin
America, many cities have adopted it with varied results. BRT is an advanced bus system
serving travel corridors with an operational advantage such as exclusive lanes and traffic
preference on signals. BRT is faster and more reliable service than ordinary bus services.
BRT systems possess a unique advantage of implementation as they ply on segregated
Right of Ways (ROW).
BRTS has arrived late in India - even later than arrival of Delhi Metro Phase I. Two cities -
Delhi & Ahmedabad have commissioned a few kilometres of BRTS. While the BRTS of Delhi
has performed sub-optimally since inception, Ahmedabad’s experience has been
somewhat better. Today, a dozen cities are planning or implementing BRTS. But the
efficacy of the system in cities where ROW segregation at grade has difficulties is yet to be
established.
Exceptions apart, the system can passenger flow of 4,000 to 10,000 PHPDT is what can be
achieved with BRTS, more so in Indian consideration, and has much lower costs than the
other transit systems like metro rail, monorail and light rail. But headway of 0.6 minute has
been observed at different intersections of Delhi BRTS which has also been assumed for
this study.
System Coach
Configuration
Train Set
Capacity
Maximum PHPDT at
1 minute headway
Maximum PHPDT at
0.6 minute headway
BRTS 1 80 4,800 8,000
2 160 9,600 16,000
CAPEX estimates for BRTS have been derived using data from detailed project reports of
Ahmedabad Phase I, Phase II and of Rajkot. Though O&M Cost Data for varied timeline is
available, it has been considered prudent to base the assumptions made out of the most

LIFE CYCLE COST ANALYSIS OF FIVE URBAN TRANSPORT SYSTEMS
Bangalore Metro Rail Corporation Limited
5
recent comparable data available for DTC, BEST, BMTC, MTC(Chennai) & Thane taken
from the Journal of Indian Transport (CIRT, Pune) – Latest Edition (April – June 2012). Also
since it for ordinary bus systems, an additional O&M cost for the OCC, Security etc. has
been incorporated to arrive at the BRTS O&M cost data to be used for this study. To bring
the latest O&M cost to present price level a 9% increase was assumed for the manpower
and 5% for the other costs.
Ordinary Bus Services
Ordinary Bus Service is a building block of any public transport system across the globe.
The requirement of capital expenditure to kick start/maintain this system is one of the
lowest among the other modes of urban transport and the bus operator does not have to
contribute to the capital costs of creation of infrastructure. Till very recently, ordinary bus
was the only mode of public transport in Indian cities. Except Mumbai (before arrival and
expansion of Delhi Metro), all principal cities heavily depended on this mode. In many
Indian cities, buses do carry up to fifty per cent of all the people commuting by
mechanised transport. In Mumbai, whose lifeline is the suburban rail network, the ridership
of buses is equally impressive at 5-6 million per day. On the contrary, in Delhi, DTC and
Delhi Metro routes are not rationalised DTC is carrying daily commuter trips of 4.5 million.
An ordinary bus service can manage a passenger flow of 3,000 to 5,000 PHPDT. In medium
and large sized cities, even today, ordinary buses remain and shall be the predominant
mode of urban transport except in higher density corridors, where metro rail systems get
created with time.
The CAPEX information for this mode is primarily picked from the Recommendations of
Working Group on Urban Transport for 12th Five Year Plan. Similar to BRTS system, the O&M
cost data of ordinary bus services have also been assumed from the latest available cost
data of bus systems of different metropolitan cities in the CIRT journal.
Assumptions
It has been observed that in general headway of 2.5 minutes to 3 minutes is best suited for
rail based system. Thus headway of 2.5 minutes has been considered for all rail based
systems. In addition headway of 1 minute has been assumed for ordinary bus services
whereas the same has been assumed at 0.6 minutes for BRTS. Based on the headway and
capacity of coaches assumed at peak carrying capacity of 6 persons per square meter
the total rolling stock requirements have been derived. For the sake of comparison, cost
of per unit rolling stock has been assumed at Rs. 10 Crore for all the 3 systems. A station
distance of 1 km for Metro Rail, station/shelter distance of 750 m for Monorail, Light Rail
and BRTS system and shelter distance of 500 m for ordinary bus services has been
assumed. The CAPEX requirements for five systems are presented in the table below:

LIFE CYCLE COST ANALYSIS OF FIVE URBAN TRANSPORT SYSTEMS
Bangalore Metro Rail Corporation Limited
6
Item (in Rs Crore) Unit Unit Cost -
Metro Rail
Total Cost –
Metro Rail
Unit Cost -
Mono Rail
Total Cost –
Mono Rail
Unit Cost –
Light Rail
Total Cost –
Light Rail
Land @10% 321.36 @10% 378.24 @10% 281.11
Alignment and Formation
Elevated viaduct section R. Km. 32.00 640.00 22.50 450.00 21.00 420.00
OCC Building LS 50.00 50.00 40.00 40.00 40.00 40.00
Station Buildings
Elevated stations Each 16.00 320.00 9.00 243.00 10.00 270.00
E&M Works
Elevated station (E&M, Lifts, etc.) Each 7.00 140.00 2.50 67.50 2.50 67.50
Depot LS 50.00 50.00 120.00 120.00 70.00 70.00
Permanent Way R. Km. 7.00 140.00 - 5.00 100.00
Traction & power
Elevated R. Km. 8.00 160.00 5.50 110.00 5.50 110.00
Lift Each 0.30 24.00 0.30 16.20 0.30 16.20
Escalator Each 1.00 80.00 1.00 54.00 1.00 54.00
Signalling and Telecom
Signalling R. Km. 13.00 260.00 9.00 180.00 8.00 160.00
Telecom Each Stn. 3.00 60.00 2.00 54.00 2.00 54.00
Automatic fare collection Each 3.40 68.00 2.50 67.50 2.50 67.50
R & R R. Km. 3.20 64.00 2.00 40.00 2.00 40.00
Misc. Civil Utilities R. Km. 3.80 76.00 2.00 40.00 2.00 40.00
Electrical Utilities R. Km. 2.90 58.00 2.50 50.00 2.50 50.00
Telecom Utilities R. Km. 0.50 10.00 0.50 10.00 0.50 10.00
Rolling Stock Each 10.00 920.00 10.00 2,130.00 10.00 1,160.00
General Charges (except land) @3% 93.60 @3% 110.17 @3% 81.88
Contingencies @3% 106.05 @3% 124.82 @3% 92.77
Total 3,641.01 4,285.42 3,184.95
Every Route Km 182.05 214.27 159.25

CAPEX of BRTS and ordinary bus is presented below:
Item (in Rs Crore) Unit BRTS Total BRTS BUS Total BUS
Land Cost @5% 56.76 @5% 16.34
Roadway Development R. Km. 8.55 171.00 -
Bus Stops Each 0.40 10.80 0.30 12.00
Foot over Bridges Each 0.25 6.75 -
Operational Infrastructure (Terminals & Depots)
Depots Each 10.00 70.00 10.00 80.00
Workshops and Terminals Each 20.00 20.00 25.00 50.00
Operation Control Center (OCC) LS 10.00 10.00 -
Bridges and Flyovers R. Km. 31.80 636.00 -
ITS application and External Tracking LS 29.50 29.50 10.00 10.00
Bus Cost Each 0.40 148.00 0.40 165.20
General Charges (except land) @3% 33.06 @3% 9.52
Contingencies @3% 35.76 @3% 10.29
Total Cost 1,227.62 353.34
Every Route Km 61.38 17.67
The Working Group Report suggests the requirement of a depot for every 50 buses, with
the cost per depot at Rs. 8 Crore. It also estimates one workshop for every 250 buses at Rs.
20 crore, as well as a terminal for every two million population for another Rs. 20 crore, The
depots, workshops and terminal costs suggested in the WG report are inclusive of land
acquisition and machinery costs.
CAPEX requirements of At Grade Light Rail are as below:
Item (in Rs Crore) Unit Light Rail (AG) Total Light Rail (AG)
Land Cost @10% 189.52
Fixed Infrastructure - Civil R. Km. 13.00 260.00
Fixed Infrastructure - Electrical R. Km. 9.00 180.00
Depots LS 80.00 80.00
Operation Control Center (OCC) LS 40.00 40.00
Rolling Stock Each 10.00 1,240.00
Signaling R. Km. 2.00 40.00
General Charges (except land) @3% 55.20
Contingencies @3% 62.54
Total Cost 2,147.26
Every Route Km 107.36
The assumptions which were taken in this study for deriving the operations and
maintenance cost of the urban transport systems are divided mainly among three critical
parameters:
Energy Costs Staff Costs Repair and
Maintenance Costs
Replacements

LIFE CYCLE COST ANALYSIS OF FIVE URBAN TRANSPORT SYSTEMS
Bangalore Metro Rail Corporation Limited
8
After accounting for the 20% regeneration potential of present day modern rolling stock
the average per car km traction energy consumption for metro rail, mono rail and light rail
systems have been assumed as 2.38 KWh, 1.57 KWh and 1.96 KWh respectively. Similarly for
auxiliary energy consumption a consumption of 250 KWh and 2200 KWh has been
assumed for each station and depot respectively. For this study, IUT has adopted the initial
electricity supply rate of Rs. 4 per KW (2012 prices). The same has been escalated at a
rate of 5% per annum.
For bus based transport system efficiency of 3.5 km every litters/kg of fuel has been
assumed. Since in general most of the bus based transport system in India is running on
diesel thus IUT has considered diesel as fuel at Rs. 45 per litre, with an annual price
increase at 5%. The model also incorporates CNG as an alternative fuel choice to ensure
that the future scenarios are amiably depicted. The CNG price chosen for this study is Rs.
40 per kg with an escalation of 5%.
The staff requirement per km derived for the various systems has been provided in the
table below:
System Staff Requirement (Per km)
Metro Rail 31.70
Monorail 25.20
Light Rail 19.85
BRTS 92.50
Ordinary Buses 103.25
For every bus a staff requirement of 5 has been assumed which has been segmented
upon Traffic, Workshop & Maintenance, and Administration & Account. Similarly for rail
based systems a detailed break up has been made for the staff required to carry out the
operations as well as for the maintenance works.
Another important consideration in relation to Human Resources is the remuneration, for
this purpose, a system average has been chosen based on the 6th Pay Commission. The
remuneration has been kept at an average of Rs. 9 lakhs per annum with a yearly
increment of 9%. The Assumed Unit Cost of Repair & Maintenance (2012 prices) is below:
Aspects Metro Rail Mono Rail Light Rail Unit
Building 29.48 22.11 22.11 Rs Lakh per Station
Plant & Machinery 12.57 9.43 9.43 Rs Lakh per Car
Other R&M 2.3% 2.3% 2.3% Of Building, Plant & Machinery Costs
Other O&M Costs 11% 11% 11% of Energy, Staff and R&M costs
For bus based systems, the repair and maintenance cost is assumed as:
Component Cost Unit
Building/roads 2.10 Rs Lakh per bus stop
Tyres & Tubes 1.13 Rs per effective Km
Spare Parts 1.12 Rs per effective Km
Other R&M costs 2% of building spare and Tyres

LIFE CYCLE COST ANALYSIS OF FIVE URBAN TRANSPORT SYSTEMS
Bangalore Metro Rail Corporation Limited
9
Conclusions
The LCC derived for the various modes in the hypothetical case are as follows:
Systems Number of Seats** LCC (NPV in INR Crore) LCC per seat (in INR Lakh)*
Metro Rail 25,300 7,792.49 30.80
Monorail 27,264 7,676.58 28.16
LRTS (Elevated) 28,072 6,539.18 23.29
LRTS (At Grade) 30,008 4,578.65 15.26
BRTS 29,600 6,574.69 22.21
Buses 33,040 5,727.82 17.34
Headway for Rail Based Systems has been assumed at 2.5 minutes, whereas for BRTS it has been assumed at 0.6
minutes and for Ordinary Buses at 1 minute.
*LCC per seat (in INR Lakh) at NPV for the assumed lifespan of 30 years
**Number of Seats has been ascertained by multiplying the capacity of each vehicle set with the total sets
required for the functioning of the system as ascertained in Annexure I – Rolling Stock Requirement Assessment.
It is evident from the above table that LRTS (At Grade) has the least per seat life cycle
cost of Rs 15.26 lakh. The LCC of both bus (Rs 17.34 lakhs) and BRT (Rs 22.21 lakhs) is higher
than that of LRTS (At Grade). The LCC of Metro rail is high because it is a high capacity
mode, much beyond the assumption of 15000 PHPDT made for the hypothetical case.
Therefore for a proper comparison, the LCC of various modes has been calculated at
different PHPDT levels i.e. demand or usage levels. The result is summarized in the table
below. At this hypothetical stage it has been assumed that the capacity of the modes is
not a limitation. This aspect of modal capacity and feasibility has been examined later in
this section.
PHPDT Metro Rail Monorail LRTS (Elevated) LRTS (At-Grade) BRTS Buses
3000 80.80 69.45 73.10 39.42 41.27 17.75
5000 56.94 49.24 49.32 27.59 31.81 17.78
7000 45.03 39.32 38.34 22.83 27.81 17.51
10000 36.12 32.77 28.92 18.26 24.59 17.36
12000 31.88 29.47 25.74 16.63 23.40 17.29
15000 27.98 26.93 21.86 14.91 22.17 17.30
20000 23.14 24.05 18.85 13.31 21.01 17.22
25000 19.97 22.33 16.76 12.30 20.21 17.24
30000 18.39 21.14 15.37 11.64 19.75 17.19
35000 16.89 20.34 14.33 11.20 19.37 17.19
40000 16.05 19.74 13.60 10.88 19.14 17.16
45000 15.39 19.29 13.04 10.62 18.92 17.18
50000 14.67 18.91 12.59 10.39 18.77 17.19
As evident from the above table, LRTS (At grade) remains the cheapest mode at various
levels of demand. In all cases LCC reduces substantially as the PHPDT i.e. demand
increases except in the case of the buses. Furthermore, in terms of life cycle cost,
elevated LRTS also becomes cheaper than BRTS above 15,000 PHPDT.

LIFE CYCLE COST ANALYSIS OF FIVE URBAN TRANSPORT SYSTEMS
Bangalore Metro Rail Corporation Limited
10
The table further illustrates that elevated LRTS is cheaper than Metro rail at all PHPDT levels
i.e. demand levels. Between Metro rail and Monorail, the table shows that monorail is
cheaper than Metro rail up to 15000 PHPDT. However Metro rail is cheaper than Monorail
above 15000 PHPDT. A comparison between Metro rail and Monorail is irrelevant because
monorail is a medium capacity mode and also as Monorail is recommended for special
locations where the road right of way is limited and elevated Metro rail or elevated LRTS
will be unsuitable for environmental reasons.
Impact of Capacity Limitations
In actual practice, all modes have an upper limit to capacity; for example bus with a
capacity of 80 persons operating at 1 minute headway can carry a maximum of 4,800
PHPDT and not 15,000 PHPDT as assumed in the hypothetical case. Similarly, Metro rail is a
very high capacity mode compared to Monorail, LRTS and BRTS. The limiting capacity of
each mode depends on factors such as the number of coaches in a train and the
frequency of service. The maximum capacity of a mode as per the coach configuration
of the train is presented in the table below. The LCC corresponding to each configuration
is depicted in the last column of the table.
System No. of Coaches in
the Train
Train Set Capacity
Maximum PHPDT
LCC per seat (in INR Lakh) *
Metro Rail 4 1100 26,400 21.30 6 1650 39,600 17.03 8 2200 52,800 15.07
Mono Rail 3 384 9,216 36.38 6 768 18,432 25.80 9 1,152 27,648 22.28
Light Rail elevated
2 484 11,616 33.01 4 968 23,232 19.10
Light Rail At-grade
2 484 11,616 19.90 4 968 23,232 13.23
BRTS 1 80 8,000 26.65 2 160 16,000 24.99
Ordinary Buses 1 80 4,800 17.99
Headway for Rail Based Systems has been assumed at 2.5 minutes, whereas for BRTS it has been assumed at 0.6
minutes and for Ordinary Buses at 1 minute.
*LCC per seat (in INR Lakh) at NPV for the assumed lifespan of 30 years
It may be noted that with the increasing mode capacity and hence PHPDT, LCC for
Monorail and LRT fall substantially in comparison to Metro rail, BRTS and Bus Services.

TABLE OF CONTENTS
ACKNOWLEDGEMENT ............................................. ERROR! BOOKMARK NOT DEFINED.
EXECUTIVE SUMMARY ..................................................................................................... 1
1 INTRODUCTION ....................................................................................................... 15
2 APPROACH AND METHODOLOGY ........................................................................ 18
2.1 MODULE I - SCOPE AND OBJECTIVE FINALIZATION ................................................................... 18
2.2 MODULE II - PRIMARY AND SECONDARY INFORMATION COLLECTION ....................................... 20
2.3 MODULE III - LIFE CYCLE COST ANALYSIS ................................................................................ 21
3 METRO RAIL SYSTEM ............................................................................................... 23
3.1 ABOUT THE SYSTEM ................................................................................................................. 23
3.2 CAPEX INFORMATION ........................................................................................................... 23
3.3 OPERATION & MAINTENANCE COST INFORMATION ................................................................. 25
4 MONORAIL SYSTEM ................................................................................................ 27
4.1 ABOUT THE SYSTEM ................................................................................................................. 27
4.2 CAPEX INFORMATION ........................................................................................................... 28
4.3 OPERATION & MAINTENANCE COST INFORMATION ................................................................. 29
5 LIGHT RAIL SYSTEM.................................................................................................. 30
5.1 ABOUT THE SYSTEM ................................................................................................................. 30
5.2 CAPEX INFORMATION ........................................................................................................... 30
5.3 OPERATION & MAINTENANCE COST INFORMATION ................................................................. 31
6 BUS RAPID TRANSIT ................................................................................................. 33
6.1 ABOUT THE SYSTEM ................................................................................................................. 33
6.2 CAPEX INFORMATION ........................................................................................................... 34
6.3 OPERATION & MAINTENANCE COST INFORMATION ................................................................. 35
7 ORDINARY BUS SERVICES ....................................................................................... 36
7.1 ABOUT THE SYSTEM ................................................................................................................. 36
7.2 CAPEX INFORMATION ........................................................................................................... 36
7.3 OPERATION & MAINTENANCE COST INFORMATION ................................................................. 38
8 ASSUMPTIONS FOR LIFE CYCLE COST ANALYSIS ................................................... 42
8.1 CONSTRUCTION DURATION, PHASING AND PRICE ESCALATION ................................................ 42
8.2 REQUIREMENT OF ROLLING STOCK AND BUSES ......................................................................... 43
8.2.1 Headway ....................................................................................................................... 43 8.2.2 Average Speed ............................................................................................................ 44 8.2.3 Distance between Stations/Shelters ......................................................................... 45 8.2.4 Carrying Capacity ....................................................................................................... 45 8.2.5 Train Set configuration ................................................................................................ 46 8.2.6 Requirement of Rolling Stock ..................................................................................... 47
8.3 DEPOT & WORKSHOPS ........................................................................................................... 49
8.4 SYSTEM WISE CAPEX ASSUMPTIONS ........................................................................................ 49
8.4.1 Metro Rail ....................................................................................................................... 49 8.4.2 Mono Rail ....................................................................................................................... 52 8.4.3 Light Rail ......................................................................................................................... 53

LIFE CYCLE COST ANALYSIS OF FIVE URBAN TRANSPORT SYSTEMS
Bangalore Metro Rail Corporation Limited
12
8.4.4 Bus Rapid Transit ........................................................................................................... 57 8.4.5 Ordinary Bus Service .................................................................................................... 57
8.5 SYSTEM WISE OPERATION & MAINTENANCE COST ASSUMPTIONS .............................................. 58
8.6 ENERGY COST........................................................................................................................ 58
8.6.1 Rail Based Systems ....................................................................................................... 58 8.6.2 Bus Based Systems ........................................................................................................ 59
8.7 HUMAN RESOURCE COST ....................................................................................................... 60
8.8 REPAIR AND MAINTENANCE COST .......................................................................................... 61
8.8.1 R&M Cost for Rail Based Systems .............................................................................. 61 8.8.2 R&M Cost for Bus Based Systems ............................................................................... 61
8.9 REPLACEMENT COST .............................................................................................................. 62
8.10 FINANCIAL ASSUMPTIONS ....................................................................................................... 63
8.10.1 Taxes & Duties ............................................................................................................... 63 8.10.2 Escalation Rate ............................................................................................................. 64 8.10.3 Interest Rate .................................................................................................................. 64 8.10.4 Discount Rate................................................................................................................ 64 8.10.5 Debt Equity Ratio ......................................................................................................... 64
8.11 DEPRECIATION ....................................................................................................................... 65
9 LIFE CYCLE COST ANALYSIS ................................................................................... 66
9.1 RESULTS OF THE HYPOTHETICAL CASE ....................................................................................... 66
9.2 SCENARIOS UNDER THE HYPOTHETICAL CASE AT DIFFERENT DEMAND LEVELS .............................. 66
9.2.1 Scenario I – 5,000 PHPDT ............................................................................................. 67 9.2.2 Scenario II – 10,000 PHPDT .......................................................................................... 67 9.2.3 Scenario III – 12,000 PHPDT ......................................................................................... 67 9.2.4 Scenario IV – 17,000 PHPDT ........................................................................................ 68 9.2.5 Scenario V – 27,000 PHPDT ......................................................................................... 68
9.3 SUMMARY OF PER SEAT LCC OF SELECTED SYSTEMS ................................................................ 68
9.4 IMPACT OF CAPACITY LIMITATIONS .......................................................................................... 69
ANNEXURE I – ROLLING STOCK REQUIREMENT ASSESSMENT ...................................... 73
ANNEXURE II – HUMAN RESOURCE REQUIREMENT DETAIL .......................................... 75
ANNEXURE III – THE LCCA CALCULATION TABLES ....................................................... 76

LIFE CYCLE COST ANALYSIS OF FIVE URBAN TRANSPORT SYSTEMS
Bangalore Metro Rail Corporation Limited
13
LIST OF TABLES
Table 1-1: Traffic and Transportation Policies and Strategies in Urban Areas (May 2008).... 15
Table 1-2: Selection Criteria of Mass Rapid Transit Mode ........................................................... 16
Table 3-1: Metro Rail Capacity......................................................................................................... 23
Table 3-2: Capital Cost Pricing Comparison ................................................................................. 24
Table 3-3: DMRC O&M Cost (2004-10) ............................................................................................ 25
Table 3-4: Unit Repair and maintenance cost of DMRC ............................................................. 26
Table 4-1: Kozhikode Monorail Capital Expenditure Estimates .................................................. 28
Table 4-2: Delhi Monorail (3 – Corridor/47.8 Km) Capital Expenditure Estimates ................... 28
Table 4-3: Shastri Park - Trilokpuri Monorail Capital Expenditure Estimates .............................. 29
Table 4-4: Kozhikode Monorail O&M Cost Estimates ................................................................... 29
Table 5-1: Delhi LRT Capital Estimates ............................................................................................. 31
Table 6-1: Comparative Tabular Representation of BRTS Capital Costs .................................. 34
Table 7-1: Commonwealth Games Bus Acquisition Costs .......................................................... 37
Table 7-2: Commonwealth Games Depot Construction Costs ................................................. 37
Table 7-3: DTC - O&M Cost ............................................................................................................... 38
Table 7-4: BEST - O&M Costs .............................................................................................................. 38
Table 7-5: BEST O&M Cost Estimation 2006-11 ............................................................................... 39
Table 7-6: O&M Costs for 269 buses for 2009 (ADB Toolkit) ......................................................... 40
Table 7-7: O&M Cost/ Physical Data for Bus Systems (CIRT, September 2011) ....................... 40
Table 8-1: Assumed Headway for the Urban Transport Systems................................................ 44
Table 8-2: Assumed Average Speeds for the Urban Transport Systems ................................... 44
Table 8-3: Assumed Distance between Stations/Shelters for the Urban Transport Systems . 45
Table 8-4: Assumed Carrying Capacity for the Urban Transport Systems (Per coach/car) . 46
Table 8-5: Maximum PHPDT capacity of different modes at varying train configuration .... 46
Table 8-6: Assumed Vehicle Configurations for Urban Transport Systems ............................... 47
Table 8-7: Rolling stock requirement for the Hypothetical Case ............................................... 47
Table 8-8: Assumed Depot and Workshop Requirements for Urban Transport Systems ....... 49
Table 8-9: Assumed CAPEX of Metro Rail for LCCA based on DMRC Ph-III assumptions ..... 49
Table 8-10: Assumed CAPEX for 20 km Elevated Metro Rail system for LCCA ........................ 51
Table 8-11: Assumed CAPEX of Monorail system for LCCA based on Kozhikode DPR ......... 52
Table 8-12: Assumed CAPEX for 20 km Monorail system for LCCA ........................................... 52
Table 8-13: Assumed CAPEX of Delhi LRT proposal with updated cost ................................... 53
Table 8-14: Assumed CAPEX of At Grade Light Rail System for LCCA...................................... 54
Table 8-15: Assumed CAPEX of Elevated Light Rail Transit System for LCCA .......................... 54
Table 8-16: Comparative Assumptions for Elevated Rail-based Systems (INR in Crores) ..... 55
Table 8-17: Assumed per km and 20 km stretch cost for rail-based systems (INR in Crores) 56

LIFE CYCLE COST ANALYSIS OF FIVE URBAN TRANSPORT SYSTEMS
Bangalore Metro Rail Corporation Limited
14
Table 8-18: Assumed CAPEX of Bus Rapid Transit system for LCCA .......................................... 57
Table 8-19: Assumed CAPEX of Ordinary Bus system for LCCA ................................................. 57
Table 8-20: Assumed Human Resource Requirement for the Urban Transport Systems ....... 60
Table 8-21: Unit Cost of Repair & Maintenance (2010 Prices) of DMRC .................................. 61
Table 8-22: Assumed Unit Cost of R&M for Metro Rail System (2012 prices) ............................ 61
Table 8-23: Assumed Unit Cost of R&M for Mono/Light Rail System (2012 prices).................. 61
Table 8-24: Unit cost of Repair and Maintenance (2011 prices CIRT analysis) ....................... 62
Table 8-25: Assumed Unit Cost of R&M for Bus Based Systems .................................................. 62
Table 8-26: Assumed Time and Percentage Replacement for Rail Based Systems .............. 62
Table 8-27: Assumed Time and Percentage Replacement for Bus Based Systems ............... 62
Table 8-28: Assumed Customs Duty for Urban Transport Systems ............................................. 63
Table 8-29: Assumed Excise Duty for Urban Transport Systems .................................................. 63
Table 8-30: Assumed VAT for Urban Transport Systems................................................................ 64
Table 8-31: Assumed Sales Tax for Urban Transport Systems ...................................................... 64
Table 8-32: Assumed Works Contract Tax for Urban Transport Systems ................................... 64
Table 8-33: Assumed Depreciation for the Urban Transport Systems ....................................... 65
Table 8-34: Assumed Depreciation for the Rail based Systems post Refurbishment ............. 65
Table 9-1: Results of the per seat LCC for the Hypothetical Case ............................................ 66
Table 9-2: Maximum PHPDT capacity of different modes at varying train configuration .... 69
Table 9-3: Metro Rail– per Seat LCC (in Rs Lakhs) at different PHPDT ....................................... 70
Table 9-4: Mono Rail - Per Seat LCC (in Rs Lakhs) at different PHPDT ....................................... 70
Table 9-5: Elevated Light Rail - Per Seat LCC (in Rs Lakhs) at different PHPDT ........................ 71
Table 9-6: At Grade Light Rail - Per Seat LCC (in Rs Lakhs) at different PHPDT ....................... 71
Table 9-7: BRTS - Per Seat LCC (in Rs Lakhs) at different PHPDT ................................................. 71
Table 9-8: Ordinary Bus Service - Per Seat LCC (in Rs Lakhs) at different PHPDT .................... 72
Table 9-9: Summarized view of impact of mode capacity limitations on the LCC per seat72
LIST OF FIGURES
Figure 1: Approach & Methodology Flowchart ............................................................................ 19

LIFE CYCLE COST ANALYSIS OF FIVE URBAN TRANSPORT SYSTEMS
Bangalore Metro Rail Corporation Limited
15
1 INTRODUCTION
The World Bank, in its “Strategy Note on Urban Transport in India”, holds firmly to the notion
that it is crucial that India implement efficient and reliable Urban Passenger Transport
Systems to ensure the sustenance of a high growth rate and alleviation of poverty. It
further emphasises that such impact of urban transport on poverty reduction happens
both through its indirect effects as a stimulator of poverty reducing growth and through its
direct effects on the quality of life of the people. The McKinsey Report “India’s urban
awakening: Building inclusive cities, sustaining economic growth”1 estimates by 2030 India
will have more than 68 cities having a population of above a million people and 590
million Indians will be staying in cities and towns, twice the American population today.
Further, cities’ contribution to the GDP growth will be nearly 3/4th and more than 70% of
new employment will be generated there. McKinsey’s assessment of urban transport
infrastructure requirement is humongous – just to take two critical parameters, the report
assesses the need for constructing 2.5 billion square meters of roads and 7,400 Km of
Metro and Subways in the twenty year time-frame ending 2030.
The urban transport scenario in India is unsatisfactory - there is severe quantity and quality
deficit. The country is unmistakingly on the path of rapid increase of motorisation, which
has accelerated in the past two decades. A study by Ministry of Urban Development
(MOUD), Government of India, presents the following dismal scenario of the share of
public transport in different classes of cities:2
Table 1-1: Traffic and Transportation Policies and Strategies in Urban Areas (May 2008)
City
Category
City Population Range
(in Lac)
WSA/MOUD
2007 (%)
RITES Study
1994 (%)
1 < 5.0 0.0 – 15.6 14.9 – 22.7
2 5.0 – 10.0 0.0 – 22.5 22.7 – 29.1
3 10.0 – 20.0 0.0 – 50.8 28.1 – 5.6
4 20.0 – 40.0 0.2 – 22.2 35.6 – 45.8
5 40.0 – 80.0 11.2 – 32.1 45.8 – 59.7
6 > 80.0 35.2 – 54.0 59.7 – 78.7
The current country status is one of huge public transport infrastructure deficit and equally
troublesome lack of last mile connectivity and safe infrastructure for non-motorised
transport. Obviously, the country is in need of fast movement away from motorization to
rapid provisioning of public transport.
The choice of the Urban Transport System is the key decision point for cities, states and the
central government. It is most relevant because different classes of cities and different
1 “India’s Urban Awakening: Building inclusive cities, sustaining economic growth”, McKinsey Global
Institute (April 2010) 2 Page 24 “Recommendations of Working Group on Urban Transport for 12th Five Year Plan”

LIFE CYCLE COST ANALYSIS OF FIVE URBAN TRANSPORT SYSTEMS
Bangalore Metro Rail Corporation Limited
16
corridors in the same city require different public transport solutions. The country has so far
failed to develop objective criteria for the selection of public transport modes. The
Working Group for Urban Transport for the 12th Five Year Plan has suggested a selection
criteria based on the PHPDT, City/Town Population and Average Motorised Trip Length.
The Working Group suggested criteria are as follows:
Table 1-2: Selection Criteria of Mass Rapid Transit Mode
Mode choices PHPDT (2021) Population
(2011 Census; in
millions)
Average
Motorised
Trip Length (Km)
Metro Rail >= 15,000 for at least
5 km continuous length
>= 2 > 7 – 8
LRT (Primarily at grade) =< 10,000 > 1 > 7 – 8
Monorail =< 10,000 > 2 About 5 – 6
Bus Rapid Transit System >= 4,000 and up to
20,000
> 1 > 5
Organised City Bus
Service
> 1 lac
(Hilly towns – 50,000)
> 2 – 3
The above, for the first time provides a tool for decision taking. Nonetheless, it will be
appropriate that the above criteria is superimposed with the “Cost Based Comparative
Approach” to arrive at the proposed appropriate mix of public transport systems, to
decide one system in preference of the others and to arrive at transparently determined
pricing mechanism for different urban transport systems. The current approach which
decision takers follow for metro rail, monorail and BRTS is a DPR based approach. A
project is approved based on upfront investment costs (EPC costs) associated with such
systems. For buses it is more “top down” largesse under JNNURM, while LRT as a system has
not yet been introduced in the modern avatar.
This study focussed at introducing a scientific cost based approach of arriving at “The Full
Life Cycle Cost of different systems”- thereby making “Life Cycle Costs of the Systems”
integral to informed decision taking. From this perspective the study marks a paradigm
shift and IUT believes that the final outcome of this report shall be the first tool available for
informed decision making in the country by the policy planners and the union/state/city
governments to make the choice of a particular urban transport mode or a combination
of that.
In addition to EPC costs, PHPDT and route length linked Operations and Maintenance
costs, interest and other associated costs and replacement cost during the project life
period have been considered integral to such an analysis. The emphasis has been to
ensure that these costs are embedded in the process of calculating the “composite Life
Cycle Cost” and “Unit Life Cycle Cost” duly taking into account all internalities and
externalities, to arrive at a better understanding of how the sustenance of such a system
impact the economies of scale with the purpose of assisting the correct decision making
at the time of investment. Equally importantly, the study has focused on seeing the impact

LIFE CYCLE COST ANALYSIS OF FIVE URBAN TRANSPORT SYSTEMS
Bangalore Metro Rail Corporation Limited
17
of external environment changes like changing inflation index, variation in interest rates
and fluctuation of interest rates etc. that often influence and impact the systems stability
and cost over its operational life. The purpose of this exercise has been to ensure that
commercial decision-making is informed more particularly from the point of view of
appropriate price discovery and consequent transparent subsidy regime definition, if such
a situation emerges.
The prime emphasis of the analysis of the “Life Cycle Cost of Public Transport Systems” has
been its role in choosing a specific public transport mode suitable for a particular city or
for a particular corridor of a city. Apart from being a key decision point in investment
decisions, Life Cycle Cost Analysis as finally arrived at shall be critical input to the
government and service providers in transparent pricing of the services/transparent
provisioning of subsidy on the pricing regime.
Based on comparison of the LCC across the modes i.e. the lowest overall cost while
achieving the required level of service in a hypothetical controlled context, IUT has
evaluate, the following principal modes of public transport:
Metro Rail System
1
Mono Rail System
2
Light Rail System
3
Bus Rapid Transit System
4
Ordinary Bus Service
5

LIFE CYCLE COST ANALYSIS OF FIVE URBAN TRANSPORT SYSTEMS
Bangalore Metro Rail Corporation Limited
18
2 APPROACH AND METHODOLOGY
“Life-cycle costing” (LCC) is an economic evaluation tool used to compare available
alternatives. Our approach for this study was developed carefully to meet the key
objectives of the engagement in an organized, efficient and timely manner. Thus the
approach followed built on success factors identified by IUT and the working team for the
study from their previous experience of similar assignments. It is a combination of
approach and skill that helps in delivering the assignment requirements.
A key factor for this assignment was to collect information related to Capital Expenditure
and Operating & Maintenance costs from various primary and secondary sources. In our
approach, a multi-disciplinary team was brought together significant national and
international relevant experience in urban transport, O&M cost optimization of transport
modes, financing transport projects, PPP, capacity building etc. Also the team included
two uninitiated young members to bring out of box thinking.
A modular approach has been the key differentiator of our approach to this assignment;
which has ensured in keeping a check the overall quality of the final output. The study has
been carried out principally following a modular approach. The key modules are:
2.1 Module I - Scope and Objective Finalization
For the purpose of this study, five key urban public transport modes were selected which
are – Metro Rail, Monorail, Modern Light Rail, Bus Rapid Transit and Ordinary Bus Service.
The chosen systems represent “the big picture” of public transport in urban space. Since
each of the selected urban transport modes has a different cost (both initial capital cost
and recurring operating and maintenance cost), life, carrying capacities etc.; their life
cycle cost comparison presented special difficulties. Because of which, within the
common analysis parameters, the per unit life cycle cost too was attempted.
At the beginning of this research, a hypothetical case was assumed based on which the
initial LCC of the urban transport systems has been calculated. A hypothetical case of 20
Module I
Scope and Objective Finalization
Module II
Primary and Secondary Information Collection
Module III
Life Cycle Cost Analysis

LIFE CYCLE COST ANALYSIS OF FIVE URBAN TRANSPORT SYSTEMS
Bangalore Metro Rail Corporation Limited
19
km corridor having a PHPDT of 15,000 is considered for which the LCC has been
calculated for 30 year duration for each system. Towards the end of the study, the results
have been applied to real life scenarios. The detailed methodology followed for the study
is represented below:
Figure 1: Approach & Methodology Flowchart

LIFE CYCLE COST ANALYSIS OF FIVE URBAN TRANSPORT SYSTEMS
Bangalore Metro Rail Corporation Limited
20
It is important to note that a system like metro rail has a civil structure (approximate 50%
of CAPEX) who life span runs in many decades (more than 50 years), whereas a system
like normal urban bus service has a life span of just 10 years. Various components of
different systems show substantial variability in terms of their life and such variability has
been carefully accounted for. As a part of analysis due care has also been taken to
emphasise how different systems with varying life and varying capacity limitation behave
for life cycle cost analysis.
2.2 Module II - Primary and Secondary Information Collection
The landscape of urban transport in India presents a special difficulty with regard to robust
data collection.
The oldest and most prevalent system of urban transport in the country is ordinary bus
service and the nation, till very recently did not have an “Urban Bus Specification”. The
legacy services of BEST, DTC and other major cities used to run on buses made on truck
chassis manufactured by Tata Motors and Ashok Leyland. These services had low
capacity, low life spans and very high O&M costs. The man-power to bus ratio in these
institutions too are abnormally high at 10 persons per bus.
The bus landscape has changed somewhat with the introduction of low-floor buses, AC
buses and higher life span Volvo buses. At one end of cost efficiency are Bangalore City
Bus Service and the first cluster bus services run by DIMTS in Delhi, and at the other end are
old legacy urban bus transport services. As a part of the study, all these aspects needed
harmonisation and normalization from cost perspective and the same has been carefully
attempted.
On the contrary, in the case of Metro rail, the highest of the urban transport hierarchies
has construction costs data and stabilised O&M cost data only available from one city
and one organisation (DMRC). Of the other operational systems – Kolkata cost data is not
comparable and Bengaluru’s 6.7 kilometre long operational stretches is just one year old.
Nonetheless, in case of metro rail estimated capital costs and estimated O&M cost data is
available from the completed DPRs of a dozen cities. IUT during this module started with
DMRC data, analysed other proposed system’s data and has carefully arrived at its own
normative numbers.
India has no operational monorail system. As yet there is no clarity available as to what is
going to be the completed unit cost of construction of the Mumbai Monorail project.
However, updated (December 2011) prefeasibility cost data for monorail in Delhi (Shastri
Park to Trilokpuri) and DPR cost data (May 2012) for proposed monorail in Kozhikode are
also available, both estimated CAPEX and OPEX. IUT has used the available data to
arrive at its normative data post analysis of such cost data, duly comparing it with

LIFE CYCLE COST ANALYSIS OF FIVE URBAN TRANSPORT SYSTEMS
Bangalore Metro Rail Corporation Limited
21
internationally benchmark-able data. In the case of monorail, both CAPEX and OPEX
have variability based upon the systems and technology platforms selected and IUT has
tried to harmonising the same.
Modern light rail is so far an alien system for the country. The only domestic cost data
available is a dated DPR (2007-08 price level) for approximately 45 km of light rail in Delhi.
Apart from updating CAPEX and OPEX data in this DPR, IUT has also attempted at learning
and gain insight from recent developments in the arena from Europe, Canada, Australia
and other countries. An effort has been made to arrive at normative cost, duly taking into
account the technological changes and growing technological platforms for LRT systems.
Likewise, BRTS as a system is new to India and except Delhi and Ahmedabad there are no
operational systems. Nonetheless various DPR figures are available for CAPEX of fixed
infrastructure. IUT has taken into account these numbers and the assumptions available in
the latest reports of working group on urban transport for the 12th Five Year Plan. For BRTS
allowances have been made for O&M data of depots, workshops and control centre.
During the stage of the preparation of the Intermediate Report, primary data was
collected through various domestic agencies such as Delhi Metro Rail Corporation
(DMRC), Delhi Integrated Multimodal Transit System (DIMTS), Brihan Electricity and State
Transport (BEST), Delhi Transport Corporation (DTC), Bangalore Metropolitan Transport
Organisation (BMTC), Larsen and Toubro (L&T) etc. The relevant data from feasibility
reports, detailed project reports and completed costs wherever available too has been
considered. The primary data was captured for all the cost aspects associated with the
particular system operator and classified as direct and indirect costs. In addition,
information was also collected for the trend in macroeconomic indicators such as interest
rates and inflation index. During this stage, information was also collected with regards to
the incorporation of inflation index by the urban transport operators in their actual costs
for the next stage of analysis.
The culmination of this module was presented as the interim report, which inter-alia,
among other aspects, also provided detailed cost assumption for each mode for
derivation of the Life Cycle Cost Analysis (LCCA).
2.3 Module III - Life Cycle Cost Analysis
The first task of this module has been to finalize the mechanism for adjusting the impact of
inflation index on the direct & indirect costs of the selected systems. Since the O&M cost
of any urban transport system largely varies due to inflation, rise in ridership and ageing of
system, a regression was done to generate an equation defining the relationship of
inflation, ridership, and ageing of systems to the O&M costs. For all the selected systems, it
was assumed that the full capacity will be reached within five years of their

LIFE CYCLE COST ANALYSIS OF FIVE URBAN TRANSPORT SYSTEMS
Bangalore Metro Rail Corporation Limited
22
commencement of operation, thus assigning the variation in costs with the change in
inflation. A scientific analysis of inflation has been done for all the five major areas –
manpower costs, energy costs (Oil, CNG or electricity as the case may be), normal repairs
and maintenance costs, major overhauling costs and replacement costs over their 30
year operation cycle. The special problem in this inflation analysis is that all five vary in a
non-linear manner.
As a final outcome of this study, an excel model of life cycle costs for all the selected five
urban transport systems has been developed. Post this; the present value of this cost was
derived. An analysis has been performed to calculate the per seat life cycle cost for all
the five systems.
While making the 30 year life cycle cost calculations, two scenarios have been
considered. The first scenario considers only the direct costs, whereas the second scenario
considers both the direct and a suitable allocation of indirect costs.
At the end of this stage, sensitivity analysis for the selected fixed parameters has been
included.

LIFE CYCLE COST ANALYSIS OF FIVE URBAN TRANSPORT SYSTEMS
Bangalore Metro Rail Corporation Limited
23
3 METRO RAIL SYSTEM
3.1 About the system
Metro Rail is the highest in the hierarchy of public transport systems. It normally runs at fully
grade-separated right-of-ways. Metro rail is a high-capacity system with a train consisting
of four to ten cars. Metro rail systems require an exclusive, completely grade-separated
alignment, thru subways or elevated structures. The carrying capacity of Metro rail can be
up to 70,000- 80,000 per hour per direction traffic (PHPDT) depending upon the capacity
of rolling stock used, the train configuration and the installed systems (signalling and
telecom to provide minimum possible headway).
Table 3-1: Metro Rail Capacity
Metro Rail Carrying Capacity (passenger/hour) PHPDT
Metro Rail Up to 70,000-80,000
Metro rail as a system is costly to build, operate and maintain. Nonetheless, for corridors
with a Per Hour per Direction Traffic (PHPDT) of over 20,000, it is the only system of urban
transport which works.
Metro Rail is the most prevalent urban transport system in the world after urban bus and
has gained further momentum in the recent years particularly due to upswing in the
global crude prices. At present more than 175 cities in the world have operational metro
rail, while 50 more are in the process of constructing it – 25 of them in China and 9 of them
in India itself.
Depending upon grade (elevated or underground), the quality and size of the stations,
type of rolling stock (including automation features), signalling and other systems, ATS, ATP
and ATO, both the CAPEX and the OPEX of metro rail show great variance.
3.2 CAPEX Information
The Indian tryst with capital cost estimation of Metro Rail started with Phase I of Delhi
Metro. Capital cost estimates of Bangalore, Hyderabad and Chennai DPRs were based
on awarded tender costs of DMRC Phase I. Recent capital costs like Pune, Ludhiana,
updated Kochi, Lucknow, Jaipur, Navi Mumbai and Delhi Metro Phase III, have at its base
the completion cost data of DMRC Phase II.
Though land costs in different cities are different, for a logical comparison, IUT has
harmonised the land cost through averaging out and a specific percentage has been
taken as the land cost. Though it has been possible to collect all the DPR’s capital cost
data, a representative sample of unit rates is provided below. Some of the estimates for
obvious reasons are lump sum estimates (e.g. bridges, depot and OCCs) and have been
subsequently averaged at the time of making the assumptions:

LIFE CYCLE COST ANALYSIS OF FIVE URBAN TRANSPORT SYSTEMS
Bangalore Metro Rail Corporation Limited
24
Table 3-2: Capital Cost Pricing Comparison
Item Unit DMRC Ph II
at Jan 2010
levels (INR
In Crore)
DMRC Ph III
at Jan 2010
levels (INR
in Crore)
HMRL Ph III
at 2005
price level
(INR in
Crore)
Kochi Metro
at May 2005
price level
(INR in
Crore)
Alignment and Formation
Underground section by Cut &
Cover excluding Station length
R. Km. 91.94 96.34
Tunnelling by TBM R. Km. 144.48 137.44
Ramp (Underground) R. Km. 42.54
Elevated viaduct section R. Km. 28.90 28.45 17.00 15.00
Special Spans R. Km. 39.90 17.00
Ramp (Elevated) R. Km. 17.46 17.00
At-Grade R. Km. 6.15
Important bridges LS 76.28 65.00
OCC Building LS 50.00
Station Buildings
Underground Station Each 157.61 107.63
Elevated stations 10.00
Type (A) way side Each 13.13 13.61 10.00
Type (B) Way side with signalling Each 14.45 14.97
Type (C), Terminal station Each 15.76 16.32
E&M Works
Underground station (E&M, Lifts,
Escalators, DG sets, UPS, TVS,
ECS etc.)
Each 49.08
Elevated station (E&M, Lifts,
Escalators, DG sets etc.)
Each 6.22
Depot LS 38.00 40.00 50.00 100.00
Permanent Way
Ballast less/Ballasted track for
elevated , underground and at
grade alignment
R. Km. 6.50 6.17 4.95/1.44 2.95/2.97
Traction & power
Under Ground Section R .Km. 13.79 12.13
Elevated & at grade section R. Km. 6.57 8.15 5.00 10.00
Lift (for elevated stations) Each 0.26 0.28 0.20
Escalator (for elevated stations) Each 1.05 0.68 0.80 0.80
Signalling and Telecom.
Signalling R. Km. 15.10 7.72 11.50 3.50
Telecom Each Stn. 2.65 1.50
Automatic fare collection
Underground stations Each 4.27 2.82
Elevated stations Each 3.28 2.82 2.50 1.25
R & R incl. Hutments and road
restoration etc.
R. Km. 2.94 1.15 0.99
Misc. Utilities, other civil works
such as median, road signage
etc.
R. Km. 3.94 3.00 2.50 3.00
Electrical Utilities R. Km. 2.64
Telecom Utilities R. Km. 0.42
Rolling Stock (SG) Each 5.58 8.00 4.90 4.00
General Charges incl. Design
charge on all items except land
@ 3% @ 3% @ 5% @ 5%
Contingencies @ 3 % @ 3 % @ 3 % @ 3 %
As completion costs of Ph-II of Delhi Metro and the estimated costs of Ph-III is the latest
and most of the DPRs too have been prepared by DMRC, an average two has been used
for making the capital cost assumptions at 2012 price. For bringing the cost to current
level, a 5% annual escalation has been assumed.

LIFE CYCLE COST ANALYSIS OF FIVE URBAN TRANSPORT SYSTEMS
Bangalore Metro Rail Corporation Limited
25
3.3 Operation & Maintenance Cost Information
The oldest operating metro rail system in the country is Kolkata, whose O&M cost is totally
outside the comparative framework because of dated systems and very high per
kilometre manpower deployed as compared to the modern systems. Bangalore has so far
started operations of 6.7 km of network, which has just completed first year of operations
(operations started in October 2011), and both its fixed infrastructure and systems are
currently in defects liability period and do not reflect the representative cost structure.
As such only stabilised O&M cost is of Delhi Metro and many years data is available from
this system. IUT has attempted harmonising of the O&M cost of DMRC for every year with
the total passenger carried and the total length of the operating network during the year.
It can be seen from the table that staff cost and energy costs followed by repair and
maintenance costs are the three key determinants of the O&M cost. But for subsidised
energy (at no profit no loss), the energy costs have potential to become the highest
contributor to O&M Cost.
Also, as the system becomes older, man power cost shall increase (because of more
number of services to accommodate growing commuter numbers) and the repairs and
maintenance cost too will increase because of aging and extensive utilisation effect.
During the thirty year time span, there will also be need for replacement and refurbishing
of systems including rolling stock. Rolling stock can be expected to have a life of 25 years
(can be extended further with refurbishing) and S&T, Traction and other systems have a
lesser time span of around 15-20 years.
A calculation of per km O&M cost for various years of Delhi Metro is given below.
Table 3-3: DMRC O&M Cost (2004-10)
Particulars (In Rs. Crore) 2004-
05
2005-
06
2006-
07
2007-
08
2008-
09
2009-
10
Energy Cost 9.58 28.56 48.06 51.48 70.72 80.31
Repair & Maintenance
Building 2.52 6.47 13.00 15.09 18.83 20.64
Plant & Machinery 6.69 7.01 11.34 24.44 45.34 38.26
Other R&M Cost 0.37 0.60 1.15 1.28 1.24 0.84
Total Repair & Maintenance 9.59 14.08 25.49 40.81 65.43 59.74
Staff Costs 17.49 26.34 37.24 48.63 66.89 93.42
Other Costs 7.45 11.65 15.18 17.34 20.46 22.67
Land License Fee - - - - 1.80 1.20
Printing & Stationery - - - - 1.86 1.92
Vehicle Hire - - - - 2.59 5.58
Telephone - - - - 0.94 1.28
Insurance - - - - 0.61 0.65
Security – CISF - - - - 3.56 2.58
Misc. Admn. Expenses - - - - 9.09 9.46

LIFE CYCLE COST ANALYSIS OF FIVE URBAN TRANSPORT SYSTEMS
Bangalore Metro Rail Corporation Limited
26
Particulars (In Rs. Crore) 2004-
05
2005-
06
2006-
07
2007-
08
2008-
09
2009-
10
Total Other Costs 7.45 11.65 15.18 17.34 20.46 22.67
Total Cost 44.11 80.63 125.97 158.26 223.5 256.14
Route Km 26 56 65.1 65.1 65.1 70.36
Average O&M Cost Rs. Crore per
Km/annum
1.70 1.44 1.94 2.43 3.43 3.64
Percentage Variation -15% 34% 26% 41% 6%
As evident form the above table, Staff cost is the most significant O&M cost in the list
which was overtaken by energy cost in between but has remained the highest in 2009-10.
Energy cost in the initial years of operations where less and has significantly increased over
the period of five years. Per km O&M cost of DMRC has increased at an average 16.82%
in the given five year data.
For the purpose of this study, per kilometre O&M cost of DMRC has been taken at 2010
prices and has been further escalated to arrive at 2012 prices. The O&M cost for the base
year of operation i.e. year 2016 has been assumed at about Rs 166 Crore. A further micro
analysis of the Repair and Maintenance cost of DMRC has been done to derive the unit
R&M costs and is presented in the table below:
Table 3-4: Unit Repair and maintenance cost of DMRC
Particulars (In Rs Crore) 2004-
05
2005-
06
2006-
07
2007-
08
2008-
09
2009-
10
Total Repair & Maintenance 9.59 14.08 25.49 40.81 65.43 59.74
Building 2.52 6.47 13.00 15.09 18.83 20.64
Plant & Machinery 6.69 7.01 11.34 24.44 45.34 38.26
Others 0.37 0.60 1.15 1.28 1.25 0.84
Number of Stations 23.00 49.00 57.00 57.00 65.00 72.00
Number of Depots 3.00 3.00 3.00 3.00 3.00 3.00
Rolling Stock 100 160 280 280 300 320
Unit cost of Maintenance
Building Rs Lakh per station 0.11 0.13 0.23 0.26 0.29 0.29
Plant & Machinery Rs Lakh per car 0.07 0.04 0.04 0.09 0.15 0.12
Other costs - % of Building & P&M Costs 4.02% 4.47% 4.73% 3.23% 1.95% 1.42%
Thus the above table depicts that the per station maintenance cost of buildings has
increased but has stagnated at about Rs 29 lakh per station per annum. Similarly the plant
and machinery cost which is directly proportional to the rolling stock requirements has
increased steadily after the completion of the initial Defect Liability Period (DLP) and has
become an average of Rs 12.5 Lakh per car per annum. The other costs pertaining to
repair and maintenance has remained low in the later years and were average 2.2% of
the building and plant and machinery cost in the last three years of the available data.

LIFE CYCLE COST ANALYSIS OF FIVE URBAN TRANSPORT SYSTEMS
Bangalore Metro Rail Corporation Limited
27
4 MONORAIL SYSTEM
4.1 About the system
The Monorail is a sleek, elevated transit system which can be built to efficiently serve areas
where metro rail cannot penetrate. As it requires a very narrow right of way, and can
navigate such areas which Metro Rail cannot, it can comfortably be built in an area
dominated by high-rises and sharp turns.
The cost of monorail system lies between the cost of LRT and elevated Metro rail. It can
be a feeder to metro rail. It also has applicability for specific corridors in second and third
tier cities, particularly where metro rail is not justified or feasible and bus services are sub
optimal option. Even in metropolitan cities, where Metro Rail covers the main arterial
networks, it can play the role of feeder service in carefully identified corridors.
At present one monorail system is under construction in Mumbai- and its PHPDT in first and
last year of Project life is estimated between 7000-8500 PHPDT. Similarly, the latest DPR of
Kozhikode puts the first and last year peak PHPDT as 7000-11500 approximately. A three
car mono rail system has been planned both for Mumbai and Kozhikode.
Monorail and elevated LRT are similar in that they operate on elevated guide ways but
monorail operates on guide way requiring only one beam (normally concrete) and mono
rail cars have rubber tires. The beam typically measures around three feet in width. Two
ways system requires two beams separated 5 m apart. A three car system depending
upon specification can carry between 400-500 passengers. Its traction is typically 750 volt
DC. It can be configured to run as driver less system.
Monorail systems can realize a number of benefits when compared to elevated LRT:
Better performance on steep grades. It is quieter rubber tires on concrete or steel
guide-ways.
Less imposing elevated structure as it comprises of narrow beams are less wide
than LRT.
Easier and less expensive construction as narrow beams requires less construction
material and allows for use of pre-fabricated segments.
But true efficacy of monorail as a sustainable urban transport mode has many
unanswered questions, the biggest of them being switching and evacuation in an
emergency. IUT has tried to create both best case and optimum case scenario and few
other cities are likely to follow the lead of Mumbai, Kozhikode, Delhi and Trivandrum.

LIFE CYCLE COST ANALYSIS OF FIVE URBAN TRANSPORT SYSTEMS
Bangalore Metro Rail Corporation Limited
28
4.2 CAPEX Information
It has been possible to source detailed cost data of Monorail from a) 3-corridor, 48 km
proposed monorail project at Delhi 2007-08 feasibility report and b) The most recent
capital cost data from DPR of proposed 14.2 Km Monorail at Kozhikode. Updated
summary cost data for the 11.5 Km long Shastri Park – Trilokpuri corridor at Delhi has also
been collected. The detailed cost estimates of 19.54 km under construction monorail at
Mumbai is Rs. 2,716 crore, which comes to approximately 140 crore per km and is likely to
rise higher.
The estimated costs for the Kozhikode Metro have been represented in the table below:
Table 4-1: Kozhikode Monorail Capital Expenditure Estimates
Description Unit Rate (INR in
Crore at
April 2012
prices)
Quantity Cost (INR in
Crore at
April 2012
prices)
% of
Total
Cost
Land – Government Ha 66.00 0.518 34.20 2.19
Land – Private Ha 66.00 1.582 104.44 6.67
Fixed Infrastructure – Civil* 512.93 32.77
Fixed Infrastructure – Electrical Systems R. Km. 6.70 14.20 95.08 6.07
Fixed Infrastructure – Depot & OCC LS 79.80 5.10
Rolling Stock Each 10 36 360 23.00
Signaling, Telecom & AFC** 204.90 13.09
General Charges (excluding land cost) 8% 102.29 8
Contingency 3% 45.59 3
Total 1565.13 100
*Elevated structure at 22.55 crore per km, Stations at 8.8 crore each and E&M at 1.47 crore,
including lifts & elevators at stations. Other costs have been estimated at lump sum basis.
**The signalling cost is taken at 9 crore per km, telecom at 2 crore per station and AFC at 2.3 crore.
The capital cost details of 3-corridor Delhi Monorail of 47.8 km as per the cost estimated at
2007-08 price level is in the table below:
Table 4-2: Delhi Monorail (3 – Corridor/47.8 Km) Capital Expenditure Estimates
Description Quantity Cost (INR in
Crore at 2007-
08 price level)
% of Total Cost
Preparatory Expenses 1 0.0
Land – Government 1387 21.4
Land – Private 101 1.6
Fixed Infrastructure – Civil 47.8 1834 28.4
Fixed Infrastructure – Electrical Systems 47.8 450 7.0
Fixed Infrastructure - Depot & OCC 2 200 3.1
Rolling Stock 1379 21.3
Signalling, Telecom & AFC Signalling - 47.8 580 9.0
Taxes & Duties 535 8.3
Total 6467 100
Total (Excluding Land & Taxes) 4545
Summarized cost up to date of 11.5 km long 12 station monorail corridor between Shastri
Park and Trilokpuri in East Delhi is as follows:

LIFE CYCLE COST ANALYSIS OF FIVE URBAN TRANSPORT SYSTEMS
Bangalore Metro Rail Corporation Limited
29
Table 4-3: Shastri Park - Trilokpuri Monorail Capital Expenditure Estimates
Description Estimated Cost (INR in Crore at
October 2011 price level)
% of Total Cost
Land (Government owned) - 0
Civil Infrastructure 840 50.76
System 815 49.24
Total 1655 100
As the data pertaining to Delhi Monorail is of a feasibility report conducted in 2007-08 and
updated recently, the same has not been considered for assumptions. In its place, the
cost data of Kozhikode Monorail which is latest has been assumed as the basis of
assumptions. As Kozhikode Monorail data is at April 2012 price, no escalation is required to
be assumed.
4.3 Operation & Maintenance Cost Information
As no monorail system is presently operating in the country, the O&M costs data has been
approximated by IUT using available numbers from project reports, emerging international
trends and O&M cost benchmarks. A rudimentary O&M cost data for first year operations
of proposed 47.8 km monorail was estimated at Rs. 82 crore for 2011-12. Year-wise
projected O&M cost data for proposed 14.2 km Kozhikode monorail is available with IUT
and is tabulated below:
Table 4-4: Kozhikode Monorail O&M Cost Estimates
Year Staff (INR in
Crore)
Maintenance
Expenses (INR in
Crore)
Energy (INR in
Crore)
Total (INR in
Crore)
2015 - 2016 16.33 9.33 4.00 29.67
2020 - 2021 44.00 21.00 10.00 75.00
2025 - 2026 68.00 26.00 15.00 109.00
2030 - 2031 105.00 32.00 23.00 160.00
2035 - 2036 160.00 42.00 33.00 235.00
2040 - 2041 246.00 53.00 49.00 348.00
With regards to the operations and maintenance costs of Monorail systems, it is important
to note that energy costs are the biggest expense, which at minimum varies between 35 –
45 per cent of the total expenditure. The second important cost component is the staff
cost and per kilometre staff of 25 as assumed for the Kozhikode metro is compared apt
(Per km manpower for Delhi Metro is 40). The Monorail O&M cost Data of first year of
Kozhikode (2015-16) has been used to formulate the assumptions for the model..

LIFE CYCLE COST ANALYSIS OF FIVE URBAN TRANSPORT SYSTEMS
Bangalore Metro Rail Corporation Limited
30
5 LIGHT RAIL SYSTEM
5.1 About the system
Light Rail or LRT is a preferred mode where ample right of way is available. Built at-grade
or elevated (in portions of narrow right of way), the Light Rail System is a preferred mode
of transport in areas with a maximum PHPDT of around 20,000. At grade LRT because of
the inherent limitations of a mixed used traffic has a lower system capacity.
Since LRT is generally built at-grade, they take away the pavement size thereby leaving
less space for other modes of commute and may also have handicapped movement
due to the intersecting bus and personalised vehicle traffic. Unless segregated, they tend
to ply at slower speeds as their speeds are restricted by other traffic flows, especially at
junctions. In the Indian context, with the unplanned spread of the cities, providing the
right of way at-grade may not be easy.
Typical light rail systems possess a similar mixture of characteristics as bus rapid transit. Light
rail transit has a lower capacity and lower speed (At-grade) than heavy rail and metro rail
systems. LRT vehicles are lighter and generally operate singly or in two-car trains. IUT has
assumed a two car set and has also done a futuristic analysis with four car set. The space
requirement for the system is approximately 7-9 m exclusive ROW. It is said to be more
viable means of affecting modal shifts than enhanced bus service.
Elevated light rail is another mass rapid transit option. The principal difference between
elevated LRT and LRT at grade is the right of way. Elevated LRT runs on raised track
supported by steel or concrete structures. The elevated guide-ways are typically 5-6 m
above grade. These can reach more than 10 m above grade to bypass existing roads
and bridges. The guide-way columns are typically spaced 30 m apart along the right of
way. The advantage to elevated LRT over conventional light rail is that less right of way is
required because track is elevated.
Elevated LRTS is known for being more efficient and has higher carrying capacity than
monorail. Modern Light Rail has in recent decades made a comeback in Europe,
Australia, and Americas and in recent years even in Asia. IUT has made an endeavour to
incorporate learning from the recent development in LRT particularly in their capital and
O&M cost structure
5.2 CAPEX Information
In the name of LRT, India has a rickety tramway now running on truncated routes in
Kolkata and is not relevant for comparison. A project report was made in 2007-08 for a 45
km 3 – corridor LRT system in Delhi and its capital cost estimates are as follows:

LIFE CYCLE COST ANALYSIS OF FIVE URBAN TRANSPORT SYSTEMS
Bangalore Metro Rail Corporation Limited
31
Table 5-1: Delhi LRT Capital Estimates
Description Cost
(INR in Crore at
2007-08 price levels)
% of Total Cost
Preparatory Expenses 10 0.25
Land – Government 628 16.65
Land – Private 28 0.76
Fixed Infrastructure – Civil 442 11.72
Fixed Infrastructure – Electrical
Systems
300 7.94
Fixed Infrastructure - Depot &
OCC
483 12.78
Rolling Stock 1456 28.55
Signaling, Telecom & AFC 84 2.23
Taxes & Duties 345 9.12
Total 3776 100
In recent decades modern LRT services both at grade and elevated have sprung up
across various cities in Europe, Canada, USA (Baltimore being the most successful) and in
more recent years in Australia and even some Asian cities. Working group reports on
Urban Transport for the 12th Five Year Plan, which has provided cost assumptions for other
principal modes of urban transport, has not provided any such guidance for LRT.
Only Delhi 2007-08 data is available and the same has been escalated to arrive at the
cost at 2012-13 levels. The land cost estimated in the report which through back-end
calculation including taxes and duties comes to approximately 17% and seems to have
been considered on the higher side. Similarly, civil structures at 11.72% appear to be at
lower side. Suitable adjustment has been done in assumptions to arrive at correct cost at
the current level.
It has been ascertained from various sources and not much difference is there in per unit
rolling stock cost of modern LRT with a monorail rolling stock or a metro rail rolling stock.
Even in Kozhikode Monorail DPR, cost of one rolling stock has been assumed at Rs. 10
Crore. For the sake of comparison, cost of per unit rolling stock has been assumed at Rs.
10 Crore for all the 3 systems.
For the sake of comparison of LRT with elevated monorail and elevated metro, a
hypothetical elevated LRT system too has been assumed, for which the capital cost
structure has been derived interpolating and harmonising the cost data of monorail and
elevated metro rail.
5.3 Operation & Maintenance Cost Information
For 3 corridors, 45 km LRTS at Delhi, the study carried out in 2007-08 estimated the first year
cost of O&M at Rs. 112 Crore for the financial year 2011-12. In the absence of detailed
information on the CAPEX and O&M costs domestically, IUT has also looked at the

LIFE CYCLE COST ANALYSIS OF FIVE URBAN TRANSPORT SYSTEMS
Bangalore Metro Rail Corporation Limited
32
comparative numbers from international case-studies, and has tried to convert them to
INR, using purchasing power parity and further modulation to suit Indian conditions.
For the purpose of O&M cost data of elevated LRT, an interpolation from past O&M cost
data available for DMRC and prospective O&M cost data of Kozhikode Monorail has
been suitably tweaked to arrive at LRT O&M cost.

LIFE CYCLE COST ANALYSIS OF FIVE URBAN TRANSPORT SYSTEMS
Bangalore Metro Rail Corporation Limited
33
6 BUS RAPID TRANSIT
6.1 About the system
The Bus Rapid Transit System or BRTS is generally a closed system mass rapid transit system
with dedicated lanes for bus operations. Since its conception as a viable option in Latin
America many cities have adopted it with varied results. Exceptions apart, passenger
flow of 4,000 to 10,000 PHPDT is what can be achieved with BRTS, more so in Indian
consideration, and has much lower costs than the other transit systems like metro rail,
monorail and light rail, BRTS presents itself as a choice for regions with ample right of way
to accommodate it. It can be a suitable choice for planned cities that are being
developed, as the current status of congestion in the developed cities make such a
development difficult.
BRT is an advanced bus system serving travel corridors with an operational advantage
such as exclusive lanes and traffic preference on signals. BRT is faster and more reliable
service than ordinary bus services. Bus Rapid Transit is supposed to have the flexibility with
which it can be implemented. BRT systems possess a unique advantage of
implementation as they ply on segregated Right of Ways (ROW)
The first, and still one of the best BRT systems in the world, is in Curitiba, Brazil. Opened in
1974, Curitiba’s BRT features the following characteristics:
i. Physically segregated exclusive bus lanes
ii. Large, comfortable articulated or bi-articulated buses
iii. Fully enclosed bus stops, where passengers pay to enter the BRT station through a
turnstile rather than paying the bus driver
iv. A bus station platform level with the bus floor
v. Bus priority at intersections, largely by restricting left hand turns by mixed traffic
vehicles
vi. Private bus operators paid by the bus kilometre
BRTS has arrived late in India - even later than arrival of Delhi Metro Phase I. Two cities -
Delhi & Ahmedabad have commissioned a few kilometres of BRTS. While the BRTS of Delhi
has performed sub-optimally since inception, Ahmedabad’s experience has been
somewhat better. Today, a dozen cities are planning or implementing BRTS. But the
efficacy of the system in cities where ROW segregation at grade has difficulties is yet to be
established.

LIFE CYCLE COST ANALYSIS OF FIVE URBAN TRANSPORT SYSTEMS
Bangalore Metro Rail Corporation Limited
34
6.2 CAPEX Information
BRTS CAPEX estimates have been derived using data from detailed project reports of
Ahmedabad Phase I, Phase II and of Rajkot. In addition, an estimated completion cost of
BRTS in Delhi too is available, which is presented in the subsequent sections.
The CAPEX estimates for the Ahmedabad Phase I was for 58.3 km of BRTS corridor whereas
its Phase II was for 26 km. The DPR for the Rajkot BRT was prepared for a route length of
10.7 Km. The table below provides breakup of CAPEX for a BRTS corridor:
Table 6-1: Comparative Tabular Representation of BRTS Capital Costs
Description Unit Ahmedabad
BRTS Phase I
(2007 Prices) in
Rs. Lakh
Ahmedabad
BRTS Phase II
(2008 Prices) in
Rs. Lakh
Rajkot BRTS
(2007
Prices) in
Rs. Lakh
Roadway Development Per Km 630 810 513
Bus Stops Each 35 40 10
Foot over Bridges Each 20
Operational Infrastructure
(Terminals & Depots)
Lump Sum 430 350 250
Bridges and Flyovers Per km 3829 2289 1770
ITS application and External
Tracking
Lump Sum NA 4500 340
Bus Cost 30
The cost estimates above are dated but have been brought to the current level by
increasing it at a rate of inflation during these years, for this purpose an inflation factor of
5% per annum. Also latest estimates for the per km infrastructure for BRTS as assumed by
Working Group Report for 12th Five Year Plan is available- the working group report has
assumed a Rs. 20 Crore per km cost of infrastructure creation for BRTS.
The total approved cost of Phase I and Phase II BRTS corridor in Ahmedabad was of Rs.
493 Crore and Rs. 488 Crore respectively. The Rajkot BRTS corridor had an approved cost
of Rs. 110 Crore.
The capital cost analysis of Ahmedabad and Rajkot BRTS suggests, Phase I of the
Ahmedabad BRTS was planned at a rate of Rs. 8.5 Crore per km whereas Phase II was
planned at a rate of Rs. 18.76 Crore per km (which is close to working group on urban
transport cost numbers). The DPR of Rajkot BRTS corridor suggests a per km cost of
construction as Rs. 10.3 Crore. In addition, 3% of the gross total cost of construction has
been assumed as contingency charges and another 0.5% as general consultancy and
administrative charges.
The 14.5 km long BRTS corridor of Delhi from Ambedkar Nagar to Delhi Gate was planned
at a cost of Rs. 215 Crore. The average cost of construction of BRTS corridor in Delhi was
estimated at Rs. 14.83 Crore per km.

LIFE CYCLE COST ANALYSIS OF FIVE URBAN TRANSPORT SYSTEMS
Bangalore Metro Rail Corporation Limited
35
6.3 Operation & Maintenance Cost Information
Only BRTS corridor of Ahmedabad and Delhi are currently operational. A typical monthly
maintenance cost of 5.8 km long operational BRTS corridor in Delhi is of about INR 30 lakh
per month. Since the buses which runs on this corridor are either run by Delhi Transport
Corporation (DTC) or are operated by private players under the cluster scheme of DIMTS,
there is no information on the costs of bus operations on this corridor. The INR 30 lakh per
month of maintenance cost of the Delhi BRT corridor broadly includes staff salaries, cost of
operation control centre (OCC), repair & maintenance of information technology systems
(signaling, CCTV surveillance etc.).
The Phase I of Ahmedabad BRTS has an operating length of 58 km on which the operating
cost per passenger km is of Rs. 0.395.
The O&M data available for the operational BRTS corridors are difficult to conclude for
consideration for this study thus for running the buses on BRTS corridor the O&M cost has
been approximated to the general bus services with the following modifications: a)
Additional costs due to OCC, and signalling systems will be added. b) Rolling stock
efficiency in terms of lesser number of buses required, due to segregation of bus lane has
been factored in.

LIFE CYCLE COST ANALYSIS OF FIVE URBAN TRANSPORT SYSTEMS
Bangalore Metro Rail Corporation Limited
36
7 ORDINARY BUS SERVICES
7.1 About the system
Ordinary Bus Service is a building block of any public transport system across the globe.
The requirement of capital expenditure to kick start/maintain this system is one of the
lowest among the other modes of urban transport and the bus operator does not have to
contribute to the capital costs of creation of infrastructure.
Till very recently, ordinary bus was the only mode of public transport in Indian cities. Except
Mumbai (before arrival and expansion of Delhi Metro), all principal cities heavily
depended on this mode.
While bus operations should be a financially sustainable venture, the same in Indian
conditions have fared rather poorly – sole exceptions in recent years being BMTC,
Bengaluru and BEST, Mumbai. The perennial problem of Delhi bus systems has been the
populist fare structure, disproportionately high man-power to bus ratio, increasing fuel cost
and high repair, maintenance charges of over-aged buses. There have been some
changes for the better in recent years with the introduction and provisioning of urban bus
systems to cities and towns under the JNNURM.
In many Indian cities, buses do carry up to fifty per cent of all the people commuting by
mechanised transport. In Mumbai, whose lifeline is the suburban rail network, the ridership
of buses is equally impressive at 5-6 million per day. A unique feature of Mumbai’s bus
system is that it principally acts as east-west connector and bus routes have a symbiotic
relationship with the suburban rail network. On the contrary, Delhi which now has metro
rail system of substantial length and whose ridership is increasing fast (has crossed two
million per day), DTC and Delhi Metro routes are not rationalised. Despite this, both metro
rail and DTC have seen increase in ridership and the latter’s daily commuter trips have
reached 4.5 million.
An ordinary bus service can manage a passenger flow of 3,000 to 8,000 PHPDT. In medium
and large sized cities, even today, ordinary buses remain and shall be the predominant
mode of urban transport except in higher density corridors, where metro rail systems get
created with time.
7.2 CAPEX Information
The CAPEX as gathered from Delhi Transport Corporation are for all the buses and
associated infrastructure which were built during the Commonwealth Games 2010. The
costs which were paid for the procurement of rolling stock are as below:

LIFE CYCLE COST ANALYSIS OF FIVE URBAN TRANSPORT SYSTEMS
Bangalore Metro Rail Corporation Limited
37
Table 7-1: Commonwealth Games Bus Acquisition Costs
Description Quantity Landed Rates (Rs.) Total Amount (Rs.)
AC Buses:
AC LF Buses first tender 25 67,54,537/- 16,88,62,425/-
AC LF Buses second tender 426 59,37,253.30 292,92,69,906/-
AC LF Buses second tender 250 61,57,673/- 153,94,18,250/-
Non AC Buses:
Non AC LF Buses first tender 625 41,34,468/- 258,40,42,500/-
Non AC LF Buses second tender 1500 49,98,509/- 749,77,63,500/-
Non AC LF Buses second tender 375 51,84,078/- 194,40,29,250/-
Another key parameter of capital expenditure involved in the operations of ordinary bus
services are depots. The landed costs of the depots which were built for the CWG 2010 in
Delhi by DTC are as below:
Table 7-2: Commonwealth Games Depot Construction Costs
No Name of the Project Landed Costs (in Rs. Crore)
1. Construction of Bus Depot at Dwarka Sector-8 9.31
2. Construction of Bus Depot at Dwarka Sector-2 9.78
3. Construction of Bus Depot at Okhla-III 11.58
4. Construction of Bus Depot at Narela 9.42
5. Construction of Bus Depot at Kanjhawla-I 10.76
6. Construction of Bus Depot at Kanjhawla-II 9.71
7. Construction of Bus Depot at Rohini-IV 10.40
Total 71.96
Remarks- Deviation approved by Transport Dept. Letter No.F.16 (56)/PLG/TPT/09/485 dt.14.1.10
The average cost of the depots made by DTC as per the table above comes to Rs. 10.3
Crore for an average 150-200 parking capacity.
The price as suggested in the Working Group (WG) Report of the 12th Five Year Plan for the
procurement of buses in million plus cities is of Rs. 38.8 Lakh and for other low population
cities, it has been assumed at Rs. 25.2 Lakhs. Nonetheless today, wide choices have
become available with regard to buses and the cost of a bus acquisition in case of latest
Volvo city buses (already in operation in a few cities) can be as high as Rs. 80-100 lakhs.
The Working Group Report suggests the requirement of a depot for every 50 buses, with
the cost per depot at Rs. 8 Crore. It also estimates one workshop for every 250 buses at Rs.
20 crore, as well as a terminal for every two million population for another Rs. 20 crore, The
depots, workshops and terminal costs suggested in the WG report are inclusive of land
acquisition and machinery costs.
The contingency expenses which are considered for preparation of transport
infrastructure for the ordinary bus services are at 3% in addition to a 0.5% general
consultancy.

LIFE CYCLE COST ANALYSIS OF FIVE URBAN TRANSPORT SYSTEMS
Bangalore Metro Rail Corporation Limited
38
7.3 Operation & Maintenance Cost Information
A lot of data asymmetry exists in the O&M cost data at this stage, though IUT has been
able to capture a big picture of the same. The data for DTC, BEST, NMMC and DIMTS have
been collected and are presented in disaggregated manner.
As per the assessment carried out by the members of Indian Institute of Technology, Delhi
in the Working Group Committee for Urban Transport in the 12th Five Year Plan, the
operations and maintenance cost of Delhi Transport Corporation is as per the table
below:
Table 7-3: DTC - O&M Cost
Heads 2005-06 2006-07 2007-08 2008-09
(in Rs. Lakh) Expenses %
total
Expenses %
total
Expenses %
total
Expenses %
total
Personnel Cost 34,506 37% 37,213 35% 40,927 31% 61,553 35%
Material Cost 13,371 15% 12,908 12% 13,361 10% 13,990 8%
Taxes 686 1% 651 1% 816 1% 958 1%
Interest 35,663 39% 49,276 46% 66,857 51% 86,374 49%
Miscellaneous 2,704 3% 2,122 2% 3,438 3% 5,794 3%
Depreciation 5,213 6% 5,432 5% 5,719 4% 7,013 4% Total 92,145 100% 107,594 100% 121,119 100% 125,685 100%
Under the cluster scheme of DIMTS, in its
cluster 1 which is operational for last one
year, per km cost of O&M is of Rs. 5.5 per
bus km.
Another assessment which was carried out
by Tata Consultancy Services (TCS) for the
Brihan Electricity and State Transport
(BEST), a major portion of O&M costs are
incurred for covering personnel and fuel
costs which is 84% of the total.
Other Operating and non operating expenses as assessed in the study carried out by TCS
for BEST is presented in the table below (in paisa per bus km):
Table 7-4: BEST - O&M Costs
Components of Cost SD AC Midi DD Overall
Variable Cost (VC)
Fuel Oil 1020 1761 1032 1271 1040
Lubricating Oil 10 83 15 3 10
Tyres and Tubes 42 42 42 42 42
Materials ( Garaging and Workshop) 125 387 192 322 138
Cost of Ticket Block 11 2 17 23 12
Passenger Tax 112 99 114 183 115
Conductors & Drivers (Salaries, Wages & DA, PF etc.) 1363 1296 2117 2310 1419
Personnel
Cost
27%
Fuel Cost
57%
Lubricants
1%
Auto
Spare
Parts
11%
Tyre and
Tubes
4%
Operations and Maintenance

LIFE CYCLE COST ANALYSIS OF FIVE URBAN TRANSPORT SYSTEMS
Bangalore Metro Rail Corporation Limited
39
Total (A) 2683 3671 3529 4154 2777
Fixed Cost (FC)
Transportation Engg Gen Establishment – Salaries 14 14 14 14 14
Garaging, Workshop, MM Stores – Salaries 382 382 382 570 391
Engg Miscellaneous Expenses 72 72 72 108 74
Registration and License Fees 8 60 7 2 8
Traffic Gen & Traffic Other outdoor staff – salaries 182 228 282 216 185
Ticket and Cash Est. Salaries 64 80 99 76 65
Traffic Misc. Expenses 137 137 137 137 137
Gen Admin Expenses 284 284 284 284 284
Provision for Depreciation and Additional
Depreciation
220 905 505 227 231
Interest charges etc. 6 27 15 7 7
Interest on Internal Funds 71 293 164 74 75
Bus Lease Rental 67 0 0 0 62
Total (B) 1506 2482 1960 1713 1532
Total A+B 4189 6153 5490 5867 4309
Kms run – Annual in million 223 2 3 12 240
Kms run - Daily 610594 6442 8142 33247 658425
No of buses 3042 51 63 235 3391
Fixed Cost in Rs. per bus 3024 3135 2534 2423 2975
Total Cost in Rs. per bus 8409 7772 7095 8300 8367
Remarks: SD – Single Deck, AC- Air Conditioned, Midi – Mini Buses, DD – Double Deck
The report also projected the operating and non operating costs of BEST for a new
procurement whose estimated costs are as per below:
Table 7-5: BEST O&M Cost Estimation 2006-11
Unit 2006-07 2007-08 2008-09 2009-10 2010-11
Number of Buses 121 177 234 299 373
Operating cost
Staff -Driver Rs. in million 64.09 99.99 139.25 188.26 248.66
Fuel Rs. in million 125.61 177.05 239.57 329.49 442.35
Lubricants Rs. in million 1.18 1.75 2.33 3.01 3.79
Tyres and Tubes Rs. in million 4.87 7.19 9.6 12.4 15.62
Material and Spares Rs. in million 15.96 23.59 31.48 40.65 51.22
Non-Operating cost
Interest on loan Rs. in million 19.31 28.27 37.39 47.83 59.7
Depreciation Rs. in million 27.15 39.76 52.57 67.26 83.96
MV Tax Rs. in million 0.69 1.01 1.34 1.71 2.13
Misc. Expenses Traffic Rs. in million 6.51 8.83 10.83 12.84 14.86
Misc. Expenses Engg Rs. in million 12.06 16.37 20.06 23.79 27.53
Gen Admin Expenses Rs. in million 5.4 8.3 11.53 15.48 20.29
As per the toolkit which was prepared by ADB for Public Private Partnership in Urban Bus
Transport in Maharashtra, the O&M costs for 269 buses for year 2009 were estimated as
per the table below:

LIFE CYCLE COST ANALYSIS OF FIVE URBAN TRANSPORT SYSTEMS
Bangalore Metro Rail Corporation Limited
40
Table 7-6: O&M Costs for 269 buses for 2009 (ADB Toolkit)
Heads Cost (in Lakh)
Salaries 730
Other Administrative Expenses 50
Vehicle Maintenance 164
Fuel Expenses 539
Stationery 166
Total taxes and other workshop related expenses 731
Interest Expenses 207
Total Expenditure 2420
It has been possible to collect information of operations & maintenance costs of major
metropolitan bus systems along with their physical performance data. The latest data
available pertains to September, 2011. To bring the same to the latest a 9% increase was
assumed for the manpower and 5% for the other costs. The following table forms the basis
of assumptions for the bus systems (both ordinary buses and buses plying on BRTS corridor)
based on the figures collected from various tables of latest available Central Institute of
Road Transport (CIRT) journal.
Table 7-7: O&M Cost/ Physical Data for Bus Systems (CIRT, September 2011)
Description BEST DTC (City) MTC - CN1 BMTC (STU) Thane MTU
Cost (Rs. in lac)
Personnel 24378.17 26640.68 15610.84 13126.95 1249.43
Fuel & lubricants - Rs. in lac 8692.86 11116.15 9140.61 14245.76 541.30
Tyres & Tubes - Rs. in lac 799.00 209.06 979.03 1026.11 64.60
Spare Parts - Rs. in lac 1263.02 712.87 640.60 897.90 35.09
Interest 3782.50 44774.84 1759.27 284.73
Depreciation 2362.62 5671.41 2641.15 2601.09
Total Taxes 1654.55 313.95 243.82 2074.82 94.49
Others 2617.06 4459.12 1268.21 1739.24 240.00
Total Cost - Rs. in Lac 45549.78 93898.08 32283.53 35996.60 2224.91
Operating Cost 40112.73 48809.29 30280.44 33637.05 2130.42
Physical
Average No. of buses held 4698.00 5874.00 3435.00 6059.00 375.00
Average No. of buses-on-
road
3918.00 4837.00 3065.00 5698.00 213.00
% Fleet Utilisation 83.40 82.30 89.20 94.00 56.80
Total Eff Kms (Lac) 629.68 871.75 890.37 1184.17 33.51
Daily Bus Utilisation
i) Per bus held 145.70 161.30 281.70 212.40 97.10
ii) Per bus-on-road 174.70 195.90 315.80 225.90 171.00
Seat Kms (Lac) 42188.00 51433.00 64106.00 76971.00 2123.00
Passenger Kms (Lac) 31033.00 41316.00 58171.00 59883.00 1779.00
Passengers Carried (Lac) 3676.00 3836.07 5357.00 3895.41 234.11
Pass. Carried/bus-on-
road/day
1020.00 862.00 1900.00 743.00 1195.00
Staff Position
Total Staff 36462.00 39030.00 22857.00 32723.00 2352.00
Staff/bus-on-road 9.31 8.07 7.46 5.74 11.04
Eff. Kms/staff/day 18.77 24.28 42.34 39.33 15.49
Fuel Performance
Kms/litre of HSD (KMPL) 2.86 2.92 CNG 4.30 3.97 2.43
It is evident from the above table that for the bus operations in major cities like Mumbai,
Delhi, Bangalore, Chennai and Thane, the key component of the O&M cost involves

LIFE CYCLE COST ANALYSIS OF FIVE URBAN TRANSPORT SYSTEMS
Bangalore Metro Rail Corporation Limited
41
staffs, fuel and lubricants, tyres and tubes and spare parts. The average fuel efficiency has
been about 3.2 kilometres per litre in case of diesel operations whereas it is about 3
kilometres for the CNG based operations. The average cost of tyres and tubes and spare
parts for every effective kilometre is approximately Rs 1.08 and Rs 1.07 respectively. Other
cost of operation and maintenance is about 2% of the total O&M costs. These costs are
2011 prices and are suitably adjusted for the purpose of this study.

LIFE CYCLE COST ANALYSIS OF FIVE URBAN TRANSPORT SYSTEMS
Bangalore Metro Rail Corporation Limited
42
8 ASSUMPTIONS FOR LIFE CYCLE COST ANALYSIS
After critical analysis of the CAPEX and O&M costs of the five urban transport systems in
the previous chapters of this report, a large fluctuation has been noticed in the costs
incurred across different cities and in some cases even across different corridors in the
same city. Due to this large variance across different cities, especially in the land cost, it
was important that a hypothetical model be created for each mode.
Different modes are capable of operation in different configurations. For Rail based
systems, since monorail is essentially modelled as an elevated system, we have chosen to
develop the hypothetical models for all rail-based systems as elevated systems for
providing key comparative differentiators.
The basis of this structure has been derived from an approximated mean of the data
already available and escalation of the same. Some of the data available, which quote
the latest figures, have been used directly as assumptions.
There are some general assumptions that are essential to the process of creation of the
financial models for different modes of urban transport. In order to devise hypothetical
models of the various modes it was essential to take care to ensure that the most logical
variables be chosen to assist the functioning of such modes if they were to be practically
tested.
This segment of the report focuses on the assumptions that have been derived for further
processing the data into a format that has been utilised for estimating their life cycle
costs.
8.1 Construction Duration, Phasing and Price Escalation
The construction period of any project is the period which tends to have the minimal cost
impact operationally; however the capital cost impact of inordinately long construction
period can be extremely high. Proper phasing and Price Escalation has impact on the
total capital cost of any project, as each successive year spent in the construction
impacts the total cost with a heavy increase in the overall cost. Such cost impacts are of
inflation and additional financing cost. Time over run and cost overrun are intrinsically
related.
For the purpose of calculation of the Life Cycle cost of the various modes the Annual
escalation in prices has been considered at 5% after a lot of deliberation and after having
studied various projects. For each year of the balance construction left thus the cost to be
incurred in the next year gets escalated for 5%.

LIFE CYCLE COST ANALYSIS OF FIVE URBAN TRANSPORT SYSTEMS
Bangalore Metro Rail Corporation Limited
43
In the case of the bus based systems the construction period has been taken at 3 years.
Bus Systems have limited construction requirements. The major time consumers in this case
are the time taken in the construction of the Depot, Workshops, Terminals and Bus Shelters.
The time required for the procurement of the rolling stock is another constraint that has to
be considered also which in turn is dependent on the requirement and availability in the
market as there are only two suppliers (Tata Motors and Ashok Leyland) of normal buses
and the buses sold by Volvo cost in the higher range of Rs. 80 Lakh to 1 core. In the case
of BRTS, the ROW may also require extensive redevelopment. In a twenty kilometre stretch
for BRTS it is safe to assume provisioning of one kilometre of road over bridge or road
under pass for segregation of traffic and its cost has been factored
Rail based systems generally have a longer duration requirement. Experience suggests
that a minimum one year is needed for preliminary works like land acquisition, various
regulatory approvals and preliminary designs. For this model the default duration has
been taken at 5 years for construction of Rail based system. Other than Delhi Metro no
other rail based system has been completed in this country in five years but it has been
assumed that with time and the country’s movement along the learning curve, a 20 km
rail based urban transport project can be completed in five years duration.
8.2 Requirement of Rolling Stock and Buses
The requirement of Rolling Stock for rail based systems (metro rail, mono rail and light rail)
and Bus Coaches for bus based systems (for BRTS and ordinary Bus service) are
dependent on carrying capacity, headway, average speed, distance between stations
and bus shelters etc.
8.2.1 Headway
The Headway parameter is important for the systems to improve the efficiency of the fleet
of rolling stock of different systems. It also is used to verify the technical feasibility of the
systems at various PHPDT levels. While calculating the Rolling Stock Requirement the
Headway parameter has been kept as a variable that changes dependent on the
number of train sets (or buses) needed to be dispatched from a point within an hour. It is
important to note that this is required for the system to be able to move the required
number of passengers; however it is not necessary for the hypothetical situation that this
variable headway fall in the range that is technically feasible for that particular system.
The technical feasibility has been calculated based upon the congestion on the network,
the level of complexity of the technology and the current world standards. The minimum
technically feasible headway for the various systems has been assumed as under:

LIFE CYCLE COST ANALYSIS OF FIVE URBAN TRANSPORT SYSTEMS
Bangalore Metro Rail Corporation Limited
44
Table 8-1: Assumed Headway for the Urban Transport Systems
System Headway (in minutes)
Metro Rail 2.50
Monorail 2.50
Light Rail (Elevated) 2.50
Light Rail (At Grade) 2.50
BRTS 0.60
Ordinary Buses 1.00
Some explanation is due for the headway adopted above. It is possible for ordinary buses
to run with headway of one minute. In the case of BRTS a two double bus composition has
been assumed and headway of 0.6 minute has been assumed as the team has observed
the same being achieved at different intersections of Delhi BRTS. In case of Delhi Metro
headway of 1.5 minutes has been proposed in the operations of its Phase III. But it has
been observed that in general headway of 2.5 minutes to 3 minutes is best suited for rail
based system. Thus headway of 2.5 minutes has been considered for all rail based
systems.
8.2.2 Average Speed
The average speed of the various systems is dependent on the acceleration and
deceleration speeds, the complexity of the system, signalling quality, the right of way
segregation, the congestion on the system - both direct and indirect, the number of
pauses in operation/stops that are required, the distance between stops and the duration
of stops. Taking into account various parameters listed before, the following average
speeds have been assumed based on facts available with the team.
Table 8-2: Assumed Average Speeds for the Urban Transport Systems
System Average Speed (Km/hr.)
Metro Rail 35
Monorail 30
Light Rail (Elevated) 30
Light Rail (At Grade) 25
BRTS 25
Ordinary Buses 15
It is to be clearly understood that for highest of the urban transport systems, Metro Rail, the
average speed assumed is what is already achieved by DMRC. Mono Rail and Light rail
have been clubbed together at 30 km per hour. Similarly for the purpose of comparison
Light Rail at Grade and BRTS speed has been assumed to be uniform at 25 km per hour.
For ordinary buses the speed has been assumed as 15 km in mixed traffic condition. It is
clarified that for all the three surface systems- ordinary buses, BRTS and Light Rail (At
Grade) liberal average speed has been assumed.

LIFE CYCLE COST ANALYSIS OF FIVE URBAN TRANSPORT SYSTEMS
Bangalore Metro Rail Corporation Limited
45
8.2.3 Distance between Stations/Shelters
The distance between the Stations and Shelters refers to the average distance that should
be maintained between two consecutive stations or shelters. This data has been used for
calculation of the total number or stations/ bus shelters that will be required to be built
along a particular route length, thereby arriving at the capital expense needed to be
incurred for the same. The distances chosen for this study by IUT are as below.
Table 8-3: Assumed Distance between Stations/Shelters for the Urban Transport Systems
System Distance between Stations/Shelters (Km)
Metro Rail 1.00
Monorail 0.75
Light Rail (Elevated) 0.75
Light Rail (At Grade) 0.75
BRTS 0.75
Ordinary Buses 0.50
Till date after operationalization of the Phase II of Delhi Metro including the Airport Express
line, the total operational route length of the system is 193 km with 145 stations, thus the
average distance between the stations is nearly 1.33 km. If the Airport Express line is
excluded then the total route length is about 170.3 km with 139 stations thus average
distance between stations will remain 1.23 km only. For this study a conservative 1 km
distance between Metro Rail stations has been considered. The Jacob circle – Wadala –
Chembur section of the Mumbai Monorail is of approximately 19.54 km with 18 stations
which corresponds to an average distance of 1.09 km between monorail stations. For this
study a conservative 0.75 km distance between monorail stations has been considered.
The proposed 45 km light rail system for Delhi has 39 stations planned on it which reflect on
an average about 1.15 km distance between stations. For this study 0.75 km station
distance has been considered to perform a conservative calculation. The Ahmedabad
BRTS corridor network is 74.5 km in length and has 75 bus shelters on it. This conveys that
the average shelter distance on this BRTS corridor is about 1 km, but for this study an
average 0.75 km shelter distance has been considered. The bus shelter distance on an
average varies from 0.5 km to 1 km cities to cities but for this study 0.5 km has been
considered as a distance between bus shelters for ordinary bus services.
The above distances between the stations/shelters have been considered on the
conservative side to get a life cycle cost which can be applied in general to varying
nature of traffic corridors.
8.2.4 Carrying Capacity
The rail car/bus coach capacities have a major impact on the carrying capacity. In order
to achieve a particular PHPDT, the capacities of rail based systems rolling stock/ buses
decide the number of units that would be required. For the purpose of this study, the

LIFE CYCLE COST ANALYSIS OF FIVE URBAN TRANSPORT SYSTEMS
Bangalore Metro Rail Corporation Limited
46
capacities for the various systems have been assumed based on the actual figures
available and verifiable in the systems in use today. The capacities for the various systems
and the source for their choice have been provided below. The capacities chosen below
have been assumed at peak carrying capacity of 6 persons per square meters.
Table 8-4: Assumed Carrying Capacity for the Urban Transport Systems (Per coach/car)
System Persons Remarks
Metro Rail 275 Based on Bombardier MOVIA Coach Capacity available from DMRC
Monorail 128 Based on design specification by Hitachi for their medium sized systems
Light Rail 242 Based on design specifications for Siemens S70
Buses 80 Based on specifications available in Rajkot BRTS DPR
Though the manufacturers of these rail cars and buses suggest that up to 8 persons per
square meter can be considered for crush load capacity calculation but for this study a
medium range carrying capacity of the rolling stock at the rate of 6 persons per square
meters has been considered.
8.2.5 Train Set configuration
The vehicle configuration has been derived based on the carrying capacities attributed
to the various systems. The same has been done by using the carry capacities
ascertained in the report by the Working Group for the 12th Five Year Plan. Also
consideration has been given to the standard configurations used across the systems as
currently operational world over. Changing the configuration will directly affect the load
carrying capacity of the system; however only to the degree that it is not restricted by the
technical configuration feasibility. For getting a better understanding of the situation, a
maximum PHPDT capacity of all the modes have been calculated and is presented in the
table below:
Table 8-5: Maximum PHPDT capacity of different modes at varying train configuration
System Coach Configuration of
the Train
Train Set Capacity Maximum PHPDT
Metro Rail 4 1100 26,400
6 1650 39,600
8 2200 52,800
Mono Rail 3 384 9,216
6 768 18,432
9 1,152 27,648
Light Rail 2 484 11,616
4 968 23,232
BRTS 1 80 8,000
2 160 16,000
Ordinary Buses 1 80 4,800
In general practice, it has been observed that the rail based system runs on a minimum
headway of 2.5 minutes or more. But in few of the cases (upcoming DMRC Phase III could
be the case) after enhancing the signalling and telecom system, a headway as minimum
as 1.5 minutes can also be achieved. For the purpose of this study, a minimum headway

LIFE CYCLE COST ANALYSIS OF FIVE URBAN TRANSPORT SYSTEMS
Bangalore Metro Rail Corporation Limited
47
of 2.5 minutes has been taken. From the above table it is evident that a metro rail with 8
car configuration train set can carry a maximum PHPDT of 52,800 whereas if the headway
is brought down to 1.5 minutes the same would escalate up to 88,000. Similarly, in the case
of monorail with a 9 car configuration of train set, a maximum PHPDT of 27,650 can be
achieved at 2.5 minute headway which can increase further up to 46,000 if the headway
can be reduced to 1.5 minutes. In case of light rail with 4 coach configuration of the train
set, a maximum PHPDT of 23,250 can be achieved at 2.5 minute headway and which can
further increase up to 38,720 if the headway can be reduced up to 1.5 minutes.
The configurations used in the formulation of this model for the Life Cycle Cost Analysis are
as below.
Table 8-6: Assumed Vehicle Configurations for Urban Transport Systems
System Carrying Capacity (Persons) Configuration
Metro Rail 1,100 4 Coach
Monorail 384 3 Coach
Light Rail 484 2 Coach
BRTS 160 2 Coach
Ordinary Buses 80 1 Coach
8.2.6 Requirement of Rolling Stock
Based on the assumptions made regarding headway, average speed, distance between
stations/shelters, carrying capacity of coaches and train set configurations, the total
rolling stock requirements for the hypothetical case has been derived and is presented in
the table below:
Table 8-7: Rolling stock requirement for the Hypothetical Case
Modes Capacity of coaches Units of Rail Cars/buses required
MRTS 275 92
Monorail 128 213
LRTS (Elevated) 242 116
LRTS (at Grade) 242 124
BRTS 80 370
Bus 80 413
The detailed calculations relating to the above derivations have been attached as The
result of the above analysis is summarised in the table below.
Table 9-9: Summarized view of impact of mode capacity limitations on the LCC per seat
System No. of Coaches in
the Train
Train Set Capacity
Maximum PHPDT
LCC per seat (in INR Lakh)
Metro Rail 4 1100 26,400 21.30 6 1650 39,600 17.03 8 2200 52,800 15.07
Mono Rail 3 384 9,216 36.38

LIFE CYCLE COST ANALYSIS OF FIVE URBAN TRANSPORT SYSTEMS
Bangalore Metro Rail Corporation Limited
48
6 768 18,432 25.80 9 1,152 27,648 22.28
Light Rail elevated
2 484 11,616 33.01 4 968 23,232 19.10
Light Rail At-grade
2 484 11,616 19.90 4 968 23,232 13.23
BRTS 1 80 8,000 26.65 2 160 16,000 24.99
Ordinary Buses 1 80 4,800 17.99
Headway for Rail Based Systems has been assumed at 2.5 minutes, whereas for BRTS it has been assumed at 0.6
minutes and for Ordinary Buses at 1 minute.
*LCC per seat (in INR Lakh) at NPV for the assumed lifespan of 30 years
It may be noted that with the increasing mode capacity and hence PHPDT, LCC for
Monorail and LRT fall substantially in comparison to Metro rail, BRTS and Bus Services.

LIFE CYCLE COST ANALYSIS OF FIVE URBAN TRANSPORT SYSTEMS
Bangalore Metro Rail Corporation Limited
49
Annexure I – Rolling Stock Requirement Assessment of this report.
8.3 Depot & Workshops
Depots and Workshops are essential to the functioning of all urban transport systems. All
the systems require a demarcated and equipped area for upkeep and maintenance of
their rolling stock and coaches. The depot needs to be equipped with the daily
maintenance and basic repair facilities, and also requires sufficient space to
accommodate the desired number of vehicles. The cost of a depot varies based on the
rolling stock quantity to be homed there and the type of equipment required.
Workshops on the other hand are specialised care centres for the rolling stock and often
are part of the depot itself. Workshops cater to needs of complex periodic repair
including intermediate and complete overhaul. The choice of workshop specifications
and size is a function of the requirement of quality, quantity and price of the output.
For the purpose of this study, IUT has chosen to adopt the standards currently in vogue
and has used them to derive a ratio based on a variety of parameter to compute the
number of depots that will be needed for a particular system. The parameters derived are
as below:
Table 8-8: Assumed Depot and Workshop Requirements for Urban Transport Systems
Parameter
Depot cum Workshop Requirement for Rail Based System 2 Depot for every 30 km
Depot Requirement for Bus Based System 1 Depot for every 50 Buses
Workshop Requirement for Bus Based System 1 Workshop for every 250 Buses
Source: Recommendations of Working Group on Urban Transport for 12th Five Year Plan
Also, based on current standards as chosen by the various DPRs and facts available with
IUT, a ratio has been derived to deduce the ‘number of car to facility cost’ ratio, thereby
calculating the cost of facilities required for accommodating the rolling stock
requirements for the assumed systems. As the study is for 20 km of route kilometre, in the
case of rail based systems one depot cum workshop has been assumed.
8.4 System Wise CAPEX assumptions
The assumptions taken for the selected systems are presented in the subsequent sections.
8.4.1 Metro Rail
Delhi Metro Phase III cost assumptions are the latest available information and the same
can be used for the CAPEX calculation of the hypothetical 20 km long metro corridor for
this study. It presents the following picture:
Table 8-9: Assumed CAPEX of Metro Rail for LCCA based on DMRC Ph-III assumptions
Item Unit Assumed Cost Remarks for the Assumed Cost

LIFE CYCLE COST ANALYSIS OF FIVE URBAN TRANSPORT SYSTEMS
Bangalore Metro Rail Corporation Limited
50
(INR in Crore)
Land @ 10%
Alignment and Formation
Underground section by Cut & Cover
excluding Station length
R. Km. 105.00 An average of the 2010 costs of Ph-II
and Ph-III of Delhi metro and
escalated by 5% per annum
Elevated viaduct section R. Km. 32.00 An average of the 2010 costs of Ph-II
and Ph-III of Delhi metro and
escalated by 5% per annum
At-Grade R. Km. 9.00 Escalated @5% the 2005 cost for at
grade alignment of Kochi
OCC Building LS 50.00 INR 50 Crore, allocated for OCC of
HMRL network
Station Buildings
Underground Station Each 120.00 Though cost of underground station
has come down in Ph-III from the
2010 Ph-II cost of DMRC, but an
escalation @5% on the 2010 cost of
underground station has been
assumed
Elevated stations Each 16.00 An average of the 2010 costs of Ph-II
and Ph-III of Delhi metro and
escalated by 5% per annum
E&M Works
Underground station (E&M, Lifts,
Escalators, DG sets, UPS, TVS, ECS etc.)
Each 54.00 Escalated @5% the 2010 cost for UG
E&M of DMRC Phase III
Elevated station (E&M, Lifts, Escalators,
DG sets etc.)
Each 7.00 Escalated @5% the 2010 cost for UG
E&M of DMRC Phase III
Depot LS 43.00 An average of the 2010 costs of Ph-II
and Ph-III of Delhi metro and
escalated by 5% per annum
Permanent Way
Ballast less/Ballasted track for elevated ,
UG and at grade alignment
R. Km. 7.00 An average of the 2010 costs of Ph-II
and Ph-III of Delhi metro and
escalated by 5% per annum
Traction & power
Under Ground Section R .Km. 14.00 An average of the 2010 costs of Ph-II
and Ph-III of Delhi metro and
escalated by 5% per annum
Elevated & at grade section R. Km. 8.00 An average of the 2010 costs of Ph-II
and Ph-III of Delhi metro and
escalated by 5% per annum
Lift (for elevated stations) Each 0.30 An average of the 2010 costs of Ph-II
and Ph-III of Delhi metro and
escalated by 5% per annum
Escalator (for elevated stations) Each 1.00 An average of the 2010 costs of Ph-II
and Ph-III of Delhi metro and
escalated by 5% per annum
Signalling and Telecom.
Signalling R. Km. 13.00 An average of the 2010 costs of Ph-II
and Ph-III of Delhi metro and
escalated by 5% per annum
Telecom Each
Stn.
3.00 An average of the 2010 costs of Ph-II
and Ph-III of Delhi metro and
escalated by 5% per annum
Automatic fare collection
Underground stations Each
Stn.
3.90 An average of the 2010 costs of Ph-II
and Ph-III of Delhi metro and
escalated by 5% per annum
Elevated stations Each
Stn.
3.40 An average of the 2010 costs of Ph-II
and Ph-III of Delhi metro and
escalated by 5% per annum
R & R incl. Hutments and road
restoration etc.
R. Km. 3.20 An average of the 2010 costs of Ph-II
and Ph-III of Delhi metro and
escalated by 5% per annum
Misc. Utilities, other civil works such as
median, road signage etc.
R. Km. 3.80 An average of the 2010 costs of Ph-II
and Ph-III of Delhi metro and
escalated by 5% per annum
Electrical Utilities R. Km. 2.90 An average of the 2010 costs of Ph-II
and Ph-III of Delhi metro and

LIFE CYCLE COST ANALYSIS OF FIVE URBAN TRANSPORT SYSTEMS
Bangalore Metro Rail Corporation Limited
51
escalated by 5% per annum
Telecom Utilities R. Km. 0.50 An average of the 2010 costs of Ph-II
and Ph-III of Delhi metro and
escalated by 5% per annum
Rolling Stock (SG) Each 10.00 Procurement of Mumbai Metro rolling
stock in 2010 @ Rs. 9.4 Crore per car
and similarly for DMRC in 2011 @Rs9
Crore per km
General Charges incl. Design charge
on all items except land
@ 3%
Contingencies @ 3%
The above DMRC data is for a hybrid system – a mix of underground and elevated.
However, this report intends to compare the lifecycle cost of monorail, LRTS and metro rail.
As such, for the purpose of hypothetical construct a simple, harmonised elevated 20 km
stretch of metro rail has been assumed with the following cost parameters.
Table 8-10: Assumed CAPEX for 20 km Elevated Metro Rail system for LCCA
Description Unit Assumed
Cost
(INR in
crore )
Remarks
Land @ 10% For uniform comparison the land cost has been
assumed at 10% for all three systems. In practice
there will be variations from city to city and from
corridor to corridor.
Alignment and Formation
Elevated viaduct section R. Km. 32.00 An average of the 2010 costs of Ph-II and Ph-III of
Delhi metro and escalated by 5% per annum
OCC Building LS 50.00 INR 50 Crore, allocated for OCC of HMRL
network
Station Buildings Each 16.00 An average of the 2010 costs of Ph-II and Ph-III of
Delhi metro and escalated by 5% per annum
E&M Works
Elevated station (E&M, Lifts, etc.) Each
Stn.
7.00 Escalated @5% the 2010 cost for elevated E&M
of DMRC Phase III
Depot LS 50.00 An average of the 2010 costs of Ph-II and Ph-III of
Delhi metro and escalated by 5% per annum
Permanent Way R. Km. 7.00 An average of the 2010 costs of Ph-II and Ph-III of
Delhi metro and escalated by 5% per annum
Traction & power
Elevated R. Km. 8.00 An average of the 2010 costs of Ph-II and Ph-III of
Delhi metro and escalated by 5% per annum
Lift Each 0.30 An average of the 2010 costs of Ph-II and Ph-III of
Delhi metro and escalated by 5% per annum
Escalator Each 1.00 An average of the 2010 costs of Ph-II and Ph-III of
Delhi metro and escalated by 5% per annum
Signalling and Telecom.
Signalling R. Km. 13.00 An average of the 2010 costs of Ph-II and Ph-III of
Delhi metro and escalated by 5% per annum
Telecom Each
Stn.
3.00 An average of the 2010 costs of Ph-II and Ph-III of
Delhi metro and escalated by 5% per annum
Automatic fare collection Each
Stn.
3.40 An average of the 2010 costs of Ph-II and Ph-III of
Delhi metro and escalated by 5% per annum
R & R R. Km. 3.20 An average of the 2010 costs of Ph-II and Ph-III of
Delhi metro and escalated by 5% per annum
Misc. Civil Utilities R. Km. 3.80 An average of the 2010 costs of Ph-II and Ph-III of
Delhi metro and escalated by 5% per annum
Electrical Utilities R. Km. 2.90 An average of the 2010 costs of Ph-II and Ph-III of
Delhi metro and escalated by 5% per annum
Telecom Utilities R. Km. 0.50 An average of the 2010 costs of Ph-II and Ph-III of
Delhi metro and escalated by 5% per annum
Rolling Stock (SG) Each 10.00 Procurement of Mumbai Metro rolling stock in
2010 @ Rs. 9.4 Crore per car and similarly for

LIFE CYCLE COST ANALYSIS OF FIVE URBAN TRANSPORT SYSTEMS
Bangalore Metro Rail Corporation Limited
52
DMRC in 2011 @Rs9 Crore per km
General Charges (except land) @ 3%
Contingencies @ 3%
Source: DMRC Ph-II completion & Ph-III Assumptions and IUT assumptions
8.4.2 Mono Rail
Since no monorail system is operational so far, only DPR figures were available for analysis
of CAPEX. The CAPEX assumed for the hypothetical 20 km long monorail corridor is based
on the DPR assumptions of Kozhikode and some interpolations and assumptions as below:
Table 8-11: Assumed CAPEX of Monorail system for LCCA based on Kozhikode DPR
Description Unit Assumed cost
of MR
(INR in Crore)
Remarks for Assumed Cost
Land @10% rounded Cost assumption of Kozhikode MR
Fixed Infrastructure – Civil R. Km. 36.00 rounded Cost assumption of Kozhikode MR
Elevated Structure R. Km. 22.50 rounded Cost assumption of Kozhikode MR
Elevated Stations Each 9.00 rounded Cost assumption of Kozhikode MR
Fixed Infrastructure – Depot &
OCC
LS 80.00 rounded Cost assumption of Kozhikode MR
Fixed Infrastructure – Electrical
Systems
6.50 rounded Cost assumption of Kozhikode MR
E&M (including lifts and
escalators)
Per Stn. 1.50 rounded Cost assumption of Kozhikode MR
Traction and other Electrical
Utility
R. Km. 5.50 rounded Cost assumption of Kozhikode MR
Rolling Stock Each 10.00 rounded Cost assumption of Kozhikode MR
Signaling, Telecom & AFC 14.50 rounded Cost assumption of Kozhikode MR
Signaling R. Km. 9.00 rounded Cost assumption of Kozhikode MR
Telecom Per Stn. 2.00 rounded Cost assumption of Kozhikode MR
AFC Per Stn. 2.50 rounded Cost assumption of Kozhikode MR
General Charges (excluding
land cost)
@5% lowered rate - technology is already under
implementation in India
Contingency @3% rounded Cost assumption of Kozhikode MR
The assumptions made for Monorail unit cost of construction for 20 km stretch is as follows.
Table 8-12: Assumed CAPEX for 20 km Monorail system for LCCA
Description Unit Assumed
Cost
(INR in
Crore)
Remarks
Land @ 10% Land cost assumed uniformly for all the
three systems.
Alignment and Formation
Elevated viaduct section R. Km. 22.50 The Monorail civil costs are 60-70% of
the elevated metro rail civil costs
OCC Building LS 40.00 Pared down from the metro rail OCC
figure
Station Buildings Each 9.00 Smaller station buildings have been
assumed for monorail as compared to
metro rail
E&M Works

LIFE CYCLE COST ANALYSIS OF FIVE URBAN TRANSPORT SYSTEMS
Bangalore Metro Rail Corporation Limited
53
Elevated station (E&M, Lifts, etc.) Each Stn. 2.50 Pared down from Metro rail costs –
assumed at higher level than Kozhikode
Depot LS 120.00 Monorail cars required for a 20km
stretch are 210, substantially higher than
126 for elevated LRT at 126 and 80 in
MRTS, hence the requirement for a
larger depot.
Permanent Way R. Km. Assumed as part of alignment cost
Traction & power
Elevated R. Km. 5.50 Pared down from metro rail
Lift Each 0.30 Same for all three systems
Escalator Each 1.00 Same for all three systems
Signalling and Telecom.
Signalling R. Km. 9.00 Taken lower than metro rail, but in practice to get a headway of 3 or
below signaling costs has been
increased to same level of 13 crore per
km of metro rail
Telecom Each Stn. 2.00 Lower than metro rail
Automatic fare collection Each Stn. 2.50 AFC cost for monorail expected to be
lower due to lower number of gates
R & R R. Km. 2.00 Taken at lump sum
Misc. Civil Utilities R. Km. 2.00 Taken at lump sum
Electrical Utilities R. Km. 2.50 Taken at lump sum
Telecom Utilities R. Km. 0.50 Taken at lump sum
Rolling Stock (SG) Each 10.00 After evaluating rolling stock prevailing
prices, rolling stock for all three systems
has been assumed at the same amount
of 10 crore per car unit
General Charges (except land) @ 3%
Contingencies @ 3%
Source: Kozhikode Monorail DPR and IUT assumptions.
8.4.3 Light Rail
There is no light rail system present in the country and recently no DPR has been prepared
for the same. The latest available DPR was prepared about 5 years ago for a 45 km stretch
in Delhi. Based on the Delhi DPR, the updated cost is as below.
Table 8-13: Assumed CAPEX of Delhi LRT proposal with updated cost
Description Delhi LRT
(INR in
Crore at
2007-08
price
levels)
Assumed
cost of LRT
(R. Km.)
(INR in
Crore)
Assumed
Total Cost
at 2012
levels (INR
in Crore) for
45 Km
Remarks for Assumed Cost
Land @19.12% @15% 675.00 Assuming at grade alignment the
land cost will be higher than the
elevated structure, 15% has been
assumed for at-grade. The 19%
assumption in DPR was on higher
side and has been tapered down.
Fixed Infrastructure – Civil 442.00 13.00 585.00 Escalated annually at 5%
Fixed Infrastructure –
Electrical Systems
300.00 9.00 405.00 Escalated annually at 5%

LIFE CYCLE COST ANALYSIS OF FIVE URBAN TRANSPORT SYSTEMS
Bangalore Metro Rail Corporation Limited
54
Fixed Infrastructure - Depot &
OCC
483.00 14.00 630.00 Escalated annually at 5%
Rolling Stock 1,456.00 52.00 2,340.00 For the purpose of this table has
been escalated at 10% p.a. in line
of cost increase trend of rolling
stock in recent years. In actual
calculation per unit rolling stock
cost has been assumed at Rs. 10
Crore at the same level as Monorail
rolling stock cost and Metro Rail
rolling stock cost.
Signaling, Telecom & AFC 84.00 2.00 90.00 Escalated annually at 5%
Taxes & Duties 345.00 10.00 450.00 Escalated annually at 5%
Total 3,776.00 100.00 5,175.00
Total R. Km. 83.91 115
Based on the assumptions made above, the total capital expenditure cost for a 20 km
long light rail system at-grade would be approximately Rs. 2,300 Crore.
However, for the purpose of arriving at per km cost for LRT – at grade the following
assumption has been made:
Table 8-14: Assumed CAPEX of At Grade Light Rail System for LCCA
Description Unit Assumed Cost
(INR in Crores)
Remarks
Land @ 10%
Fixed Infrastructure - Civil R. Km 13.00
Fixed Infrastructure - Electricals R. Km 9.00
Depot Lump sum 100.00
OCC Lump sum 40.00
Rolling Stock Each 10.00
Signaling R. Km 2.00
General Charges @ 3%
Contingencies @ 3%
The capital cost calculation of elevated Light Rail has been done because it will be more
appropriate to compare elevated metro rail and elevated monorail with the elevated
light rail. The cost arrived at is as follows:
Table 8-15: Assumed CAPEX of Elevated Light Rail Transit System for LCCA
Description Unit Assumed Cost
(INR in Crore)
Remarks
Land @ 10% Land cost assumed uniformly for all the three
systems
Alignment and Formation
Elevated viaduct section R. Km. 21.00 Assumed closer to monorail
OCC Building LS 40.00 Assumed same as monorail
Station Buildings Each 10.00 Smaller station buildings have been assumed
as compared to metro rail, kept closer to
monorail
E&M Works
Elevated station (E&M, Lifts, etc.) Each Stn. 2.50 Assumed same as monorail
Depot LS 70.00 Based on a rolling stock requirement for 126
cars

LIFE CYCLE COST ANALYSIS OF FIVE URBAN TRANSPORT SYSTEMS
Bangalore Metro Rail Corporation Limited
55
Permanent Way R. Km. 5.00 Pared down from the cost of permanent
way for metro rail
Traction & power
Elevated R. Km. 5.50 Same as monorail
Lift Each 0.30 Same for all three systems
Escalator Each 1.00 Same for all three systems
Signalling and Telecom.
Signalling R. Km. 8.00 Light rail has the lowest signaling systems
costs among all the rail-based systems
Telecom Each Stn. 2.00 Same as monorail
Automatic fare collection Each 2.50 Same as monorail as similar number of gates
are expected
R & R R. Km. 2.00 Taken at lump sum
Misc. Civil Utilities R. Km. 2.00 Taken at lump sum
Electrical Utilities R. Km. 2.50 Taken at lump sum
Telecom Utilities R. Km. 0.50 Taken at lump sum
Rolling Stock (SG) Each 10.00 After evaluating rolling stock prevailing
prices, rolling stock for all three systems
has been assumed at the same amount
of 10 crore per car unit General Charges (except land) @ 3%
Contingencies @ 3%
Having arrived at construction costs of the three systems, their unit cost competitive table
has been given below.
Table 8-16: Comparative Assumptions for Elevated Rail-based Systems (INR in Crores)
Description Unit Metro
Rail
Mono
Rail
Light
Rail
Remarks
Land @
10%
@ 10% @
10%
Land cost assumed uniformly for all the
three systems
Alignment and Formation
Elevated viaduct section R. Km. 32.00 22.50 21.00 For Metro rail, DMRC PH-II completion
cost and PH-III estimate has been used.
For Monorail it has been rounded off
from the Kozhikode Monorail DPR
estimate. The Light Rail figures have
been approximated.
OCC Building LS 50.00 40.00 40.00 For Metro rail, the HMRL OCC Building
cost has been assumed, while for the
monorail and light rail a discounted
figure has been taken.
Station Buildings Each 16.00 9.00 10.00 For Metro rail, the DRMC Ph-II
completion costs & the Ph-III estimates
have been considered. The Kozhikode
Monorail DPR estimate has been used
for derivation of the Monorail cost. LRT
Station cost has been kept closer to
monorail.
E&M Works
Elevated station (E&M, Lifts, etc.) Each Stn. 7.00 2.50 2.50 The Metro rail cost has been derived
from the DMRC cost for Ph-II
completion and Ph-III estimate. The
Monorail and Light Rail costs have
been pared down from derived Metro
rail costs.
Depot LS 50.00 120.00 70.00 The metro rail cost is a derivation from
DMRC Ph-II & Ph-III estimate. Monorail &
Light Rail depot has been kept at 80%
of the Metro Rail cost.

LIFE CYCLE COST ANALYSIS OF FIVE URBAN TRANSPORT SYSTEMS
Bangalore Metro Rail Corporation Limited
56
Permanent Way R. Km. 7.00 5.00 The DMRC Ph-II Completion & Ph-III
estimates have been considered for
the Metro rail cost. The Monorail cost is
included in the cost of alignment. Light
Rail has been considered at a
discounted rate from Metro Rail.
Traction & power
Elevated R. Km. 8.00 5.50 5.50 The DMRC Ph-II Completion & Ph-III
estimates have been considered for
the Metro rail cost. The Monorail cost
has been based on the Kozhikode DPR.
Light Rail has been considered as the
same as monorail.
Lift Each 0.30 0.30 0.30 Assumed uniformly for all three systems
Escalator Each 1.00 1.00 1.00 Assumed uniformly for all three systems
Signalling and Telecom.
Signalling R. Km. 13.00 9.00 8.00 The DMRC Ph-II Completion & Ph-III
estimates have been considered for
the Metro rail cost. The Monorail cost
has been based on the Kozhikode DPR.
As Light Rail is proposed as a two-
coach system it has been kept lower
than monorail.
Telecom Each Stn. 3.00 2.00 2.00 The DMRC Ph-II Completion & Ph-III
estimates have been considered for
the Metro rail cost. The Monorail cost
has been based on the Kozhikode DPR.
Due to similar system size, the monorail
cost has been used as the light rail cost.
Automatic fare collection Each Stn. 3.40 2.50 2.50 The DMRC Ph-II Completion & Ph-III
estimates have been considered for
the Metro rail cost. The Monorail cost
has been based on the Kozhikode DPR.
Due to similar system size, the monorail
cost has been used as the light rail cost.
R & R R. Km. 3.20 2.00 2.00 Assumed at lump sum
Misc. Civil Utilities R. Km. 3.80 2.00 2.00 Assumed at lump sum
Electrical Utilities R. Km. 2.90 2.50 2.50 Assumed at lump sum
Telecom Utilities R. Km. 0.50 0.50 0.50 Assumed at lump sum
Rolling Stock (SG) Each 10.00 10.00 10.00 After evaluation of prevailing
rolling stock prices, rolling stock for
all three systems has been
assumed at the same amount of
10 crore per car unit General Charges (except land) @ 3% @ 3% @ 3%
Contingencies @ 3% @ 3% @ 3%
Based on the above cost data, the total cost per km and the total cost for a 20km stretch
for the rail-based systems have been computed as below:
Table 8-17: Assumed per km and 20 km stretch cost for rail-based systems (INR in Crores)
System Cost/Km Cost for 20 Km
Metro Rail 160.92 3218.33
Monorail 204.92 4098.47
LRT – At Grade 117.87 2357.32
LRT Elevated 157.08 3141.54
The calculations considered above do not include the taxes and duties; however their
influence has been recorded in the final model as annexed in Annexure III – THE LCCA
Calculation Tables of this report.

LIFE CYCLE COST ANALYSIS OF FIVE URBAN TRANSPORT SYSTEMS
Bangalore Metro Rail Corporation Limited
57
8.4.4 Bus Rapid Transit
There are two BRTS systems which are operational in the country, one in Delhi and the
other one in Ahmedabad, whereas there are several DPRs which are available. The
assumptions were made after critical analysis of the costs assumed in Delhi, Ahmedabad
and Rajkot. The assumptions are as below:
Table 8-18: Assumed CAPEX of Bus Rapid Transit system for LCCA
Description Unit Assumed
cost of
BRT
(INR in
Crore)
Remarks for Assumed Cost
Roadway Development R. Km. 8.55 Average cost of Ahmedabad Ph-I, Ph-II and Rajkot
escalated @ 5%
Bus Stops Each 0.40 Average cost of Ahmedabad Ph-I, Ph-II and Rajkot
escalated @ 5%
Foot over Bridges Each 0.25 Average cost of Ahmedabad Ph-I, Ph-II and Rajkot
escalated @ 5%
Operational Infrastructure (Terminals
& Depots)
Depots Each 10.00 As Assumed in the Working Group report on Urban
Transport
Workshops and Terminals Each 20.00 As Assumed in the Working Group report on Urban
Transport
OCC LS 10.00 Provided for separately
Bridges and Flyovers R. Km. 31.80 Average cost of Ahmedabad Ph-I, Ph-II and Rajkot
escalated @ 5%
ITS application and External Tracking LS 29.50 Average cost of Ahmedabad Ph-I, Ph-II and Rajkot
escalated @ 5%
Bus Cost Each 0.40 As Assumed in the Working Group report on Urban
Transport
With above assumptions the cost of a 20 km long BRT system inclusive of bus costs would
be approximately Rs. 1022.55 Crore. If we exclude the bus cost, the total CAPEX involved
in development of 20 km BRT system will be down to Rs. 400 Crore.
8.4.5 Ordinary Bus Service
The CAPEX for ordinary bus services have been assumed using the latest infrastructure
development cost of Delhi Transport Corporation for the CWG 2010. The assumed costs
are as below:
Table 8-19: Assumed CAPEX of Ordinary Bus system for LCCA
Description Unit Assumed Cost
(INR in Crore)
Remarks
Bus Stops Each 0. 30
Depots Each 10.00 Workshops and Terminals Each 25.00
ITS application and External Tracking Lump Sum 50.00
Bus Cost
Standard Each 40.00
AC Low Floor Each 60.00
Non AC Low Floor Each 50.00
Land Cost @5%
General Consultancy @2%
Contingency Charges @3%

LIFE CYCLE COST ANALYSIS OF FIVE URBAN TRANSPORT SYSTEMS
Bangalore Metro Rail Corporation Limited
58
With above assumptions the cost of a 20 km long ordinary bus system inclusive of bus costs
would be approximately Rs. 300 Crore. If we exclude the bus cost, the total CAPEX
involved in development of 20 km ordinary bus system becomes close to approximately
Rs. 120 Crore.
As various costs such as the cost of road and flyovers are not involved in the development
of ordinary bus services in the city, the cost of development is lowest as compared to the
other selected urban transport modes. The development of roads in the mega cities and
other metro cities could be assumed at a rate of Rs. 4 Crore per km. For other cities the
cost of development of roads could be assumed at a rate of Rs. 2 Crore per km. Apart
from road, to allow free flow of traffic (at railway crossings, major signals etc.), flyovers and
road over bridges are also required whose developmental costs could be assumed at Rs.
25 Crore per Km.
8.5 System Wise Operation & Maintenance Cost Assumptions
The assumptions which were taken in this study for deriving the operations and
maintenance cost of the urban transport systems are divided mainly among three critical
parameters:
The assumptions taken for the components of the operations and maintenance costs for
the selected systems are presented in the subsequent sections.
8.6 Energy Cost
Fuel is one of the most essential operational expenses in the operational cycle of the
urban transport systems. For enterprise use, Electricity and Diesel are generally the two
most common fuels.
8.6.1 Rail Based Systems
For rail based systems, electricity is the fuel of choice based on the technology and the
environmental impact scenario. Metro Rail, Mono Rail and modern LRT all three run on
electric traction.
The average crush load for Metro Rail, Mono Rail and Light Rail coaches has been
considered as 50 tons, 28 tons and 35 tons based on the specifications provided by the
manufacturers. From the DPR of various rail based system it was established that Traction
Energy Costs Staff Costs Repair and
Maintenance Costs
Replacements

LIFE CYCLE COST ANALYSIS OF FIVE URBAN TRANSPORT SYSTEMS
Bangalore Metro Rail Corporation Limited
59
Energy Consumption per 1000 GTKM is 70 KWh. The example below reflects the
calculations to derive the traction energy consumption:
Average Weight of a metro car with Normal and Crush Load has been taken as 50
Tonnes. Thus per car per km energy consumption is = 50*70/1000 = 3.5 KWh. The
Regeneration potential of a rolling stock has been defined as 20%, thus average per car
km energy consumption for metro rail systems is = 3.5*(1-20%) = 2.38 KWh.
Similarly energy consumption per car km for monorail and light rail has been considered
as 1.57 KWh and 1.96 KWh respectively.
Auxiliary Power consumption per station per day as per latest rail based DPR is 200 KW
which is expected to become 300 KW by 2021. We are considering a consumption of 250
Kw per station per day for 2015. Load factor which has been considered is 100% for 24hr.,
85% for 22 hr., 75% for 20 hr. (As per discussion with DMRC) of operations has been
considered. Since in this study every day operation of 19 hours has been considered thus
the Weighted Average Load factor is assumed as 70%.
Similarly the latest prepare DPRs suggest auxiliary power consumption for metro rail
systems per Depot per day as 2000 KW which expected to become 2500 KW by 2021 and
about 1050 KWh for mono rail and light rail systems. In this study a power consumption of
2200 KWh and 1050 KWh has been considered for metro rail and monorail/light rail systems
respectively with a load factor of 60% in year 2015.
For this study, IUT has adopted the initial electricity supply rate of Rs. 4 per KW (2012
prices). The same has been escalated at a rate of 5% per annum.
8.6.2 Bus Based Systems
Buses in India usually run on either Compressed Natural Gas (CNG) or Diesel. Between
Diesel and CNG, CNG is currently the more economical and more environmentally
friendly source of energy; however it is also the more recent entrant as a fuel of choice
and has as yet seen restricted use. Because of this the study has used the diesel prices
and the initial Diesel pricing for this study has been chosen at Rs. 45 per litre, with an
annual price increase at 5%. The price chosen has been derived by taking an average of
the prices currently prevalent in the major metropolitan cities of the country. But in case of
price deregulation diesel prices can go substantially up there by affecting the cost
efficiency of BRTS and Ordinary Bus Services.
Between 1998 and 2003, the judiciary of India, both the Supreme Court and High Court
have promoted the adoption of Natural Gas as the medium for public transport in India.
Under the influence of the Supreme Court and High Courts, the cities of Delhi, Bangalore,
Hyderabad, Chennai, Ahmedabad, Kanpur, Lucknow, Sholapur, Mumbai and Kolkata

LIFE CYCLE COST ANALYSIS OF FIVE URBAN TRANSPORT SYSTEMS
Bangalore Metro Rail Corporation Limited
60
were asked to submit action plans for improvement of air quality in the cities.
Implementation of CNG was a common strategy adopted by all the cities. The cities
which did not have access to CNG like Bangalore and Chennai, had listed LPG
programmes to reduce the pollution levels of the city.
Despite restricted adoption of Natural Gas as a fuel substitute in the majority of the
country, IUT has considered a model incorporating CNG as the fuel choice to ensure that
the future scenarios are amiably depicted. The CNG price chosen for this study is Rs. 40
per kg with an escalation of 5%. However in actual calculation in the financial model it is
the diesel prices which have been used and not the CNG prices.
8.7 Human Resource Cost
Human Resource and Energy Expenses together comprise bulk of O&M expenses of urban
transport systems.
The five urban transport systems are each in their own way complex and have intricate
organisational hierarchies. For the purpose of this study, IUT has chosen to simplify the
reference to the human capital by generating a staff requirement per km ratio in the case
of both rail based and bus based systems. This has been done by first generating the total
staff requirement based on allocated job responsibility or job function and then dividing it
by the total length of the system.
In the case of rail-based systems, data from DMRC was collated and used to derive a
benchmark for use with the models created for Metro, Monorail and Light Rail. CIRT data
was used to derive figures chosen for BRTS and Ordinary Buses.
Another important consideration in relation to Human Resources is the remuneration, for
this purpose, a system average has been chosen based on the 6th Pay Commission. The
remuneration has been kept at an average of Rs. 9 lakhs per annum with a yearly
increment of 9%.
The staff requirement per km derived for the various systems has been provided in the
table below:
Table 8-20: Assumed Human Resource Requirement for the Urban Transport Systems
System Staff Requirement (Per km)
Metro Rail 31.70
Monorail 25.20
Light Rail 19.85
BRTS 92.50
Ordinary Buses 103.25
The staff requirement for the bus based system is based on buses that are being required.
For every bus a staff requirement of 5 has been assumed which has been detailed out in
Annexure II – Human Resource Requirement Detail of this report. E.g. the staff requirement

LIFE CYCLE COST ANALYSIS OF FIVE URBAN TRANSPORT SYSTEMS
Bangalore Metro Rail Corporation Limited
61
for 370 buses in case of BRTS is estimates as 1,850 which is 92.5 staffs per km (if the corridor
length is 20 km as assumed in the hypothetical case). Similar are the calculations for
ordinary bus services.
8.8 Repair and Maintenance Cost
8.8.1 R&M Cost for Rail Based Systems
The repair and maintenance cost figures of Delhi Metro which was available for this study
in a granular detail as provided in section Operation & Maintenance Cost Information of
this report has been considered as the base. The base figure which has been assumed for
this study to get the repair and maintenance costs is presented in the table below:
Table 8-21: Unit Cost of Repair & Maintenance (2010 Prices) of DMRC
Unit Cost of Repair & Maintenance (2010 Prices) of DMRC
Building 26.74 Rs Lakh per Station
Plant & Machinery 11.40 Rs Lakh per Car
Other R&M 2.2% Of Building, Plant & Machinery Costs
Other O&M Costs 11% of Energy, Staff and R&M costs
The rates as presented in the above table has been escalated at the assumed inflation
rate of 5% to arrive at the 2012 prices of the R&M for metro rail system and the same is
presented in the table below:
Table 8-22: Assumed Unit Cost of R&M for Metro Rail System (2012 prices)
Assumed Unit Cost of Repair & Maintenance (2012 prices)
Building 29.48 Rs Lakh per Station
Plant & Machinery 12.57 Rs Lakh per Car
Other R&M 2.3% Of Building, Plant & Machinery Costs
Other O&M Costs 11% of Energy, Staff and R&M costs
To arrive at the mono rail and light rail system which have lower R&M cost, the above
considered R&M costs of Metro Rail system have been discounted by 25%. The assumed
R&M cost for mono rail and light rail systems are presented in the table below:
Table 8-23: Assumed Unit Cost of R&M for Mono/Light Rail System (2012 prices)
Mono Rail and light rail
Building 22.11 Rs Lakh per Station
Plant & Machinery 9.43 Rs Lakh per Car
Other R&M 2.3% Of Building, Plant & Machinery Costs
Other O&M Costs 11% of Energy, Staff and R&M costs
8.8.2 R&M Cost for Bus Based Systems
Based on the analysis of the R&M cost of bus based system from the data compiled from
CIRT journals, the summary of R&M cost is presented in the table below:

LIFE CYCLE COST ANALYSIS OF FIVE URBAN TRANSPORT SYSTEMS
Bangalore Metro Rail Corporation Limited
62
Table 8-24: Unit cost of Repair and Maintenance (2011 prices CIRT analysis)
Component Cost Unit
Building/roads 2.00 Rs Lakh per bus stop
Tyres & Tubes 1.08 Rs per effective Km
Spare Parts 1.07 Rs per effective Km
Other R&M costs 2% of building spare and Tyres
The R&M costs derived above has been extrapolated for 2012 prices using the inflation
rate assumed in this study. The assumed R&M cost of bus based system is presented in the
table below:
Table 8-25: Assumed Unit Cost of R&M for Bus Based Systems
Component Cost Unit
Building/roads 2.10 Rs Lakh per bus stop
Tyres & Tubes 1.13 Rs per effective Km
Spare Parts 1.12 Rs per effective Km
Other R&M costs 2% of building spare and Tyres
In addition to the above R&M costs, another component of other O&M cost at the rate of
11% of the Staff, Energy and R&M cost has been considered in this study.
8.9 Replacement Cost
Due to constant wear and tear, it is essential that life duration be determined for the
various components of each system, so that they may be replaced post completion of
this period to ensure that they do not become a safety hazard and a drain on resources
due to frequent breakdown and maintenance requirements.
The table below lists the replacement time in years, the components to be replaced and
the percentage of replacement essential to further increase the life of the system as
assumed by IUT for this study.
Table 8-26: Assumed Time and Percentage Replacement for Rail Based Systems
Replacement Time
(in years)
Rail Based Systems
E&M Works 10 100.00%
Permanent Way 50 100.00%
Traction & power 20 100.00%
Signalling and Telecom 15 100.00%
Automatic fare collection 15 100.00%
Rolling Stock 25 20.00%
Table 8-27: Assumed Time and Percentage Replacement for Bus Based Systems
Replacement Time
(in years)
Bus Based Systems
Roadways 20 50.00%
Bus Stops 20 50.00%
Foot over bridge 20 50.00%

LIFE CYCLE COST ANALYSIS OF FIVE URBAN TRANSPORT SYSTEMS
Bangalore Metro Rail Corporation Limited
63
Replacement Time
(in years)
Bus Based Systems
ITS application 10 100.00%
Buses 10 100.00%
8.10 Financial Assumptions
For arriving at the Life Cycle Cost IUT has assumed various financial assumptions for both
development and O&M stage. Key factors influencing the total cost are elaborated
below:
8.10.1 Taxes & Duties
Different urban transport systems in the country have had differential experience with
regard to applicable Taxes & Duties Structure. But invariably in all the cases preferential
tax treatment has been provided and the projects often have been provided with either
a partial or complete waiver from the payment of applicable taxes and duties and such
waivers have come both from central and state governments. However, the country does
not have any uniform policy prescription in this regard. In the interest of harmonisation
and ensuring level playing field, in the life cycle cost calculation taxes and duties at
prevalent level have been assumed. IUT has chosen to include all relevant taxes and
duties at full weightage in the study. The taxes and duties for rail-based systems and bus
based systems differ in their structure and quantum.
8.10.1.1 Customs Duty
A customs duty is assumed as under:
Table 8-28: Assumed Customs Duty for Urban Transport Systems
System Type Customs Duty Remarks
Rail Based Systems 18.62 Based on Latest estimates
Bus Based Systems 18.62 Based on Latest estimates
8.10.1.2 Excise Duty
Excise duty assumed is as under and is based on Latest Estimates:
Table 8-29: Assumed Excise Duty for Urban Transport Systems
System Type Excise Duty Remarks
Rail Based Systems 8.24 Based on Latest Estimates
Bus Based Systems 26.00 Based on Latest Estimates
8.10.1.3 VAT
VAT or Value Added Tax assumed as follows:

LIFE CYCLE COST ANALYSIS OF FIVE URBAN TRANSPORT SYSTEMS
Bangalore Metro Rail Corporation Limited
64
Table 8-30: Assumed VAT for Urban Transport Systems
System Type VAT Remarks
Rail Based Systems 12.50 Based on Latest Estimates
Bus Based Systems 12.50 Based on Latest Estimates
8.10.1.4 Sales Tax
Sales tax where applicable is assumed as follows:
Table 8-31: Assumed Sales Tax for Urban Transport Systems
System Type Sales Tax Remarks
Rail Based Systems 6.25 Based on Latest Estimates
Bus Based Systems 6.25 Based on Latest Estimates
8.10.1.5 Works Contract Tax
The Works Contract Tax has been levied as per the table below:
Table 8-32: Assumed Works Contract Tax for Urban Transport Systems
System Type Works Contract Tax Remarks
Rail Based Systems 6.25 Based on Latest Estimates
Bus Based Systems 6.25 Based on Latest Estimates
8.10.2 Escalation Rate
In order to bring the prices up to the 2012 levels all costs have been subjected to a
uniform escalation at 5% though it is possible that there are year to year variations.
8.10.3 Interest Rate
Interest rate assumptions have provided special difficulties because for certain rail based
systems loan has been provided for very long term and at a concessional rate whereas for
bus based systems, the new low floor buses have been provided to various cities under
JNUURM almost as a grant. Instead of assuming a market driven interest rate, a nominal
5% interest rate has been assumed for all the systems.
8.10.4 Discount Rate
The discount rate is the rate at which the future costs are discounted to ascertain their
present value. IUT has assumed a uniform 10% discount rate for this study
8.10.5 Debt Equity Ratio
The Debt Ratio deals with the financing strategy adopted. It tells us the ratio of investment
sought for the project in terms of equity and debt. In this case IUT has chosen different
ratios based on the type of system, whether Rail based or Bus Based.

LIFE CYCLE COST ANALYSIS OF FIVE URBAN TRANSPORT SYSTEMS
Bangalore Metro Rail Corporation Limited
65
8.10.5.1 Debt Equity Ratio for Rail Based Systems
For rail-based systems the debt equity ratio adopted is 70:30 and debt repayment period
has been assumed to be 15 years.
8.10.5.2 Debt Equity Ratio for Bus Based Systems
The ratio chosen for bus-based systems is 70:30 but the debt repayment period has been
assumed to be 10 years.
8.11 Depreciation
The Depreciation has been charged at different rates for different components of the
systems. The charge has been levied at a uniform rate across the life-cycle of the urban
transport systems from the time they begin operations.
The table below lists the different rates assumed for different components of the various
systems. The table also lists the rate of depreciation to be charged post the refurbishment
to extend the life of the system.
Table 8-33: Assumed Depreciation for the Urban Transport Systems
Depreciation Rail Based Bus Based
E&M Works 10.00% Road 5.0%
Permanent Way 2.00% Bus Stops & FOB 5.0%
Traction & power 5.00% Civil 2.0%
Signalling and Telecom 6.67% ITS application 10.0%
Automatic fare collection 6.67% Buses 10.0%
Rolling Stock 4.00%
Civil 2.00%
Table 8-34: Assumed Depreciation for the Rail based Systems post Refurbishment
Depreciation Rail Based Estimated Life (years)
E&M Works 15 6.67%
Permanent Way 15 6.67%
Traction & power 15 6.67%
Signalling and Telecom 15 6.67%
Automatic fare collection 15 6.67%
Rolling Stock 15 6.67%

LIFE CYCLE COST ANALYSIS OF FIVE URBAN TRANSPORT SYSTEMS
Bangalore Metro Rail Corporation Limited
66
9 LIFE CYCLE COST ANALYSIS
This chapter provides the results which were obtained from the LCC analysis performed for
all the selected five systems. The preliminary section of the chapter explains the results
obtained for the hypothetical case assumed in the beginning of the analysis whereas the
later part of the chapter converts the analysis to bring in to account the design capacity
of the modes in varying train compositions (in the case of guided modes), the PHPDT and
the demand level i.e. actual possible usage.
9.1 Results of the Hypothetical Case
The LCC analysis for the systems has been based on the hypothetical premise of 15,000
PHPDT, 20 kilometre corridor and 30 years of projected costs.
In order to ascertain the LCC per seat, it was essential that the number of seats available
be calculated. This has been ascertained by multiplying the capacity of each vehicle set
with the total sets required for the functioning of the system as ascertained in Annexure I –
Rolling Stock Requirement Assessment.
Per seat LCC obtained for the systems are in the table below:
Table 9-1: Results of the per seat LCC for the Hypothetical Case
Systems Number of Seats LCC (NPV in INR Crore) LCC per seat (in INR Lakh)*
Metro Rail 25,300 7,792.49 30.80
Monorail 27,264 7,676.58 28.16
LRTS (Elevated) 28,072 6,539.18 23.29
LRTS (At Grade) 30,008 4,578.65 15.26
BRTS 29,600 6,574.69 22.21
Buses 33,040 5,727.82 17.34
*LCC per seat (in INR Lakh) at NPV for the assumed lifespan of 30 years
It may be noted that LRTS (At grade) has the least per seat life cycle cost of Rs 15.26 lakh.
The LCC of both bus (Rs. 17.34 lakhs) and BRT (Rs 22.21 lakhs) is higher than that of LRTS (At
grade). The LCC of Metro rail is high because it is a high capacity mode, much beyond
the assumption of 15000 PHPDT made for the hypothetical case.
9.2 Scenarios under the Hypothetical Case at different Demand Levels
The Life cycle cost of each mode would depend on its usage i.e. demand level. Hence
specific cases of impact on life cycle cost of various modes at different demand levels
are evaluated in the succeeding paragraphs.

LIFE CYCLE COST ANALYSIS OF FIVE URBAN TRANSPORT SYSTEMS
Bangalore Metro Rail Corporation Limited
67
9.2.1 Scenario I – 5,000 PHPDT
Systems Number of Seats LCC (NPV in INR Crore) LCC per seat
(in INR Lakh)*
Metro Rail 9,900 6,347.61 64.12 Monorail 9,216 4,873.77 52.88 LRTS (Elevated) 9,196 4,934.55 53.66 LRTS (At Grade) 10,164 2,905.39 28.59 BRTS 9,920 3,167.30 31.93 Buses 10,960 1,960.63 17.89
*LCC per seat (in INR Lakh) at NPV for the assumed lifespan of 30 years
It may be noted that at per seat LCC of Rs 17.89 Lakhs Buses qualify as the cheapest
mode. It may further be noted that LRT (At grade) (Rs 28.59 is cheaper than BRTS (Rs 31.93
lakhs). Both Monorail and LRTS elevated have almost identical LCC at this level of traffic,
while Metro Rail is the costliest alternative.
9.2.2 Scenario II – 10,000 PHPDT
Systems Number of Seats LCC (NPV in INR Crore) LCC per seat
(in INR Lakh)*
Metro Rail 17,600 7,070.02 40.17 Monorail 18,048 6,248.68 34.62 LRTS (Elevated) 18,392 5,718.73 31.09 LRTS (At Grade) 19,844 3,723.89 18.77 BRTS 20,000 4,929.13 24.65 Buses 22,080 3,844.51 17.41
*LCC per seat (in INR Lakh) at NPV for the assumed lifespan of 30 years
At 10,000 PHPDT, the LCC of all the modes except bus comes down substantially. Bus
service is the cheapest mode, but bus service is unable to meet the demand, It may
further be noted that LRTS (At grade) continues to be cheaper than BRTS.
9.2.3 Scenario III – 12,000 PHPDT
Systems Number of Seats LCC (NPV in INR Crore) LCC per seat
(in INR Lakh)*
Metro Rail 20,900 7,376.61 35.29
Monorail 22,272 6,899.05 30.98
LRTS (Elevated) 21,780 6,006.35 27.58
LRTS (At Grade) 23,716 4,045.82 17.06
BRTS 23,840 5,590.41 23.45
Buses 26,400 4,576.22 17.33
*LCC per seat (in INR Lakh) at NPV for the assumed lifespan of 30 years
At 12,000 PHPDT, the LCC of all modes except bus comes down further; indeed bus
service cannot meet the demand. At this level, the LRT (At grade) becomes cheaper than
bus service. It may further be noted that LRT (At Grade) continues to be cheaper than
BRTS. However, the number of coaches in a train will need to be higher in case of
Monorail and LRT, to meet the increase in demand.

LIFE CYCLE COST ANALYSIS OF FIVE URBAN TRANSPORT SYSTEMS
Bangalore Metro Rail Corporation Limited
68
9.2.4 Scenario IV – 17,000 PHPDT
Systems Number of Seats LCC (NPV in INR Crore) LCC per seat
(in INR Lakh)*
Metro Rail 28,600 8,094.73 28.30 Monorail 31,488 8,326.95 26.44 LRTS (Elevated) 31,460 6,826.81 21.70 LRTS (At Grade) 33,396 4,866.28 14.57 BRTS 33,760 7,313.48 21.66 Buses 37,360 6,459.54 17.29
*LCC per seat (in INR Lakh) at NPV for the assumed lifespan of 30 years
At a PHPDT of 17,000 the LCC of all modes except bus comes down further. The bus
service cannot meet the demand. The LRT (At Grate) become considerably cheaper
than both the bus service and BRT. In order to meet the increased demand the number of
coaches in the case of Monorail and LRT will have to be increased to meet the demand.
9.2.5 Scenario V – 27,000 PHPDT
Systems Number of Seats LCC (NPV in INR Crore) LCC per seat
(in INR Lakh)*
Metro Rail 47,300 9,805.52 20.73 Monorail 49,536 11,131.55 22.47 LRTS (Elevated) 49,852 8,391.29 16.83 LRTS (At Grade) 53,240 6,533.71 12.27 BRTS 53,440 10,720.88 20.06 Buses 59,440 10,242.01 17.23
*LCC per seat (in INR Lakh) at NPV for the assumed lifespan of 30 years
At 27,000 PHPDT, the LCC of all modes except bus comes down even further. The bus
services cannot satisfy the contract. For the first time Metro rail becomes cheaper than
the monorail. At this level LRT (both) elevated and at grade becomes considerably
cheaper than both the bus service and BRT. However, the number of coaches in a train in
a train in the case of Monorail and LRT will have to be increased to meet the demand.
9.3 Summary of Per Seat LCC of Selected Systems
The analysis has shown that LRTS (At Grade) has the least per seat life cycle cost of Rs
15.26 lakh. The LCC of both bus (Rs 17.34 lakhs) and BRT (Rs 22.21 lakhs) is higher than that
of LRTS (At Grade). The LCC of Metro rail is high because it is a high capacity mode, much
beyond the assumption of 15000 PHPDT made for the hypothetical case. Therefore for a
proper comparison, the LCC of various modes has been calculated at different PHPDT
levels i.e. demand or usage level. The result is summarized in the table below. At this
hypothetical stage it has been assumed that capacity of various modes is not a limitation.
This aspect of modal capacity and feasibility has been examined later in this section
PHPDT Metro Rail Monorail LRTS (Elevated) LRTS
(At Grade)
BRTS Buses
3000 80.80 69.45 73.10 39.42 41.27 17.75

LIFE CYCLE COST ANALYSIS OF FIVE URBAN TRANSPORT SYSTEMS
Bangalore Metro Rail Corporation Limited
69
5000 56.94 49.24 49.32 27.59 31.81 17.78
7000 45.03 39.32 38.34 22.83 27.81 17.51
10000 36.12 32.77 28.92 18.26 24.59 17.36
12000 31.88 29.47 25.74 16.63 23.40 17.29
15000 27.98 26.93 21.86 14.91 22.17 17.30
20000 23.14 24.05 18.85 13.31 21.01 17.22
25000 19.97 22.33 16.76 12.30 20.21 17.24
30000 18.39 21.14 15.37 11.64 19.75 17.19
35000 16.89 20.34 14.33 11.20 19.37 17.19
40000 16.05 19.74 13.60 10.88 19.14 17.16
45000 15.39 19.29 13.04 10.62 18.92 17.18
50000 14.67 18.91 12.59 10.39 18.77 17.19
It may be noted from the above table that LRTS (At grade) remains the cheapest mode
at various levels of demand. In all cases LCC reduces substantially as the PHPDT (i.e.
demand) increases except in the case of buses. Furthermore in terms of life cycle cost
elevated LRTS also becomes cheaper than BRTS above 15,000 PHPDT.
The table further shows that elevated LRTS is cheaper than Metro rail at all levels of PHPDT
i.e. demand level. Between Metro rail and Monorail, the table shows that Monorail is
cheaper than Metro rail up to 15000 PHPDT. However Metro rail is cheaper than Monorail
above 15,000 PHPDT. However, a comparison between Metro rail and Monorail is
irrelevant because firstly monorail is a medium capacity mode and secondly monorail is
recommended for special locations where the road right of way is limited and elevated
Metro rail or elevated LRTS will be unsuitable for environmental reasons.
9.4 Impact of Capacity Limitations
In actual practice, all modes have an upper limit to capacity; for example bus with a
capacity of 80 persons operating at 1 minute headway can carry a maximum of 4,800
PHPDT and not 15,000 PHPDT as assumed in the hypothetical case. Similarly, Metro rail is a
very high capacity mode compared to Monorail, LRTS and BRTS. The limiting capacity of
each mode depends on factors such as the number of coaches in a train and the
frequency of service. The maximum capacity of a mode as per the coach configuration
of the train is presented in Table 8-5: Maximum PHPDT capacity of different modes at
varying train configuration of the report, reproduced below.
Table 9-2: Maximum PHPDT capacity of different modes at varying train configuration
System Coach Configuration of the Train
Train Set Capacity Maximum PHPDT
Metro Rail 4 1100 26,400 6 1650 39,600 8 2200 52,800
Mono Rail 3 384 9,216

LIFE CYCLE COST ANALYSIS OF FIVE URBAN TRANSPORT SYSTEMS
Bangalore Metro Rail Corporation Limited
70
6 768 18,432 9 1,152 27,648
Light Rail 2 484 11,616 4 968 23,232
BRTS 1 80 8,000 2 160 16,000
Ordinary Buses 1 80 4,800
Headway for Rail Based Systems has been assumed at 2.5 minutes, whereas for BRTS it has been assumed at 0.6
minutes and for Ordinary Buses at 1 minute.
The LCC of the various modes for variable capacity and actual possible usage is shown in
the tables below. The mode is considered ‘Not Feasible’ when the PHPDT exceeds the
mode capacity.
Table 9-3: Metro Rail– per Seat LCC (in Rs Lakhs) at different PHPDT
PHPDT 4 Coach Metro Rail 6 Coach Metro Rail 8 Coach Metro Rail
16000 29.05 28.41 27.91
18500 26.96 25.48 25.37
21000 23.76 24.01 23.43
23500 22.23 22.78 21.89
26000 21.30 21.23 20.65
28500 NOT FEASIBLE 20.41 20.15
31000 NOT FEASIBLE 18.67 19.22
33500 NOT FEASIBLE 18.14 18.41
36000 NOT FEASIBLE 17.68 17.73
38500 NOT FEASIBLE 17.03 17.14
41000 NOT FEASIBLE NOT FEASIBLE 16.90
43500 NOT FEASIBLE NOT FEASIBLE 15.93
46000 NOT FEASIBLE NOT FEASIBLE 15.55
48500 NOT FEASIBLE NOT FEASIBLE 15.21
51000 NOT FEASIBLE NOT FEASIBLE 15.07
53500 NOT FEASIBLE NOT FEASIBLE NOT FEASIBLE
56000 NOT FEASIBLE NOT FEASIBLE NOT FEASIBLE
Following an approach similar to the one explained earlier for Metro Rail, per seat LCC
analysis of Monorail System with a 3, 6 and 9 coach train configuration has also been
performed and is presented in the table below:
Table 9-4: Mono Rail - Per Seat LCC (in Rs Lakhs) at different PHPDT
PHPDT 3 Coach Mono Rail 6 Coach Mono Rail 9 Coach Mono Rail
3000 75.26 65.07 65.01
6000 47.56 45.24 42.42
9000 36.38 35.74 35.23
12000 NOT FEASIBLE 31.41 31.06
15000 NOT FEASIBLE 27.47 27.78
18000 NOT FEASIBLE 25.80 26.01
21000 NOT FEASIBLE NOT FEASIBLE 24.10

LIFE CYCLE COST ANALYSIS OF FIVE URBAN TRANSPORT SYSTEMS
Bangalore Metro Rail Corporation Limited
71
24000 NOT FEASIBLE NOT FEASIBLE 22.98
27000 NOT FEASIBLE NOT FEASIBLE 22.28
30000 NOT FEASIBLE NOT FEASIBLE NOT FEASIBLE
33000 NOT FEASIBLE NOT FEASIBLE NOT FEASIBLE
The per seat LCC calculated for elevated Light Rail system with a 2 and 4 coach train
configuration at varying PHPDT is presented in the table below:
Table 9-5: Elevated Light Rail - Per Seat LCC (in Rs Lakhs) at different PHPDT
PHPDT 2 Coach Elevated LR 4 Coach Elevated LR
3000 79.98 69.59
6000 45.79 44.09
9000 33.01 33.62
12000 NOT FEASIBLE 27.03
15000 NOT FEASIBLE 23.71
18000 NOT FEASIBLE 20.63
21000 NOT FEASIBLE 19.10
24000 NOT FEASIBLE NOT FEASIBLE
27000 NOT FEASIBLE NOT FEASIBLE
30000 NOT FEASIBLE NOT FEASIBLE
The results for at grade Light Rail System with the same train configuration as considered
for elevated Light Rail System is presented in the table below:
Table 9-6: At Grade Light Rail - Per Seat LCC (in Rs Lakhs) at different PHPDT
PHPDT 2 Coach At-Grade LR 4 Coach At-Grade LR
3000 41.03 34.69
6000 26.12 24.58
9000 19.90 19.42
12000 NOT FEASIBLE 17.17
15000 NOT FEASIBLE 15.38
18000 NOT FEASIBLE 14.04
21000 NOT FEASIBLE 13.23
24000 NOT FEASIBLE NOT FEASIBLE
27000 NOT FEASIBLE NOT FEASIBLE
30000 NOT FEASIBLE NOT FEASIBLE
Per seat LCC for BRTS on which buses can have one or two coach configurations has also
been tested at varying PHPDT and the results are as below:
Table 9-7: BRTS - Per Seat LCC (in Rs Lakhs) at different PHPDT
PHPDT 1 Coach BRTS 2 Coach BRTS
4000 35.55 35.98
6000 29.78 29.87
8000 26.65 26.53
10000 NOT FEASIBLE 24.65
12000 NOT FEASIBLE 23.45
14000 NOT FEASIBLE 22.54
16000 NOT FEASIBLE 21.99
18000 NOT FEASIBLE NOT FEASIBLE

LIFE CYCLE COST ANALYSIS OF FIVE URBAN TRANSPORT SYSTEMS
Bangalore Metro Rail Corporation Limited
72
20000 NOT FEASIBLE NOT FEASIBLE
22000 NOT FEASIBLE NOT FEASIBLE
Finally for the fifth selected urban transport mode i.e. ordinary bus services, per seat LCC
analysis has also been performed but only for a single coach bus configuration. The results
of the same are presented in the table below:
Table 9-8: Ordinary Bus Service - Per Seat LCC (in Rs Lakhs) at different PHPDT
PHPDT 1 Coach Ordinary Bus
1000 20.14
1500 18.82
2000 18.24
2500 17.94
3000 17.93
3500 17.76
4000 17.60
4500 17.99
5000 NOT FEASIBLE
5500 NOT FEASIBLE
The result of the above analysis is summarised in the table below.
Table 9-9: Summarized view of impact of mode capacity limitations on the LCC per seat
System No. of Coaches in
the Train
Train Set Capacity
Maximum PHPDT
LCC per seat (in INR Lakh)
Metro Rail 4 1100 26,400 21.30 6 1650 39,600 17.03 8 2200 52,800 15.07
Mono Rail 3 384 9,216 36.38 6 768 18,432 25.80 9 1,152 27,648 22.28
Light Rail elevated
2 484 11,616 33.01 4 968 23,232 19.10
Light Rail At-grade
2 484 11,616 19.90 4 968 23,232 13.23
BRTS 1 80 8,000 26.65 2 160 16,000 24.99
Ordinary Buses 1 80 4,800 17.99
Headway for Rail Based Systems has been assumed at 2.5 minutes, whereas for BRTS it has been assumed at 0.6
minutes and for Ordinary Buses at 1 minute.
*LCC per seat (in INR Lakh) at NPV for the assumed lifespan of 30 years
It may be noted that with the increasing mode capacity and hence PHPDT, LCC for
Monorail and LRT fall substantially in comparison to Metro rail, BRTS and Bus Services.

LIFE CYCLE COST ANALYSIS OF FIVE URBAN TRANSPORT SYSTEMS
Bangalore Metro Rail Corporation Limited
73
ANNEXURE I – ROLLING STOCK REQUIREMENT ASSESSMENT
An excel model was developed to assess the rolling stock requirement for the systems. The
table below represents the model.
Modes Metro Rail Monorail LRTS
(Elevated)
LRTS
(At Grade)
BRTS Buses
Corridor Length (Km) 20 20 20 20 20 20
Average Speed (Km/Hr.) 35 30 30 25 25 15
PHPDT (Persons) 15000 15000 15000 15000 15000 15000
Carrying Capacity 1100 384 484 484 160 80
Rakes/ Coaches
(Single Direction)
14 39 31 31 94 188
Headway (In Minutes) 4.40 1.54 1.94 1.94 0.64 0.32
Rakes/ Coaches
(Recirculates)
5 13 10 6 19 -
Rakes/ Coaches
(Both Direction)
21 65 52 56 169 375
Rakes/ Coaches
(Traffic Reserve)
1 3 4 4 8 19
Rakes/ Coaches
(Repair & Maintenance)
1 3 4 4 8 19
Total Required 23 71 58 62 185 413
In the above table, given the Corridor Length, Average Speed, PHPDT and Carrying
Capacity, the rest of the parameters are determined and used to calculate total rolling
stock requirement.
The rakes/coaches required to accommodate the PHPDT in a single direction is derived
by dividing the PHPDT with the Carrying Capacity. This derived figure in turn is used to
calculate the theoretical headway by dividing 60 minutes with the vehicles that need to
ply.
Given the above vehicle requirement in a single direction and the headway, the number
of rakes/coaches that can be re-circulated is calculated. The formula for this calculation
is in the box below:
Rakes/Coaches Re-circulated = (60/Headway) * {1-(Corridor Length/Average Speed)}
By summing the result of the above calculation with the previously calculated vehicular
requirement in a single direction, the Rake/Coaches (Both Direction) is derived.
A reserve of 5% is maintained as Traffic Reserve and Repair & Maintenance Reserve
individually.
The final Rolling Stock requirement is calculated by summing the Traffic Reserve, Repair &
Maintenance Reserve and the Rakes/Coaches (Both Direction).

LIFE CYCLE COST ANALYSIS OF FIVE URBAN TRANSPORT SYSTEMS
Bangalore Metro Rail Corporation Limited
74
For the purpose of these calculations the carrying capacity and vehicle configuration
have been chosen as depicted in the table below:
Mode Configuration Capacity
(persons)
Remarks
MRTS 4 Coach 1,100 Approximated based on Bombardier MOVIA Coach
Capacity for DMRC @ 6 pax/m sq.
Monorail 3 Coach 384 Approximated based on Hitachi's Medium Size
specifications @ 6 pax/m sq.
LRTS 2 Coach 484 Approximated based on Siemens S70 specifications @ 6
pax/m sq.
BRTS 2 Coach 160 As per Rajkot DPR
Bus 1 Coach 80 As per Rajkot DPR
A heavy size Hitachi monorail coaches are also available which can carry up to 175
person per coach considering 6 person per square meters and can carry up to 525
passengers in a 3 coach configuration train (axle load of 11 tons whereas it is 10 tons for
the medium size specification).

LIFE CYCLE COST ANALYSIS OF FIVE URBAN TRANSPORT SYSTEMS
Bangalore Metro Rail Corporation Limited
75
ANNEXURE II – HUMAN RESOURCE REQUIREMENT DETAIL
The Human Resource Requirement that has been generated is derived using a basic
staffing grid that has been created by IUT for this purpose. For rail-based systems this grid
has been created using the data available from DMRC. For bus-based systems, the grid
has been created using assumptions based on the data available from CIRT. The Grids
have been depicted below in tabular form.
Train Operation Unit DMRC Assumed
Metro
Assumed
Mono/LR
Station Controller per Station 4.15 4.00 1.00
Train Operation (TO) per 100 train hours 26.50 26.00 5.00
DI/ALS per 15 TO's 1.00 1.00 1.00
Station Manager per station 1.00 1.00 1.00
Customer Relation Assistance per Station 3.75 3.50 1.00
Crew Controller per 100 TOs 1.00 1.00 1.00
Revenue Cell Lakh ridership daily 1.50 1.35 0.50
Assistant Traffic Controller per line up to 25
station
1.20 1.00 1.00
Time Table Controller per shift 1.00 1.00 1.00
Chief Controller/
Assistant Chief Controller
per shift 1.00 1.00 1.00
Marketing Cell each line 2.00 2.00 1.00
Maintenance Unit DMRC Assumed
Metro
Assumed
Mono/LR
P.way per km 1.00 1.00 0.50
Works per km 0.75 0.75 0.50
E&M per km 4.50 4.35 2.50
Traction per km 3.00 2.90 2.00
S&T/ AFC Wing per km 6.10 5.90 2.75
Rolling Stock Wing per car 1.30 1.25 1.00
Stores per km 0.40 0.40 0.30
HR per 100 employee 0.30 0.30 0.30
Finance per 100 employee 0.50 0.50 0.50
Human Resource Requirement Grid for Bus Based Systems:
Bus Operations & Maintenance Unit Assumed
Traffic per Bus 3.50
Workshop & Maintenance per Bus 1.00
Administration & Account per Bus 0.50

LIFE CYCLE COST ANALYSIS OF FIVE URBAN TRANSPORT SYSTEMS
Bangalore Metro Rail Corporation Limited
76
ANNEXURE III – THE LCCA CALCULATION TABLES
Hypothetical Case
Life Cycle Cost - General Framework for Analysis
Total Route Length 20 km
Peak Hour Per Direction Traffic 15,000 Nos
Life Cycle Cost Analysis Duration 30 years
RESULTS OF THE HYPOTHETICAL CASE
Systems Technical Feasibility Number of Seats LCC (NPV in INR Crore) LCC per seat (in INR Lakh)
Metro Rail OK 25,300 7,792.49 30.80
Monorail Not Feasible 27,264 7,676.58 28.16
LRTS (Elevated) Not Feasible 28,072 6,539.18 23.29
LRTS (At Grade) Not Feasible 30,008 4,578.65 15.26
BRTS OK 29,600 6,574.69 22.21
Buses Not Feasible 33,040 5,727.82 17.34
1. All Prices Mentioned in this excel sheet is to be read in Indian National Rupee in Crores unless mentioned otherwise
2. Please edit the assumptions only in cells formatted as: ##
3. Please use the Drop Down Menues to select the figures in the assumption cells otherwise a Spreadsheet ERROR will appear
Prepared By,
Institute of Urban Transport (India)1st Floor, Anand Vihar Metro Station Building, Delhi - 110092
BANGALORE METRO RAIL CORPORATION LIMITED

LIFE CYCLE COST ANALYSIS OF FIVE URBAN TRANSPORT SYSTEMS
Bangalore Metro Rail Corporation Limited
77
COMMON ASSUMPTIONS FOR ALL THE FIVE MODES
General Assumptions Financial Assumptions
Total Route Length 20 km Annual Escalation in Prices 5% Interest Rate 5%
Peak Hour Per Direction Traffic 15,000 nos Discount Rate 10%
Life Cycle Cost Analysis Duration 30 years Debt Ratio for Rail based = D/(D+E) 70% for 15 years
Construction Duration Rail Based 5 years Con Dur Bus Based 3 years Debt Ratio for Bus based = D/(D+E) 70% for 10 years
Headway (in Min) Avg. Speed (kmph) Station Dist. (in km) Car/Bus Capacity Train Config Depots and Workshops
Metro Rail 2.50 35 1.00 275.00 4 Coach Number of Depot for rail based system 1 for 30 km
Monorail 2.50 30 0.75 128.00 3 Coach Number of Depot for Bus based system 1 for 50 buses
LRTS (Elevated) 2.50 30 0.75 242.00 2 Coach Number of Workshops for Bus based system 1 for 250 buses
LRTS (At Grade) 2.50 25 0.75 242.00 2 Coach Human Resource
BRTS 0.60 25 0.75 80.00 2 Coach Average Remuneration of Staffs 9.00 Rs lakh
Buses 1.00 15 0.50 80.00 1 Coach Annual Increase in Remuneration 9%
Other Capex Assumptions Taxes & Duties Rail Based Bus Based Fuel Pricing (Year 2012)
General Charges (except Land) 3% Custom Duty 18.62% 18.62% Electricity Price (Rs per KW) 4.00 Annual escalation 5%
Contingencies 3% Excise Duty 8.24% 26.00% Diesel Price (Rs per liter) 45.00 Annual escalation 5%
Land Cost for Rail Based 10% VAT 12.50% 12.50% CNG Prices (Rs per kg) 40.00 Annual escalation 5%
Land Cost for BRTS 5% Sales Tax 6.25% 6.25% Fuel Choice Diesel
Land Cost for Ordinary Bus 5% Works Contract Tax 6.25% 6.25%
Replacement Time (years) % Replaced BRTS/Ord Bus Depreciation Rail Based No Bus Based 15 year life after refurbishment
Replacement Time (years) 10 E&M Works 10.00% Road 5.0% After Refurbishment 6.67%
E&M Works 10.00 100.00% Roadways 50.00% Permanent Way 2.00% Bus Stops & FOB 5.0% After Refurbishment 6.67%
Permanent Way 50.00 100.00% Bus Stops 50.00% Traction & power 5.00% Civ il 2.0% After Refurbishment 6.67%
Traction & power 20.00 100.00% Footover 50.00% Signalling and Telecom 6.67% ITS application 10.0% After Refurbishment 6.67%
Signalling and Telecom 15.00 100.00% ITS application 100.00% Automatic fare collection 6.67% Buses 10.0% After Refurbishment 6.67%
Automatic fare collection 15.00 100.00% Rolling Stock 4.00% After Refurbishment 6.67%
Rolling Stock 25.00 20.00% Buses 100.00% Civ il 2.00%
Common Assumptions for all the 5 modes and their O&M

LIFE CYCLE COST ANALYSIS OF FIVE URBAN TRANSPORT SYSTEMS
Bangalore Metro Rail Corporation Limited
78
General Assumptions Financial Assumptions
Total Route Length 20 km Annual Escalation in Prices 5% Interest Rate 5%
Peak Hour Per Direction Traffic 15,000 nos Discount Rate 10%
Life Cycle Cost Analysis Duration 30 years Debt Ratio for Rail based = D/(D+E) 70% for 15 years
Construction Duration Rail Based 5 years Con Dur Bus Based 3 years Debt Ratio for Bus based = D/(D+E) 70% for 10 years
Headway (in Min) Avg. Speed (kmph) Station Dist. (in km) Car/Bus Capacity Train Config Depots and Workshops
Metro Rail 2.50 35 1.00 275.00 4 Coach Number of Depot for rail based system 1 for 30 km
Monorail 2.50 30 0.75 128.00 3 Coach Number of Depot for Bus based system 1 for 50 buses
LRTS (Elevated) 2.50 30 0.75 242.00 2 Coach Number of Workshops for Bus based system 1 for 250 buses
LRTS (At Grade) 2.50 25 0.75 242.00 2 Coach Human Resource
BRTS 0.60 25 0.75 80.00 2 Coach Average Remuneration of Staffs 9.00 Rs lakh
Buses 1.00 15 0.50 80.00 1 Coach Annual Increase in Remuneration 9%
Other Capex Assumptions Taxes & Duties Rail Based Bus Based Fuel Pricing (Year 2012)
General Charges (except Land) 3% Custom Duty 18.62% 18.62% Electricity Price (Rs per KW) 4.00 Annual escalation 5%
Contingencies 3% Excise Duty 8.24% 26.00% Diesel Price (Rs per liter) 45.00 Annual escalation 5%
Land Cost for Rail Based 10% VAT 12.50% 12.50% CNG Prices (Rs per kg) 40.00 Annual escalation 5%
Land Cost for BRTS 5% Sales Tax 6.25% 6.25% Fuel Choice Diesel
Land Cost for Ordinary Bus 5% Works Contract Tax 6.25% 6.25%
Replacement Time (years) % Replaced BRTS/Ord Bus Depreciation Rail Based No Bus Based 15 year life after refurbishment
Replacement Time (years) 10 E&M Works 10.00% Road 5.0% After Refurbishment 6.67%
E&M Works 10.00 100.00% Roadways 50.00% Permanent Way 2.00% Bus Stops & FOB 5.0% After Refurbishment 6.67%
Permanent Way 50.00 100.00% Bus Stops 50.00% Traction & power 5.00% Civ il 2.0% After Refurbishment 6.67%
Traction & power 20.00 100.00% Footover 50.00% Signalling and Telecom 6.67% ITS application 10.0% After Refurbishment 6.67%
Signalling and Telecom 15.00 100.00% ITS application 100.00% Automatic fare collection 6.67% Buses 10.0% After Refurbishment 6.67%
Automatic fare collection 15.00 100.00% Rolling Stock 4.00% After Refurbishment 6.67%
Rolling Stock 25.00 20.00% Buses 100.00% Civ il 2.00%
Common Assumptions for all the 5 modes and their O&M

LIFE CYCLE COST ANALYSIS OF FIVE URBAN TRANSPORT SYSTEMS
Bangalore Metro Rail Corporation Limited
79
CAPEX ASSUMPTIONS
Item (in Rs Crore) Unit Metro Rail Total Metro Mono Rail Total Mono Light Rail Total Light
Land @10% 321.36 @10% 378.24 @10% 281.11
Alignment and Formation
Elevated v iaduct section R. Km. 32.00 640.00 22.50 450.00 21.00 420.00
OCC Building LS 50.00 50.00 40.00 40.00 40.00 40.00
Station Buildings
Elevated stations Each 16.00 320.00 9.00 243.00 10.00 270.00
E&M Works
Elevated station (E&M, Lifts, etc.) Each 7.00 140.00 2.50 67.50 2.50 67.50
Depot LS 50.00 50.00 120.00 120.00 70.00 70.00
Permanent Way R. Km. 7.00 140.00 - 5.00 100.00
Traction & power
Elevated R. Km. 8.00 160.00 5.50 110.00 5.50 110.00
Lift Each 0.30 24.00 0.30 16.20 0.30 16.20
Escalator Each 1.00 80.00 1.00 54.00 1.00 54.00
Signalling and Telecom
Signalling R. Km. 13.00 260.00 9.00 180.00 8.00 160.00
Telecom Each Stn. 3.00 60.00 2.00 54.00 2.00 54.00
Automatic fare collection Each 3.40 68.00 2.50 67.50 2.50 67.50
R & R R. Km. 3.20 64.00 2.00 40.00 2.00 40.00
Misc. Civil Utilities R. Km. 3.80 76.00 2.00 40.00 2.00 40.00
Electrical Utilities R. Km. 2.90 58.00 2.50 50.00 2.50 50.00
Telecom Utilities R. Km. 0.50 10.00 0.50 10.00 0.50 10.00
Rolling Stock Each 10.00 920.00 10.00 2,130.00 10.00 1,160.00
General Charges (except land) @3% 93.60 @3% 110.17 @3% 81.88
Contingencies @3% 106.05 @3% 124.82 @3% 92.77
Total 3,641.01 4,285.42 3,184.95
R. Km. 182.05 214.27 159.25

LIFE CYCLE COST ANALYSIS OF FIVE URBAN TRANSPORT SYSTEMS
Bangalore Metro Rail Corporation Limited
80
PHASING ASSUMPTIONS
Item (in Rs Crore) Unit BRTS Total BRTS BUS Total BUS
Land Cost @5% 56.76 @5% 16.34
Roadway Development R. Km. 8.55 171.00 -
Bus Stops Each 0.40 10.80 0.30 12.00
Foot over Bridges Each 0.25 6.75 -
Operational Infrastructure (Terminals & Depots)
Depots Each 10.00 70.00 10.00 80.00
Workshops and Terminals Each 20.00 20.00 25.00 50.00
Operation Control Center (OCC) LS 10.00 10.00 -
Bridges and Flyovers R. Km. 31.80 636.00 -
ITS application and External Tracking LS 29.50 29.50 10.00 10.00
Bus Cost Each 0.40 148.00 0.40 165.20
General Charges (except land) @3% 33.06 @3% 9.52
Contingencies @3% 35.76 @3% 10.29
Total Cost 1,227.62 353.34
R. Km. 61.38 17.67
Rail Based Systems
Yr 1 Yr 2 Yr 3 Yr 4 Yr 5
Land Phasing 60% 40% 0% 0% 0% 0% 0% 0% 0% 0%
CAPEX Phasing 15% 20% 25% 20% 20% 0% 0% 0% 0% 0%
Bus Based Systems
Yr 1 Yr 2 Yr 3
Land Phasing 60% 40% 0% 0% 0% 0% 0% 0% 0% 0%
CAPEX Phasing 30% 30% 40% 0% 0% 0% 0% 0% 0% 0%

LIFE CYCLE COST ANALYSIS OF FIVE URBAN TRANSPORT SYSTEMS
Bangalore Metro Rail Corporation Limited
81
ROLLING STOCK REQUIREMENTS
ModeCorridor
Length (Km)
Station/Shelter
Frequency (Km)
Station/ Shelter
Required
Average
Speed (Km/Hr)
PHPDT
(Persons)
Carrying
Capacity
Rakes/ Coaches
Required
Headway
(In Minutes)
Rakes/ Coaches
(Recirculated)
Rakes/ Coaches
(Both Direction)
Rakes/ Coaches
(Traffic Reserve)
Rakes/ Coaches
(Repair & Maintenance)
Total
Required
Metro Rail 20 1.00 20 35 15,000 1,100 14 4.40 5.84 21.00 1.00 1.00 23.00
Monorail 20 0.75 27 30 15,000 384 39 1.54 13.02 65.00 3.00 3.00 71.00
LRTS (Elevated) 20 0.75 27 30 15,000 484 31 1.94 10.33 52.00 3.00 3.00 58.00
LRTS (At Grade) 20 0.75 27 25 15,000 484 31 1.94 6.20 56.00 3.00 3.00 62.00
BRTS 20 0.75 27 25 15,000 160 94 0.64 18.75 169.00 8.00 8.00 185.00
Buses 20 0.50 40 15 15,000 80 188 0.32 - 375.00 19.00 19.00 413.00
Notes: 6 per per sq m
Mode ConfigurationCapacity
(persons) Modes
Capacity of
coaches
Units of Rail Cars/buses
required
MRTS 4 Coach 1,100 MRTS 275 92
Monorail 3 Coach 384 Monorail 128 213
LRTS 2 Coach 484 LRTS (Elevated) 242 116
BRTS 2 Coach 160 LRTS (at Grade) 242 124
Bus 1 Coach 80 BRTS 80 370
2 Frequency - Gap between unit deployment in minutes to allow movement of Peak Hour per Direction Traffic Bus 80 413
1
All Capacities considered are Fully Loaded (Standing + Sitting)
Unit size details are as follows:
Remarks
Bombardier MOVIA Coach Capacity for DMRC @ 6 pax/m sq
Approximated based on Hitachi's Medium Size Spec @ 6 pax/m sq
Approximated based on Siemens S70 specifications @ 6 pax/m sq
(Low Floor - Hi Speed)
(Low Floor - Hi Speed)

LIFE CYCLE COST ANALYSIS OF FIVE URBAN TRANSPORT SYSTEMS
Bangalore Metro Rail Corporation Limited
82
ENERGY DEMAND CALCULATIONS
Energy Consumption 70 KWh per 1000 GTKM
Time of Day Rail Car/bus Km Energy Consumption
Metro Rail Mono Rail Light Rail BRTS Buses Metro Rail Mono Rail Light Rail BRTS Buses
5 to 6 3,000 218 469 248 750 750 Crush Load (in Tonnes) 50 28 35
6 to 7 9,000 655 1,406 744 2,250 2,250 Electricity per rail car km 2.80 1.57 1.96
7 to 8 19,500 1,418 3,047 1,612 4,875 4,875 Mileage of Buses Km/Litre 3.50 3.50
8 to 9 27,000 1,964 4,219 2,231 6,750 6,750 Auxiliary Energy Consumption (per annum/Station) 1,213,625
9 to 10 30,000 2,182 4,688 2,479 7,500 7,500 Auxiliary Energy Consumption (per annum/Depot) 11,563,200 5,518,800 5,518,800
10 to 11 27,000 1,964 4,219 2,231 6,750 6,750
11 to 12 19,500 1,418 3,047 1,612 4,875 4,875 Annual Energy/ Fuel Consumption (in '000) Metro Rail Mono Rail Light Rail BRTS Buses
12 to 13 12,000 873 1,875 992 3,000 3,000 Annual Traction Power Consumption (KWh) 24,085 28,975 19,157
13 to 14 9,000 655 1,406 744 2,250 2,250 Annual Auxiliary Power Consumption (KWh) 35,836 38,287 38,287
14 to 15 9,000 655 1,406 744 2,250 2,250 Annual Diesel Oil (liters) 8,447 8,447
15 to 16 12,000 873 1,875 992 3,000 3,000 20.97 23.54 20.11 38.01 38.01
16 to 17 19,500 1,418 3,047 1,612 4,875 4,875
17 to 18 27,000 1,964 4,219 2,231 6,750 6,750
18 to 19 30,000 2,182 4,688 2,479 7,500 7,500
19 to 20 27,000 1,964 4,219 2,231 6,750 6,750
20 to 21 19,500 1,418 3,047 1,612 4,875 4,875
21 to 22 12,000 873 1,875 992 3,000 3,000
22 to 23 9,000 655 1,406 744 2,250 2,250
23 to 24 3,000 218 469 248 750 750
Average Daily Rail Car/bus Km 23,567 50,627 26,778 81,000 81,000
Average Annual Rail Car/bus Km 8,601,955 18,478,855 9,773,970 29,565,000 29,565,000
Traffic
(both Dir)

LIFE CYCLE COST ANALYSIS OF FIVE URBAN TRANSPORT SYSTEMS
Bangalore Metro Rail Corporation Limited
83
STAFF REQUIREMENTS
Train Operation DMRC
Assumed
Metro Unit Metro
Assumed
Mono/LR Monorail Light Rail Bus Operations Assumed Unit BRTS
Ordinary
Bus
Station Controller 4.15 4.00 per Station 80.00 1.00 27.00 27.00 Traffic 3.50 per Bus 1,295.00 1,445.50
Train Operation (TO) 26.50 26.00 per 100 train hours 77.00 5.00 43.00 34.00 Workshop & Maintenance 1.00 per Bus 370.00 413.00
DI/ALS 1.00 1.00 per 15 TO's 6.00 1.00 3.00 3.00 Administration & Account 0.50 per Bus 185.00 206.50
Station Managers 1.00 1.00 per station 20.00 1.00 27.00 27.00 Total Staffs Required 1,850.00 2,065.00
Customer Relation Assistance 3.75 3.50 per Station 70.00 1.00 27.00 27.00 Staff Required per km 92.50 103.25
Crew Conroller 1.00 1.00 per 100 Tos 1.00 1.00 1.00 1.00
Revenue Cell 1.50 1.35 Lakh ridership daily 5.00 0.50 2.00 2.00
Assistant Traffic Controller 1.20 1.00 per line up to 25 station 1.00 1.00 1.00 1.00
Time Table Controller 1.00 1.00 per shift 2.00 1.00 2.00 2.00
Chief Controller/ Assistant Chief Controller 1.00 1.00 per shift 2.00 1.00 2.00 2.00
Marketing Cell 2.00 2.00 each line 2.00 1.00 1.00 1.00
Maintenance DMRC
Assumed
Metro Unit Metro
Assumed
Mono/LR Monorail Light Rail
P.way 1.00 1.00 per km 20.00 0.50 10.00 10.00
Works 0.75 0.75 per km 15.00 0.50 10.00 10.00
E&M 4.50 4.35 per km 87.00 2.50 50.00 50.00
Traction 3.00 2.90 per km 58.00 2.00 40.00 40.00
S&T/ AFC Wing 6.10 5.90 per km 118.00 2.75 55.00 55.00
Rolling Stock Wing 1.30 1.25 per car 115.00 1.00 213.00 116.00
Stores 0.40 0.40 per km 8.00 0.30 6.00 6.00
HR 0.30 0.30 per 100 employee 3.00 0.30 2.00 2.00
Finance 0.50 0.50 per 100 employee 4.00 0.50 3.00 3.00
Total Staffs Required 694.00 525.00 419.00
Staff Required per km 34.70 26.25 20.95
Rail Based Systems Bus Based System

LIFE CYCLE COST ANALYSIS OF FIVE URBAN TRANSPORT SYSTEMS
Bangalore Metro Rail Corporation Limited
84
REPAIR AND MAINTENANCE
Metro Rail BRTS
Unit Cost of Repair & Maintenance (2010 Prices) of DMRC Unit cost of Repair and Maintenance (2011 prices CIRT analysis)
Building 26.74 Rs Lakh per Station Building/roads 2.00 Rs Lakh per bus stop
Plant & Machinery 11.40 Rs Lakh per Car Tyres & Tubes 1.08 Rs per effective Km
Other 2.2% Of Building, Plant & Machinery Costs Spare Parts 1.07 Rs per effective Km
Other 2% of building spare and tyre
Assumed Unit Cost of Repair & Maintenance escalated @ inflation Assumed Unit Cost of Repair & Maintenance escalated @ inflation
Building 29.48 Rs Lakh per Station Building/roads 2.10 Rs Lakh per bus stop
Plant & Machinery 12.57 Rs Lakh per Car Tyres & Tubes 1.13 Rs per effective Km
Other R&M 2.3% Of Building, Plant & Machinery Costs Spare Parts 1.12 Rs per effective Km
Other O&M Costs 11% of Energy, Staff and R&M costs Other 2% of building spare and tyre
Mono Rail Ordinary Bus
Assumed at 75% of the Unit Cost of Repair & Maintenance of metro rail escalated @ inflation Unit cost of Repair and Maintenance (2011 prices CIRT analysis)
Building 22.11 Rs Lakh per Station Building/roads 2.00 Rs Lakh per bus stop
Plant & Machinery 9.43 Rs Lakh per Car Tyres & Tubes 1.08 Rs per effective Km
Other R&M 2.3% Of Building, Plant & Machinery Costs Spare Parts 1.07 Rs per effective Km
Other O&M Costs 11% of Energy, Staff and R&M costs Other 2% of building spare and tyre
Light Rail Assumed Unit Cost of Repair & Maintenance escalated @ inflation
Assumed at 75% of the Unit Cost of Repair & Maintenance of metro rail escalated @ inflation Building/roads 2.10 Rs Lakh per bus stop
Building 22.11 Rs Lakh per Station Tyres & Tubes 1.13 Rs per effective Km
Plant & Machinery 9.43 Rs Lakh per Car Spare Parts 1.12 Rs per effective Km
Other R&M 2.3% Of Building, Plant & Machinery Costs Other 2% of building spare and tyre
Other O&M Costs 11% of Energy, Staff and R&M costs Other O&M cost - BRTS and Buses 11% of energy, staff and R&M costs
Rail Based Systems Bus Based System

LIFE CYCLE COST ANALYSIS OF FIVE URBAN TRANSPORT SYSTEMS
Bangalore Metro Rail Corporation Limited
85
LCCA FOR METRO RAIL SYSTEMS
Year
1 Year 2 Year 3 Year 4 Year 5
Year
6
Year
7
Year
8
Year
9
Year
10
Year
11
Year
12
Year
13
Year
14
Year
15
Year
16
Year
17
Year
18
Year
19
Year
20
Year
21
Year
22
Year
23
Year
24
Year
25
Year
26
Year
27
Year
28
Year
29
Year
30
2012 2013 2014 2015 2016 2017 2018 2019 2020 2021 2022 2023 2024 2025 2026 2027 2028 2029 2030 2031 2032 2033 2034 2035 2036 2037 2038 2039 2040 2041
CAPEX
Land 192.8 135.0 0.0 0.0 0.0 0.0 0.0 0.0 0.0 0.0 0.0 0.0 0.0 0.0 0.0 0.0 0.0 0.0 0.0 0.0 0.0 0.0 0.0 0.0 0.0 0.0 0.0 0.0 0.0 0.0
Alignment and Formation 103.5 144.9 190.2 159.8 167.7 0.0 0.0 0.0 0.0 0.0 0.0 0.0 0.0 0.0 0.0 0.0 0.0 0.0 0.0 0.0 0.0 0.0 0.0 0.0 0.0 0.0 0.0 0.0 0.0 0.0
Station Buildings 48.0 67.2 88.2 74.1 77.8 0.0 0.0 0.0 0.0 0.0 0.0 0.0 0.0 0.0 0.0 0.0 0.0 0.0 0.0 0.0 0.0 0.0 0.0 0.0 0.0 0.0 0.0 0.0 0.0 0.0
E&M Works 28.5 39.9 52.4 44.0 46.2 0.0 0.0 0.0 0.0 0.0 0.0 0.0 0.0 0.0 0.0 0.0 0.0 0.0 0.0 0.0 0.0 0.0 0.0 0.0 0.0 0.0 0.0 0.0 0.0 0.0
Permanent Way 21.0 29.4 38.6 32.4 34.0 0.0 0.0 0.0 0.0 0.0 0.0 0.0 0.0 0.0 0.0 0.0 0.0 0.0 0.0 0.0 0.0 0.0 0.0 0.0 0.0 0.0 0.0 0.0 0.0 0.0
Traction & power 39.6 55.4 72.8 61.1 64.2 0.0 0.0 0.0 0.0 0.0 0.0 0.0 0.0 0.0 0.0 0.0 0.0 0.0 0.0 0.0 0.0 0.0 0.0 0.0 0.0 0.0 0.0 0.0 0.0 0.0
Signalling and Telecom 48.0 67.2 88.2 74.1 77.8 0.0 0.0 0.0 0.0 0.0 0.0 0.0 0.0 0.0 0.0 0.0 0.0 0.0 0.0 0.0 0.0 0.0 0.0 0.0 0.0 0.0 0.0 0.0 0.0 0.0
Automatic fare collection 10.2 14.3 18.7 15.7 16.5 0.0 0.0 0.0 0.0 0.0 0.0 0.0 0.0 0.0 0.0 0.0 0.0 0.0 0.0 0.0 0.0 0.0 0.0 0.0 0.0 0.0 0.0 0.0 0.0 0.0
R & R 9.6 13.4 17.6 14.8 15.6 0.0 0.0 0.0 0.0 0.0 0.0 0.0 0.0 0.0 0.0 0.0 0.0 0.0 0.0 0.0 0.0 0.0 0.0 0.0 0.0 0.0 0.0 0.0 0.0 0.0
Misc. Civil Utilities 11.4 16.0 20.9 17.6 18.5 0.0 0.0 0.0 0.0 0.0 0.0 0.0 0.0 0.0 0.0 0.0 0.0 0.0 0.0 0.0 0.0 0.0 0.0 0.0 0.0 0.0 0.0 0.0 0.0 0.0
Electrical Utilities 8.7 12.2 16.0 13.4 14.1 0.0 0.0 0.0 0.0 0.0 0.0 0.0 0.0 0.0 0.0 0.0 0.0 0.0 0.0 0.0 0.0 0.0 0.0 0.0 0.0 0.0 0.0 0.0 0.0 0.0
Telecom Utilities 1.5 2.1 2.8 2.3 2.4 0.0 0.0 0.0 0.0 0.0 0.0 0.0 0.0 0.0 0.0 0.0 0.0 0.0 0.0 0.0 0.0 0.0 0.0 0.0 0.0 0.0 0.0 0.0 0.0 0.0
Rolling Stock 138.0 193.2 253.6 213.0 223.7 0.0 0.0 0.0 0.0 0.0 0.0 0.0 0.0 0.0 0.0 0.0 0.0 0.0 0.0 0.0 0.0 0.0 0.0 0.0 0.0 0.0 0.0 0.0 0.0 0.0
General Charges (except land) 14.0 19.7 25.8 21.7 22.8 0.0 0.0 0.0 0.0 0.0 0.0 0.0 0.0 0.0 0.0 0.0 0.0 0.0 0.0 0.0 0.0 0.0 0.0 0.0 0.0 0.0 0.0 0.0 0.0 0.0
Contingencies 15.9 22.3 29.2 24.6 25.8 0.0 0.0 0.0 0.0 0.0 0.0 0.0 0.0 0.0 0.0 0.0 0.0 0.0 0.0 0.0 0.0 0.0 0.0 0.0 0.0 0.0 0.0 0.0 0.0 0.0
Total Capex 690.8 832.1 915.0 768.6 807.0 0.0 0.0 0.0 0.0 0.0 0.0 0.0 0.0 0.0 0.0 0.0 0.0 0.0 0.0 0.0 0.0 0.0 0.0 0.0 0.0 0.0 0.0 0.0 0.0 0.0
CAPEX for Replacements
E&M Works 0.0 0.0 0.0 0.0 0.0 0.0 0.0 0.0 0.0 0.0 0.0 0.0 0.0 0.0 0.0 438.5 0.0 0.0 0.0 0.0 0.0 0.0 0.0 0.0 0.0 714.3 0.0 0.0 0.0 0.0
Permanent Way 0.0 0.0 0.0 0.0 0.0 0.0 0.0 0.0 0.0 0.0 0.0 0.0 0.0 0.0 0.0 0.0 0.0 0.0 0.0 0.0 0.0 0.0 0.0 0.0 0.0 0.0 0.0 0.0 0.0 0.0
Traction & power 0.0 0.0 0.0 0.0 0.0 0.0 0.0 0.0 0.0 0.0 0.0 0.0 0.0 0.0 0.0 0.0 0.0 0.0 0.0 0.0 0.0 0.0 0.0 0.0 0.0 992.6 0.0 0.0 0.0 0.0
Signalling and Telecom 0.0 0.0 0.0 0.0 0.0 0.0 0.0 0.0 0.0 0.0 0.0 0.0 0.0 0.0 0.0 0.0 0.0 0.0 0.0 0.0 942.7 0.0 0.0 0.0 0.0 0.0 0.0 0.0 0.0 0.0
Automatic fare collection 0.0 0.0 0.0 0.0 0.0 0.0 0.0 0.0 0.0 0.0 0.0 0.0 0.0 0.0 0.0 0.0 0.0 0.0 0.0 0.0 200.3 0.0 0.0 0.0 0.0 0.0 0.0 0.0 0.0 0.0
Rolling Stock 0.0 0.0 0.0 0.0 0.0 0.0 0.0 0.0 0.0 0.0 0.0 0.0 0.0 0.0 0.0 0.0 0.0 0.0 0.0 0.0 0.0 0.0 0.0 0.0 0.0 0.0 0.0 0.0 0.0 0.0
Total Capex for Replacement 0.0 0.0 0.0 0.0 0.0 0.0 0.0 0.0 0.0 0.0 0.0 0.0 0.0 0.0 0.0 438.5 0.0 0.0 0.0 0.0 1,143 0.0 0.0 0.0 0.0 1,706 0.0 0.0 0.0 0.0
Taxes & Duties
Custom Duty 53.1 74.4 97.6 82.0 86.1 0.0 0.0 0.0 0.0 0.0 0.0 0.0 0.0 0.0 0.0 81.7 0.0 0.0 0.0 0.0 212.8 0.0 0.0 0.0 0.0 317.8 0.0 0.0 0.0 0.0
Excise Duty 29.5 41.3 54.1 45.5 47.8 0.0 0.0 0.0 0.0 0.0 0.0 0.0 0.0 0.0 0.0 36.1 0.0 0.0 0.0 0.0 0.0 0.0 0.0 0.0 0.0 140.6 0.0 0.0 0.0 0.0
VAT 52.0 72.8 95.5 80.2 84.2 0.0 0.0 0.0 0.0 0.0 0.0 0.0 0.0 0.0 0.0 54.8 0.0 0.0 0.0 0.0 142.9 0.0 0.0 0.0 0.0 213.4 0.0 0.0 0.0 0.0
Sales Tax 28.7 40.1 52.6 44.2 46.4 0.0 0.0 0.0 0.0 0.0 0.0 0.0 0.0 0.0 0.0 27.4 0.0 0.0 0.0 0.0 71.4 0.0 0.0 0.0 0.0 106.7 0.0 0.0 0.0 0.0
Works Tax 28.7 40.1 52.6 44.2 46.4 0.0 0.0 0.0 0.0 0.0 0.0 0.0 0.0 0.0 0.0 27.4 0.0 0.0 0.0 0.0 71.4 0.0 0.0 0.0 0.0 106.7 0.0 0.0 0.0 0.0
Total Taxes & Duties 191.9 268.6 352.6 296.1 310.9 0.0 0.0 0.0 0.0 0.0 0.0 0.0 0.0 0.0 0.0 227.4 0.0 0.0 0.0 0.0 498.6 0.0 0.0 0.0 0.0 885.2 0.0 0.0 0.0 0.0
Operations & Maintenance
Staff Cost 0.0 0.0 0.0 0.0 0.0 96.1 104.8 114.2 124.5 135.7 147.9 161.2 175.7 191.5 208.7 227.5 248.0 270.3 294.6 321.1 350.1 381.6 415.9 453.3 494.1 538.6 587.1 639.9 697.5 760.3
Energy Cost 0.0 0.0 0.0 0.0 0.0 30.6 32.1 33.7 35.4 37.2 39.0 41.0 43.0 45.2 47.5 49.8 52.3 54.9 57.7 60.6 63.6 66.8 70.1 73.6 77.3 81.2 85.2 89.5 94.0 98.7
Repair & Maintenance Cost
Building 0.0 0.0 0.0 0.0 0.0 7.5 7.9 8.3 8.7 9.1 9.6 10.1 10.6 11.1 11.7 12.3 12.9 13.5 14.2 14.9 15.6 16.4 17.2 18.1 19.0 20.0 21.0 22.0 23.1 24.3
Plant & Machinery 0.0 0.0 0.0 0.0 0.0 14.8 15.5 16.3 17.1 17.9 18.8 19.8 20.8 21.8 22.9 24.0 25.2 26.5 27.8 29.2 30.7 32.2 33.8 35.5 37.3 39.2 41.1 43.2 45.3 47.6
Other Repair & Maintenance
Cost 0.0 0.0 0.0 0.0 0.0 0.5 0.5 0.6 0.6 0.6 0.6 0.7 0.7 0.7 0.8 0.8 0.9 0.9 0.9 1.0 1.0 1.1 1.1 1.2 1.3 1.3 1.4 1.5 1.5 1.6
Other Miscellaneous O&M Costs 0.0 0.0 0.0 0.0 0.0 16.4 17.7 19.0 20.5 22.1 23.8 25.6 27.6 29.7 32.1 34.6 37.3 40.3 43.5 47.0 50.7 54.8 59.2 64.0 69.2 74.8 80.9 87.6 94.8 102.6
Total O&M Costs 0.0 0.0 0.0 0.0 0.0 165.9 178.5 192.1 206.7 222.6 239.7 258.3 278.4 300.1 323.6 349.0 376.6 406.4 438.8 473.8 511.7 552.9 597.4 645.8 698.2 755.0 816.7 883.6 956.2 1,035
Non-Operating Expenses
Interest Expenses 12.1 38.7 69.3 98.8 126.3 135.8 126.4 117.1 107.7 98.3 89.0 79.6 70.2 60.9 51.5 49.8 47.6 37.2 26.8 16.4 29.4 45.7 42.0 38.3 34.7 58.8 81.0 73.4 65.7 58.0
Depreciation Expenses
Alignment and Formation 0.0 0.0 0.0 0.0 0.0 15.3 15.3 15.3 15.3 15.3 15.3 15.3 15.3 15.3 15.3 15.3 15.3 15.3 15.3 15.3 15.3 15.3 15.3 15.3 15.3 15.3 15.3 15.3 15.3 15.3
Station Buildings 0.0 0.0 0.0 0.0 0.0 7.1 7.1 7.1 7.1 7.1 7.1 7.1 7.1 7.1 7.1 7.1 7.1 7.1 7.1 7.1 7.1 7.1 7.1 7.1 7.1 7.1 7.1 7.1 7.1 7.1

LIFE CYCLE COST ANALYSIS OF FIVE URBAN TRANSPORT SYSTEMS
Bangalore Metro Rail Corporation Limited
86
Year
1 Year 2 Year 3 Year 4 Year 5
Year
6
Year
7
Year
8
Year
9
Year
10
Year
11
Year
12
Year
13
Year
14
Year
15
Year
16
Year
17
Year
18
Year
19
Year
20
Year
21
Year
22
Year
23
Year
24
Year
25
Year
26
Year
27
Year
28
Year
29
Year
30
2012 2013 2014 2015 2016 2017 2018 2019 2020 2021 2022 2023 2024 2025 2026 2027 2028 2029 2030 2031 2032 2033 2034 2035 2036 2037 2038 2039 2040 2041
E&M Works
CAPEX 0.0 0.0 0.0 0.0 0.0 21.1 21.1 21.1 21.1 21.1 21.1 21.1 21.1 21.1 21.1 0.0 0.0 0.0 0.0 0.0 0.0 0.0 0.0 0.0 0.0 0.0 0.0 0.0 0.0 0.0
Replacement 0.0 0.0 0.0 0.0 0.0 0.0 0.0 0.0 0.0 0.0 0.0 0.0 0.0 0.0 0.0 43.9 43.9 43.9 43.9 43.9 43.9 43.9 43.9 43.9 43.9 71.4 71.4 71.4 71.4 71.4
Permanent Way
CAPEX 0.0 0.0 0.0 0.0 0.0 3.1 3.1 3.1 3.1 3.1 3.1 3.1 3.1 3.1 3.1 3.1 3.1 3.1 3.1 3.1 3.1 3.1 3.1 3.1 3.1 3.1 3.1 3.1 3.1 3.1
Replacement 0.0 0.0 0.0 0.0 0.0 0.0 0.0 0.0 0.0 0.0 0.0 0.0 0.0 0.0 0.0 0.0 0.0 0.0 0.0 0.0 0.0 0.0 0.0 0.0 0.0 0.0 0.0 0.0 0.0 0.0
Traction & power
CAPEX 0.0 0.0 0.0 0.0 0.0 14.7 14.7 14.7 14.7 14.7 14.7 14.7 14.7 14.7 14.7 14.7 14.7 14.7 14.7 14.7 14.7 14.7 14.7 14.7 14.7 0.0 0.0 0.0 0.0 0.0
Replacement 0.0 0.0 0.0 0.0 0.0 0.0 0.0 0.0 0.0 0.0 0.0 0.0 0.0 0.0 0.0 0.0 0.0 0.0 0.0 0.0 0.0 0.0 0.0 0.0 0.0 66.2 66.2 66.2 66.2 66.2
Signalling and Telecom
CAPEX 0.0 0.0 0.0 0.0 0.0 23.7 23.7 23.7 23.7 23.7 23.7 23.7 23.7 23.7 23.7 23.7 23.7 23.7 23.7 23.7 0.0 0.0 0.0 0.0 0.0 0.0 0.0 0.0 0.0 0.0
Replacement 0.0 0.0 0.0 0.0 0.0 0.0 0.0 0.0 0.0 0.0 0.0 0.0 0.0 0.0 0.0 0.0 0.0 0.0 0.0 0.0 62.8 62.8 62.8 62.8 62.8 62.8 62.8 62.8 62.8 62.8
Automatic fare collection
CAPEX 0.0 0.0 0.0 0.0 0.0 5.0 5.0 5.0 5.0 5.0 5.0 5.0 5.0 5.0 5.0 5.0 5.0 5.0 5.0 5.0 0.0 0.0 0.0 0.0 0.0 0.0 0.0 0.0 0.0 0.0
Replacement 0.0 0.0 0.0 0.0 0.0 0.0 0.0 0.0 0.0 0.0 0.0 0.0 0.0 0.0 0.0 0.0 0.0 0.0 0.0 0.0 13.4 13.4 13.4 13.4 13.4 13.4 13.4 13.4 13.4 13.4
Rolling Stock
CAPEX 0.0 0.0 0.0 0.0 0.0 40.9 40.9 40.9 40.9 40.9 40.9 40.9 40.9 40.9 40.9 40.9 40.9 40.9 40.9 40.9 40.9 40.9 40.9 40.9 40.9 40.9 40.9 40.9 40.9 40.9
Replacement 0.0 0.0 0.0 0.0 0.0 0.0 0.0 0.0 0.0 0.0 0.0 0.0 0.0 0.0 0.0 0.0 0.0 0.0 0.0 0.0 0.0 0.0 0.0 0.0 0.0 0.0 0.0 0.0 0.0 0.0
Other Miscellaneous 0.0 0.0 0.0 0.0 0.0 9.1 9.1 9.1 9.1 9.1 9.1 9.1 9.1 9.1 9.1 9.1 9.1 9.1 9.1 9.1 9.1 9.1 9.1 9.1 9.1 9.1 9.1 9.1 9.1 9.1
Total Non-Operating Costs 12.1 38.7 69.3 98.8 126.3 135.8 126.4 117.1 107.7 98.3 89.0 79.6 70.2 60.9 51.5 49.8 47.6 37.2 26.8 16.4 29.4 45.7 42.0 38.3 34.7 58.8 81.0 73.4 65.7 58.0
Salvage Value
Land 0.0 0.0 0.0 0.0 0.0 0.0 0.0 0.0 0.0 0.0 0.0 0.0 0.0 0.0 0.0 0.0 0.0 0.0 0.0 0.0 0.0 0.0 0.0 0.0 0.0 0.0 0.0 0.0 0.0 327.8
Alignment and Formation 0.0 0.0 0.0 0.0 0.0 0.0 0.0 0.0 0.0 0.0 0.0 0.0 0.0 0.0 0.0 0.0 0.0 0.0 0.0 0.0 0.0 0.0 0.0 0.0 0.0 0.0 0.0 0.0 0.0 383.0
Station Buildings 0.0 0.0 0.0 0.0 0.0 0.0 0.0 0.0 0.0 0.0 0.0 0.0 0.0 0.0 0.0 0.0 0.0 0.0 0.0 0.0 0.0 0.0 0.0 0.0 0.0 0.0 0.0 0.0 0.0 177.6
E&M Works 0.0 0.0 0.0 0.0 0.0 0.0 0.0 0.0 0.0 0.0 0.0 0.0 0.0 0.0 0.0 0.0 0.0 0.0 0.0 0.0 0.0 0.0 0.0 0.0 0.0 0.0 0.0 0.0 0.0 357.2
Permanent Way 0.0 0.0 0.0 0.0 0.0 0.0 0.0 0.0 0.0 0.0 0.0 0.0 0.0 0.0 0.0 0.0 0.0 0.0 0.0 0.0 0.0 0.0 0.0 0.0 0.0 0.0 0.0 0.0 0.0 77.7
Traction & power 0.0 0.0 0.0 0.0 0.0 0.0 0.0 0.0 0.0 0.0 0.0 0.0 0.0 0.0 0.0 0.0 0.0 0.0 0.0 0.0 0.0 0.0 0.0 0.0 0.0 0.0 0.0 0.0 0.0 661.7
Signalling and Telecom 0.0 0.0 0.0 0.0 0.0 0.0 0.0 0.0 0.0 0.0 0.0 0.0 0.0 0.0 0.0 0.0 0.0 0.0 0.0 0.0 0.0 0.0 0.0 0.0 0.0 0.0 0.0 0.0 0.0 314.2
Automatic fare collection 0.0 0.0 0.0 0.0 0.0 0.0 0.0 0.0 0.0 0.0 0.0 0.0 0.0 0.0 0.0 0.0 0.0 0.0 0.0 0.0 0.0 0.0 0.0 0.0 0.0 0.0 0.0 0.0 0.0 66.8
Rolling Stock 0.0 0.0 0.0 0.0 0.0 0.0 0.0 0.0 0.0 0.0 0.0 0.0 0.0 0.0 0.0 0.0 0.0 0.0 0.0 0.0 0.0 0.0 0.0 0.0 0.0 0.0 0.0 0.0 0.0 0.0
Other Miscellaneous 0.0 0.0 0.0 0.0 0.0 0.0 0.0 0.0 0.0 0.0 0.0 0.0 0.0 0.0 0.0 0.0 0.0 0.0 0.0 0.0 0.0 0.0 0.0 0.0 0.0 0.0 0.0 0.0 0.0 226.3
Total Salvage Value 0.0 0.0 0.0 0.0 0.0 0.0 0.0 0.0 0.0 0.0 0.0 0.0 0.0 0.0 0.0 0.0 0.0 0.0 0.0 0.0 0.0 0.0 0.0 0.0 0.0 0.0 0.0 0.0 0.0 2,592
Total Cost 895 1,139 1,337 1,163 1,244 302 305 309 314 321 329 338 349 361 375 1,065 424 444 466 490 2,183 599 639 684 733 3,406 898 957 1,022 -1,499
Present Value of Costs Total (in Rs
Crore)
Per Seat (in Rs
Lakh)
Metro Rail Systems 7,792.5 30.8
Debt Repayment Schedule
Opening Balance 1,056 848 641 433 225 951 878 804 730 656 1,698 1,544 1,391 1,237 1,084 1,056 848 641 433 225 951 878 804 730 656 1,698 1,544 1,391 1,237 1,084
Addition of Debt due to CAPEX 0 0 0 0 0 0 0 0 0 0 0 0 0 0 0 0 0 0 0 0 0 0 0 0 0 0 0 0 0 0
Addition of Debt due to CAPEX
Replacement 0 0 0 0 800 0 0 0 0 1,195 0 0 0 0 0 0 0 0 0 800 0 0 0 0 1,195 0 0 0 0 0
Debt Repayment CAPEX 187 187 187 187 0 0 0 0 0 0 0 0 0 0 0 187 187 187 187 0 0 0 0 0 0 0 0 0 0 0
Debt Repayment CAPEX
Replacement 20 20 20 20 74 74 74 74 74 153 153 153 153 153 0 20 20 20 20 74 74 74 74 74 153 153 153 153 153 0
Closing Balance 848 641 433 225 951 878 804 730 656 1,698 1,544 1,391 1,237 1,084 1,084 848 641 433 225 951 878 804 730 656 1,698 1,544 1,391 1,237 1,084 1,084
Interest Amount 48 37 27 16 29 46 42 38 35 59 81 73 66 58 0 48 37 27 16 29 46 42 38 35 59 81 73 66 58 0

LIFE CYCLE COST ANALYSIS OF FIVE URBAN TRANSPORT SYSTEMS
Bangalore Metro Rail Corporation Limited
87
LCCA FOR MONO RAIL SYSTEMS
Year
1 Year 2
Year
3
Year
4
Year
5
Year
6
Year
7
Year
8
Year
9
Year
10
Year
11
Year
12
Year
13
Year
14
Year
15
Year
16
Year
17
Year
18
Year
19
Year
20
Year
21
Year
22
Year
23
Year
24
Year
25
Year
26
Year
27
Year
28
Year
29
Year
30
2012 2013 2014 2015 2016 2017 2018 2019 2020 2021 2022 2023 2024 2025 2026 2027 2028 2029 2030 2031 2032 2033 2034 2035 2036 2037 2038 2039 2040 2041
CAPEX
Land 226.9 158.9 0.0 0.0 0.0 0.0 0.0 0.0 0.0 0.0 0.0 0.0 0.0 0.0 0.0 0.0 0.0 0.0 0.0 0.0 0.0 0.0 0.0 0.0 0.0 0.0 0.0 0.0 0.0 0.0
Alignment and Formation 73.5 102.9 135.1 113.4 119.1 0.0 0.0 0.0 0.0 0.0 0.0 0.0 0.0 0.0 0.0 0.0 0.0 0.0 0.0 0.0 0.0 0.0 0.0 0.0 0.0 0.0 0.0 0.0 0.0 0.0
Station Buildings 36.5 51.0 67.0 56.3 59.1 0.0 0.0 0.0 0.0 0.0 0.0 0.0 0.0 0.0 0.0 0.0 0.0 0.0 0.0 0.0 0.0 0.0 0.0 0.0 0.0 0.0 0.0 0.0 0.0 0.0
E&M Works 28.1 39.4 51.7 43.4 45.6 0.0 0.0 0.0 0.0 0.0 0.0 0.0 0.0 0.0 0.0 0.0 0.0 0.0 0.0 0.0 0.0 0.0 0.0 0.0 0.0 0.0 0.0 0.0 0.0 0.0
Permanent Way 0.0 0.0 0.0 0.0 0.0 0.0 0.0 0.0 0.0 0.0 0.0 0.0 0.0 0.0 0.0 0.0 0.0 0.0 0.0 0.0 0.0 0.0 0.0 0.0 0.0 0.0 0.0 0.0 0.0 0.0
Traction & power 27.0 37.8 49.7 41.7 43.8 0.0 0.0 0.0 0.0 0.0 0.0 0.0 0.0 0.0 0.0 0.0 0.0 0.0 0.0 0.0 0.0 0.0 0.0 0.0 0.0 0.0 0.0 0.0 0.0 0.0
Signalling and Telecom 35.1 49.1 64.5 54.2 56.9 0.0 0.0 0.0 0.0 0.0 0.0 0.0 0.0 0.0 0.0 0.0 0.0 0.0 0.0 0.0 0.0 0.0 0.0 0.0 0.0 0.0 0.0 0.0 0.0 0.0
Automatic fare collection 10.1 14.2 18.6 15.6 16.4 0.0 0.0 0.0 0.0 0.0 0.0 0.0 0.0 0.0 0.0 0.0 0.0 0.0 0.0 0.0 0.0 0.0 0.0 0.0 0.0 0.0 0.0 0.0 0.0 0.0
R & R 6.0 8.4 11.0 9.3 9.7 0.0 0.0 0.0 0.0 0.0 0.0 0.0 0.0 0.0 0.0 0.0 0.0 0.0 0.0 0.0 0.0 0.0 0.0 0.0 0.0 0.0 0.0 0.0 0.0 0.0
Misc. Civil Utilities 6.0 8.4 11.0 9.3 9.7 0.0 0.0 0.0 0.0 0.0 0.0 0.0 0.0 0.0 0.0 0.0 0.0 0.0 0.0 0.0 0.0 0.0 0.0 0.0 0.0 0.0 0.0 0.0 0.0 0.0
Electrical Utilities 7.5 10.5 13.8 11.6 12.2 0.0 0.0 0.0 0.0 0.0 0.0 0.0 0.0 0.0 0.0 0.0 0.0 0.0 0.0 0.0 0.0 0.0 0.0 0.0 0.0 0.0 0.0 0.0 0.0 0.0
Telecom Utilities 1.5 2.1 2.8 2.3 2.4 0.0 0.0 0.0 0.0 0.0 0.0 0.0 0.0 0.0 0.0 0.0 0.0 0.0 0.0 0.0 0.0 0.0 0.0 0.0 0.0 0.0 0.0 0.0 0.0 0.0
Rolling Stock 319.5 447.3 587.1 493.1 517.8 0.0 0.0 0.0 0.0 0.0 0.0 0.0 0.0 0.0 0.0 0.0 0.0 0.0 0.0 0.0 0.0 0.0 0.0 0.0 0.0 0.0 0.0 0.0 0.0 0.0
General Charges (except land) 16.5 23.1 30.4 25.5 26.8 0.0 0.0 0.0 0.0 0.0 0.0 0.0 0.0 0.0 0.0 0.0 0.0 0.0 0.0 0.0 0.0 0.0 0.0 0.0 0.0 0.0 0.0 0.0 0.0 0.0
Contingencies 18.7 26.2 34.4 28.9 30.3 0.0 0.0 0.0 0.0 0.0 0.0 0.0 0.0 0.0 0.0 0.0 0.0 0.0 0.0 0.0 0.0 0.0 0.0 0.0 0.0 0.0 0.0 0.0 0.0 0.0
Total Capex 813.0 979.4 1,076 904.6 949.8 0.0 0.0 0.0 0.0 0.0 0.0 0.0 0.0 0.0 0.0 0.0 0.0 0.0 0.0 0.0 0.0 0.0 0.0 0.0 0.0 0.0 0.0 0.0 0.0 0.0
CAPEX for Replacements
E&M Works 0.0 0.0 0.0 0.0 0.0 0.0 0.0 0.0 0.0 0.0 0.0 0.0 0.0 0.0 0.0 432.8 0.0 0.0 0.0 0.0 0.0 0.0 0.0 0.0 0.0 704.9 0.0 0.0 0.0 0.0
Permanent Way 0.0 0.0 0.0 0.0 0.0 0.0 0.0 0.0 0.0 0.0 0.0 0.0 0.0 0.0 0.0 0.0 0.0 0.0 0.0 0.0 0.0 0.0 0.0 0.0 0.0 0.0 0.0 0.0 0.0 0.0
Traction & power 0.0 0.0 0.0 0.0 0.0 0.0 0.0 0.0 0.0 0.0 0.0 0.0 0.0 0.0 0.0 0.0 0.0 0.0 0.0 0.0 0.0 0.0 0.0 0.0 0.0 677.5 0.0 0.0 0.0 0.0
Signalling and Telecom 0.0 0.0 0.0 0.0 0.0 0.0 0.0 0.0 0.0 0.0 0.0 0.0 0.0 0.0 0.0 0.0 0.0 0.0 0.0 0.0 689.3 0.0 0.0 0.0 0.0 0.0 0.0 0.0 0.0 0.0
Automatic fare collection 0.0 0.0 0.0 0.0 0.0 0.0 0.0 0.0 0.0 0.0 0.0 0.0 0.0 0.0 0.0 0.0 0.0 0.0 0.0 0.0 198.8 0.0 0.0 0.0 0.0 0.0 0.0 0.0 0.0 0.0
Rolling Stock 0.0 0.0 0.0 0.0 0.0 0.0 0.0 0.0 0.0 0.0 0.0 0.0 0.0 0.0 0.0 0.0 0.0 0.0 0.0 0.0 0.0 0.0 0.0 0.0 0.0 0.0 0.0 0.0 0.0 0.0
Total Capex for Replacement 0.0 0.0 0.0 0.0 0.0 0.0 0.0 0.0 0.0 0.0 0.0 0.0 0.0 0.0 0.0 432.8 0.0 0.0 0.0 0.0 888.2 0.0 0.0 0.0 0.0 1,382 0.0 0.0 0.0 0.0
Taxes & Duties
Custom Duty 78.2 109.5 143.7 120.7 126.7 0.0 0.0 0.0 0.0 0.0 0.0 0.0 0.0 0.0 0.0 80.6 0.0 0.0 0.0 0.0 165.4 0.0 0.0 0.0 0.0 257.4 0.0 0.0 0.0 0.0
Excise Duty 39.9 55.9 73.4 61.6 64.7 0.0 0.0 0.0 0.0 0.0 0.0 0.0 0.0 0.0 0.0 35.7 0.0 0.0 0.0 0.0 0.0 0.0 0.0 0.0 0.0 113.9 0.0 0.0 0.0 0.0
VAT 66.2 92.7 121.7 102.2 107.3 0.0 0.0 0.0 0.0 0.0 0.0 0.0 0.0 0.0 0.0 54.1 0.0 0.0 0.0 0.0 111.0 0.0 0.0 0.0 0.0 172.8 0.0 0.0 0.0 0.0
Sales Tax 34.1 47.7 62.6 52.6 55.2 0.0 0.0 0.0 0.0 0.0 0.0 0.0 0.0 0.0 0.0 27.0 0.0 0.0 0.0 0.0 55.5 0.0 0.0 0.0 0.0 86.4 0.0 0.0 0.0 0.0
Works Tax 34.1 47.7 62.6 52.6 55.2 0.0 0.0 0.0 0.0 0.0 0.0 0.0 0.0 0.0 0.0 27.0 0.0 0.0 0.0 0.0 55.5 0.0 0.0 0.0 0.0 86.4 0.0 0.0 0.0 0.0
Total Taxes & Duties 252.4 353.4 463.9 389.6 409.1 0.0 0.0 0.0 0.0 0.0 0.0 0.0 0.0 0.0 0.0 224.4 0.0 0.0 0.0 0.0 387.4 0.0 0.0 0.0 0.0 716.9 0.0 0.0 0.0 0.0
Operations & Maintenance
Staff Cost 0.0 0.0 0.0 0.0 0.0 72.7 79.2 86.4 94.1 102.6 111.9 121.9 132.9 144.9 157.9 172.1 187.6 204.5 222.9 242.9 264.8 288.6 314.6 342.9 373.8 407.4 444.1 484.1 527.6 575.1
Energy Cost 0.0 0.0 0.0 0.0 0.0 34.3 36.1 37.9 39.8 41.7 43.8 46.0 48.3 50.7 53.3 55.9 58.7 61.7 64.7 68.0 71.4 75.0 78.7 82.6 86.8 91.1 95.7 100.4 105.5 110.7
Repair & Maintenance Cost
Building 0.0 0.0 0.0 0.0 0.0 7.6 8.0 8.4 8.8 9.3 9.7 10.2 10.7 11.3 11.8 12.4 13.0 13.7 14.4 15.1 15.8 16.6 17.5 18.3 19.3 20.2 21.2 22.3 23.4 24.6
Plant & Machinery 0.0 0.0 0.0 0.0 0.0 25.6 26.9 28.3 29.7 31.2 32.7 34.3 36.1 37.9 39.8 41.7 43.8 46.0 48.3 50.7 53.3 55.9 58.7 61.7 64.8 68.0 71.4 75.0 78.7 82.7
Other Repair & Maintenance Cost 0.0 0.0 0.0 0.0 0.0 0.7 0.8 0.8 0.9 0.9 1.0 1.0 1.1 1.1 1.2 1.2 1.3 1.3 1.4 1.5 1.6 1.6 1.7 1.8 1.9 2.0 2.1 2.2 2.3 2.4
Other Miscellaneous O&M Costs 0.0 0.0 0.0 0.0 0.0 3.2 3.4 3.6 3.9 4.2 4.5 4.8 5.2 5.5 5.9 6.4 6.9 7.4 7.9 8.5 9.2 9.9 10.6 11.4 12.3 13.2 14.3 15.4 16.6 17.9
Total O&M Costs 0.0 0.0 0.0 0.0 0.0 144.2 154.4 165.3 177.1 189.9 203.5 218.3 234.2 251.3 269.8 289.8 311.3 334.6 359.6 386.7 416.0 447.7 481.8 518.8 558.8 602.0 648.8 699.4 754.1 813
Non-Operating Expenses
Interest Expenses 14.2 45.6 81.6 116.3 148.7 159.8 148.8 137.8 126.8 115.7 104.7 93.7 82.7 71.6 60.6 57.2 53.2 41.2 29.2 17.1 25.1 37.6 34.5 31.4 28.3 47.8 65.7 59.4 53.1 46.8
Depreciation Expenses

LIFE CYCLE COST ANALYSIS OF FIVE URBAN TRANSPORT SYSTEMS
Bangalore Metro Rail Corporation Limited
88
Year
1 Year 2
Year
3
Year
4
Year
5
Year
6
Year
7
Year
8
Year
9
Year
10
Year
11
Year
12
Year
13
Year
14
Year
15
Year
16
Year
17
Year
18
Year
19
Year
20
Year
21
Year
22
Year
23
Year
24
Year
25
Year
26
Year
27
Year
28
Year
29
Year
30
2012 2013 2014 2015 2016 2017 2018 2019 2020 2021 2022 2023 2024 2025 2026 2027 2028 2029 2030 2031 2032 2033 2034 2035 2036 2037 2038 2039 2040 2041
Alignment and Formation 0.0 0.0 0.0 0.0 0.0 10.9 10.9 10.9 10.9 10.9 10.9 10.9 10.9 10.9 10.9 10.9 10.9 10.9 10.9 10.9 10.9 10.9 10.9 10.9 10.9 10.9 10.9 10.9 10.9 10.9
Station Buildings 0.0 0.0 0.0 0.0 0.0 5.4 5.4 5.4 5.4 5.4 5.4 5.4 5.4 5.4 5.4 5.4 5.4 5.4 5.4 5.4 5.4 5.4 5.4 5.4 5.4 5.4 5.4 5.4 5.4 5.4
E&M Works
CAPEX 0.0 0.0 0.0 0.0 0.0 20.8 20.8 20.8 20.8 20.8 20.8 20.8 20.8 20.8 20.8 0.0 0.0 0.0 0.0 0.0 0.0 0.0 0.0 0.0 0.0 0.0 0.0 0.0 0.0 0.0
Replacement 0.0 0.0 0.0 0.0 0.0 0.0 0.0 0.0 0.0 0.0 0.0 0.0 0.0 0.0 0.0 43.3 43.3 43.3 43.3 43.3 43.3 43.3 43.3 43.3 43.3 70.5 70.5 70.5 70.5 70.5
Permanent Way
CAPEX 0.0 0.0 0.0 0.0 0.0 0.0 0.0 0.0 0.0 0.0 0.0 0.0 0.0 0.0 0.0 0.0 0.0 0.0 0.0 0.0 0.0 0.0 0.0 0.0 0.0 0.0 0.0 0.0 0.0 0.0
Replacement 0.0 0.0 0.0 0.0 0.0 0.0 0.0 0.0 0.0 0.0 0.0 0.0 0.0 0.0 0.0 0.0 0.0 0.0 0.0 0.0 0.0 0.0 0.0 0.0 0.0 0.0 0.0 0.0 0.0 0.0
Traction & power
CAPEX 0.0 0.0 0.0 0.0 0.0 10.0 10.0 10.0 10.0 10.0 10.0 10.0 10.0 10.0 10.0 10.0 10.0 10.0 10.0 10.0 10.0 10.0 10.0 10.0 10.0 0.0 0.0 0.0 0.0 0.0
Replacement 0.0 0.0 0.0 0.0 0.0 0.0 0.0 0.0 0.0 0.0 0.0 0.0 0.0 0.0 0.0 0.0 0.0 0.0 0.0 0.0 0.0 0.0 0.0 0.0 0.0 45.2 45.2 45.2 45.2 45.2
Signalling and Telecom
CAPEX 0.0 0.0 0.0 0.0 0.0 17.3 17.3 17.3 17.3 17.3 17.3 17.3 17.3 17.3 17.3 17.3 17.3 17.3 17.3 17.3 0.0 0.0 0.0 0.0 0.0 0.0 0.0 0.0 0.0 0.0
Replacement 0.0 0.0 0.0 0.0 0.0 0.0 0.0 0.0 0.0 0.0 0.0 0.0 0.0 0.0 0.0 0.0 0.0 0.0 0.0 0.0 46.0 46.0 46.0 46.0 46.0 46.0 46.0 46.0 46.0 46.0
Automatic fare collection
CAPEX 0.0 0.0 0.0 0.0 0.0 5.0 5.0 5.0 5.0 5.0 5.0 5.0 5.0 5.0 5.0 5.0 5.0 5.0 5.0 5.0 0.0 0.0 0.0 0.0 0.0 0.0 0.0 0.0 0.0 0.0
Replacement 0.0 0.0 0.0 0.0 0.0 0.0 0.0 0.0 0.0 0.0 0.0 0.0 0.0 0.0 0.0 0.0 0.0 0.0 0.0 0.0 13.3 13.3 13.3 13.3 13.3 13.3 13.3 13.3 13.3 13.3
Rolling Stock
CAPEX 0.0 0.0 0.0 0.0 0.0 94.6 94.6 94.6 94.6 94.6 94.6 94.6 94.6 94.6 94.6 94.6 94.6 94.6 94.6 94.6 94.6 94.6 94.6 94.6 94.6 94.6 94.6 94.6 94.6 94.6
Replacement 0.0 0.0 0.0 0.0 0.0 0.0 0.0 0.0 0.0 0.0 0.0 0.0 0.0 0.0 0.0 0.0 0.0 0.0 0.0 0.0 0.0 0.0 0.0 0.0 0.0 0.0 0.0 0.0 0.0 0.0
Other Miscellaneous 0.0 0.0 0.0 0.0 0.0 8.3 8.3 8.3 8.3 8.3 8.3 8.3 8.3 8.3 8.3 8.3 8.3 8.3 8.3 8.3 8.3 8.3 8.3 8.3 8.3 8.3 8.3 8.3 8.3 8.3
Total Non Operating Costs 14.2 45.6 81.6 116.3 148.7 159.8 148.8 137.8 126.8 115.7 104.7 93.7 82.7 71.6 60.6 57.2 53.2 41.2 29.2 17.1 25.1 37.6 34.5 31.4 28.3 47.8 65.7 59.4 53.1 46.8
Salvage Value
Land 0.0 0.0 0.0 0.0 0.0 0.0 0.0 0.0 0.0 0.0 0.0 0.0 0.0 0.0 0.0 0.0 0.0 0.0 0.0 0.0 0.0 0.0 0.0 0.0 0.0 0.0 0.0 0.0 0.0 385.8
Alignment and Formation 0.0 0.0 0.0 0.0 0.0 0.0 0.0 0.0 0.0 0.0 0.0 0.0 0.0 0.0 0.0 0.0 0.0 0.0 0.0 0.0 0.0 0.0 0.0 0.0 0.0 0.0 0.0 0.0 0.0 272.0
Station Buildings 0.0 0.0 0.0 0.0 0.0 0.0 0.0 0.0 0.0 0.0 0.0 0.0 0.0 0.0 0.0 0.0 0.0 0.0 0.0 0.0 0.0 0.0 0.0 0.0 0.0 0.0 0.0 0.0 0.0 134.9
E&M Works 0.0 0.0 0.0 0.0 0.0 0.0 0.0 0.0 0.0 0.0 0.0 0.0 0.0 0.0 0.0 0.0 0.0 0.0 0.0 0.0 0.0 0.0 0.0 0.0 0.0 0.0 0.0 0.0 0.0 352.5
Permanent Way 0.0 0.0 0.0 0.0 0.0 0.0 0.0 0.0 0.0 0.0 0.0 0.0 0.0 0.0 0.0 0.0 0.0 0.0 0.0 0.0 0.0 0.0 0.0 0.0 0.0 0.0 0.0 0.0 0.0 0.0
Traction & power 0.0 0.0 0.0 0.0 0.0 0.0 0.0 0.0 0.0 0.0 0.0 0.0 0.0 0.0 0.0 0.0 0.0 0.0 0.0 0.0 0.0 0.0 0.0 0.0 0.0 0.0 0.0 0.0 0.0 451.7
Signalling and Telecom 0.0 0.0 0.0 0.0 0.0 0.0 0.0 0.0 0.0 0.0 0.0 0.0 0.0 0.0 0.0 0.0 0.0 0.0 0.0 0.0 0.0 0.0 0.0 0.0 0.0 0.0 0.0 0.0 0.0 229.8
Automatic fare collection 0.0 0.0 0.0 0.0 0.0 0.0 0.0 0.0 0.0 0.0 0.0 0.0 0.0 0.0 0.0 0.0 0.0 0.0 0.0 0.0 0.0 0.0 0.0 0.0 0.0 0.0 0.0 0.0 0.0 66.3
Rolling Stock 0.0 0.0 0.0 0.0 0.0 0.0 0.0 0.0 0.0 0.0 0.0 0.0 0.0 0.0 0.0 0.0 0.0 0.0 0.0 0.0 0.0 0.0 0.0 0.0 0.0 0.0 0.0 0.0 0.0 0.0
Other Miscellaneous 0.0 0.0 0.0 0.0 0.0 0.0 0.0 0.0 0.0 0.0 0.0 0.0 0.0 0.0 0.0 0.0 0.0 0.0 0.0 0.0 0.0 0.0 0.0 0.0 0.0 0.0 0.0 0.0 0.0 208.2
Total Salvage Value 0.0 0.0 0.0 0.0 0.0 0.0 0.0 0.0 0.0 0.0 0.0 0.0 0.0 0.0 0.0 0.0 0.0 0.0 0.0 0.0 0.0 0.0 0.0 0.0 0.0 0.0 0.0 0.0 0.0 2,101
Total Cost 1,080 1,378 1,622 1,411 1,508 304 303 303 304 306 308 312 317 323 330 1,004 365 376 389 404 1,717 485 516 550 587 2,749 714 759 807 -1,241
Present Value of Costs
Total (in Rs
Crore) Per Seat (in Rs Lakh)
Metro Rail Systems 7,676.6 28.2
Debt Repayment Schedule
Opening Balance 0 569 1,255 2,009 2,642 3,307 3,086 2,866 2,645 2,425 2,204 1,984 1,764 1,543 1,323 1,102 1,185 944 703 463 222 782 721 659 597 536 1,377 1,251 1,125 999
Addition of Debt due to CAPEX 569 686 754 633 665 0 0 0 0 0 0 0 0 0 0 0 0 0 0 0 0 0 0 0 0 0 0 0 0 0
Addition of Debt due to CAPEX
Replacement 0 0 0 0 0 0 0 0 0 0 0 0 0 0 0 303 0 0 0 0 622 0 0 0 0 968 0 0 0 0
Debt Repayment CAPEX 0 0 0 0 0 220 220 220 220 220 220 220 220 220 220 220 220 220 220 220 0 0 0 0 0 0 0 0 0 0
Debt Repayment CAPEX
Replacement 0 0 0 0 0 0 0 0 0 0 0 0 0 0 0 0 20 20 20 20 62 62 62 62 62 126 126 126 126 126
Closing Balance 569 1,255 2,009 2,642 3,307 3,086 2,866 2,645 2,425 2,204 1,984 1,764 1,543 1,323 1,102 1,185 944 703 463 222 782 721 659 597 536 1,377 1,251 1,125 999 873

LIFE CYCLE COST ANALYSIS OF FIVE URBAN TRANSPORT SYSTEMS
Bangalore Metro Rail Corporation Limited
89
Year
1 Year 2
Year
3
Year
4
Year
5
Year
6
Year
7
Year
8
Year
9
Year
10
Year
11
Year
12
Year
13
Year
14
Year
15
Year
16
Year
17
Year
18
Year
19
Year
20
Year
21
Year
22
Year
23
Year
24
Year
25
Year
26
Year
27
Year
28
Year
29
Year
30
2012 2013 2014 2015 2016 2017 2018 2019 2020 2021 2022 2023 2024 2025 2026 2027 2028 2029 2030 2031 2032 2033 2034 2035 2036 2037 2038 2039 2040 2041
Interest Amount 14 46 82 116 149 160 149 138 127 116 105 94 83 72 61 57 53 41 29 17 25 38 34 31 28 48 66 59 53 47
LCCA FOR ELEVATED LIGHT RAIL SYSTEMS Year 1 Year 2
Year
3
Year
4
Year
5
Year
6
Year
7
Year
8
Year
9
Year
10
Year
11
Year
12
Year
13
Year
14
Year
15
Year
16
Year
17
Year
18
Year
19
Year
20
Year
21
Year
22
Year
23
Year
24
Year
25
Year
26
Year
27
Year
28
Year
29
Year
30
2012 2013 2014 2015 2016 2017 2018 2019 2020 2021 2022 2023 2024 2025 2026 2027 2028 2029 2030 2031 2032 2033 2034 2035 2036 2037 2038 2039 2040 2041
CAPEX
Land 168.7 118.1 0.0 0.0 0.0 0.0 0.0 0.0 0.0 0.0 0.0 0.0 0.0 0.0 0.0 0.0 0.0 0.0 0.0 0.0 0.0 0.0 0.0 0.0 0.0 0.0 0.0 0.0 0.0 0.0
Alignment and Formation 69.0 96.6 126.8 106.5 111.8 0.0 0.0 0.0 0.0 0.0 0.0 0.0 0.0 0.0 0.0 0.0 0.0 0.0 0.0 0.0 0.0 0.0 0.0 0.0 0.0 0.0 0.0 0.0 0.0 0.0
Station Buildings 40.5 56.7 74.4 62.5 65.6 0.0 0.0 0.0 0.0 0.0 0.0 0.0 0.0 0.0 0.0 0.0 0.0 0.0 0.0 0.0 0.0 0.0 0.0 0.0 0.0 0.0 0.0 0.0 0.0 0.0
E&M Works 59.6 83.5 109.6 92.0 96.6 0.0 0.0 0.0 0.0 0.0 0.0 0.0 0.0 0.0 0.0 0.0 0.0 0.0 0.0 0.0 0.0 0.0 0.0 0.0 0.0 0.0 0.0 0.0 0.0 0.0
Permanent Way 15.0 21.0 27.6 23.2 24.3 0.0 0.0 0.0 0.0 0.0 0.0 0.0 0.0 0.0 0.0 0.0 0.0 0.0 0.0 0.0 0.0 0.0 0.0 0.0 0.0 0.0 0.0 0.0 0.0 0.0
Traction & power 27.0 37.8 49.7 41.7 43.8 0.0 0.0 0.0 0.0 0.0 0.0 0.0 0.0 0.0 0.0 0.0 0.0 0.0 0.0 0.0 0.0 0.0 0.0 0.0 0.0 0.0 0.0 0.0 0.0 0.0
Signalling and Telecom 32.1 44.9 59.0 49.5 52.0 0.0 0.0 0.0 0.0 0.0 0.0 0.0 0.0 0.0 0.0 0.0 0.0 0.0 0.0 0.0 0.0 0.0 0.0 0.0 0.0 0.0 0.0 0.0 0.0 0.0
Automatic fare collection 10.1 14.2 18.6 15.6 16.4 0.0 0.0 0.0 0.0 0.0 0.0 0.0 0.0 0.0 0.0 0.0 0.0 0.0 0.0 0.0 0.0 0.0 0.0 0.0 0.0 0.0 0.0 0.0 0.0 0.0
R & R 6.0 8.4 11.0 9.3 9.7 0.0 0.0 0.0 0.0 0.0 0.0 0.0 0.0 0.0 0.0 0.0 0.0 0.0 0.0 0.0 0.0 0.0 0.0 0.0 0.0 0.0 0.0 0.0 0.0 0.0
Misc. Civil Utilities 6.0 8.4 11.0 9.3 9.7 0.0 0.0 0.0 0.0 0.0 0.0 0.0 0.0 0.0 0.0 0.0 0.0 0.0 0.0 0.0 0.0 0.0 0.0 0.0 0.0 0.0 0.0 0.0 0.0 0.0
Electrical Utilities 7.5 10.5 13.8 11.6 12.2 0.0 0.0 0.0 0.0 0.0 0.0 0.0 0.0 0.0 0.0 0.0 0.0 0.0 0.0 0.0 0.0 0.0 0.0 0.0 0.0 0.0 0.0 0.0 0.0 0.0
Telecom Utilities 1.5 2.1 2.8 2.3 2.4 0.0 0.0 0.0 0.0 0.0 0.0 0.0 0.0 0.0 0.0 0.0 0.0 0.0 0.0 0.0 0.0 0.0 0.0 0.0 0.0 0.0 0.0 0.0 0.0 0.0
Rolling Stock 174.0 243.6 319.7 268.6 282.0 0.0 0.0 0.0 0.0 0.0 0.0 0.0 0.0 0.0 0.0 0.0 0.0 0.0 0.0 0.0 0.0 0.0 0.0 0.0 0.0 0.0 0.0 0.0 0.0 0.0
General Charges (except land) 12.3 17.2 22.6 19.0 19.9 0.0 0.0 0.0 0.0 0.0 0.0 0.0 0.0 0.0 0.0 0.0 0.0 0.0 0.0 0.0 0.0 0.0 0.0 0.0 0.0 0.0 0.0 0.0 0.0 0.0
Contingencies 13.9 19.5 25.6 21.5 22.6 0.0 0.0 0.0 0.0 0.0 0.0 0.0 0.0 0.0 0.0 0.0 0.0 0.0 0.0 0.0 0.0 0.0 0.0 0.0 0.0 0.0 0.0 0.0 0.0 0.0
Total Capex 643.2 782.5 872.0 732.5 769.1 0.0 0.0 0.0 0.0 0.0 0.0 0.0 0.0 0.0 0.0 0.0 0.0 0.0 0.0 0.0 0.0 0.0 0.0 0.0 0.0 0.0 0.0 0.0 0.0 0.0
CAPEX for Replacements
E&M Works 0.0 0.0 0.0 0.0 0.0 0.0 0.0 0.0 0.0 0.0 0.0 0.0 0.0 0.0 0.0 917.5 0.0 0.0 0.0 0.0 0.0 0.0 0.0 0.0 0.0 1,494 0.0 0.0 0.0 0.0
Permanent Way 0.0 0.0 0.0 0.0 0.0 0.0 0.0 0.0 0.0 0.0 0.0 0.0 0.0 0.0 0.0 0.0 0.0 0.0 0.0 0.0 0.0 0.0 0.0 0.0 0.0 0.0 0.0 0.0 0.0 0.0
Traction & power 0.0 0.0 0.0 0.0 0.0 0.0 0.0 0.0 0.0 0.0 0.0 0.0 0.0 0.0 0.0 0.0 0.0 0.0 0.0 0.0 0.0 0.0 0.0 0.0 0.0 677.5 0.0 0.0 0.0 0.0
Signalling and Telecom 0.0 0.0 0.0 0.0 0.0 0.0 0.0 0.0 0.0 0.0 0.0 0.0 0.0 0.0 0.0 0.0 0.0 0.0 0.0 0.0 630.4 0.0 0.0 0.0 0.0 0.0 0.0 0.0 0.0 0.0
Automatic fare collection 0.0 0.0 0.0 0.0 0.0 0.0 0.0 0.0 0.0 0.0 0.0 0.0 0.0 0.0 0.0 0.0 0.0 0.0 0.0 0.0 198.8 0.0 0.0 0.0 0.0 0.0 0.0 0.0 0.0 0.0
Rolling Stock 0.0 0.0 0.0 0.0 0.0 0.0 0.0 0.0 0.0 0.0 0.0 0.0 0.0 0.0 0.0 0.0 0.0 0.0 0.0 0.0 0.0 0.0 0.0 0.0 0.0 0.0 0.0 0.0 0.0 0.0
Total Capex for Replacement 0.0 0.0 0.0 0.0 0.0 0.0 0.0 0.0 0.0 0.0 0.0 0.0 0.0 0.0 0.0 917.5 0.0 0.0 0.0 0.0 829.3 0.0 0.0 0.0 0.0 2,172 0.0 0.0 0.0 0.0
Taxes & Duties
Custom Duty 59.2 82.9 108.8 91.4 95.9 0.0 0.0 0.0 0.0 0.0 0.0 0.0 0.0 0.0 0.0 170.8 0.0 0.0 0.0 0.0 154.4 0.0 0.0 0.0 0.0 404.4 0.0 0.0 0.0 0.0
Excise Duty 30.5 42.7 56.0 47.1 49.4 0.0 0.0 0.0 0.0 0.0 0.0 0.0 0.0 0.0 0.0 75.6 0.0 0.0 0.0 0.0 0.0 0.0 0.0 0.0 0.0 179.0 0.0 0.0 0.0 0.0
VAT 51.5 72.2 94.7 79.6 83.5 0.0 0.0 0.0 0.0 0.0 0.0 0.0 0.0 0.0 0.0 114.7 0.0 0.0 0.0 0.0 103.7 0.0 0.0 0.0 0.0 271.5 0.0 0.0 0.0 0.0
Sales Tax 27.6 38.7 50.8 42.7 44.8 0.0 0.0 0.0 0.0 0.0 0.0 0.0 0.0 0.0 0.0 57.3 0.0 0.0 0.0 0.0 51.8 0.0 0.0 0.0 0.0 135.7 0.0 0.0 0.0 0.0
Works Tax 27.6 38.7 50.8 42.7 44.8 0.0 0.0 0.0 0.0 0.0 0.0 0.0 0.0 0.0 0.0 57.3 0.0 0.0 0.0 0.0 51.8 0.0 0.0 0.0 0.0 135.7 0.0 0.0 0.0 0.0
Total Taxes & Duties 196.5 275.1 361.1 303.4 318.5 0.0 0.0 0.0 0.0 0.0 0.0 0.0 0.0 0.0 0.0 475.8 0.0 0.0 0.0 0.0 361.7 0.0 0.0 0.0 0.0 1,126 0.0 0.0 0.0 0.0
Operations & Maintenance
Staff Cost 0.0 0.0 0.0 0.0 0.0 58.0 63.2 68.9 75.1 81.9 89.3 97.3 106.1 115.6 126.0 137.4 149.7 163.2 177.9 193.9 211.3 230.4 251.1 273.7 298.3 325.2 354.4 386.3 421.1 459.0
Energy Cost 0.0 0.0 0.0 0.0 0.0 29.3 30.8 32.3 33.9 35.6 37.4 39.3 41.3 43.3 45.5 47.8 50.2 52.7 55.3 58.1 61.0 64.0 67.2 70.6 74.1 77.8 81.7 85.8 90.1 94.6
Repair & Maintenance Cost
Building 0.0 0.0 0.0 0.0 0.0 7.6 8.0 8.4 8.8 9.3 9.7 10.2 10.7 11.3 11.8 12.4 13.0 13.7 14.4 15.1 15.8 16.6 17.5 18.3 19.3 20.2 21.2 22.3 23.4 24.6
Plant & Machinery 0.0 0.0 0.0 0.0 0.0 14.0 14.7 15.4 16.2 17.0 17.8 18.7 19.6 20.6 21.7 22.7 23.9 25.1 26.3 27.6 29.0 30.5 32.0 33.6 35.3 37.0 38.9 40.8 42.9 45.0
Other Repair & Maintenance Cost 0.0 0.0 0.0 0.0 0.0 0.5 0.5 0.5 0.6 0.6 0.6 0.7 0.7 0.7 0.8 0.8 0.8 0.9 0.9 1.0 1.0 1.1 1.1 1.2 1.2 1.3 1.4 1.4 1.5 1.6
Other Miscellaneous O&M Costs 0.0 0.0 0.0 0.0 0.0 12.0 12.9 13.8 14.8 15.9 17.0 18.3 19.6 21.1 22.6 24.3 26.1 28.1 30.2 32.5 35.0 37.7 40.6 43.7 47.1 50.8 54.7 59.0 63.7 68.7

LIFE CYCLE COST ANALYSIS OF FIVE URBAN TRANSPORT SYSTEMS
Bangalore Metro Rail Corporation Limited
90
Year 1 Year 2 Year
3
Year
4
Year
5
Year
6
Year
7
Year
8
Year
9
Year
10
Year
11
Year
12
Year
13
Year
14
Year
15
Year
16
Year
17
Year
18
Year
19
Year
20
Year
21
Year
22
Year
23
Year
24
Year
25
Year
26
Year
27
Year
28
Year
29
Year
30
2012 2013 2014 2015 2016 2017 2018 2019 2020 2021 2022 2023 2024 2025 2026 2027 2028 2029 2030 2031 2032 2033 2034 2035 2036 2037 2038 2039 2040 2041
Total O&M Costs 0.0 0.0 0.0 0.0 0.0 121.4 130.1 139.4 149.4 160.2 171.9 184.4 198.0 212.6 228.4 245.4 263.7 283.6 305.0 328.2 353.2 380.2 409.5 441.1 475.3 512.3 552.3 595.7 642.6 693.5
Non-Operating Expenses
Interest Expenses 11.3 36.2 65.2 93.2 119.5 128.5 119.7 110.8 102.0 93.1 84.2 75.4 66.5 57.6 48.8 55.9 62.1 51.1 40.1 29.1 36.0 46.5 42.4 38.3 34.2 65.6 94.5 85.4 76.2 67.1
Depreciation Expenses
Alignment and Formation 0.0 0.0 0.0 0.0 0.0 10.2 10.2 10.2 10.2 10.2 10.2 10.2 10.2 10.2 10.2 10.2 10.2 10.2 10.2 10.2 10.2 10.2 10.2 10.2 10.2 10.2 10.2 10.2 10.2 10.2
Station Buildings 0.0 0.0 0.0 0.0 0.0 6.0 6.0 6.0 6.0 6.0 6.0 6.0 6.0 6.0 6.0 6.0 6.0 6.0 6.0 6.0 6.0 6.0 6.0 6.0 6.0 6.0 6.0 6.0 6.0 6.0
E&M Works
CAPEX 0.0 0.0 0.0 0.0 0.0 44.1 44.1 44.1 44.1 44.1 44.1 44.1 44.1 44.1 44.1 0.0 0.0 0.0 0.0 0.0 0.0 0.0 0.0 0.0 0.0 0.0 0.0 0.0 0.0 0.0
Replacement 0.0 0.0 0.0 0.0 0.0 0.0 0.0 0.0 0.0 0.0 0.0 0.0 0.0 0.0 0.0 91.7 91.7 91.7 91.7 91.7 91.7 91.7 91.7 91.7 91.7 149.4 149.4 149.4 149.4 149.4
Permanent Way
CAPEX 0.0 0.0 0.0 0.0 0.0 2.2 2.2 2.2 2.2 2.2 2.2 2.2 2.2 2.2 2.2 2.2 2.2 2.2 2.2 2.2 2.2 2.2 2.2 2.2 2.2 2.2 2.2 2.2 2.2 2.2
Replacement 0.0 0.0 0.0 0.0 0.0 0.0 0.0 0.0 0.0 0.0 0.0 0.0 0.0 0.0 0.0 0.0 0.0 0.0 0.0 0.0 0.0 0.0 0.0 0.0 0.0 0.0 0.0 0.0 0.0 0.0
Traction & power
CAPEX 0.0 0.0 0.0 0.0 0.0 10.0 10.0 10.0 10.0 10.0 10.0 10.0 10.0 10.0 10.0 10.0 10.0 10.0 10.0 10.0 10.0 10.0 10.0 10.0 10.0 0.0 0.0 0.0 0.0 0.0
Replacement 0.0 0.0 0.0 0.0 0.0 0.0 0.0 0.0 0.0 0.0 0.0 0.0 0.0 0.0 0.0 0.0 0.0 0.0 0.0 0.0 0.0 0.0 0.0 0.0 0.0 45.2 45.2 45.2 45.2 45.2
Signalling and Telecom
CAPEX 0.0 0.0 0.0 0.0 0.0 15.8 15.8 15.8 15.8 15.8 15.8 15.8 15.8 15.8 15.8 15.8 15.8 15.8 15.8 15.8 0.0 0.0 0.0 0.0 0.0 0.0 0.0 0.0 0.0 0.0
Replacement 0.0 0.0 0.0 0.0 0.0 0.0 0.0 0.0 0.0 0.0 0.0 0.0 0.0 0.0 0.0 0.0 0.0 0.0 0.0 0.0 42.0 42.0 42.0 42.0 42.0 42.0 42.0 42.0 42.0 42.0
Automatic fare collection
CAPEX 0.0 0.0 0.0 0.0 0.0 5.0 5.0 5.0 5.0 5.0 5.0 5.0 5.0 5.0 5.0 5.0 5.0 5.0 5.0 5.0 0.0 0.0 0.0 0.0 0.0 0.0 0.0 0.0 0.0 0.0
Replacement 0.0 0.0 0.0 0.0 0.0 0.0 0.0 0.0 0.0 0.0 0.0 0.0 0.0 0.0 0.0 0.0 0.0 0.0 0.0 0.0 13.3 13.3 13.3 13.3 13.3 13.3 13.3 13.3 13.3 13.3
Rolling Stock
CAPEX 0.0 0.0 0.0 0.0 0.0 51.5 51.5 51.5 51.5 51.5 51.5 51.5 51.5 51.5 51.5 51.5 51.5 51.5 51.5 51.5 51.5 51.5 51.5 51.5 51.5 51.5 51.5 51.5 51.5 51.5
Replacement 0.0 0.0 0.0 0.0 0.0 0.0 0.0 0.0 0.0 0.0 0.0 0.0 0.0 0.0 0.0 0.0 0.0 0.0 0.0 0.0 0.0 0.0 0.0 0.0 0.0 0.0 0.0 0.0 0.0 0.0
Other Miscellaneous 0.0 0.0 0.0 0.0 0.0 7.0 7.0 7.0 7.0 7.0 7.0 7.0 7.0 7.0 7.0 7.0 7.0 7.0 7.0 7.0 7.0 7.0 7.0 7.0 7.0 7.0 7.0 7.0 7.0 7.0
Total Non-Operating Costs 11.3 36.2 65.2 93.2 119.5 128.5 119.7 110.8 102.0 93.1 84.2 75.4 66.5 57.6 48.8 55.9 62.1 51.1 40.1 29.1 36.0 46.5 42.4 38.3 34.2 65.6 94.5 85.4 76.2 67.1
Salvage Value
Land 0.0 0.0 0.0 0.0 0.0 0.0 0.0 0.0 0.0 0.0 0.0 0.0 0.0 0.0 0.0 0.0 0.0 0.0 0.0 0.0 0.0 0.0 0.0 0.0 0.0 0.0 0.0 0.0 0.0 286.7
Alignment and Formation 0.0 0.0 0.0 0.0 0.0 0.0 0.0 0.0 0.0 0.0 0.0 0.0 0.0 0.0 0.0 0.0 0.0 0.0 0.0 0.0 0.0 0.0 0.0 0.0 0.0 0.0 0.0 0.0 0.0 255.4
Station Buildings 0.0 0.0 0.0 0.0 0.0 0.0 0.0 0.0 0.0 0.0 0.0 0.0 0.0 0.0 0.0 0.0 0.0 0.0 0.0 0.0 0.0 0.0 0.0 0.0 0.0 0.0 0.0 0.0 0.0 149.9
E&M Works 0.0 0.0 0.0 0.0 0.0 0.0 0.0 0.0 0.0 0.0 0.0 0.0 0.0 0.0 0.0 0.0 0.0 0.0 0.0 0.0 0.0 0.0 0.0 0.0 0.0 0.0 0.0 0.0 0.0 747.2
Permanent Way 0.0 0.0 0.0 0.0 0.0 0.0 0.0 0.0 0.0 0.0 0.0 0.0 0.0 0.0 0.0 0.0 0.0 0.0 0.0 0.0 0.0 0.0 0.0 0.0 0.0 0.0 0.0 0.0 0.0 55.5
Traction & power 0.0 0.0 0.0 0.0 0.0 0.0 0.0 0.0 0.0 0.0 0.0 0.0 0.0 0.0 0.0 0.0 0.0 0.0 0.0 0.0 0.0 0.0 0.0 0.0 0.0 0.0 0.0 0.0 0.0 451.7
Signalling and Telecom 0.0 0.0 0.0 0.0 0.0 0.0 0.0 0.0 0.0 0.0 0.0 0.0 0.0 0.0 0.0 0.0 0.0 0.0 0.0 0.0 0.0 0.0 0.0 0.0 0.0 0.0 0.0 0.0 0.0 210.1
Automatic fare collection 0.0 0.0 0.0 0.0 0.0 0.0 0.0 0.0 0.0 0.0 0.0 0.0 0.0 0.0 0.0 0.0 0.0 0.0 0.0 0.0 0.0 0.0 0.0 0.0 0.0 0.0 0.0 0.0 0.0 66.3
Rolling Stock 0.0 0.0 0.0 0.0 0.0 0.0 0.0 0.0 0.0 0.0 0.0 0.0 0.0 0.0 0.0 0.0 0.0 0.0 0.0 0.0 0.0 0.0 0.0 0.0 0.0 0.0 0.0 0.0 0.0 0.0
Other Miscellaneous 0.0 0.0 0.0 0.0 0.0 0.0 0.0 0.0 0.0 0.0 0.0 0.0 0.0 0.0 0.0 0.0 0.0 0.0 0.0 0.0 0.0 0.0 0.0 0.0 0.0 0.0 0.0 0.0 0.0 174.7
Total Salvage Value 0.0 0.0 0.0 0.0 0.0 0.0 0.0 0.0 0.0 0.0 0.0 0.0 0.0 0.0 0.0 0.0 0.0 0.0 0.0 0.0 0.0 0.0 0.0 0.0 0.0 0.0 0.0 0.0 0.0 2,397
Total Cost 851 1,094 1,298 1,129 1,207 250 250 250 251 253 256 260 264 270 277 1,695 326 335 345 357 1,580 427 452 479 510 3,876 647 681 719 -1,637
Present Value of Costs
Total (in Rs
Crore)
Per Seat (in Rs
Lakh)
Metro Rail Systems 6,539.2 23.3
Debt Repayment Schedule
Opening Balance 0 450 998 1,608 2,121 2,660 2,482 2,305 2,128 1,950 1,773 1,596 1,418 1,241 1,064 887 1,351 1,131 911 691 471 970 888 807 725 644 1,981 1,799 1,616 1,433
Addition of Debt due to CAPEX 450 548 610 513 538 0 0 0 0 0 0 0 0 0 0 0 0 0 0 0 0 0 0 0 0 0 0 0 0 0
Addition of Debt due to CAPEX
Replacement 0 0 0 0 0 0 0 0 0 0 0 0 0 0 0 642 0 0 0 0 580 0 0 0 0 1,520 0 0 0 0
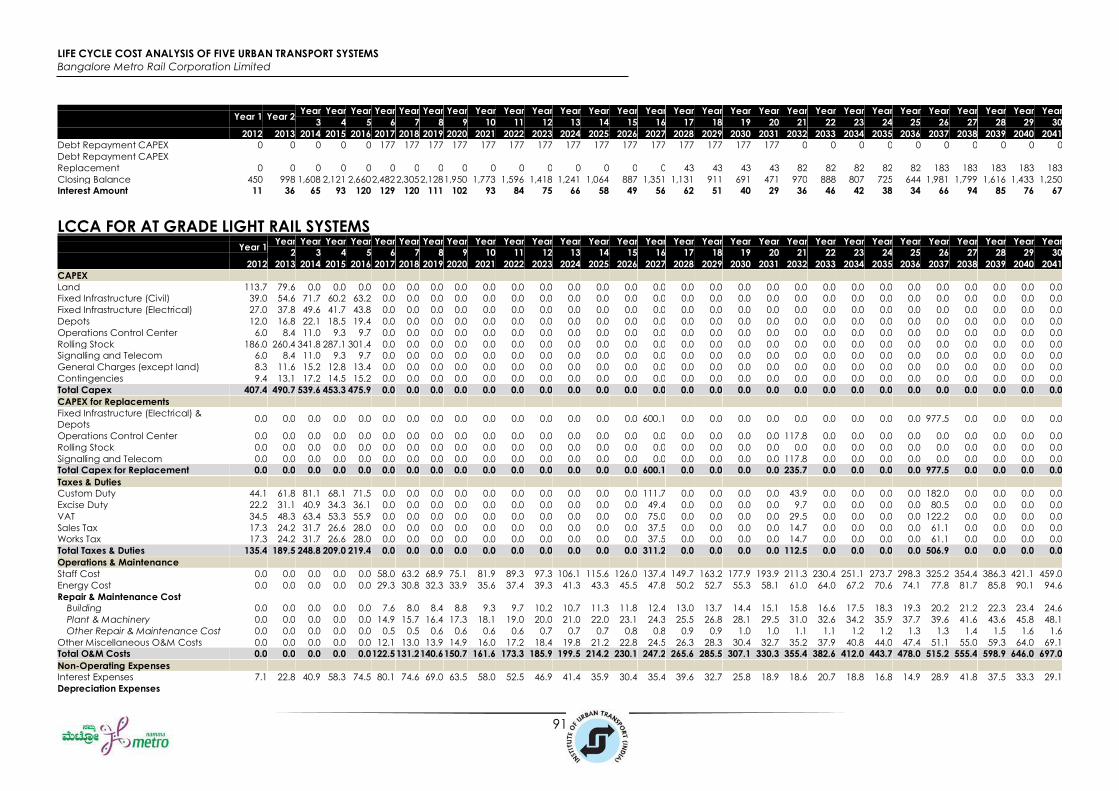
LIFE CYCLE COST ANALYSIS OF FIVE URBAN TRANSPORT SYSTEMS
Bangalore Metro Rail Corporation Limited
91
Year 1 Year 2 Year
3
Year
4
Year
5
Year
6
Year
7
Year
8
Year
9
Year
10
Year
11
Year
12
Year
13
Year
14
Year
15
Year
16
Year
17
Year
18
Year
19
Year
20
Year
21
Year
22
Year
23
Year
24
Year
25
Year
26
Year
27
Year
28
Year
29
Year
30
2012 2013 2014 2015 2016 2017 2018 2019 2020 2021 2022 2023 2024 2025 2026 2027 2028 2029 2030 2031 2032 2033 2034 2035 2036 2037 2038 2039 2040 2041
Debt Repayment CAPEX 0 0 0 0 0 177 177 177 177 177 177 177 177 177 177 177 177 177 177 177 0 0 0 0 0 0 0 0 0 0
Debt Repayment CAPEX
Replacement 0 0 0 0 0 0 0 0 0 0 0 0 0 0 0 0 43 43 43 43 82 82 82 82 82 183 183 183 183 183
Closing Balance 450 998 1,608 2,121 2,660 2,482 2,305 2,128 1,950 1,773 1,596 1,418 1,241 1,064 887 1,351 1,131 911 691 471 970 888 807 725 644 1,981 1,799 1,616 1,433 1,250
Interest Amount 11 36 65 93 120 129 120 111 102 93 84 75 66 58 49 56 62 51 40 29 36 46 42 38 34 66 94 85 76 67
LCCA FOR AT GRADE LIGHT RAIL SYSTEMS Year 1
Year
2
Year
3
Year
4
Year
5
Year
6
Year
7
Year
8
Year
9
Year
10
Year
11
Year
12
Year
13
Year
14
Year
15
Year
16
Year
17
Year
18
Year
19
Year
20
Year
21
Year
22
Year
23
Year
24
Year
25
Year
26
Year
27
Year
28
Year
29
Year
30
2012 2013 2014 2015 2016 2017 2018 2019 2020 2021 2022 2023 2024 2025 2026 2027 2028 2029 2030 2031 2032 2033 2034 2035 2036 2037 2038 2039 2040 2041
CAPEX
Land 113.7 79.6 0.0 0.0 0.0 0.0 0.0 0.0 0.0 0.0 0.0 0.0 0.0 0.0 0.0 0.0 0.0 0.0 0.0 0.0 0.0 0.0 0.0 0.0 0.0 0.0 0.0 0.0 0.0 0.0
Fixed Infrastructure (Civil) 39.0 54.6 71.7 60.2 63.2 0.0 0.0 0.0 0.0 0.0 0.0 0.0 0.0 0.0 0.0 0.0 0.0 0.0 0.0 0.0 0.0 0.0 0.0 0.0 0.0 0.0 0.0 0.0 0.0 0.0
Fixed Infrastructure (Electrical) 27.0 37.8 49.6 41.7 43.8 0.0 0.0 0.0 0.0 0.0 0.0 0.0 0.0 0.0 0.0 0.0 0.0 0.0 0.0 0.0 0.0 0.0 0.0 0.0 0.0 0.0 0.0 0.0 0.0 0.0
Depots 12.0 16.8 22.1 18.5 19.4 0.0 0.0 0.0 0.0 0.0 0.0 0.0 0.0 0.0 0.0 0.0 0.0 0.0 0.0 0.0 0.0 0.0 0.0 0.0 0.0 0.0 0.0 0.0 0.0 0.0
Operations Control Center 6.0 8.4 11.0 9.3 9.7 0.0 0.0 0.0 0.0 0.0 0.0 0.0 0.0 0.0 0.0 0.0 0.0 0.0 0.0 0.0 0.0 0.0 0.0 0.0 0.0 0.0 0.0 0.0 0.0 0.0
Rolling Stock 186.0 260.4 341.8 287.1 301.4 0.0 0.0 0.0 0.0 0.0 0.0 0.0 0.0 0.0 0.0 0.0 0.0 0.0 0.0 0.0 0.0 0.0 0.0 0.0 0.0 0.0 0.0 0.0 0.0 0.0
Signalling and Telecom 6.0 8.4 11.0 9.3 9.7 0.0 0.0 0.0 0.0 0.0 0.0 0.0 0.0 0.0 0.0 0.0 0.0 0.0 0.0 0.0 0.0 0.0 0.0 0.0 0.0 0.0 0.0 0.0 0.0 0.0
General Charges (except land) 8.3 11.6 15.2 12.8 13.4 0.0 0.0 0.0 0.0 0.0 0.0 0.0 0.0 0.0 0.0 0.0 0.0 0.0 0.0 0.0 0.0 0.0 0.0 0.0 0.0 0.0 0.0 0.0 0.0 0.0
Contingencies 9.4 13.1 17.2 14.5 15.2 0.0 0.0 0.0 0.0 0.0 0.0 0.0 0.0 0.0 0.0 0.0 0.0 0.0 0.0 0.0 0.0 0.0 0.0 0.0 0.0 0.0 0.0 0.0 0.0 0.0
Total Capex 407.4 490.7 539.6 453.3 475.9 0.0 0.0 0.0 0.0 0.0 0.0 0.0 0.0 0.0 0.0 0.0 0.0 0.0 0.0 0.0 0.0 0.0 0.0 0.0 0.0 0.0 0.0 0.0 0.0 0.0
CAPEX for Replacements
Fixed Infrastructure (Electrical) &
Depots 0.0 0.0 0.0 0.0 0.0 0.0 0.0 0.0 0.0 0.0 0.0 0.0 0.0 0.0 0.0 600.1 0.0 0.0 0.0 0.0 0.0 0.0 0.0 0.0 0.0 977.5 0.0 0.0 0.0 0.0
Operations Control Center 0.0 0.0 0.0 0.0 0.0 0.0 0.0 0.0 0.0 0.0 0.0 0.0 0.0 0.0 0.0 0.0 0.0 0.0 0.0 0.0 117.8 0.0 0.0 0.0 0.0 0.0 0.0 0.0 0.0 0.0
Rolling Stock 0.0 0.0 0.0 0.0 0.0 0.0 0.0 0.0 0.0 0.0 0.0 0.0 0.0 0.0 0.0 0.0 0.0 0.0 0.0 0.0 0.0 0.0 0.0 0.0 0.0 0.0 0.0 0.0 0.0 0.0
Signalling and Telecom 0.0 0.0 0.0 0.0 0.0 0.0 0.0 0.0 0.0 0.0 0.0 0.0 0.0 0.0 0.0 0.0 0.0 0.0 0.0 0.0 117.8 0.0 0.0 0.0 0.0 0.0 0.0 0.0 0.0 0.0
Total Capex for Replacement 0.0 0.0 0.0 0.0 0.0 0.0 0.0 0.0 0.0 0.0 0.0 0.0 0.0 0.0 0.0 600.1 0.0 0.0 0.0 0.0 235.7 0.0 0.0 0.0 0.0 977.5 0.0 0.0 0.0 0.0
Taxes & Duties
Custom Duty 44.1 61.8 81.1 68.1 71.5 0.0 0.0 0.0 0.0 0.0 0.0 0.0 0.0 0.0 0.0 111.7 0.0 0.0 0.0 0.0 43.9 0.0 0.0 0.0 0.0 182.0 0.0 0.0 0.0 0.0
Excise Duty 22.2 31.1 40.9 34.3 36.1 0.0 0.0 0.0 0.0 0.0 0.0 0.0 0.0 0.0 0.0 49.4 0.0 0.0 0.0 0.0 9.7 0.0 0.0 0.0 0.0 80.5 0.0 0.0 0.0 0.0
VAT 34.5 48.3 63.4 53.3 55.9 0.0 0.0 0.0 0.0 0.0 0.0 0.0 0.0 0.0 0.0 75.0 0.0 0.0 0.0 0.0 29.5 0.0 0.0 0.0 0.0 122.2 0.0 0.0 0.0 0.0
Sales Tax 17.3 24.2 31.7 26.6 28.0 0.0 0.0 0.0 0.0 0.0 0.0 0.0 0.0 0.0 0.0 37.5 0.0 0.0 0.0 0.0 14.7 0.0 0.0 0.0 0.0 61.1 0.0 0.0 0.0 0.0
Works Tax 17.3 24.2 31.7 26.6 28.0 0.0 0.0 0.0 0.0 0.0 0.0 0.0 0.0 0.0 0.0 37.5 0.0 0.0 0.0 0.0 14.7 0.0 0.0 0.0 0.0 61.1 0.0 0.0 0.0 0.0
Total Taxes & Duties 135.4 189.5 248.8 209.0 219.4 0.0 0.0 0.0 0.0 0.0 0.0 0.0 0.0 0.0 0.0 311.2 0.0 0.0 0.0 0.0 112.5 0.0 0.0 0.0 0.0 506.9 0.0 0.0 0.0 0.0
Operations & Maintenance
Staff Cost 0.0 0.0 0.0 0.0 0.0 58.0 63.2 68.9 75.1 81.9 89.3 97.3 106.1 115.6 126.0 137.4 149.7 163.2 177.9 193.9 211.3 230.4 251.1 273.7 298.3 325.2 354.4 386.3 421.1 459.0
Energy Cost 0.0 0.0 0.0 0.0 0.0 29.3 30.8 32.3 33.9 35.6 37.4 39.3 41.3 43.3 45.5 47.8 50.2 52.7 55.3 58.1 61.0 64.0 67.2 70.6 74.1 77.8 81.7 85.8 90.1 94.6
Repair & Maintenance Cost
Building 0.0 0.0 0.0 0.0 0.0 7.6 8.0 8.4 8.8 9.3 9.7 10.2 10.7 11.3 11.8 12.4 13.0 13.7 14.4 15.1 15.8 16.6 17.5 18.3 19.3 20.2 21.2 22.3 23.4 24.6
Plant & Machinery 0.0 0.0 0.0 0.0 0.0 14.9 15.7 16.4 17.3 18.1 19.0 20.0 21.0 22.0 23.1 24.3 25.5 26.8 28.1 29.5 31.0 32.6 34.2 35.9 37.7 39.6 41.6 43.6 45.8 48.1
Other Repair & Maintenance Cost 0.0 0.0 0.0 0.0 0.0 0.5 0.5 0.6 0.6 0.6 0.6 0.7 0.7 0.7 0.8 0.8 0.9 0.9 1.0 1.0 1.1 1.1 1.2 1.2 1.3 1.3 1.4 1.5 1.6 1.6
Other Miscellaneous O&M Costs 0.0 0.0 0.0 0.0 0.0 12.1 13.0 13.9 14.9 16.0 17.2 18.4 19.8 21.2 22.8 24.5 26.3 28.3 30.4 32.7 35.2 37.9 40.8 44.0 47.4 51.1 55.0 59.3 64.0 69.1
Total O&M Costs 0.0 0.0 0.0 0.0 0.0 122.5 131.2 140.6 150.7 161.6 173.3 185.9 199.5 214.2 230.1 247.2 265.6 285.5 307.1 330.3 355.4 382.6 412.0 443.7 478.0 515.2 555.4 598.9 646.0 697.0
Non-Operating Expenses
Interest Expenses 7.1 22.8 40.9 58.3 74.5 80.1 74.6 69.0 63.5 58.0 52.5 46.9 41.4 35.9 30.4 35.4 39.6 32.7 25.8 18.9 18.6 20.7 18.8 16.8 14.9 28.9 41.8 37.5 33.3 29.1
Depreciation Expenses

LIFE CYCLE COST ANALYSIS OF FIVE URBAN TRANSPORT SYSTEMS
Bangalore Metro Rail Corporation Limited
92
Year 1 Year
2
Year
3
Year
4
Year
5
Year
6
Year
7
Year
8
Year
9
Year
10
Year
11
Year
12
Year
13
Year
14
Year
15
Year
16
Year
17
Year
18
Year
19
Year
20
Year
21
Year
22
Year
23
Year
24
Year
25
Year
26
Year
27
Year
28
Year
29
Year
30
2012 2013 2014 2015 2016 2017 2018 2019 2020 2021 2022 2023 2024 2025 2026 2027 2028 2029 2030 2031 2032 2033 2034 2035 2036 2037 2038 2039 2040 2041
Fixed Infrastructure (Civil) 0.0 0.0 0.0 0.0 0.0 5.8 5.8 5.8 5.8 5.8 5.8 5.8 5.8 5.8 5.8 5.8 5.8 5.8 5.8 5.8 5.8 5.8 5.8 5.8 5.8 5.8 5.8 5.8 5.8 5.8
Fixed Infrastructure (Electrical) &
Depots
CAPEX 0.0 0.0 0.0 0.0 0.0 28.9 28.9 28.9 28.9 28.9 28.9 28.9 28.9 28.9 28.9 0.0 0.0 0.0 0.0 0.0 0.0 0.0 0.0 0.0 0.0 0.0 0.0 0.0 0.0 0.0
Replacement 0.0 0.0 0.0 0.0 0.0 0.0 0.0 0.0 0.0 0.0 0.0 0.0 0.0 0.0 0.0 60.0 60.0 60.0 60.0 60.0 60.0 60.0 60.0 60.0 60.0 97.8 97.8 97.8 97.8 97.8
Operations Control Center
CAPEX 0.0 0.0 0.0 0.0 0.0 4.4 4.4 4.4 4.4 4.4 4.4 4.4 4.4 4.4 4.4 0.0 0.0 0.0 0.0 0.0 0.0 0.0 0.0 0.0 0.0 0.0 0.0 0.0 0.0 0.0
Replacement 0.0 0.0 0.0 0.0 0.0 0.0 0.0 0.0 0.0 0.0 0.0 0.0 0.0 0.0 0.0 0.0 0.0 0.0 0.0 0.0 7.9 7.9 7.9 7.9 7.9 7.9 7.9 7.9 7.9 7.9
Rolling Stock
CAPEX 0.0 0.0 0.0 0.0 0.0 55.1 55.1 55.1 55.1 55.1 55.1 55.1 55.1 55.1 55.1 55.1 55.1 55.1 55.1 55.1 55.1 55.1 55.1 55.1 55.1 55.1 55.1 55.1 55.1 55.1
Replacement 0.0 0.0 0.0 0.0 0.0 0.0 0.0 0.0 0.0 0.0 0.0 0.0 0.0 0.0 0.0 0.0 0.0 0.0 0.0 0.0 0.0 0.0 0.0 0.0 0.0 0.0 0.0 0.0 0.0 0.0
Signalling and Telecom
CAPEX 0.0 0.0 0.0 0.0 0.0 3.0 3.0 3.0 3.0 3.0 3.0 3.0 3.0 3.0 3.0 3.0 3.0 3.0 3.0 3.0 0.0 0.0 0.0 0.0 0.0 0.0 0.0 0.0 0.0 0.0
Replacement 0.0 0.0 0.0 0.0 0.0 0.0 0.0 0.0 0.0 0.0 0.0 0.0 0.0 0.0 0.0 0.0 0.0 0.0 0.0 0.0 7.9 7.9 7.9 7.9 7.9 7.9 7.9 7.9 7.9 7.9
Other Miscellaneous 0.0 0.0 0.0 0.0 0.0 2.6 2.6 2.6 2.6 2.6 2.6 2.6 2.6 2.6 2.6 2.6 2.6 2.6 2.6 2.6 2.6 2.6 2.6 2.6 2.6 2.6 2.6 2.6 2.6 2.6
Total Non-Operating Costs 7.1 22.8 40.9 58.3 74.5 80.1 74.6 69.0 63.5 58.0 52.5 46.9 41.4 35.9 30.4 35.4 39.6 32.7 25.8 18.9 18.6 20.7 18.8 16.8 14.9 28.9 41.8 37.5 33.3 29.1
Salvage Value
Land 0.0 0.0 0.0 0.0 0.0 0.0 0.0 0.0 0.0 0.0 0.0 0.0 0.0 0.0 0.0 0.0 0.0 0.0 0.0 0.0 0.0 0.0 0.0 0.0 0.0 0.0 0.0 0.0 0.0 193.3
Fixed Infrastructure (Civil) 0.0 0.0 0.0 0.0 0.0 0.0 0.0 0.0 0.0 0.0 0.0 0.0 0.0 0.0 0.0 0.0 0.0 0.0 0.0 0.0 0.0 0.0 0.0 0.0 0.0 0.0 0.0 0.0 0.0 144.3
Fixed Infrastructure (Electrical) &
Depots 0.0 0.0 0.0 0.0 0.0 0.0 0.0 0.0 0.0 0.0 0.0 0.0 0.0 0.0 0.0 0.0 0.0 0.0 0.0 0.0 0.0 0.0 0.0 0.0 0.0 0.0 0.0 0.0 0.0 488.8
Operations Control Center 0.0 0.0 0.0 0.0 0.0 0.0 0.0 0.0 0.0 0.0 0.0 0.0 0.0 0.0 0.0 0.0 0.0 0.0 0.0 0.0 0.0 0.0 0.0 0.0 0.0 0.0 0.0 0.0 0.0 39.3
Rolling Stock 0.0 0.0 0.0 0.0 0.0 0.0 0.0 0.0 0.0 0.0 0.0 0.0 0.0 0.0 0.0 0.0 0.0 0.0 0.0 0.0 0.0 0.0 0.0 0.0 0.0 0.0 0.0 0.0 0.0 0.0
Signalling and Telecom 0.0 0.0 0.0 0.0 0.0 0.0 0.0 0.0 0.0 0.0 0.0 0.0 0.0 0.0 0.0 0.0 0.0 0.0 0.0 0.0 0.0 0.0 0.0 0.0 0.0 0.0 0.0 0.0 0.0 39.3
Other Miscellaneous 0.0 0.0 0.0 0.0 0.0 0.0 0.0 0.0 0.0 0.0 0.0 0.0 0.0 0.0 0.0 0.0 0.0 0.0 0.0 0.0 0.0 0.0 0.0 0.0 0.0 0.0 0.0 0.0 0.0 65.4
Total Salvage Value 0.0 0.0 0.0 0.0 0.0 0.0 0.0 0.0 0.0 0.0 0.0 0.0 0.0 0.0 0.0 0.0 0.0 0.0 0.0 0.0 0.0 0.0 0.0 0.0 0.0 0.0 0.0 0.0 0.0 970.3
Total Cost 550 703 829 720 770 203 206 210 214 220 226 233 241 250 260 1,194 305 318 333 349 722 403 431 461 493 2,029 597 636 679 -244
Present Value of Costs
Total (in Rs
Crore)
Per Seat (in Rs
Lakh)
Metro Rail Systems 4,578.7 15.3
Debt Repayment Schedule
Opening Balance 0 285 629 1,006 1,324 1,657 1,546 1,436 1,325 1,215 1,105 994 884 773 663 552 862 723 585 447 308 434 395 356 317 278 878 793 708 624
Addition of Debt due to CAPEX 285 344 378 317 333 0 0 0 0 0 0 0 0 0 0 0 0 0 0 0 0 0 0 0 0 0 0 0 0 0
Addition of Debt due to CAPEX
Replacement 0 0 0 0 0 0 0 0 0 0 0 0 0 0 0 420 0 0 0 0 165 0 0 0 0 684 0 0 0 0
Debt Repayment CAPEX 0 0 0 0 0 110 110 110 110 110 110 110 110 110 110 110 110 110 110 110 0 0 0 0 0 0 0 0 0 0
Debt Repayment CAPEX
Replacement 0 0 0 0 0 0 0 0 0 0 0 0 0 0 0 0 28 28 28 28 39 39 39 39 39 85 85 85 85 85
Closing Balance 285 629 1,006 1,324 1,657 1,546 1,436 1,325 1,215 1,105 994 884 773 663 552 862 723 585 447 308 434 395 356 317 278 878 793 708 624 539
Interest Amount 7 23 41 58 75 80 75 69 64 58 52 47 41 36 30 35 40 33 26 19 19 21 19 17 15 29 42 38 33 29

LIFE CYCLE COST ANALYSIS OF FIVE URBAN TRANSPORT SYSTEMS
Bangalore Metro Rail Corporation Limited
93
LCCA FOR BUS RAPID TRANSIT SYSTEMS Year 1
Year
2
Year
3
Year
4
Year
5
Year
6
Year
7
Year
8
Year
9
Year
10
Year
11
Year
12
Year
13
Year
14
Year
15
Year
16
Year
17
Year
18
Year
19
Year
20
Year
21
Year
22
Year
23
Year
24
Year
25
Year
26
Year
27
Year
28
Year
29
Year
30
2012 2013 2014 2015 2016 2017 2018 2019 2020 2021 2022 2023 2024 2025 2026 2027 2028 2029 2030 2031 2032 2033 2034 2035 2036 2037 2038 2039 2040 2041
CAPEX
Land Cost 34.1 23.8 0.0 0.0 0.0 0.0 0.0 0.0 0.0 0.0 0.0 0.0 0.0 0.0 0.0 0.0 0.0 0.0 0.0 0.0 0.0 0.0 0.0 0.0 0.0 0.0 0.0 0.0 0.0 0.0
Roadway Development 51.3 53.9 75.4 0.0 0.0 0.0 0.0 0.0 0.0 0.0 0.0 0.0 0.0 0.0 0.0 0.0 0.0 0.0 0.0 0.0 0.0 0.0 0.0 0.0 0.0 0.0 0.0 0.0 0.0 0.0
Bus Stops 3.2 3.4 4.8 0.0 0.0 0.0 0.0 0.0 0.0 0.0 0.0 0.0 0.0 0.0 0.0 0.0 0.0 0.0 0.0 0.0 0.0 0.0 0.0 0.0 0.0 0.0 0.0 0.0 0.0 0.0
Foot over Bridges 2.0 2.1 3.0 0.0 0.0 0.0 0.0 0.0 0.0 0.0 0.0 0.0 0.0 0.0 0.0 0.0 0.0 0.0 0.0 0.0 0.0 0.0 0.0 0.0 0.0 0.0 0.0 0.0 0.0 0.0
Operational Infrastructure (Terminals &
Depots)
Depots 21.0 22.1 30.9 0.0 0.0 0.0 0.0 0.0 0.0 0.0 0.0 0.0 0.0 0.0 0.0 0.0 0.0 0.0 0.0 0.0 0.0 0.0 0.0 0.0 0.0 0.0 0.0 0.0 0.0 0.0
Workshops and Terminals 6.0 6.3 8.8 0.0 0.0 0.0 0.0 0.0 0.0 0.0 0.0 0.0 0.0 0.0 0.0 0.0 0.0 0.0 0.0 0.0 0.0 0.0 0.0 0.0 0.0 0.0 0.0 0.0 0.0 0.0
Operation Control Center (OCC) 3.0 3.2 4.4 0.0 0.0 0.0 0.0 0.0 0.0 0.0 0.0 0.0 0.0 0.0 0.0 0.0 0.0 0.0 0.0 0.0 0.0 0.0 0.0 0.0 0.0 0.0 0.0 0.0 0.0 0.0
Bridges and Flyovers 190.8 200.3 280.5 0.0 0.0 0.0 0.0 0.0 0.0 0.0 0.0 0.0 0.0 0.0 0.0 0.0 0.0 0.0 0.0 0.0 0.0 0.0 0.0 0.0 0.0 0.0 0.0 0.0 0.0 0.0
ITS application and External Tracking 8.9 9.3 13.0 0.0 0.0 0.0 0.0 0.0 0.0 0.0 0.0 0.0 0.0 0.0 0.0 0.0 0.0 0.0 0.0 0.0 0.0 0.0 0.0 0.0 0.0 0.0 0.0 0.0 0.0 0.0
Bus Cost 44.4 46.6 65.3 0.0 0.0 0.0 0.0 0.0 0.0 0.0 0.0 0.0 0.0 0.0 0.0 0.0 0.0 0.0 0.0 0.0 0.0 0.0 0.0 0.0 0.0 0.0 0.0 0.0 0.0 0.0
General Charges (except land) 9.9 10.4 14.6 0.0 0.0 0.0 0.0 0.0 0.0 0.0 0.0 0.0 0.0 0.0 0.0 0.0 0.0 0.0 0.0 0.0 0.0 0.0 0.0 0.0 0.0 0.0 0.0 0.0 0.0 0.0
Contingencies 10.7 11.3 15.8 0.0 0.0 0.0 0.0 0.0 0.0 0.0 0.0 0.0 0.0 0.0 0.0 0.0 0.0 0.0 0.0 0.0 0.0 0.0 0.0 0.0 0.0 0.0 0.0 0.0 0.0 0.0
Total Capex 385.3 392.7 516.4 0.0 0.0 0.0 0.0 0.0 0.0 0.0 0.0 0.0 0.0 0.0 0.0 0.0 0.0 0.0 0.0 0.0 0.0 0.0 0.0 0.0 0.0 0.0 0.0 0.0 0.0 0.0
CAPEX for Replacements
Roadway Development 0.0 0.0 0.0 0.0 0.0 0.0 0.0 0.0 0.0 0.0 0.0 0.0 0.0 170.3 0.0 0.0 0.0 0.0 0.0 0.0 0.0 0.0 0.0 277.3 0.0 0.0 0.0 0.0 0.0 0.0
Bus Stops 0.0 0.0 0.0 0.0 0.0 0.0 0.0 0.0 0.0 0.0 0.0 0.0 0.0 10.8 0.0 0.0 0.0 0.0 0.0 0.0 0.0 0.0 0.0 17.5 0.0 0.0 0.0 0.0 0.0 0.0
Foot over Bridges 0.0 0.0 0.0 0.0 0.0 0.0 0.0 0.0 0.0 0.0 0.0 0.0 0.0 6.7 0.0 0.0 0.0 0.0 0.0 0.0 0.0 0.0 0.0 10.9 0.0 0.0 0.0 0.0 0.0 0.0
ITS application and External Tracking 0.0 0.0 0.0 0.0 0.0 0.0 0.0 0.0 0.0 0.0 0.0 0.0 0.0 58.7 0.0 0.0 0.0 0.0 0.0 0.0 0.0 0.0 0.0 95.7 0.0 0.0 0.0 0.0 0.0 0.0
Bus Cost 0.0 0.0 0.0 0.0 0.0 0.0 0.0 0.0 0.0 0.0 0.0 0.0 0.0 294.7 0.0 0.0 0.0 0.0 0.0 0.0 0.0 0.0 0.0 480.0 0.0 0.0 0.0 0.0 0.0 0.0
Total Capex for Replacement 0.0 0.0 0.0 0.0 0.0 0.0 0.0 0.0 0.0 0.0 0.0 0.0 0.0 541.2 0.0 0.0 0.0 0.0 0.0 0.0 0.0 0.0 0.0 881.5 0.0 0.0 0.0 0.0 0.0 0.0
Taxes & Duties
Custom Duty 1.6 1.7 2.4 0.0 0.0 0.0 0.0 0.0 0.0 0.0 0.0 0.0 0.0 10.9 0.0 0.0 0.0 0.0 0.0 0.0 0.0 0.0 0.0 17.8 0.0 0.0 0.0 0.0 0.0 0.0
Excise Duty 83.7 87.8 123.0 0.0 0.0 0.0 0.0 0.0 0.0 0.0 0.0 0.0 0.0 125.4 0.0 0.0 0.0 0.0 0.0 0.0 0.0 0.0 0.0 204.3 0.0 0.0 0.0 0.0 0.0 0.0
VAT 41.3 43.4 60.8 0.0 0.0 0.0 0.0 0.0 0.0 0.0 0.0 0.0 0.0 67.6 0.0 0.0 0.0 0.0 0.0 0.0 0.0 0.0 0.0 110.2 0.0 0.0 0.0 0.0 0.0 0.0
Sales Tax 20.7 21.7 30.4 0.0 0.0 0.0 0.0 0.0 0.0 0.0 0.0 0.0 0.0 33.8 0.0 0.0 0.0 0.0 0.0 0.0 0.0 0.0 0.0 55.1 0.0 0.0 0.0 0.0 0.0 0.0
Works Contract Tax 16.9 17.8 24.9 0.0 0.0 0.0 0.0 0.0 0.0 0.0 0.0 0.0 0.0 11.1 0.0 0.0 0.0 0.0 0.0 0.0 0.0 0.0 0.0 18.0 0.0 0.0 0.0 0.0 0.0 0.0
Total Taxes & Duties 164.2 172.5 241.4 0.0 0.0 0.0 0.0 0.0 0.0 0.0 0.0 0.0 0.0 248.9 0.0 0.0 0.0 0.0 0.0 0.0 0.0 0.0 0.0 405.4 0.0 0.0 0.0 0.0 0.0 0.0
Operations & Maintenance
Staff Cost 0.0 0.0 0.0 215.6 235.0 256.2 279.2 304.4 331.8 361.6 394.2 429.6 468.3 510.5 556.4 606.5 661.1 720.6 785.4 856.1 933.1 1,017.
1
1,108.
7
1,208.
4
1,317.
2
1,435.
7
1,565.
0
1,705.
8
1,859.
3
2,026.
7
Energy Cost 0.0 0.0 0.0 44.0 46.2 48.5 50.9 53.5 56.2 59.0 61.9 65.0 68.3 71.7 75.3 79.0 83.0 87.1 91.5 96.1 100.9 105.9 111.2 116.8 122.6 128.7 135.2 141.9 149.0 156.5
Repair & Maintenance Cost
Building 0.0 0.0 0.0 0.7 0.7 0.7 0.8 0.8 0.8 0.9 0.9 1.0 1.0 1.1 1.1 1.2 1.2 1.3 1.4 1.4 1.5 1.6 1.7 1.7 1.8 1.9 2.0 2.1 2.2 2.3
Tyre, tube and spare parts 0.0 0.0 0.0 7.7 8.1 8.5 8.9 9.4 9.9 10.4 10.9 11.4 12.0 12.6 13.2 13.9 14.6 15.3 16.1 16.9 17.7 18.6 19.5 20.5 21.5 22.6 23.7 24.9 26.2 27.5
Other Repair & Maintenance Cost 0.0 0.0 0.0 0.2 0.2 0.2 0.2 0.2 0.2 0.2 0.2 0.3 0.3 0.3 0.3 0.3 0.3 0.3 0.4 0.4 0.4 0.4 0.4 0.5 0.5 0.5 0.5 0.6 0.6 0.6
Other Miscellaneous O&M Costs 0.0 0.0 0.0 29.5 31.9 34.6 37.4 40.5 43.9 47.5 51.5 55.8 60.5 65.6 71.1 77.1 83.6 90.7 98.4 106.8 115.9 125.8 136.6 148.3 161.0 174.8 189.9 206.3 224.1 243.5
Total O&M Costs 0.0 0.0 0.0 297.7 322.1 348.7 377.5 408.8 442.7 479.6 519.6 563.1 610.3 661.6 717.4 778.0 843.8 915.3 993.1 1,077 1,169 1,269 1,378 1,496 1,624 1,764 1,916 2,081 2,261 2,457
Non-Operating Expenses
Interest Expenses 6.7 20.4 36.3 43.0 38.5 34.0 29.4 24.9 20.4 15.9 11.3 6.8 2.3 9.5 18.0 16.1 14.2 12.3 10.4 8.5 6.6 4.7 2.8 15.8 28.1 25.0 21.9 18.9 15.8 12.7
Depreciation Expenses
Roadway Development
CAPEX 0.0 0.0 0.0 3.6 3.6 3.6 3.6 3.6 3.6 3.6 3.6 3.6 3.6 3.6 3.6 3.6 3.6 3.6 3.6 3.6 3.6 3.6 3.6 3.6 3.6 3.6 3.6 3.6 3.6 3.6
Replacement 0.0 0.0 0.0 0.0 0.0 0.0 0.0 0.0 0.0 0.0 0.0 0.0 0.0 8.5 8.5 8.5 8.5 8.5 8.5 8.5 8.5 8.5 8.5 22.4 22.4 22.4 22.4 22.4 22.4 22.4

LIFE CYCLE COST ANALYSIS OF FIVE URBAN TRANSPORT SYSTEMS
Bangalore Metro Rail Corporation Limited
94
Year 1 Year
2
Year
3
Year
4
Year
5
Year
6
Year
7
Year
8
Year
9
Year
10
Year
11
Year
12
Year
13
Year
14
Year
15
Year
16
Year
17
Year
18
Year
19
Year
20
Year
21
Year
22
Year
23
Year
24
Year
25
Year
26
Year
27
Year
28
Year
29
Year
30
2012 2013 2014 2015 2016 2017 2018 2019 2020 2021 2022 2023 2024 2025 2026 2027 2028 2029 2030 2031 2032 2033 2034 2035 2036 2037 2038 2039 2040 2041
Bus Stops & Foot over Bridges
CAPEX 0.0 0.0 0.0 0.9 0.9 0.9 0.9 0.9 0.9 0.9 0.9 0.9 0.9 0.9 0.9 0.9 0.9 0.9 0.9 0.9 0.9 0.9 0.9 0.0 0.0 0.0 0.0 0.0 0.0 0.0
Replacement 0.0 0.0 0.0 0.0 0.0 0.0 0.0 0.0 0.0 0.0 0.0 0.0 0.0 0.9 0.9 0.9 0.9 0.9 0.9 0.9 0.9 0.9 0.9 2.3 2.3 2.3 2.3 2.3 2.3 2.3
Depots, Workshop & Terminal, Bridge
and OCC 0.0 0.0 0.0 15.5 15.5 15.5 15.5 15.5 15.5 15.5 15.5 15.5 15.5 15.5 15.5 15.5 15.5 15.5 15.5 15.5 15.5 15.5 15.5 15.5 15.5 15.5 15.5 15.5 15.5 15.5
ITS application and External Tracking
CAPEX 0.0 0.0 0.0 3.1 3.1 3.1 3.1 3.1 3.1 3.1 3.1 3.1 3.1 0.0 0.0 0.0 0.0 0.0 0.0 0.0 0.0 0.0 0.0 0.0 0.0 0.0 0.0 0.0 0.0 0.0
Replacement 0.0 0.0 0.0 0.0 0.0 0.0 0.0 0.0 0.0 0.0 0.0 0.0 0.0 1.2 1.2 1.2 1.2 1.2 1.2 1.2 1.2 1.2 1.2 3.1 3.1 3.1 3.1 3.1 3.1 3.1
Bus Cost
CAPEX 0.0 0.0 0.0 15.6 15.6 15.6 15.6 15.6 15.6 15.6 15.6 15.6 15.6 0.0 0.0 0.0 0.0 0.0 0.0 0.0 0.0 0.0 0.0 0.0 0.0 0.0 0.0 0.0 0.0 0.0
Replacement 0.0 0.0 0.0 0.0 0.0 0.0 0.0 0.0 0.0 0.0 0.0 0.0 0.0 29.5 29.5 29.5 29.5 29.5 29.5 29.5 29.5 29.5 29.5 48.0 48.0 48.0 48.0 48.0 48.0 48.0
Other Miscellaneous 0.0 0.0 0.0 1.5 1.5 1.5 1.5 1.5 1.5 1.5 1.5 1.5 1.5 1.5 1.5 1.5 1.5 1.5 1.5 1.5 1.5 1.5 1.5 1.5 1.5 1.5 1.5 1.5 1.5 1.5
Total Non-Operating Costs 6.7 20.4 36.3 43.0 38.5 34.0 29.4 24.9 20.4 15.9 11.3 6.8 2.3 9.5 18.0 16.1 14.2 12.3 10.4 8.5 6.6 4.7 2.8 15.8 28.1 25.0 21.9 18.9 15.8 12.7
Salvage Value
Land Cost 0.0 0.0 0.0 0.0 0.0 0.0 0.0 0.0 0.0 0.0 0.0 0.0 0.0 0.0 0.0 0.0 0.0 0.0 0.0 0.0 0.0 0.0 0.0 0.0 0.0 0.0 0.0 0.0 0.0 57.9
Roadway Development 0.0 0.0 0.0 0.0 0.0 0.0 0.0 0.0 0.0 0.0 0.0 0.0 0.0 0.0 0.0 0.0 0.0 0.0 0.0 0.0 0.0 0.0 0.0 0.0 0.0 0.0 0.0 0.0 0.0 288.9
Bus Stops & Foot over Bridges 0.0 0.0 0.0 0.0 0.0 0.0 0.0 0.0 0.0 0.0 0.0 0.0 0.0 0.0 0.0 0.0 0.0 0.0 0.0 0.0 0.0 0.0 0.0 0.0 0.0 0.0 0.0 0.0 0.0 21.1
Depots, Workshop & Terminal, Bridge
and OCC 0.0 0.0 0.0 0.0 0.0 0.0 0.0 0.0 0.0 0.0 0.0 0.0 0.0 0.0 0.0 0.0 0.0 0.0 0.0 0.0 0.0 0.0 0.0 0.0 0.0 0.0 0.0 0.0 0.0 357.5
ITS application and External Tracking 0.0 0.0 0.0 0.0 0.0 0.0 0.0 0.0 0.0 0.0 0.0 0.0 0.0 0.0 0.0 0.0 0.0 0.0 0.0 0.0 0.0 0.0 0.0 0.0 0.0 0.0 0.0 0.0 0.0 121.1
Bus Cost 0.0 0.0 0.0 0.0 0.0 0.0 0.0 0.0 0.0 0.0 0.0 0.0 0.0 0.0 0.0 0.0 0.0 0.0 0.0 0.0 0.0 0.0 0.0 0.0 0.0 0.0 0.0 0.0 0.0 144.0
Other Miscellaneous 0.0 0.0 0.0 0.0 0.0 0.0 0.0 0.0 0.0 0.0 0.0 0.0 0.0 0.0 0.0 0.0 0.0 0.0 0.0 0.0 0.0 0.0 0.0 0.0 0.0 0.0 0.0 0.0 0.0 33.4
Total Salvage Value 0.0 0.0 0.0 0.0 0.0 0.0 0.0 0.0 0.0 0.0 0.0 0.0 0.0 0.0 0.0 0.0 0.0 0.0 0.0 0.0 0.0 0.0 0.0 0.0 0.0 0.0 0.0 0.0 0.0 1,023
Total Cost 556 585 794 341 361 383 407 434 463 495 531 570 613 1,461 735 794 858 928 1,004 1,086 1,176 1,274 1,381 2,799 1,653 1,789 1,938 2,100 2,277 1,446
Present Value of Costs
Total (in Rs
Crore)
Per Seat (in Rs
Lakh)
Metro Rail Systems 6,574.7 22.2
Debt Repayment Schedule
Opening Balance 0.0 269.7 544.6 906.0 815.4 724.8 634.2 543.6 453.0 362.4 271.8 181.2 90.6 0.0 378.8 340.9 303.1 265.2 227.3 189.4 151.5 113.6 75.8 37.9 593.2 531.5 469.8 408.1 346.4 284.7
Addition of Debt due to CAPEX 269.7 274.9 361.4 0.0 0.0 0.0 0.0 0.0 0.0 0.0 0.0 0.0 0.0 0.0 0.0 0.0 0.0 0.0 0.0 0.0 0.0 0.0 0.0 0.0 0.0 0.0 0.0 0.0 0.0 0.0
Addition of Debt due to CAPEX
Replacement 0.0 0.0 0.0 0.0 0.0 0.0 0.0 0.0 0.0 0.0 0.0 0.0 0.0 378.8 0.0 0.0 0.0 0.0 0.0 0.0 0.0 0.0 0.0 617.1 0.0 0.0 0.0 0.0 0.0 0.0
Debt Repayment CAPEX 0.0 0.0 0.0 90.6 90.6 90.6 90.6 90.6 90.6 90.6 90.6 90.6 90.6 0.0 0.0 0.0 0.0 0.0 0.0 0.0 0.0 0.0 0.0 0.0 0.0 0.0 0.0 0.0 0.0 0.0
Debt Repayment CAPEX Replacement 0.0 0.0 0.0 0.0 0.0 0.0 0.0 0.0 0.0 0.0 0.0 0.0 0.0 0.0 37.9 37.9 37.9 37.9 37.9 37.9 37.9 37.9 37.9 61.7 61.7 61.7 61.7 61.7 61.7 61.7
Closing Balance 269.7 544.6 906.0 815.4 724.8 634.2 543.6 453.0 362.4 271.8 181.2 90.6 0.0 378.8 340.9 303.1 265.2 227.3 189.4 151.5 113.6 75.8 37.9 593.2 531.5 469.8 408.1 346.4 284.7 223.0
Interest Amount 6.7 20.4 36.3 43.0 38.5 34.0 29.4 24.9 20.4 15.9 11.3 6.8 2.3 9.5 18.0 16.1 14.2 12.3 10.4 8.5 6.6 4.7 2.8 15.8 28.1 25.0 21.9 18.9 15.8 12.7

LIFE CYCLE COST ANALYSIS OF FIVE URBAN TRANSPORT SYSTEMS
Bangalore Metro Rail Corporation Limited
95
LCCA FOR ORDINARY BUS SYSTEMS Year 1
Year
2
Year
3
Year
4
Year
5
Year
6
Year
7
Year
8
Year
9
Year
10
Year
11
Year
12
Year
13
Year
14
Year
15
Year
16
Year
17
Year
18
Year
19
Year
20
Year
21
Year
22
Year
23
Year
24
Year
25
Year
26
Year
27
Year
28
Year
29
Year
30
2012 2013 2014 2015 2016 2017 2018 2019 2020 2021 2022 2023 2024 2025 2026 2027 2028 2029 2030 2031 2032 2033 2034 2035 2036 2037 2038 2039 2040 2041
CAPEX
Land Cost 9.8 6.9 0.0 0.0 0.0 0.0 0.0 0.0 0.0 0.0 0.0 0.0 0.0 0.0 0.0 0.0 0.0 0.0 0.0 0.0 0.0 0.0 0.0 0.0 0.0 0.0 0.0 0.0 0.0 0.0
Roadway Development 0.0 0.0 0.0 0.0 0.0 0.0 0.0 0.0 0.0 0.0 0.0 0.0 0.0 0.0 0.0 0.0 0.0 0.0 0.0 0.0 0.0 0.0 0.0 0.0 0.0 0.0 0.0 0.0 0.0 0.0
Bus Stops 3.6 3.8 5.3 0.0 0.0 0.0 0.0 0.0 0.0 0.0 0.0 0.0 0.0 0.0 0.0 0.0 0.0 0.0 0.0 0.0 0.0 0.0 0.0 0.0 0.0 0.0 0.0 0.0 0.0 0.0
Foot over Bridges 0.0 0.0 0.0 0.0 0.0 0.0 0.0 0.0 0.0 0.0 0.0 0.0 0.0 0.0 0.0 0.0 0.0 0.0 0.0 0.0 0.0 0.0 0.0 0.0 0.0 0.0 0.0 0.0 0.0 0.0
Operational Infrastructure (Terminals &
Depots)
Depots 24.0 25.2 35.3 0.0 0.0 0.0 0.0 0.0 0.0 0.0 0.0 0.0 0.0 0.0 0.0 0.0 0.0 0.0 0.0 0.0 0.0 0.0 0.0 0.0 0.0 0.0 0.0 0.0 0.0 0.0
Workshops and Terminals 15.0 15.8 22.1 0.0 0.0 0.0 0.0 0.0 0.0 0.0 0.0 0.0 0.0 0.0 0.0 0.0 0.0 0.0 0.0 0.0 0.0 0.0 0.0 0.0 0.0 0.0 0.0 0.0 0.0 0.0
Operation Control Center (OCC) 0.0 0.0 0.0 0.0 0.0 0.0 0.0 0.0 0.0 0.0 0.0 0.0 0.0 0.0 0.0 0.0 0.0 0.0 0.0 0.0 0.0 0.0 0.0 0.0 0.0 0.0 0.0 0.0 0.0 0.0
Bridges and Flyovers 0.0 0.0 0.0 0.0 0.0 0.0 0.0 0.0 0.0 0.0 0.0 0.0 0.0 0.0 0.0 0.0 0.0 0.0 0.0 0.0 0.0 0.0 0.0 0.0 0.0 0.0 0.0 0.0 0.0 0.0
ITS application and External Tracking 3.0 3.2 4.4 0.0 0.0 0.0 0.0 0.0 0.0 0.0 0.0 0.0 0.0 0.0 0.0 0.0 0.0 0.0 0.0 0.0 0.0 0.0 0.0 0.0 0.0 0.0 0.0 0.0 0.0 0.0
Bus Cost 49.6 52.0 72.9 0.0 0.0 0.0 0.0 0.0 0.0 0.0 0.0 0.0 0.0 0.0 0.0 0.0 0.0 0.0 0.0 0.0 0.0 0.0 0.0 0.0 0.0 0.0 0.0 0.0 0.0 0.0
General Charges (except land) 2.9 3.0 4.2 0.0 0.0 0.0 0.0 0.0 0.0 0.0 0.0 0.0 0.0 0.0 0.0 0.0 0.0 0.0 0.0 0.0 0.0 0.0 0.0 0.0 0.0 0.0 0.0 0.0 0.0 0.0
Contingencies 3.1 3.2 4.5 0.0 0.0 0.0 0.0 0.0 0.0 0.0 0.0 0.0 0.0 0.0 0.0 0.0 0.0 0.0 0.0 0.0 0.0 0.0 0.0 0.0 0.0 0.0 0.0 0.0 0.0 0.0
Total Capex 110.9 113.0 148.6 0.0 0.0 0.0 0.0 0.0 0.0 0.0 0.0 0.0 0.0 0.0 0.0 0.0 0.0 0.0 0.0 0.0 0.0 0.0 0.0 0.0 0.0 0.0 0.0 0.0 0.0 0.0
CAPEX for Replacements
Roadway Development 0.0 0.0 0.0 0.0 0.0 0.0 0.0 0.0 0.0 0.0 0.0 0.0 0.0 0.0 0.0 0.0 0.0 0.0 0.0 0.0 0.0 0.0 0.0 0.0 0.0 0.0 0.0 0.0 0.0 0.0
Bus Stops 0.0 0.0 0.0 0.0 0.0 0.0 0.0 0.0 0.0 0.0 0.0 0.0 0.0 11.9 0.0 0.0 0.0 0.0 0.0 0.0 0.0 0.0 0.0 19.5 0.0 0.0 0.0 0.0 0.0 0.0
Foot over Bridges 0.0 0.0 0.0 0.0 0.0 0.0 0.0 0.0 0.0 0.0 0.0 0.0 0.0 0.0 0.0 0.0 0.0 0.0 0.0 0.0 0.0 0.0 0.0 0.0 0.0 0.0 0.0 0.0 0.0 0.0
ITS application and External Tracking 0.0 0.0 0.0 0.0 0.0 0.0 0.0 0.0 0.0 0.0 0.0 0.0 0.0 19.9 0.0 0.0 0.0 0.0 0.0 0.0 0.0 0.0 0.0 32.4 0.0 0.0 0.0 0.0 0.0 0.0
Bus Cost 0.0 0.0 0.0 0.0 0.0 0.0 0.0 0.0 0.0 0.0 0.0 0.0 0.0 329.0 0.0 0.0 0.0 0.0 0.0 0.0 0.0 0.0 0.0 535.8 0.0 0.0 0.0 0.0 0.0 0.0
Total Capex for Replacement 0.0 0.0 0.0 0.0 0.0 0.0 0.0 0.0 0.0 0.0 0.0 0.0 0.0 360.8 0.0 0.0 0.0 0.0 0.0 0.0 0.0 0.0 0.0 587.7 0.0 0.0 0.0 0.0 0.0 0.0
Taxes & Duties
Custom Duty 0.6 0.6 0.8 0.0 0.0 0.0 0.0 0.0 0.0 0.0 0.0 0.0 0.0 3.7 0.0 0.0 0.0 0.0 0.0 0.0 0.0 0.0 0.0 6.0 0.0 0.0 0.0 0.0 0.0 0.0
Excise Duty 24.0 25.2 35.2 0.0 0.0 0.0 0.0 0.0 0.0 0.0 0.0 0.0 0.0 88.6 0.0 0.0 0.0 0.0 0.0 0.0 0.0 0.0 0.0 144.4 0.0 0.0 0.0 0.0 0.0 0.0
VAT 11.9 12.5 17.5 0.0 0.0 0.0 0.0 0.0 0.0 0.0 0.0 0.0 0.0 45.1 0.0 0.0 0.0 0.0 0.0 0.0 0.0 0.0 0.0 73.5 0.0 0.0 0.0 0.0 0.0 0.0
Sales Tax 5.9 6.2 8.7 0.0 0.0 0.0 0.0 0.0 0.0 0.0 0.0 0.0 0.0 22.6 0.0 0.0 0.0 0.0 0.0 0.0 0.0 0.0 0.0 36.7 0.0 0.0 0.0 0.0 0.0 0.0
Works Contract Tax 2.4 2.6 3.6 0.0 0.0 0.0 0.0 0.0 0.0 0.0 0.0 0.0 0.0 0.0 0.0 0.0 0.0 0.0 0.0 0.0 0.0 0.0 0.0 0.0 0.0 0.0 0.0 0.0 0.0 0.0
Total Taxes & Duties 44.8 47.0 65.9 0.0 0.0 0.0 0.0 0.0 0.0 0.0 0.0 0.0 0.0 160.0 0.0 0.0 0.0 0.0 0.0 0.0 0.0 0.0 0.0 260.6 0.0 0.0 0.0 0.0 0.0 0.0
Operations & Maintenance
Staff Cost 0.0 0.0 0.0 240.7 262.3 286.0 311.7 339.7 370.3 403.6 440.0 479.6 522.7 569.8 621.1 677.0 737.9 804.3 876.7 955.6 1,041 1,135 1,237 1,348 1,470 1,602 1,746 1,904 2,075 2,262
Energy Cost 0.0 0.0 0.0 44.0 46.2 48.5 50.9 53.5 56.2 59.0 61.9 65.0 68.3 71.7 75.3 79.0 83.0 87.1 91.5 96.1 100.9 105.9 111.2 116.8 122.6 128.7 135.2 141.9 149.0 156.5
Repair & Maintenance Cost
Building 0.0 0.0 0.0 1.0 1.0 1.1 1.1 1.2 1.2 1.3 1.4 1.4 1.5 1.6 1.7 1.7 1.8 1.9 2.0 2.1 2.2 2.3 2.5 2.6 2.7 2.8 3.0 3.1 3.3 3.5
Tyre, tube and spare parts 0.0 0.0 0.0 7.7 8.1 8.5 8.9 9.4 9.9 10.4 10.9 11.4 12.0 12.6 13.2 13.9 14.6 15.3 16.1 16.9 17.7 18.6 19.5 20.5 21.5 22.6 23.7 24.9 26.2 27.5
Other Repair & Maintenance Cost 0.0 0.0 0.0 0.2 0.2 0.2 0.2 0.2 0.2 0.2 0.3 0.3 0.3 0.3 0.3 0.3 0.3 0.4 0.4 0.4 0.4 0.4 0.5 0.5 0.5 0.5 0.6 0.6 0.6 0.6
Other Miscellaneous O&M Costs 0.0 0.0 0.0 32.3 35.0 37.9 41.0 44.4 48.2 52.2 56.6 61.3 66.5 72.2 78.3 84.9 92.1 100.0 108.5 117.8 127.9 138.9 150.8 163.8 177.9 193.3 210.0 228.2 248.0 269.5
Total O&M Costs 0 0 0 326 353 382 414 448 486 527 571 619 671 728 790 857 930 1,009 1,095 1,189 1,291 1,401 1,522 1,653 1,796 1,951 2,119 2,303 2,502 2,720
Non Operating Expenses
Interest Expenses 1.9 5.9 10.4 12.4 11.1 9.8 8.5 7.2 5.9 4.6 3.3 2.0 0.7 6.3 12.0 10.7 9.5 8.2 6.9 5.7 4.4 3.2 1.9 10.5 18.7 16.7 14.6 12.6 10.5 8.5
Depreciation Expenses
Roadway Development
CAPEX 0.0 0.0 0.0 0.0 0.0 0.0 0.0 0.0 0.0 0.0 0.0 0.0 0.0 0.0 0.0 0.0 0.0 0.0 0.0 0.0 0.0 0.0 0.0 0.0 0.0 0.0 0.0 0.0 0.0 0.0
Replacement 0.0 0.0 0.0 0.0 0.0 0.0 0.0 0.0 0.0 0.0 0.0 0.0 0.0 0.0 0.0 0.0 0.0 0.0 0.0 0.0 0.0 0.0 0.0 0.0 0.0 0.0 0.0 0.0 0.0 0.0
Bus Stops & Foot over Bridges

LIFE CYCLE COST ANALYSIS OF FIVE URBAN TRANSPORT SYSTEMS
Bangalore Metro Rail Corporation Limited
96
Year 1 Year
2
Year
3
Year
4
Year
5
Year
6
Year
7
Year
8
Year
9
Year
10
Year
11
Year
12
Year
13
Year
14
Year
15
Year
16
Year
17
Year
18
Year
19
Year
20
Year
21
Year
22
Year
23
Year
24
Year
25
Year
26
Year
27
Year
28
Year
29
Year
30
2012 2013 2014 2015 2016 2017 2018 2019 2020 2021 2022 2023 2024 2025 2026 2027 2028 2029 2030 2031 2032 2033 2034 2035 2036 2037 2038 2039 2040 2041
CAPEX 0.0 0.0 0.0 0.6 0.6 0.6 0.6 0.6 0.6 0.6 0.6 0.6 0.6 0.6 0.6 0.6 0.6 0.6 0.6 0.6 0.6 0.6 0.6 0.0 0.0 0.0 0.0 0.0 0.0 0.0
Replacement 0.0 0.0 0.0 0.0 0.0 0.0 0.0 0.0 0.0 0.0 0.0 0.0 0.0 0.6 0.6 0.6 0.6 0.6 0.6 0.6 0.6 0.6 0.6 1.6 1.6 1.6 1.6 1.6 1.6 1.6
Depots, Workshop & Terminal, Bridge
and OCC 0.0 0.0 0.0 2.7 2.7 2.7 2.7 2.7 2.7 2.7 2.7 2.7 2.7 2.7 2.7 2.7 2.7 2.7 2.7 2.7 2.7 2.7 2.7 2.7 2.7 2.7 2.7 2.7 2.7 2.7
ITS application and External Tracking
CAPEX 0.0 0.0 0.0 1.1 1.1 1.1 1.1 1.1 1.1 1.1 1.1 1.1 1.1 0.0 0.0 0.0 0.0 0.0 0.0 0.0 0.0 0.0 0.0 0.0 0.0 0.0 0.0 0.0 0.0 0.0
Replacement 0.0 0.0 0.0 0.0 0.0 0.0 0.0 0.0 0.0 0.0 0.0 0.0 0.0 0.4 0.4 0.4 0.4 0.4 0.4 0.4 0.4 0.4 0.4 1.0 1.0 1.0 1.0 1.0 1.0 1.0
Bus Cost
CAPEX 0.0 0.0 0.0 17.4 17.4 17.4 17.4 17.4 17.4 17.4 17.4 17.4 17.4 0.0 0.0 0.0 0.0 0.0 0.0 0.0 0.0 0.0 0.0 0.0 0.0 0.0 0.0 0.0 0.0 0.0
Replacement 0.0 0.0 0.0 0.0 0.0 0.0 0.0 0.0 0.0 0.0 0.0 0.0 0.0 32.9 32.9 32.9 32.9 32.9 32.9 32.9 32.9 32.9 32.9 53.6 53.6 53.6 53.6 53.6 53.6 53.6
Other Miscellaneous 0.0 0.0 0.0 0.4 0.4 0.4 0.4 0.4 0.4 0.4 0.4 0.4 0.4 0.4 0.4 0.4 0.4 0.4 0.4 0.4 0.4 0.4 0.4 0.4 0.4 0.4 0.4 0.4 0.4 0.4
Total Non Operating Costs 1.9 5.9 10.4 12.4 11.1 9.8 8.5 7.2 5.9 4.6 3.3 2.0 0.7 6.3 12.0 10.7 9.5 8.2 6.9 5.7 4.4 3.2 1.9 10.5 18.7 16.7 14.6 12.6 10.5 8.5
Salvage Value
Land Cost 0.0 0.0 0.0 0.0 0.0 0.0 0.0 0.0 0.0 0.0 0.0 0.0 0.0 0.0 0.0 0.0 0.0 0.0 0.0 0.0 0.0 0.0 0.0 0.0 0.0 0.0 0.0 0.0 0.0 16.7
Roadway Development 0.0 0.0 0.0 0.0 0.0 0.0 0.0 0.0 0.0 0.0 0.0 0.0 0.0 0.0 0.0 0.0 0.0 0.0 0.0 0.0 0.0 0.0 0.0 0.0 0.0 0.0 0.0 0.0 0.0 0.0
Bus Stops & Foot over Bridges 0.0 0.0 0.0 0.0 0.0 0.0 0.0 0.0 0.0 0.0 0.0 0.0 0.0 0.0 0.0 0.0 0.0 0.0 0.0 0.0 0.0 0.0 0.0 0.0 0.0 0.0 0.0 0.0 0.0 14.4
Depots, Workshop & Terminal, Bridge
and OCC 0.0 0.0 0.0 0.0 0.0 0.0 0.0 0.0 0.0 0.0 0.0 0.0 0.0 0.0 0.0 0.0 0.0 0.0 0.0 0.0 0.0 0.0 0.0 0.0 0.0 0.0 0.0 0.0 0.0 63.1
ITS application and External Tracking 0.0 0.0 0.0 0.0 0.0 0.0 0.0 0.0 0.0 0.0 0.0 0.0 0.0 0.0 0.0 0.0 0.0 0.0 0.0 0.0 0.0 0.0 0.0 0.0 0.0 0.0 0.0 0.0 0.0 41.0
Bus Cost 0.0 0.0 0.0 0.0 0.0 0.0 0.0 0.0 0.0 0.0 0.0 0.0 0.0 0.0 0.0 0.0 0.0 0.0 0.0 0.0 0.0 0.0 0.0 0.0 0.0 0.0 0.0 0.0 0.0 160.7
Other Miscellaneous 0.0 0.0 0.0 0.0 0.0 0.0 0.0 0.0 0.0 0.0 0.0 0.0 0.0 0.0 0.0 0.0 0.0 0.0 0.0 0.0 0.0 0.0 0.0 0.0 0.0 0.0 0.0 0.0 0.0 9.6
Total Salvage Value 0.0 0.0 0.0 0.0 0.0 0.0 0.0 0.0 0.0 0.0 0.0 0.0 0.0 0.0 0.0 0.0 0.0 0.0 0.0 0.0 0.0 0.0 0.0 0.0 0.0 0.0 0.0 0.0 0.0 305.7
Total Cost 158 166 225 338 364 392 422 456 492 531 574 621 672 1,255 802 868 939 1,017 1,102 1,195 1,295 1,405 1,524 2,512 1,814 1,967 2,134 2,315 2,513 2,423
Present Value of Costs
Total (in Rs
Crore)
Per Seat (in Rs
Lakh)
Metro Rail Systems 5,727.8 17.3
Debt Repayment Schedule
Opening Balance 0 78 157 261 235 209 183 156 130 104 78 52 26 0 253 227 202 177 152 126 101 76 51 25 396 354 313 272 231 190
Addition of Debt due to CAPEX 78 79 104 0 0 0 0 0 0 0 0 0 0 0 0 0 0 0 0 0 0 0 0 0 0 0 0 0 0 0
Addition of Debt due to CAPEX
Replacement 0 0 0 0 0 0 0 0 0 0 0 0 0 253 0 0 0 0 0 0 0 0 0 411 0 0 0 0 0 0
Debt Repayment CAPEX 0 0 0 26 26 26 26 26 26 26 26 26 26 0 0 0 0 0 0 0 0 0 0 0 0 0 0 0 0 0
Debt Repayment CAPEX Replacement 0 0 0 0 0 0 0 0 0 0 0 0 0 0 25 25 25 25 25 25 25 25 25 41 41 41 41 41 41 41
Closing Balance 78 157 261 235 209 183 156 130 104 78 52 26 0 253 227 202 177 152 126 101 76 51 25 396 354 313 272 231 190 149
Interest Amount 2 6 10 12 11 10 8 7 6 5 3 2 1 6 12 11 9 8 7 6 4 3 2 11 19 17 15 13 11 8