life cycle assessment of wool
TRANSCRIPT
NATIONAL INSTITUTE OF FASHION TECHNOLOGY,
GANDHINAGAR
Sustainable Production (SP) Assignment -2
A REPORT ON LIFE CYCLE ASSESSMENT OF WOOL AND
WOOLPRODUCTS
Submitted to: Aarti Solanki Mam SubmittedBy:
Rangnath Raman Ravish Khan
DFT-VI
Contents Life Cycle Assessments ............................................................................................................................ 3
Components of LCA............................................................................................................................. 3
Life Cycle Assessment of Wool ............................................................................................................... 4
Wool supply chains: ............................................................................................................................ 4
The Manufacturing Process of yarn ........................................................................................................ 5
The Wool Fiber .................................................................................................................................... 5
SHEARING ............................................................................................................................................ 5
GRADING AND SORTING ..................................................................................................................... 5
CLEANING AND SCOURING ................................................................................................................. 6
CARDING ............................................................................................................................................. 6
Wool production ..................................................................................................................................... 6
Wool Suppliers and Trends in Production .......................................................................................... 7
Products and Product Diversity .......................................................................................................... 9
Energy Use ............................................................................................................................................ 10
Fertiliser, agrichemicals and purchased feed ................................................................................... 10
Energy used in the Wool Processing ................................................................................................. 11
Energy used in the Life Cycle of wool ............................................................................................... 11
Diesel, petrol and electricity ............................................................................................................. 12
Land Use ............................................................................................................................................ 12
Other Textile Total Energy Use ......................................................................................................... 12
Use phase of wool textile and garment ................................................................................................ 13
End of life .............................................................................................................................................. 14
Reuse and Recycling Phase ................................................................................................................... 14
Environmental Hazards of Wool ........................................................................................................... 15
Climate Change ................................................................................................................................. 16
Water Pollution ................................................................................................................................. 16
Land Damage .................................................................................................................................... 17
Comparing environmental impacts of different textile products ..................................................... 17
Conclusions and Recommendations ..................................................................................................... 18
Recommendations ............................................................................................................................ 18
REFERENCES .......................................................................................................................................... 20
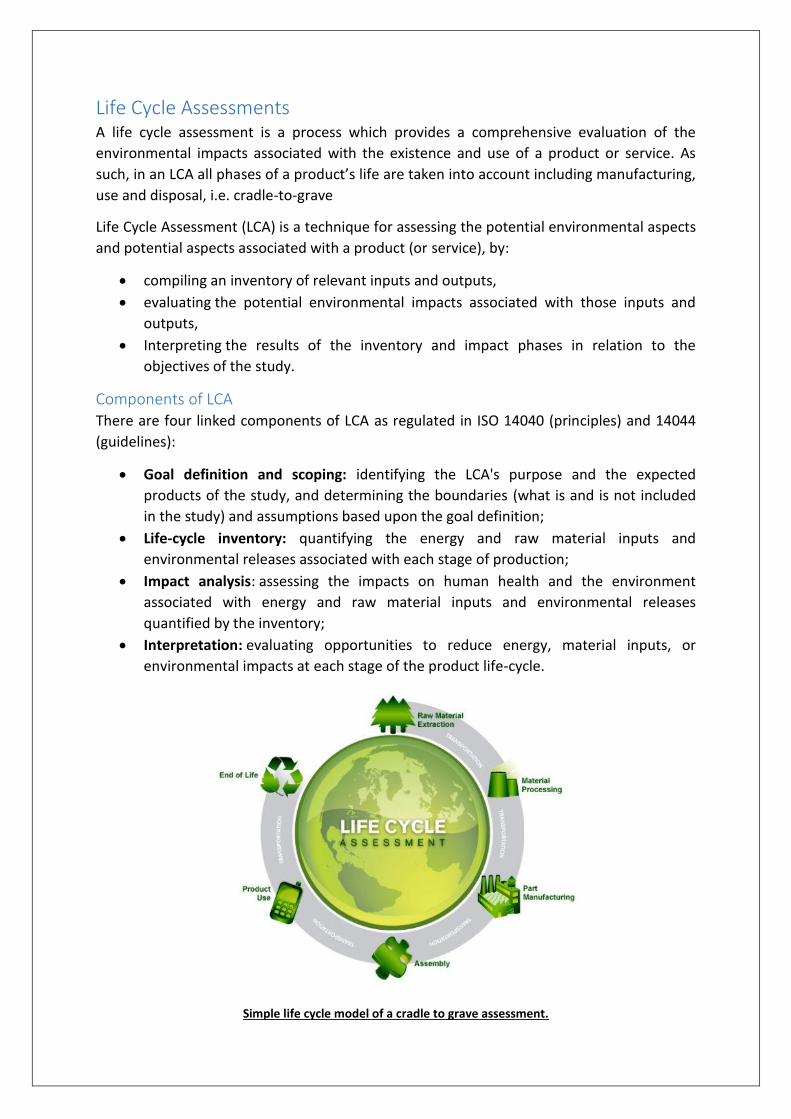
Life Cycle Assessments A life cycle assessment is a process which provides a comprehensive evaluation of the
environmental impacts associated with the existence and use of a product or service. As
such, in an LCA all phases of a product’s life are taken into account including manufacturing,
use and disposal, i.e. cradle-to-grave
Life Cycle Assessment (LCA) is a technique for assessing the potential environmental aspects
and potential aspects associated with a product (or service), by:
compiling an inventory of relevant inputs and outputs,
evaluating the potential environmental impacts associated with those inputs and
outputs,
Interpreting the results of the inventory and impact phases in relation to the
objectives of the study.
Components of LCA There are four linked components of LCA as regulated in ISO 14040 (principles) and 14044
(guidelines):
Goal definition and scoping: identifying the LCA's purpose and the expected
products of the study, and determining the boundaries (what is and is not included
in the study) and assumptions based upon the goal definition;
Life-cycle inventory: quantifying the energy and raw material inputs and
environmental releases associated with each stage of production;
Impact analysis: assessing the impacts on human health and the environment
associated with energy and raw material inputs and environmental releases
quantified by the inventory;
Interpretation: evaluating opportunities to reduce energy, material inputs, or
environmental impacts at each stage of the product life-cycle.
Simple life cycle model of a cradle to grave assessment.
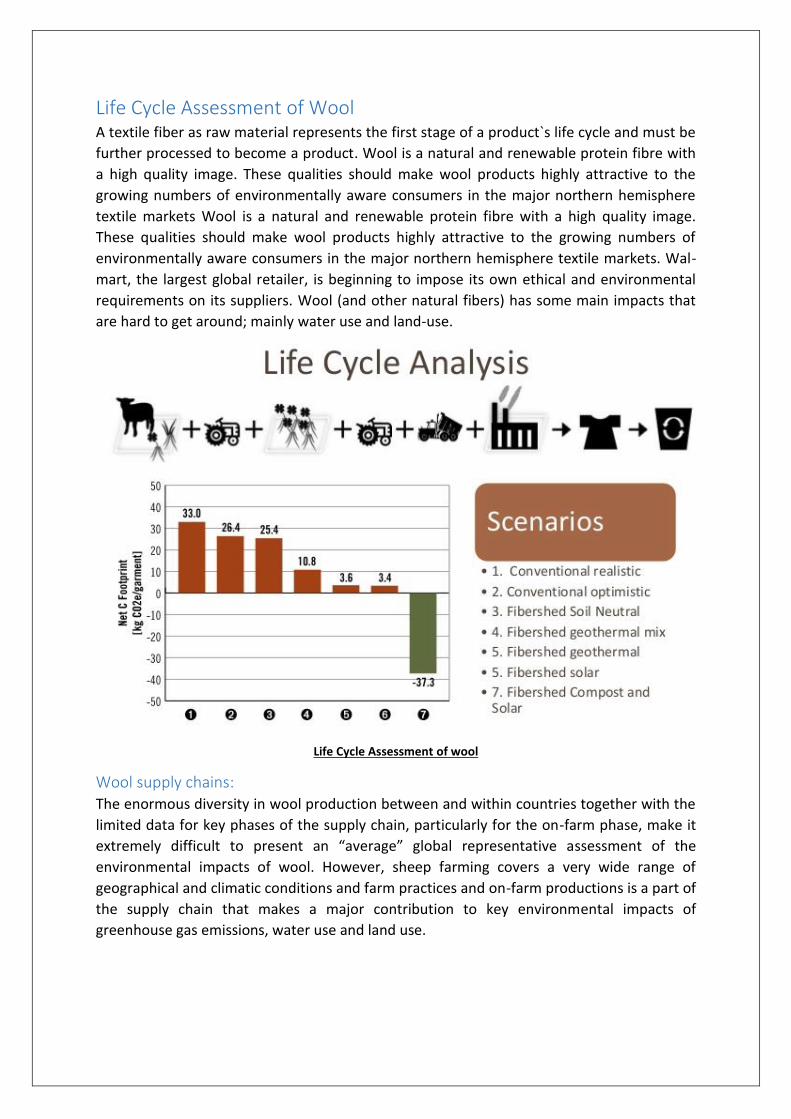
Life Cycle Assessment of Wool A textile fiber as raw material represents the first stage of a product`s life cycle and must be
further processed to become a product. Wool is a natural and renewable protein fibre with
a high quality image. These qualities should make wool products highly attractive to the
growing numbers of environmentally aware consumers in the major northern hemisphere
textile markets Wool is a natural and renewable protein fibre with a high quality image.
These qualities should make wool products highly attractive to the growing numbers of
environmentally aware consumers in the major northern hemisphere textile markets. Wal-
mart, the largest global retailer, is beginning to impose its own ethical and environmental
requirements on its suppliers. Wool (and other natural fibers) has some main impacts that
are hard to get around; mainly water use and land-use.
Life Cycle Assessment of wool
Wool supply chains: The enormous diversity in wool production between and within countries together with the
limited data for key phases of the supply chain, particularly for the on-farm phase, make it
extremely difficult to present an “average” global representative assessment of the
environmental impacts of wool. However, sheep farming covers a very wide range of
geographical and climatic conditions and farm practices and on-farm productions is a part of
the supply chain that makes a major contribution to key environmental impacts of
greenhouse gas emissions, water use and land use.
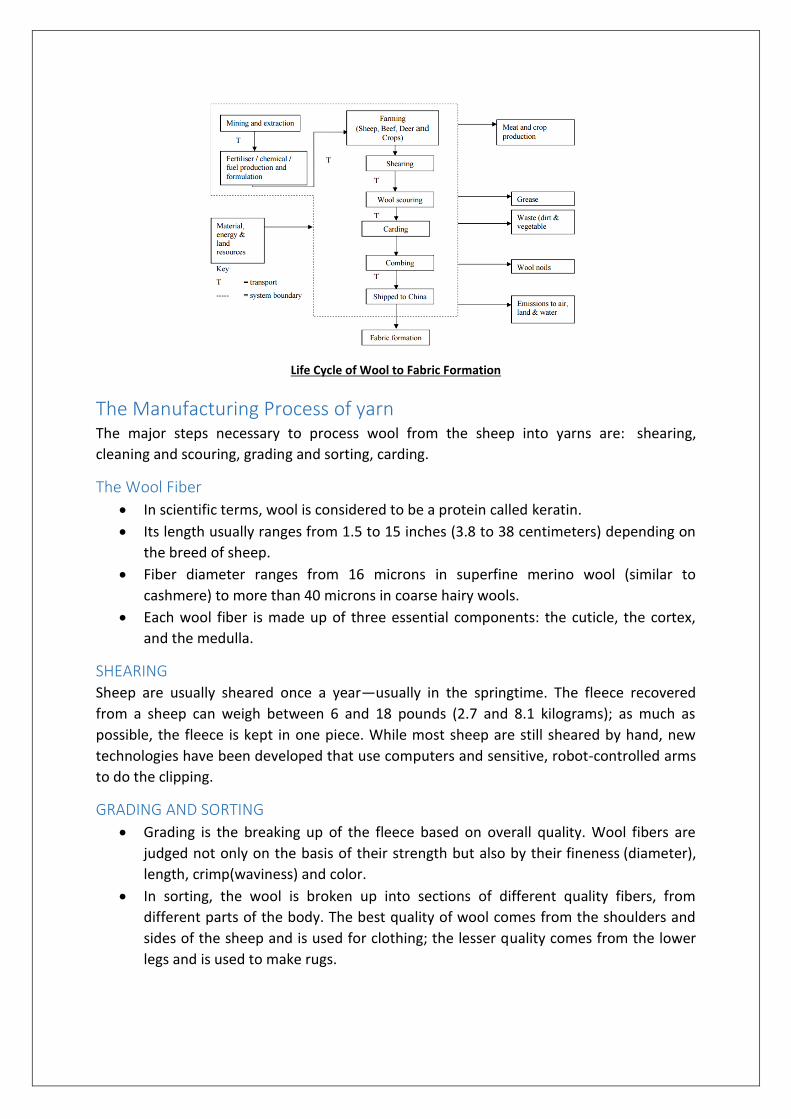
Life Cycle of Wool to Fabric Formation
The Manufacturing Process of yarn The major steps necessary to process wool from the sheep into yarns are: shearing,
cleaning and scouring, grading and sorting, carding.
The Wool Fiber
In scientific terms, wool is considered to be a protein called keratin.
Its length usually ranges from 1.5 to 15 inches (3.8 to 38 centimeters) depending on
the breed of sheep.
Fiber diameter ranges from 16 microns in superfine merino wool (similar to
cashmere) to more than 40 microns in coarse hairy wools.
Each wool fiber is made up of three essential components: the cuticle, the cortex,
and the medulla.
SHEARING Sheep are usually sheared once a year—usually in the springtime. The fleece recovered
from a sheep can weigh between 6 and 18 pounds (2.7 and 8.1 kilograms); as much as
possible, the fleece is kept in one piece. While most sheep are still sheared by hand, new
technologies have been developed that use computers and sensitive, robot-controlled arms
to do the clipping.
GRADING AND SORTING
Grading is the breaking up of the fleece based on overall quality. Wool fibers are
judged not only on the basis of their strength but also by their fineness (diameter),
length, crimp(waviness) and color.
In sorting, the wool is broken up into sections of different quality fibers, from
different parts of the body. The best quality of wool comes from the shoulders and
sides of the sheep and is used for clothing; the lesser quality comes from the lower
legs and is used to make rugs.
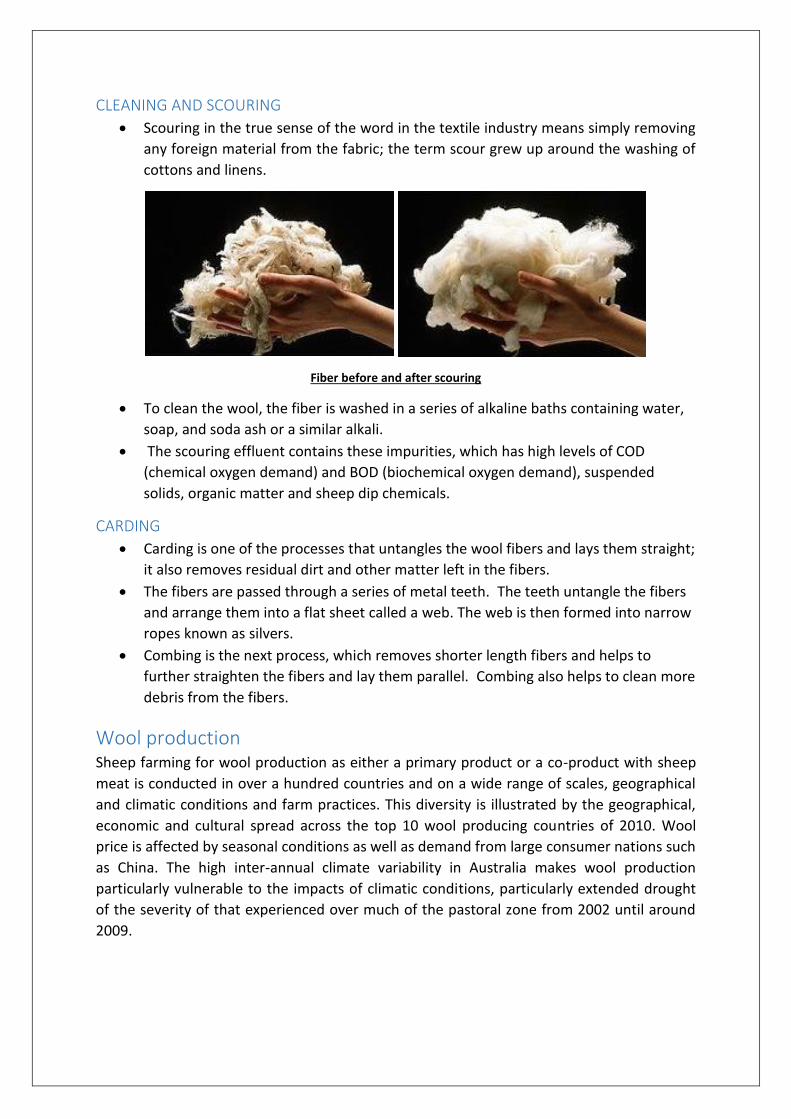
CLEANING AND SCOURING
Scouring in the true sense of the word in the textile industry means simply removing
any foreign material from the fabric; the term scour grew up around the washing of
cottons and linens.
Fiber before and after scouring
To clean the wool, the fiber is washed in a series of alkaline baths containing water,
soap, and soda ash or a similar alkali.
The scouring effluent contains these impurities, which has high levels of COD
(chemical oxygen demand) and BOD (biochemical oxygen demand), suspended
solids, organic matter and sheep dip chemicals.
CARDING
Carding is one of the processes that untangles the wool fibers and lays them straight;
it also removes residual dirt and other matter left in the fibers.
The fibers are passed through a series of metal teeth. The teeth untangle the fibers
and arrange them into a flat sheet called a web. The web is then formed into narrow
ropes known as silvers.
Combing is the next process, which removes shorter length fibers and helps to
further straighten the fibers and lay them parallel. Combing also helps to clean more
debris from the fibers.
Wool production Sheep farming for wool production as either a primary product or a co-product with sheep
meat is conducted in over a hundred countries and on a wide range of scales, geographical
and climatic conditions and farm practices. This diversity is illustrated by the geographical,
economic and cultural spread across the top 10 wool producing countries of 2010. Wool
price is affected by seasonal conditions as well as demand from large consumer nations such
as China. The high inter-annual climate variability in Australia makes wool production
particularly vulnerable to the impacts of climatic conditions, particularly extended drought
of the severity of that experienced over much of the pastoral zone from 2002 until around
2009.
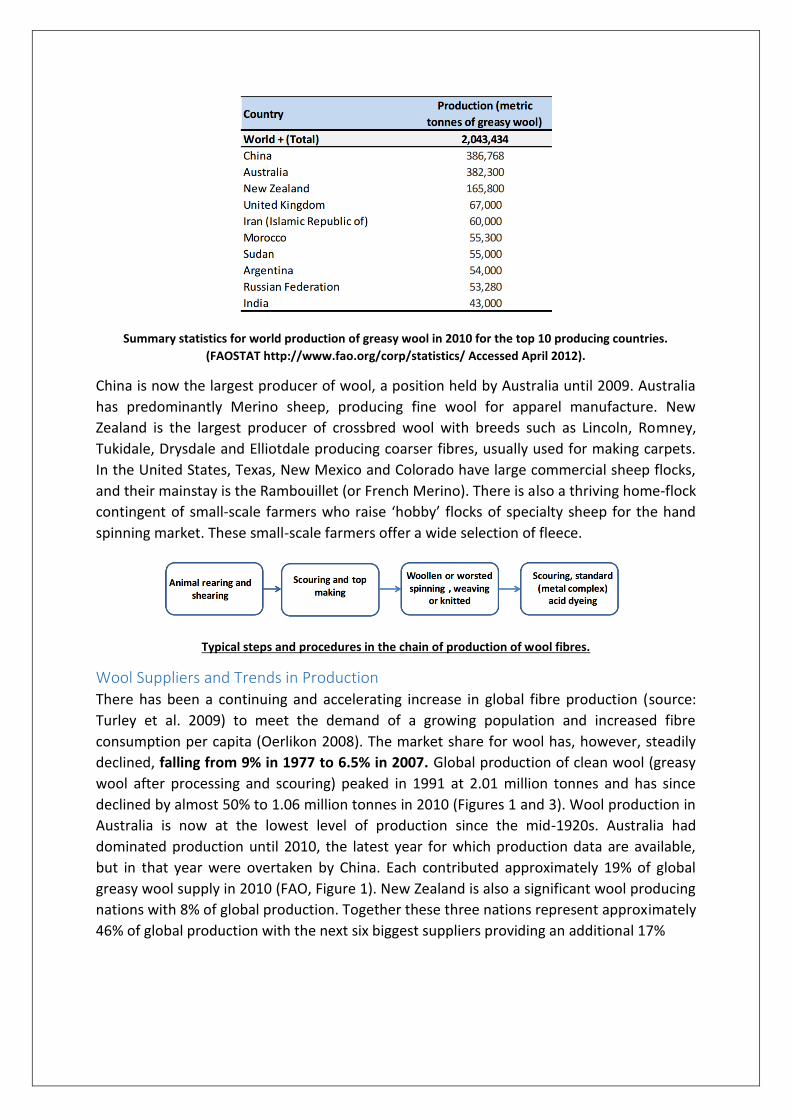
Summary statistics for world production of greasy wool in 2010 for the top 10 producing countries.
(FAOSTAT http://www.fao.org/corp/statistics/ Accessed April 2012).
China is now the largest producer of wool, a position held by Australia until 2009. Australia
has predominantly Merino sheep, producing fine wool for apparel manufacture. New
Zealand is the largest producer of crossbred wool with breeds such as Lincoln, Romney,
Tukidale, Drysdale and Elliotdale producing coarser fibres, usually used for making carpets.
In the United States, Texas, New Mexico and Colorado have large commercial sheep flocks,
and their mainstay is the Rambouillet (or French Merino). There is also a thriving home-flock
contingent of small-scale farmers who raise ‘hobby’ flocks of specialty sheep for the hand
spinning market. These small-scale farmers offer a wide selection of fleece.
Typical steps and procedures in the chain of production of wool fibres.
Wool Suppliers and Trends in Production There has been a continuing and accelerating increase in global fibre production (source:
Turley et al. 2009) to meet the demand of a growing population and increased fibre
consumption per capita (Oerlikon 2008). The market share for wool has, however, steadily
declined, falling from 9% in 1977 to 6.5% in 2007. Global production of clean wool (greasy
wool after processing and scouring) peaked in 1991 at 2.01 million tonnes and has since
declined by almost 50% to 1.06 million tonnes in 2010 (Figures 1 and 3). Wool production in
Australia is now at the lowest level of production since the mid-1920s. Australia had
dominated production until 2010, the latest year for which production data are available,
but in that year were overtaken by China. Each contributed approximately 19% of global
greasy wool supply in 2010 (FAO, Figure 1). New Zealand is also a significant wool producing
nations with 8% of global production. Together these three nations represent approximately
46% of global production with the next six biggest suppliers providing an additional 17%
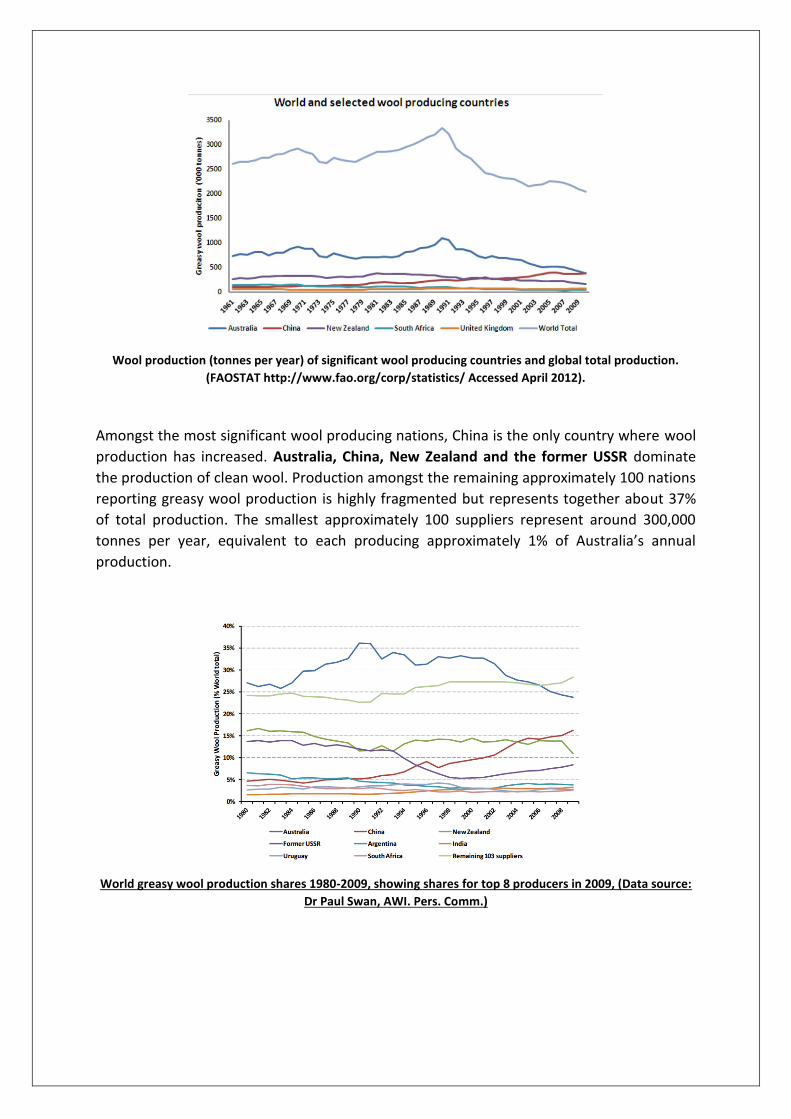
Wool production (tonnes per year) of significant wool producing countries and global total production.
(FAOSTAT http://www.fao.org/corp/statistics/ Accessed April 2012).
Amongst the most significant wool producing nations, China is the only country where wool
production has increased. Australia, China, New Zealand and the former USSR dominate
the production of clean wool. Production amongst the remaining approximately 100 nations
reporting greasy wool production is highly fragmented but represents together about 37%
of total production. The smallest approximately 100 suppliers represent around 300,000
tonnes per year, equivalent to each producing approximately 1% of Australia’s annual
production.
World greasy wool production shares 1980-2009, showing shares for top 8 producers in 2009, (Data source:
Dr Paul Swan, AWI. Pers. Comm.)
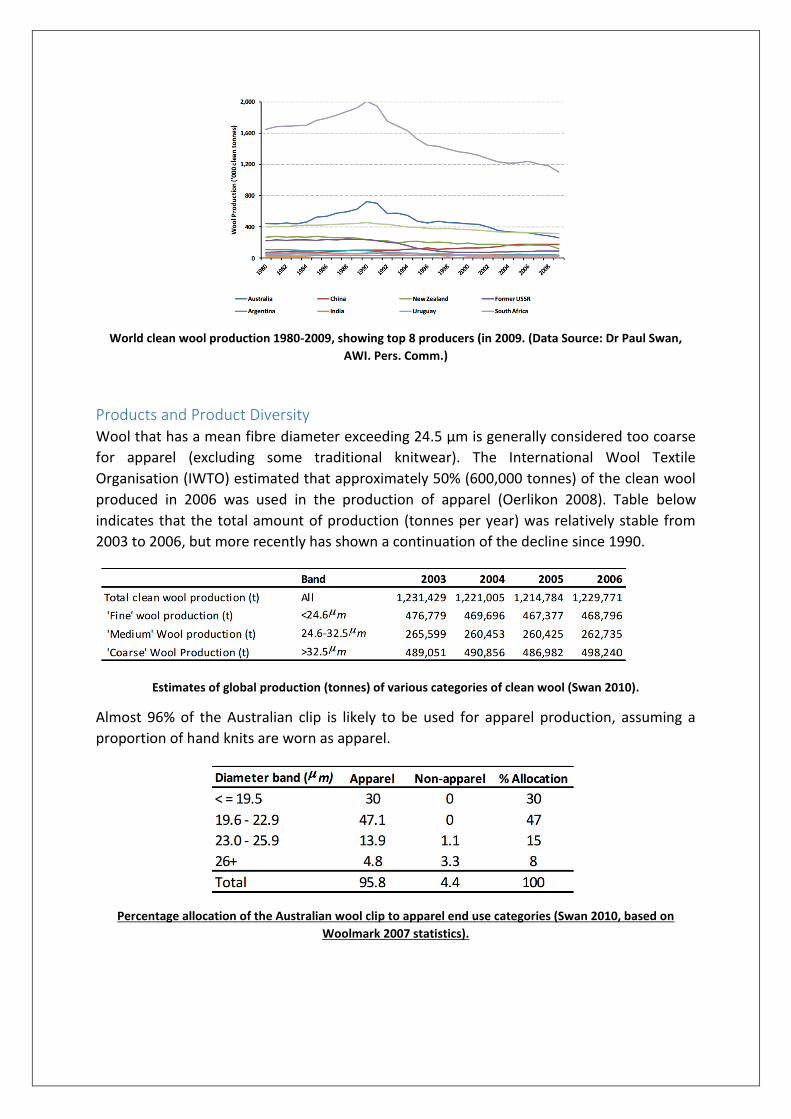
World clean wool production 1980-2009, showing top 8 producers (in 2009. (Data Source: Dr Paul Swan,
AWI. Pers. Comm.)
Products and Product Diversity Wool that has a mean fibre diameter exceeding 24.5 µm is generally considered too coarse
for apparel (excluding some traditional knitwear). The International Wool Textile
Organisation (IWTO) estimated that approximately 50% (600,000 tonnes) of the clean wool
produced in 2006 was used in the production of apparel (Oerlikon 2008). Table below
indicates that the total amount of production (tonnes per year) was relatively stable from
2003 to 2006, but more recently has shown a continuation of the decline since 1990.
Estimates of global production (tonnes) of various categories of clean wool (Swan 2010).
Almost 96% of the Australian clip is likely to be used for apparel production, assuming a
proportion of hand knits are worn as apparel.
Percentage allocation of the Australian wool clip to apparel end use categories (Swan 2010, based on
Woolmark 2007 statistics).
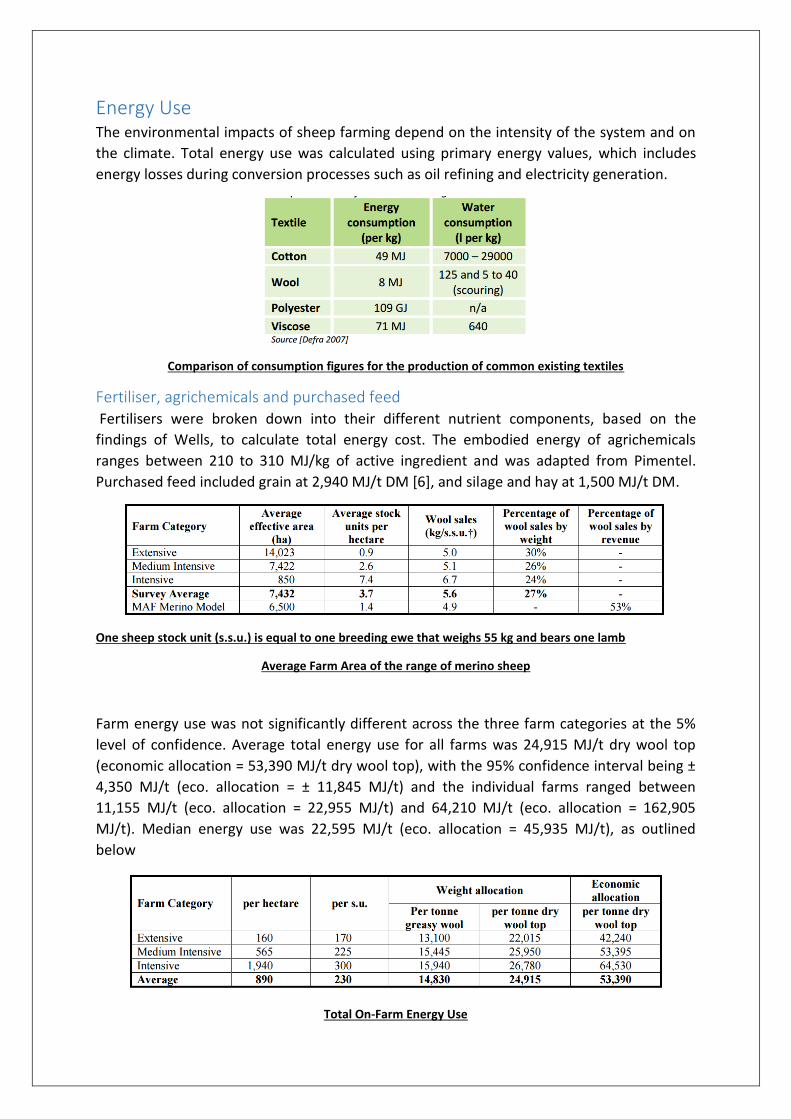
Energy Use
The environmental impacts of sheep farming depend on the intensity of the system and on
the climate. Total energy use was calculated using primary energy values, which includes
energy losses during conversion processes such as oil refining and electricity generation.
Comparison of consumption figures for the production of common existing textiles
Fertiliser, agrichemicals and purchased feed Fertilisers were broken down into their different nutrient components, based on the
findings of Wells, to calculate total energy cost. The embodied energy of agrichemicals
ranges between 210 to 310 MJ/kg of active ingredient and was adapted from Pimentel.
Purchased feed included grain at 2,940 MJ/t DM [6], and silage and hay at 1,500 MJ/t DM.
One sheep stock unit (s.s.u.) is equal to one breeding ewe that weighs 55 kg and bears one lamb
Average Farm Area of the range of merino sheep
Farm energy use was not significantly different across the three farm categories at the 5%
level of confidence. Average total energy use for all farms was 24,915 MJ/t dry wool top
(economic allocation = 53,390 MJ/t dry wool top), with the 95% confidence interval being ±
4,350 MJ/t (eco. allocation = ± 11,845 MJ/t) and the individual farms ranged between
11,155 MJ/t (eco. allocation = 22,955 MJ/t) and 64,210 MJ/t (eco. allocation = 162,905
MJ/t). Median energy use was 22,595 MJ/t (eco. allocation = 45,935 MJ/t), as outlined
below
Total On-Farm Energy Use
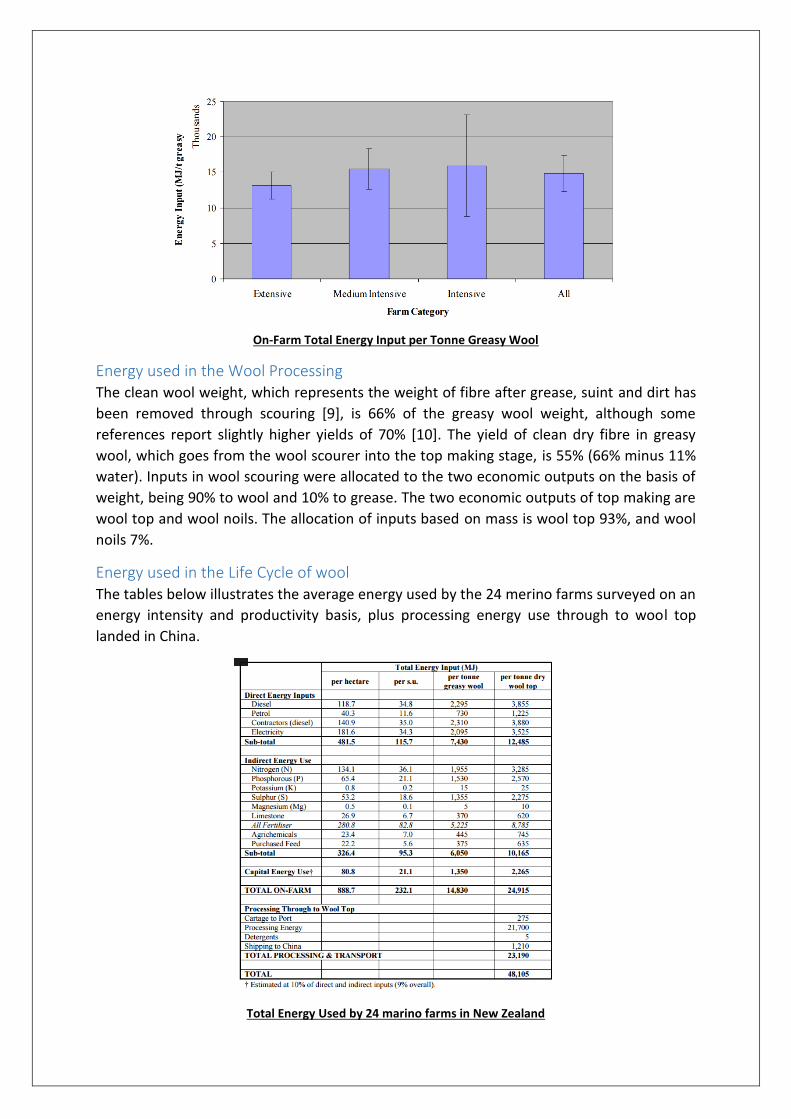
On-Farm Total Energy Input per Tonne Greasy Wool
Energy used in the Wool Processing The clean wool weight, which represents the weight of fibre after grease, suint and dirt has
been removed through scouring [9], is 66% of the greasy wool weight, although some
references report slightly higher yields of 70% [10]. The yield of clean dry fibre in greasy
wool, which goes from the wool scourer into the top making stage, is 55% (66% minus 11%
water). Inputs in wool scouring were allocated to the two economic outputs on the basis of
weight, being 90% to wool and 10% to grease. The two economic outputs of top making are
wool top and wool noils. The allocation of inputs based on mass is wool top 93%, and wool
noils 7%.
Energy used in the Life Cycle of wool The tables below illustrates the average energy used by the 24 merino farms surveyed on an
energy intensity and productivity basis, plus processing energy use through to wool top
landed in China.
Total Energy Used by 24 marino farms in New Zealand
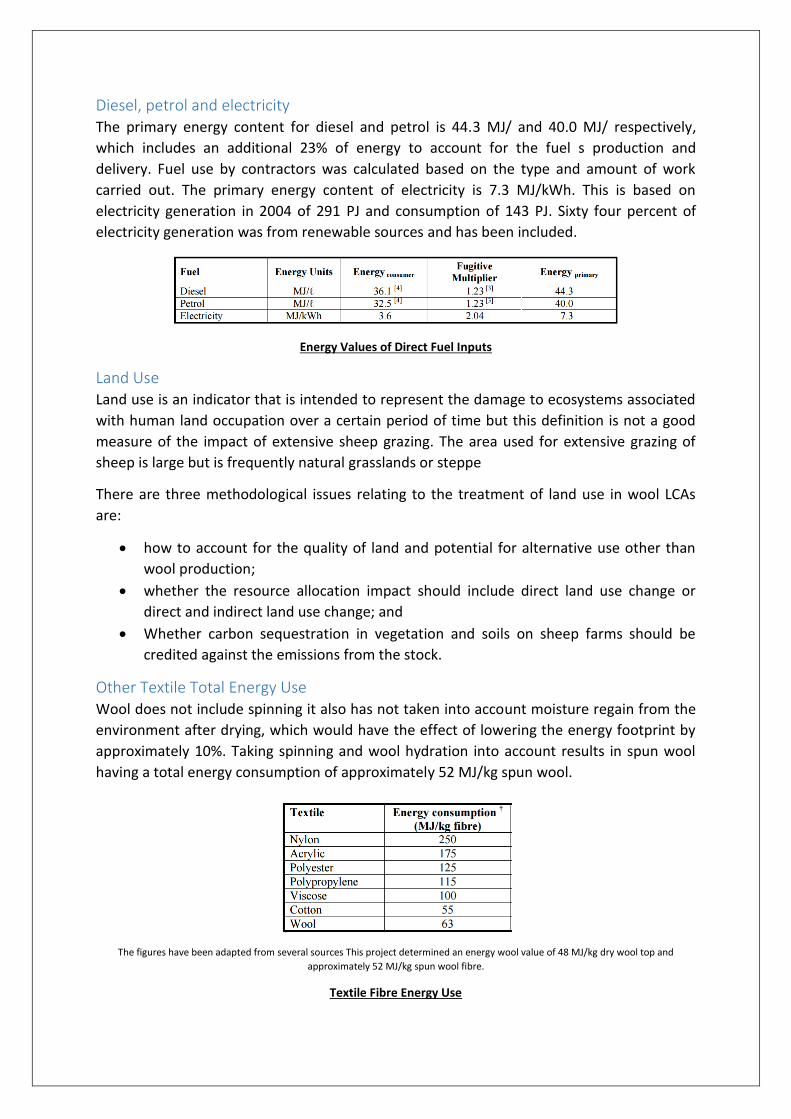
Diesel, petrol and electricity The primary energy content for diesel and petrol is 44.3 MJ/ and 40.0 MJ/ respectively,
which includes an additional 23% of energy to account for the fuel s production and
delivery. Fuel use by contractors was calculated based on the type and amount of work
carried out. The primary energy content of electricity is 7.3 MJ/kWh. This is based on
electricity generation in 2004 of 291 PJ and consumption of 143 PJ. Sixty four percent of
electricity generation was from renewable sources and has been included.
Energy Values of Direct Fuel Inputs
Land Use Land use is an indicator that is intended to represent the damage to ecosystems associated
with human land occupation over a certain period of time but this definition is not a good
measure of the impact of extensive sheep grazing. The area used for extensive grazing of
sheep is large but is frequently natural grasslands or steppe
There are three methodological issues relating to the treatment of land use in wool LCAs
are:
how to account for the quality of land and potential for alternative use other than
wool production;
whether the resource allocation impact should include direct land use change or
direct and indirect land use change; and
Whether carbon sequestration in vegetation and soils on sheep farms should be
credited against the emissions from the stock.
Other Textile Total Energy Use Wool does not include spinning it also has not taken into account moisture regain from the
environment after drying, which would have the effect of lowering the energy footprint by
approximately 10%. Taking spinning and wool hydration into account results in spun wool
having a total energy consumption of approximately 52 MJ/kg spun wool.
The figures have been adapted from several sources This project determined an energy wool value of 48 MJ/kg dry wool top and
approximately 52 MJ/kg spun wool fibre.
Textile Fibre Energy Use
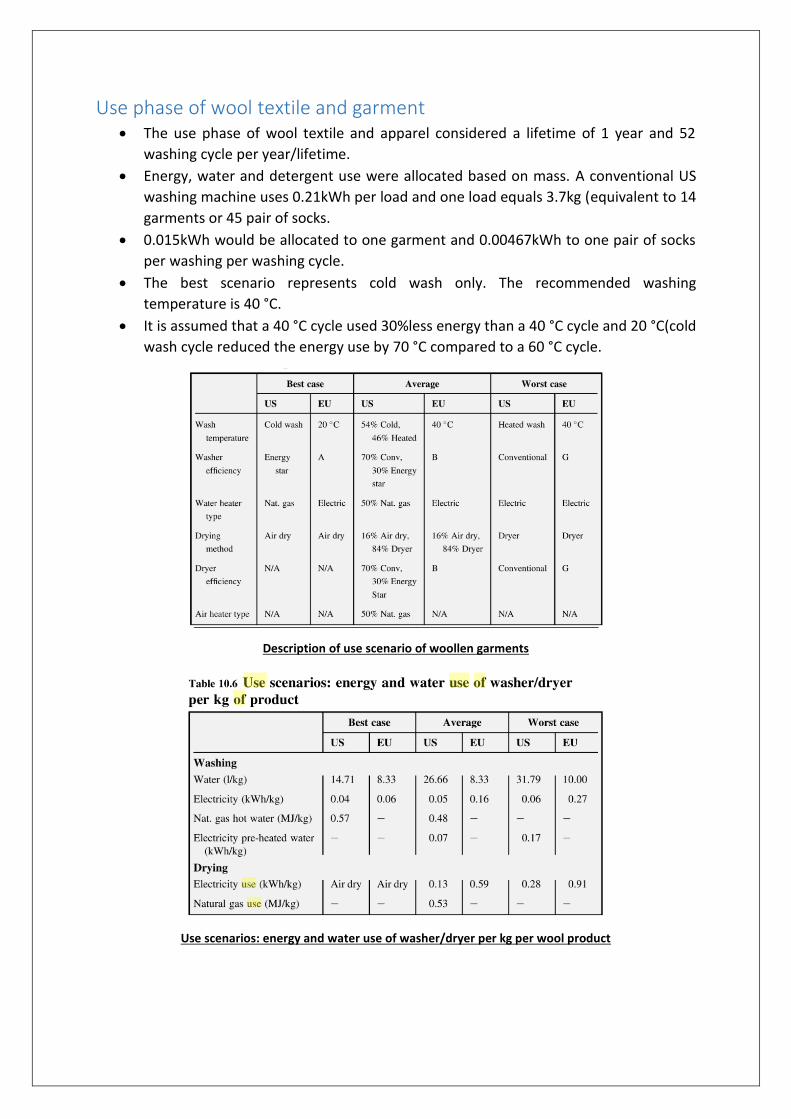
Use phase of wool textile and garment The use phase of wool textile and apparel considered a lifetime of 1 year and 52
washing cycle per year/lifetime.
Energy, water and detergent use were allocated based on mass. A conventional US
washing machine uses 0.21kWh per load and one load equals 3.7kg (equivalent to 14
garments or 45 pair of socks.
0.015kWh would be allocated to one garment and 0.00467kWh to one pair of socks
per washing per washing cycle.
The best scenario represents cold wash only. The recommended washing
temperature is 40 °C.
It is assumed that a 40 °C cycle used 30%less energy than a 40 °C cycle and 20 °C(cold
wash cycle reduced the energy use by 70 °C compared to a 60 °C cycle.
Description of use scenario of woollen garments
Use scenarios: energy and water use of washer/dryer per kg per wool product
End of life For the end-of-life phase of the product, two scenarios were analysed within the scope of
this study. The best case assumed direct release of the carbon sequestered in the product.
Regardless of whether the product had one or more users, if the use phase was 10 years or
less, all GHG emissions were treated as if they occurred at the beginning of the assessment
period (i.e. in the first year). This approach was consistent with that recommended in ISO
14067 (ISO, 2013). A worst case scenario assumed that the products were landfilled. In this
case, anaerobic decomposition of wool occurred, producing methane as well as CO2.
Methane has 25 times the GWP of CO2 (IPCC, 2007) and landfill disposal produced a higher
climate change impact as modelled based on a textile landfill dataset (PE, 2013).
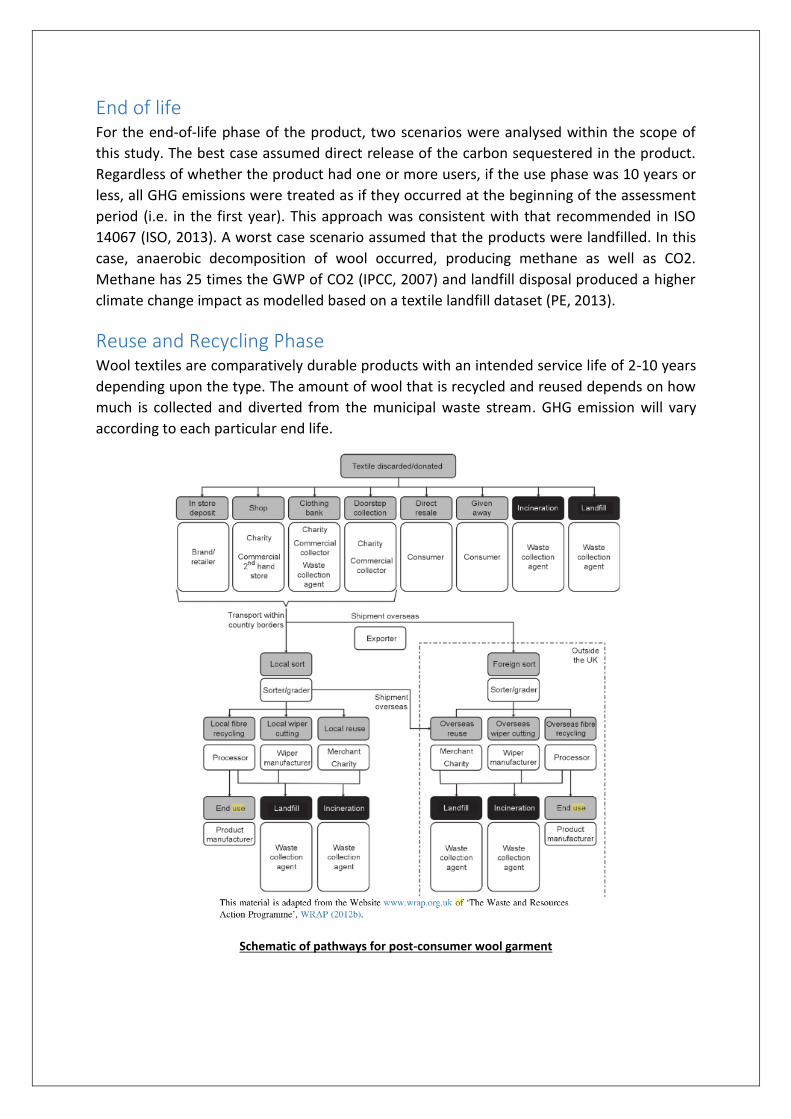
Reuse and Recycling Phase Wool textiles are comparatively durable products with an intended service life of 2-10 years
depending upon the type. The amount of wool that is recycled and reused depends on how
much is collected and diverted from the municipal waste stream. GHG emission will vary
according to each particular end life.
Schematic of pathways for post-consumer wool garment
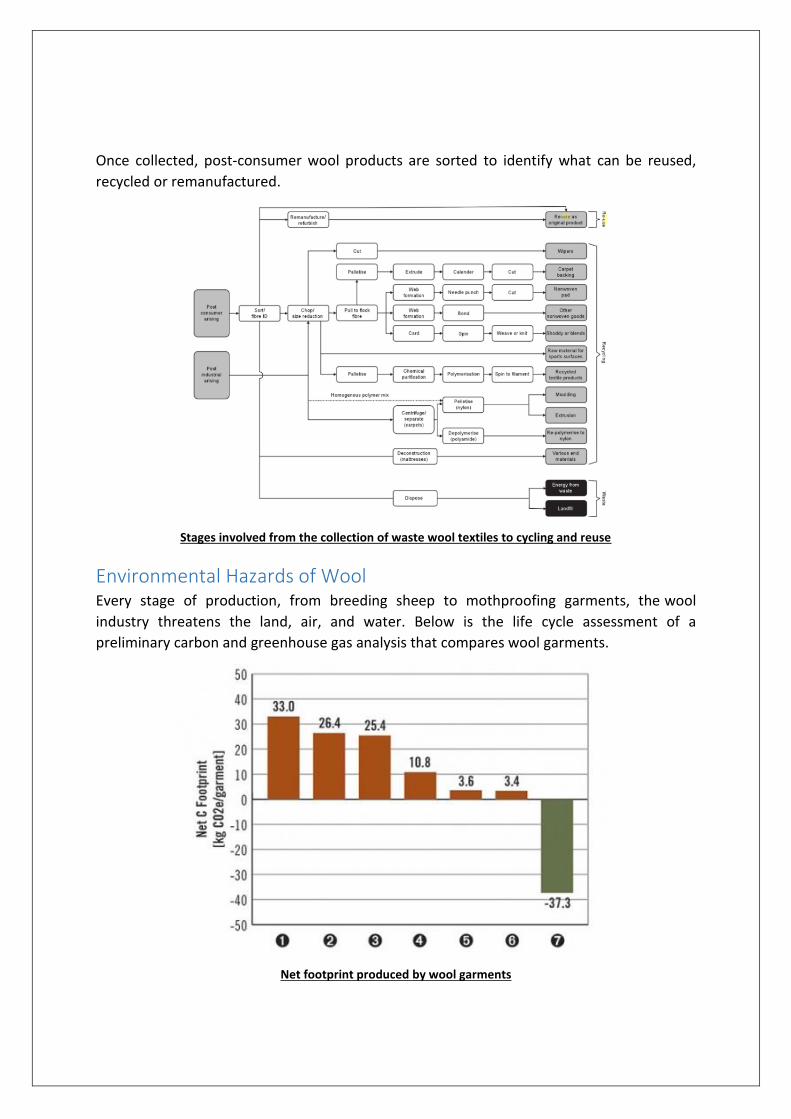
Once collected, post-consumer wool products are sorted to identify what can be reused,
recycled or remanufactured.
Stages involved from the collection of waste wool textiles to cycling and reuse
Environmental Hazards of Wool Every stage of production, from breeding sheep to mothproofing garments, the wool
industry threatens the land, air, and water. Below is the life cycle assessment of a
preliminary carbon and greenhouse gas analysis that compares wool garments.
Net footprint produced by wool garments
Climate Change
Extensive grazing of natural pastures
Across ruminant animal agriculture is the enteric methane production.
Associated with digestion, and this biological process has attracted attention in the
climate change debate as a contributor to greenhouse gas emissions.
Manure generated from livestock has significantly contributed to the increase in
atmospheric greenhouse gasses over the last 250 years.
In that time, the concentration of methane has increased by more than 130 percent
in the U.S. “Enteric fermentation,” or livestock belching and passing gas, accounts for
roughly one-quarter of annual agricultural methane emissions.
In New Zealand, methane emissions from enteric fermentation, coming mostly from
sheep, make up more than 90 percent of the nation’s greenhouse-gas emissions.
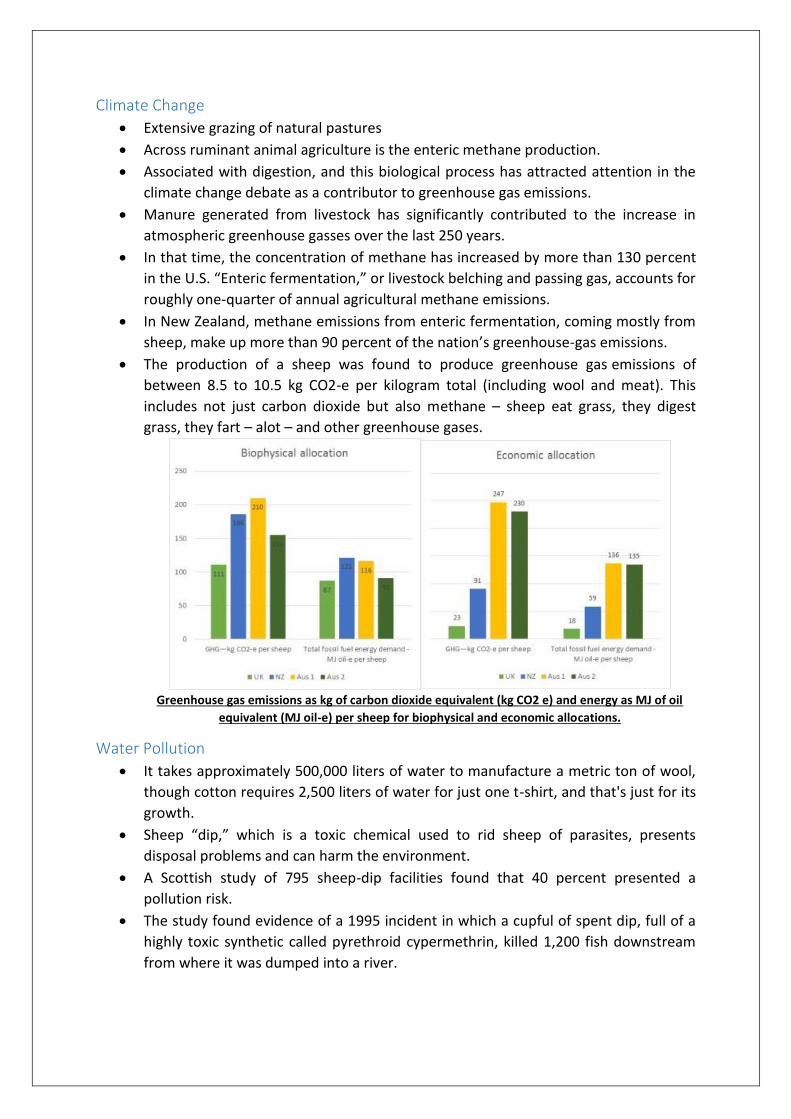
The production of a sheep was found to produce greenhouse gas emissions of
between 8.5 to 10.5 kg CO2-e per kilogram total (including wool and meat). This
includes not just carbon dioxide but also methane – sheep eat grass, they digest
grass, they fart – alot – and other greenhouse gases.
Greenhouse gas emissions as kg of carbon dioxide equivalent (kg CO2 e) and energy as MJ of oil
equivalent (MJ oil-e) per sheep for biophysical and economic allocations.
Water Pollution
It takes approximately 500,000 liters of water to manufacture a metric ton of wool,
though cotton requires 2,500 liters of water for just one t-shirt, and that's just for its
growth.
Sheep “dip,” which is a toxic chemical used to rid sheep of parasites, presents
disposal problems and can harm the environment.
A Scottish study of 795 sheep-dip facilities found that 40 percent presented a
pollution risk.
The study found evidence of a 1995 incident in which a cupful of spent dip, full of a
highly toxic synthetic called pyrethroid cypermethrin, killed 1,200 fish downstream
from where it was dumped into a river.
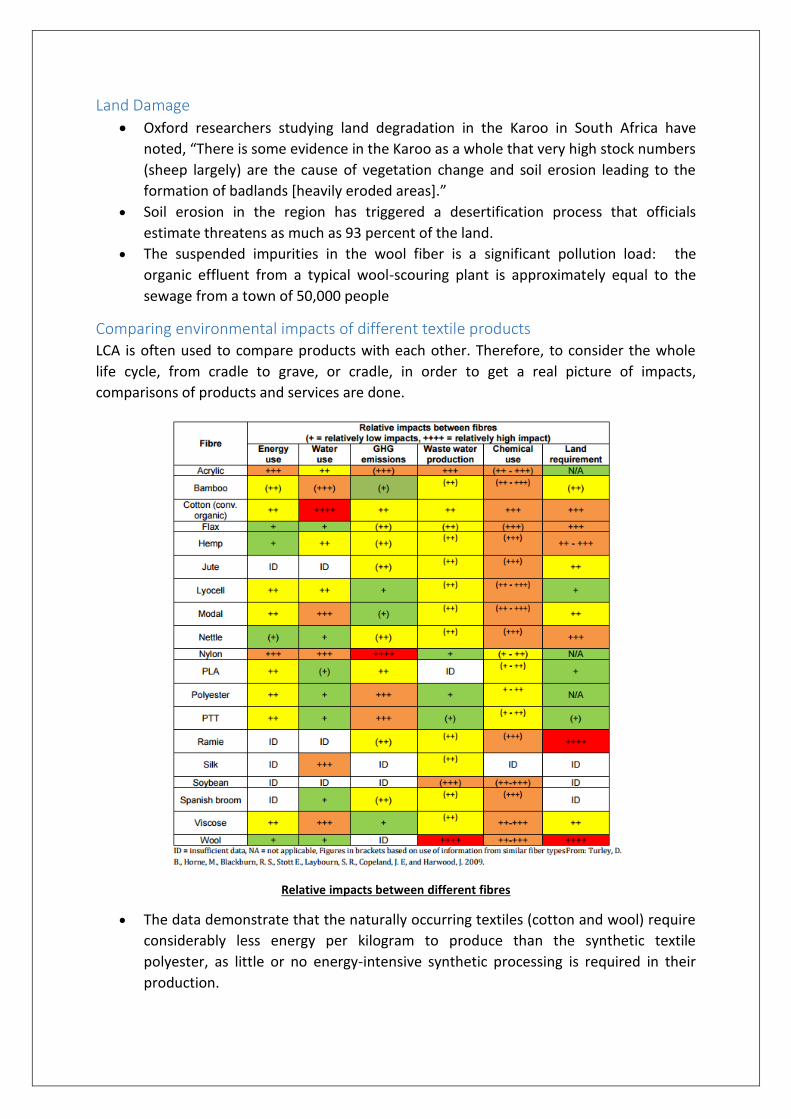
Land Damage
Oxford researchers studying land degradation in the Karoo in South Africa have
noted, “There is some evidence in the Karoo as a whole that very high stock numbers
(sheep largely) are the cause of vegetation change and soil erosion leading to the
formation of badlands [heavily eroded areas].”
Soil erosion in the region has triggered a desertification process that officials
estimate threatens as much as 93 percent of the land.
The suspended impurities in the wool fiber is a significant pollution load: the
organic effluent from a typical wool-scouring plant is approximately equal to the
sewage from a town of 50,000 people
Comparing environmental impacts of different textile products LCA is often used to compare products with each other. Therefore, to consider the whole
life cycle, from cradle to grave, or cradle, in order to get a real picture of impacts,
comparisons of products and services are done.
Relative impacts between different fibres
The data demonstrate that the naturally occurring textiles (cotton and wool) require
considerably less energy per kilogram to produce than the synthetic textile
polyester, as little or no energy-intensive synthetic processing is required in their
production.
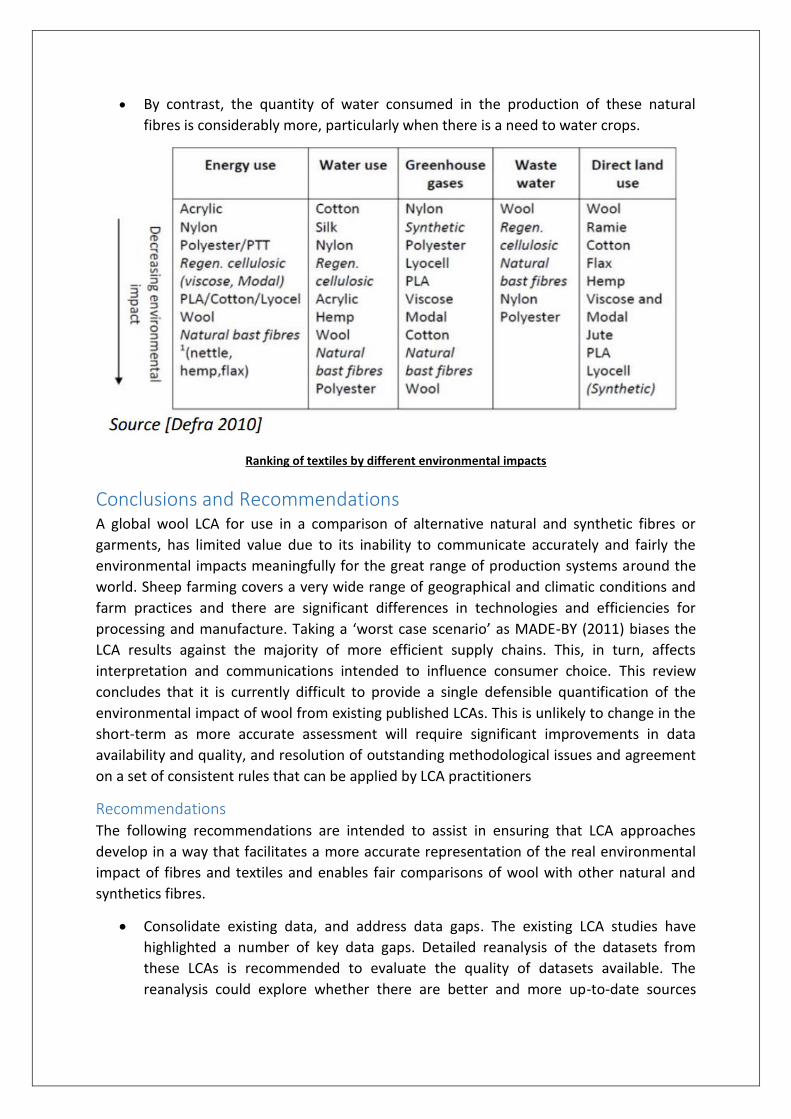
By contrast, the quantity of water consumed in the production of these natural
fibres is considerably more, particularly when there is a need to water crops.
Ranking of textiles by different environmental impacts
Conclusions and Recommendations A global wool LCA for use in a comparison of alternative natural and synthetic fibres or
garments, has limited value due to its inability to communicate accurately and fairly the
environmental impacts meaningfully for the great range of production systems around the
world. Sheep farming covers a very wide range of geographical and climatic conditions and
farm practices and there are significant differences in technologies and efficiencies for
processing and manufacture. Taking a ‘worst case scenario’ as MADE-BY (2011) biases the
LCA results against the majority of more efficient supply chains. This, in turn, affects
interpretation and communications intended to influence consumer choice. This review
concludes that it is currently difficult to provide a single defensible quantification of the
environmental impact of wool from existing published LCAs. This is unlikely to change in the
short-term as more accurate assessment will require significant improvements in data
availability and quality, and resolution of outstanding methodological issues and agreement
on a set of consistent rules that can be applied by LCA practitioners
Recommendations The following recommendations are intended to assist in ensuring that LCA approaches
develop in a way that facilitates a more accurate representation of the real environmental
impact of fibres and textiles and enables fair comparisons of wool with other natural and
synthetics fibres.
Consolidate existing data, and address data gaps. The existing LCA studies have
highlighted a number of key data gaps. Detailed reanalysis of the datasets from
these LCAs is recommended to evaluate the quality of datasets available. The
reanalysis could explore whether there are better and more up-to-date sources
appropriate to the goal and scope of a robust LCA as needed for the wool industry to
meet emerging needs for environmental accountability.
Develop globally applicable guidelines for conduct of wool LCAs While the
environmental performance of wool is most appropriately evaluated at a local or
regional scale, it is suggested that the global wool industry could develop agreed
guidelines for dealing with the critical assumptions in LCA studies relevant to wool
Develop a wool industry communication strategy. A communication plan based on
LCA could provide factual information and realistic perspectives on the impact
categories that will remain high for wool, especially greenhouse gas emissions
associated with methane from ruminant digestion and land use for grazing.
REFERENCES
http://www.iwto.org/uploaded/publications/Understanding_Wool_LCA2_20120513.pdf
http://www.sifo.no/files/file77634_wool_in_life_cycle_assessments_and_design_tools.pdf
http://www.gdrc.org/uem/lca/lca-define.html
http://www.conference.alcas.asn.au/2006/Barber%20Pellow.pdf
http://www.oakdenehollins.co.uk/media/232/2010_mistra_review_of_life_cycle_assessments_of_cl
othing.pdf
https://fibreworkshop.co.uk/2015/08/14/environmental-impact-of-wool/
http://www.fibershed.com/life-cycle-assessment/
http://www.treehugger.com/sustainable-fashion/which-is-greener-wool-or-cotton.html
http://www.peta.org/issues/animals-used-for-clothing/wool-industry/wool-environmental-hazards/
https://oecotextiles.wordpress.com/category/fibers/wool/
https://books.google.co.in/books?id=v8LlBwAAQBAJ&pg=PA230&lpg=PA230&dq=use+phase+of+wo
ol&source=bl&ots=8tnxzoghZu&sig=zo4HAAQa9qjYRJmtxYUYVbLUJcU&hl=en&sa=X&ved=0ahUKEwj
S1czi3IjMAhWDmJQKHeE1DogQ6AEIRzAG#v=onepage&q=use%20phase%20of%20wool&f=true