life cycle assessment of signature pack: a bev- erage ... · compared it with two other beverage...
TRANSCRIPT

Life Cycle Assessment of SIGNATURE PACK: a bev-erage carton containing polymers based on the mass balanced renewable material approach
Addendum for the Dutch market
Final report
LCA SIG / CB-100732b
commissioned by SIG Combibloc
Heidelberg, July 10th, 2018
ifeu Im Weiher 10 D - 69121 Heidelberg phone +49 (0)6 221. 47 67 - 0 fax +49 (0)6 221. 47 67 - 19 E-Mail [email protected] www.ifeu.de


Life Cycle Assessment of SIGNATURE PACK: a bev-erage carton containing polymers based on the mass balanced renewable material approach
Addendum for the Dutch market
Final report
LCA SIG / CB-100732b
commissioned by SIG Combibloc
Frank Wellenreuther
Stefanie Markwardt
Heidelberg, July 10th, 2018
ifeu Im Weiher 10 D - 69121 Heidelberg phone +49 (0)6 221. 47 67 - 0 fax +49 (0)6 221. 47 67 - 19 E-Mail [email protected] www.ifeu.de

ifeu Life Cycle Assessment of SIGNATURE PACK – Addendum Netherlands 3
Table of contents
1 Goal and Scope 6
1.1 Background and Objectives 6
1.2 Organisation of the study 8
1.3 Functional unit 8
1.4 System boundaries 8
1.5 Data gathering and data quality 10
1.6 Modelling and calculation of inventories 11
1.7 Allocation 11
1.7.1 Process-related allocation 12
1.7.2 System-related allocation 13
1.8 Environmental Impact Assessment 18
2 Packaging systems and scenarios 25
2.1 Packaging specifications 26
2.2 End-of-life 27
2.3 Scenario modelling 28
2.3.1 Base scenarios 28
2.3.2 Sensitivity analysis with focus on the allocation factor 28
3 Life cycle inventory 29
3.1 Manufacture of plastic raw materials 30
3.1.1 Polypropylene (PP) 30
3.1.2 Low Density Polyethylene (LDPE) 30
3.1.3 High Density Polyethylene (HDPE) 30
3.1.4 PA 6 30
3.1.5 Mass balanced PE and mass balanced PP dataset based on tall oil pitch 31
3.1.6 Mass balanced PA 6 32
3.2 Production of liquid packaging board (LPB) 33
3.3 Corrugated board and manufacture of cardboard trays 33
3.4 Converting 33
3.5 Closure production 34
3.6 Pallet production 34
3.7 Filling 34
3.8 Transport settings 34
3.9 Distribution of filled packs from filler to point of sale 35
3.10 Recovery and recycling 36
3.11 Background data 37
3.11.1 Transport processes 37
3.11.2 Electricity generation 37
3.11.3 Municipal waste incineration 38
3.11.4 Landfill 38
4 Results 39

4 ifeu Life Cycle Assessment of SIGNATURE PACK – Addendum Netherlands
4.1 Results base scenario (AF: 50%) 41
4.2 Description of results 44
4.2.1 Description by system 44
4.2.2 Comparison between systems 46
5 Interpretation 49
5.1 Base scenarios 49
5.2 Sensitivity analysis on system allocation 50
6 Limitations, completeness and consistency 55
7 Conclusions and Recommendations 57
7.1 Comparison of beverage cartons with and without mass-balanced polymers 57
7.2 Recommendations 57
References 58
8 Appendix: Critical review statement 62

ifeu Life Cycle Assessment of SIGNATURE PACK – Addendum Netherlands 5

6 ifeu Life Cycle Assessment of SIGNATURE PACK – Addendum Netherlands
1 Goal and Scope
1.1 Background and Objectives
In March 2018 ifeu finalised a Life Cycle Assessment study for SIG Combibloc: “Life Cycle Assessment
of SIGNATURE PACK: a beverage carton containing polymers based on the mass balanced renewable
material approach.” This study examined two variants of the newly developed SIGNATURE PACK and
compared it with two other beverage cartons from SIG Combibloc. SIGNATURE PACK is a beverage
carton packaging produced by SIG Combibloc that contains polymers that originate from renewable
European wood sources via a mass balance system. These replace conventional fossil based polymers,
which are usually contained in most aseptic beverage cartons.
Main goals of the original study were:
to provide knowledge about the environmental strengths and weaknesses of the two SIGNATURE
PACK variants cb3 1000 SIGNATURE PACK 100% and cb3 1000 SIGNATURE PACK high-barrier for the
packaging of 1 litre of UHT milk at German and European market conditions and
to compare the environmental performance of these pack solutions with the beverage cartons cb3
1000 Ecoplus and cb3 1000 Standard within the geographic scopes of Germany and Europe.
This addendum to the original study aims to deliver the same information for the Dutch market. The
examined beverage cartons are the same as for the German and European markets regarded in the
original study (although in the original study the name of the packs may not include the “1000” in
some cases).
The main comparisons are:
cb3 1000 SIGNATURE PACK 100% versus cb3 1000 Ecoplus, as both of these do not contain
aluminium foil and use the same closure solution. They are basically identical apart from the
source of polymers used.
cb3 1000 SIGNATURE PACK high-barrier versus cb3 1000 Standard, as both of these contain
aluminium and use the same closure solution. They are basically identical apart from the
source of polymers used.
cb3 1000 SIGNATURE PACK 100% is also compared to cb3 1000 Standard, as this carton is the
most usual beverage carton from SIG for the packaging of UHT milk, whereas the cb3 1000
Ecoplus can be considered as an already optimised packaging solution due to its substitution
of aluminium foil by polyamide [IFEU 2014].
Apart from the packaging specifications of these beverage cartons examined many other parameters
stay the same for the Dutch market as well. For example the functional unit, system boundaries, the
choice of system allocation, most background datasets, the choice of environmental impacts assessed
as well as the applied methodologies for their assessment are the same as in the original study to

ifeu Life Cycle Assessment of SIGNATURE PACK – Addendum Netherlands 7
which this document is considered to be an addendum. For this reason many sections of this adden-
dum are carried over from the original study without changes.
Of course there also are some important differences when examining the same beverage cartons on a
different market. The main differences are the utilisation of a different national electricity grid mix for
local processes, different energy recovery efficiencies for incineration plants and most importantly a
different recycling rate and disposal split. In these cases new or adapted sections are added to this
report. Results graphs and tables, result descriptions and interpretation are obviously different as well
but presented in the same way as in the original study.
A note on the mass balance approach applied for the production of polymers in the cb3 1000 SIGNA-
TURE PACKS:
Mass balance based polymers are polymers that are produced by using both, fossil and biogenic re-
sources as input materials for the same production process. In practice the input of biogenic materials
(in this case tall-oil, a by-product of the paper production processes) to the polymerisation process is
done at the same production process where mainly fossil based ethylene and naphta is used. This
leads to only one final product per production process which is neither 100% fossil-based nor 100%
bio-based material. To allocate the specific characteristics of fossil-based or bio-based input materials
to the final product the producers declare a certain share of their production as linked to renewable
resources. That share, of course is dependent on the share of biogenic input material.
It is important to understand that in reality (in a physical sense) the (C2H4)n and (C3H6)n molecules
of the tall oil based polymers are in fact mainly non bio-based, as the share of bio-based ethylene is
below 1% of the total production. But as the polymers in the SIGNATURE PACKS are the ones to which
the tall-oil input is allocated to, they are modelled as if they would be 100% tall-oil based for the pur-
pose of this study. The allocation of inputs is certified by ISCC PLUS (International Sustainability &
Carbon Certification) [ISSC 2018] and CMS 71 (TÜV SÜD certification standard) [TÜV SÜD 2017] re-
spectively.
The LCA results for the packaging solutions cb3 1000 SIGNATURE PACKS 100% and high-barrier within
this study are therefore not directly connected to the physical products examined, but to the produc-
tion technology concept that lies behind them. In the authors’ view the application of the mass bal-
ance approach in the production of polymers is an important driver to facilitate an increasing substi-
tution of fossil resources by biogenic resources for the production of polymers. To model the exam-
ined products strictly on their physical properties would mean to not acknowledge this function of
the mass balance approach.
The study is conducted according to the requirements of ISO applicable standards [ISO 14040] and
[ISO 14044]. As the results of this study shall be used for internal and external communication, the
study is also critically reviewed. The external review is conducted by Dominik Müller, Senior Sustaina-
bility Consultant at TÜV Rheinland, who already reviewed the original study. The review statement
can be found in an Appendix to this document.

8 ifeu Life Cycle Assessment of SIGNATURE PACK – Addendum Netherlands
1.2 Organisation of the study
This study was commissioned by SIG Combibloc in 2018. It is conducted by ifeu.
The members of the project panel are:
Udo Felten (SIG Combibloc)
Frank Wellenreuther (ifeu)
Stefanie Markwardt (ifeu)
1.3 Functional unit
The function examined in this LCA study is the packaging of milk for retail. The functional unit for this
study is the provision of 1000 L of ambient milk at the point of sale. (i.e. packed in 1000 beverage
cartons)
The primary packages examined are assumed to be technically equivalent regarding the mechanical
protection of the packaged beverage during transport, the storage at the point-of-sale and the use
phase.
The reference flow of the product system regarded here refers to the actually filled volume of the
containers and includes all packaging elements, i.e. beverage carton and closures as well as the
transport packaging (corrugated cardboard trays and shrink foil, pallets), which are necessary for the
packaging, filling and delivery of 1000 L beverage.
1.4 System boundaries
The study is designed as a ‘cradle-to-grave’ LCA, in other words it includes the extraction and produc-
tion of raw materials, converting processes, all transports and the final disposal or recycling of the
packaging system.
In general, the study covers the following steps:
Production of the primary base materials used in the primary packaging elements from the studied
systems (incl. closures)
converting, recycling and final disposal of primary packaging elements and related transports
production, recycling and final disposal of transport packaging (stretch foil, pallets, cardboard
trays)
production and disposal of process chemicals, as far as not excluded by the cut-off criteria (see
below)
transports of packaging material from producers to fillers
filling processes, which are fully assigned to the packaging system.
ifeu Life Cycle Assessment of SIGNATURE PACK – Addendum Netherlands 9
transport from fillers to potential central warehouses and final distribution to the point of sale
Not included are:
production and disposal of the infrastructure (machines, transport media, roads, etc.) and their
maintenance (spare parts, heating of production halls) as no significant impact is expected. To de-
termine if infrastructure can be excluded the authors apply two criteria by Reinout Heijungs
[Heijungs et al. 1992] and Rolf Frischknecht [Frischknecht et al. 2007]: Capital goods should be in-
cluded if the costs of maintenance and depreciation are a substantial part of the product and if en-
vironmental hot spots within the supply chain can be identified. Considering relevant information
about the supply chain from producers and retailers both criteria are considered to remain unful-
filled. An inclusion of capital goods might also lead to data asymmetries as data on infrastructure is
not available for many production data sets
production of beverage and transport to fillers as no relevant differences between the systems
under examination are to be expected
distribution of beverage from the filler to the point-of-sale (distribution of packages is included).
environmental effects from accidents
losses of beverage at different points in the supply and consumption chain which might occur for
instance in the filling process, during handling and storage, etc. as they are considered to be rough-
ly the same for all examined packaging systems. Significant differences in the amount of lost bev-
erage between the regarded packaging systems might be conceivable only if non-intended uses or
product treatments are considered as for example in regard to different breakability of packages or
potentially different amount of residues left in an emptied package due to the design of the pack-
age/closure.
Further possible losses are directly related to the handling of the consumer in the use phase, which
is not part of this study as handling behaviours are very different and difficult to assess. Therefore
these possible beverage loss differences are not quantifiable as almost no data is available regard-
ing these issues. In consequence a sensitivity analysis regarding beverage losses would be highly
speculative and is not part of this study. This is indeed not only true for the availability of reliable
data, but also uncertainties in inventory modelling methodology of regular and accidental process-
es and the allocation of potential beverage waste treatment aspects.
transport of filled packages from the point of sale to the consumer as no relevant differences be-
tween the systems under examination are to be expected and the implementation would be highly
speculative as no reliable data is available.
use phase of packages at the consumers as no relevant differences between the systems under
examination are to be expected (for example in regard to cleaning before disposal) and the imple-
mentation would be highly speculative as no reliable data is available.
For recycling and recovery routes the system boundary is set at the point where a secondary product
(energy or recycled material) is obtained. The secondary products can replace primary energy genera-
tion processes and virgin materials, respectively. This effect is accounted for in the life cycle assess-
ment by attributing credits for secondary products. These credits are calculated based on the envi-
ronmental loads of the corresponding primary energy generation process or material.

10 ifeu Life Cycle Assessment of SIGNATURE PACK – Addendum Netherlands
Cut-off criteria
In order to ensure the symmetry of the packaging systems to be examined and in order to maintain
the study within a feasible scope, a limitation on the detail in system modelling is necessary. So-called
cut-off criteria are used for that purpose. According to ISO standard [ISO 14044], cut-off criteria shall
consider mass, energy or environmental significance. Regarding mass-related cut-off, pre-chains from
preceding systems with an input material share of less than 1% of the total mass input of a consid-
ered process were excluded from the present study. However, total cut-off is not to surpass 5% of
input materials as referred to the functional unit. All energy inputs are considered, except the energy
related to the material inputs from pre-chains which are cut off according to the mass related rule.
Pre-chains with low input material shares, which would be excluded by the mass criterion, are never-
theless included if they are of environmental relevance, e.g. flows that include known toxic substanc-
es. The environmental relevance (significant impact on any impact category) of material input flows
was determined based on ifeu’s expert judgement based on previous studies. An example for exclud-
ed input materials based on a mass-related cut-off is the amount of printing ink used on the surface
of beverage cartons.
1.5 Data gathering and data quality
The datasets used in this study are described in section 3. All data shall meet the general require-
ments and characteristics regarding data gathering and data quality as summarised in the following
paragraphs.
Geographic scope
In terms of the geographic scope, the LCA study focuses on the production, filling, distribution and
disposal of beverage carton packages sold in the Netherlands. A certain share of the raw material
production for packaging systems takes place in specific European countries. For these, country-
specific data is used as well as European averages depending on the availability of datasets. Examples
are the liquid packaging board production process (country-specific) and the production of plastics
(available only as an European average).
Time scope
The reference time period for the comparison of packaging systems is 2018, as the packaging specifi-
cations listed in section 2 refer to 2018. Where no figures are available for these years, the used data
shall be as up-to-date as possible. Particularly with regard to data on end-of-life processes of the ex-
amined packages, the most current information available is used to correctly represent the recent
changes in this area. As some of these data are not yet publicly available, expert judgements are ap-
plied in some cases, for example based on confidential exchanges with representatives from the logis-
tics sector and retailers regarding distribution distances.
Most of the applied data refer to the period between 2005 and 2018.
Technical reference

ifeu Life Cycle Assessment of SIGNATURE PACK – Addendum Netherlands 11
The process technology underlying the datasets used in the study reflects process configurations as
well as technical and environmental levels which are typical for process operations in the reference
period.
1.6 Modelling and calculation of inventories
For the implementation of the system models the computer tool Umberto® (version 5.5) is used.
Umberto® is a standard software for mass flow modelling and LCA. It has been developed by the insti-
tute for environmental informatics (ifu) in Hamburg, Germany in collaboration with ifeu, Heidelberg.
1.7 Allocation
“Allocation refers to partitioning of input or output flows of a process or a product system between
the product system under study and one or more other product systems” [ISO 14044, definition
3.17]. This definition comprises the partitioning of flows regarding re-use and recycling, particularly
open loop recycling.
In the present study a distinction is made between process-related and system-related allocation, the
former referring to allocation procedures in the context of multi-input and multi-output processes
and the latter referring to allocation procedures in the context of open loop recycling.
Both approaches are further explained in the subsequent sections.

12 ifeu Life Cycle Assessment of SIGNATURE PACK – Addendum Netherlands
1.7.1 Process-related allocation
For process-related allocations, a distinction is made between multi-input and multi-output process-es.
Multi-input processes
Multi-input processes occur especially in the area of waste treatment. Relevant processes are mod-
elled in such a way that the partial material and energy flows due to waste treatment of the used
packaging materials can be apportioned in a causal way. The modelling of packaging materials that
have become waste after use and are disposed in a waste incineration plant is a typical example of
multi-input allocation. The allocation for e.g. emissions arising from such multi-input processes has
been carried out according to physical and/or chemical cause-relationships (e.g. mass, heating value
(for example in MSWI), stoichiometry, etc.).
Multi-output processes
For data sets prepared by the authors of this study, the allocation of the outputs from coupled pro-
cesses is generally carried out via the mass. If different allocation criteria are used, they are docu-
mented in the description of the data in case they are of special importance for the individual data
sets. For literature data, the source is generally referred to.
Transport processes
An allocation between the packaging and contents was carried out for the transportation of the filled
packages to the point-of-sale. Only the share in environmental burdens related to transport, which is
assigned to the package, has been accounted for in this study. That means the burdens related direct-
ly to the beverage is excluded. The allocation between package and filling good is based on mass cri-
terion.

ifeu Life Cycle Assessment of SIGNATURE PACK – Addendum Netherlands 13
1.7.2 System-related allocation
The approach chosen for system-related allocation is illustrated in figure 1: both graphs show two
example product systems, referred to as product system A and product system B. System A shall rep-
resent systems under study in this LCA. In figure 1 (upper graph) in both, system A and system B, a
virgin material (e.g. polymer) is produced, converted into a product which is used and finally disposed
of via MSWI. A virgin material in this case is to be understood as a material without recycled content.
A different situation is shown in the lower graph of figure 1. Here product A is recovered after use
and supplied as a raw material to system B avoiding thus the environmental loads related to the pro-
duction (‘MP-B’) of the virgin materials, e.g. polymer and the disposal of product A (‘MSWI-A’). Note:
Avoided processes are indicated by dashed lines in the graphs.
Now, if the system boundaries of the LCA are such that only product system A is examined it is neces-
sary to decide how the possible environmental benefits and loads of the polymer material recovery
and recycling shall be allocated (i.e. accounted) to system A. In LCA practice several allocation meth-
ods are found.
General notes regarding figures 1 to 4
The following graphs (figures 1 to 4) are intended to support a general understanding of the alloca-
tion process and for that reason they are strongly simplified. The graphs serve
to illustrate the difference between the 0% allocation method, the 50%:50% allocation method and
the 100% allocation method
to show which processes are allocated:
primary material production
recovery processes (e.g. material recycling, energy recovery as refuse-derived fuel (RDF))
waste treatment of final residues (here represented by MSWI)
However, within the study the actual situation is modelled based on certain key parameters, for ex-
ample the actual recycling flow, the actual recycling efficiency as well as the actual substituted mate-
rial including different substitution factors.
The allocation of final waste treatment is consistent with UBA LCA methodology [UBA 2000] and [UBA
2016a] and additionally this approach – beyond the UBA methodology – is also in accordance with
[ISO 14044].
For simplification some aspects are not explicitly documented in the mentioned graphs, among them
the following:
Material losses occur in both systems A and B, but are not shown in the simplified graphs. These
losses are of course taken into account in the calculations, their disposal is included within the re-
spective systems.
Hence not all material flows from system A are passed on to system B, as the simplified material
flow graphs may imply. Consequently only the effectively recycled material’s life cycle steps are al-
located between systems A and B.

14 ifeu Life Cycle Assessment of SIGNATURE PACK – Addendum Netherlands
The graphs do not show the individual process steps relevant for the waste material flow out of
packaging system A, which is sorted as residual waste, including the respective final waste treat-
ment.
For simplification, a substitution factor of 1 underlies the graphs. However, in the real calculations
smaller values are used where appropriate. For example if a material’s properties after recycling
are different from those of the primary material it replaces, this translates to a loss in material
quality. A substitution factor < 1 accounts for such effects. For further details regarding substitu-
tion factors please see subsection ‘Application of allocation rules’.
Figure 1 illustrates the general allocation approach used for uncoupled and coupled systems. The
allocation methods used in this study are shown in figures 2 to 3. In order to do the allocation con-
sistently, besides the virgin material production (‘MP-A’) already mentioned above and the disposal
of product B (’MSWI-B’), the recovery process ‘Rec’ has to be taken into consideration. This has been
highlighted in figure 2 by placing these processes in between system A and B. Regarding the waste
treatment process (here represented as ‘MSWI-B’), burdens or benefits are considered in a similar
way as the avoided primary raw material production.
Furthermore, there is one important premise to be complied with by any allocation method chosen:
the mass balance of all inputs and outputs of system A and system B after allocation must be the
same as the inputs and outputs calculated for the sum of systems A and B before allocation is per-
formed.
Allocation with the 0% method (figure 2)
In this method, the assessment of material flows ends from system A with the recovery of post-
consumer waste. The method implies that recyclates are not dealt with as co-products. Consequently
the benefits of avoided ‘MP-B’ are completely assigned to system B, which also has to carry the full
loads of ‘Rec’ and ‘MSWI-B’. System A, from its viewpoint, receives a zero credit for avoided primary
material production.
It still saves the final waste treatment of the material going to recycling instead of going to incinera-
tion in ‘MSWI-A’. The final waste treatment of the material going to recycling now occurs after the
use phase in System B. In the 0% method this waste treatment is completely assigned to System B.
The 0%-method could be regarded a simplified approach as it does not require any information, for
example, about the quality of recyclates and their potential applications in consecutive product lives.
Allocation with the 50% method (figure 3)
In this method, benefits and loads of ‘MP-A’, ‘Rec’ and ‘MSWI-B’ are equally shared between system
A and B (50:50 method). Thus, system A, from its viewpoint, receives a 50% credit for avoided prima-
ry material production and is assigned with 50% of the burden or benefit from waste treatment
(MSWI-B).
The 50% method has often been discussed in the context of open loop recycling, see [Fava et al.
1991], [Frischknecht 1998], [Klöpffer 1996] and [Kim et al. 1997]. According to [Klöpffer 2007], this
rule is furthermore commonly accepted as a “fair” split between two coupled systems.
The 50:50 method has been used in numerous LCAs carried out by ifeu and also is the standard ap-
proach applied in the packaging LCAs commissioned by the German Environment Agency (UBA). Addi-

ifeu Life Cycle Assessment of SIGNATURE PACK – Addendum Netherlands 15
tional background information on this allocation approach can be found in [UBA 2000] and [UBA
2016a].
The 50% allocation method was chosen as base scenario in the present study.
Allocation with the 100% method (figure 4)
In this method the principal rule is applied that system A gets all benefits for displacing the virgin
material and the involved production process ‘MP-B’. At the same time, all loads for producing the
secondary raw material via ‘Rec-A’ are assigned to system A. In addition, also the loads that are gen-
erated by waste treatment of product B in ‘MSWI-B’ is charged to system A, whereas the waste
treatment of product A is avoided and thus charged neither to System A nor to System B.
One should be aware that in such a case any LCA focusing on system B would then have to assign the
loads associated with the production process ‘MP-B’ to the system B (otherwise the mass balance
rule would be violated). However, system B would not be charged with loads related to ‘Rec’ as the
loads are already accounted for in system A. At the same time, ‘MSWI-B’ is not charged to system B
(again a requirement of the mass balance rule), as it is already assigned to System A.
Application of allocation rules
The allocation factors have been applied on a mass basis (i.e. the environmental loads of the recycling
process are charged with the total loads multiplied by the allocation factor) and where appropriate
have been combined with substitution factors. The substitution factor indicates what amount of the
secondary material substitutes for a certain amount of primary material. For example, a substitution
factor of 0.8 means that 1 kg of recycled (secondary) material replaces 0.8 kg of primary material and
receives a corresponding credit. With this, a substitution factor < 1 also accounts for so-called ‘down-
cycling’ effects, which describe a recycling process in which waste materials are converted into new
materials of lesser quality.
As discussed above, system related allocation addresses the issue of how to account for secondary
products in the context of open loop recycling. Still, any procedure chosen will involve value judge-
ments. Consequently, it is a typical subject of sensitivity analysis. According to [ISO 14044] one sensi-
tivity analysis has to be applied in order to check the uncertainty of results due to subjective choices.
System allocation approaches used in this study
For the base scenario a system allocation factor of 50% is chosen. This corresponds to the system
allocation approaches recommended by the German Federal Environment Agency [UBA 2000] and
[UBA 2016a]. To verify how a different approach regarding system related allocation would influence
LCA results, one sensitivity analysis is added to the study. For this a 100% allocation factor is applied.

16 ifeu Life Cycle Assessment of SIGNATURE PACK – Addendum Netherlands
Figure 1: Additional system benefit/burden through recycling (schematic flow chart)
MSWI(MSWI-A)
Material
Production
(MP-B)
MSWI(MSWI-B)
System A:
MP-A + Pr-A
System B:
Pr-B+ MSWI-B
Coupled systems (system expansion)
Recovery(Rec)
Recovery(Rec)
Burden System A + B:
MP-A + Pr-A + Pr-B + MSWI-B
Avoided Burden:
MSWI-A + MP-B
Additional Process:
+ Rec
Material
Production(MP-A)
Product A
Production &
Use(Pr-A)
MSWI(MSWI-A)
Material
Production
(MP-B)
Product B
Production &
Use(Pr-B)
MSWI(MSWI-B)
System A:
MP-A + Pr-A + MSWI-A
System B:
MP-B + Pr-B+ MSWI-B
Uncoupled systems
Material
Production(MP-A)
Product A
Production &
Use(Pr-A)
Product B
Production &
Use(Pr-B)
MSWI(MSWI-A)
Material
Production
(MP-B)
MSWI(MSWI-B)
System A:
MP-A + Pr-A
System B:
Pr-B+ MSWI-B
Coupled systems (system expansion)
Recovery(Rec)
Recovery(Rec)
Burden System A + B:
MP-A + Pr-A + Pr-B + MSWI-B
Avoided Burden:
MSWI-A + MP-B
Additional Process:
+ Rec
Material
Production(MP-A)
Product A
Production &
Use(Pr-A)
MSWI(MSWI-A)
Material
Production
(MP-B)
Product B
Production &
Use(Pr-B)
MSWI(MSWI-B)
System A:
MP-A + Pr-A + MSWI-A
System B:
MP-B + Pr-B+ MSWI-B
Uncoupled systems
Material
Production(MP-A)
Product A
Production &
Use(Pr-A)
Product B
Production &
Use(Pr-B)

ifeu Life Cycle Assessment of SIGNATURE PACK – Addendum Netherlands 17
Figure 2: Principles of 0% allocation (schematic flow chart)
Figure 3: Principles of 50% allocation (schematic flow chart)
Material
Production(MP-A)
MSWI(MSWI-A)
MSWI(MSWI-B)
System B:
Rec-A + Pr-B + MSWI-B
Allocation: 0% approach
Recovery(Rec-A)
+100% +0%
+0% +100%
MSWI(MSWI-B)
System A:
MP-A + Pr-A
Material
Production
(MP-B)
Material
Production
(MP-A)
Product A
Production &
Use(Pr-A)
Product B
Production &
Use
(Pr-B)
+0% +100%
System BSystem A
Material
Production(MP-A)
MSWI(MSWI-A)
MSWI(MSWI-B)
Allocation: 50% approach
Recovery(Rec-A)
+50% +50%
+50% +50%
MSWI(MSWI-B)
System A:
0.5*MP-A + Pr-A+ 0.5*Rec-A
+ 0.5*MSWI-B
Material
Production
(MP-B)
Material
Production
(MP-A)
Product A
Production &
Use(Pr-A)
Product B
Production &
Use
(Pr-B)
+50% +50%
System BSystem A
System B:
0.5*MP-A+0.5*Rec-A + Pr-B +
0.5*MSWI-B
Material
Production(MP-A)
MSWI(MSWI-A)
MSWI(MSWI-B)
Allocation: 50% approach
Recovery(Rec-A)
+50% +50%
+50% +50%
MSWI(MSWI-B)
System A:
0.5*MP-A + Pr-A+ 0.5*Rec-A
+ 0.5*MSWI-B
Material
Production
(MP-B)
Material
Production
(MP-A)
Product A
Production &
Use(Pr-A)
Product B
Production &
Use
(Pr-B)
+50% +50%
System BSystem A
System B:
0.5*MP-A+0.5*Rec-A + Pr-B +
0.5*MSWI-B

18 ifeu Life Cycle Assessment of SIGNATURE PACK – Addendum Netherlands
Figure 4: Principles of 100% allocation (schematic flow chart)
1.8 Environmental Impact Assessment
The environmental impact assessment phase is intended to increase the understanding and evaluat-
ing of the potential environmental impacts for a product system throughout the whole life cycle [ISO
14040] and [ISO 14044].
To assess the environmental performance of the examined packaging systems, a set of environmental
impact categories is used. Related information as well as references of applied models is provided
below. In the present study, midpoint categories are applied. Midpoint indicators represent potential
primary environmental impacts and are located between emission and potential harmful effect. This
means that the potential damage caused by the substances is not taken into account.
The selection of the impact categories is based both on the current practice in LCA and the applicabil-
ity of as less as uncertain characterisation models also with regard to the completeness and availabil-
ity of the inventory data. The choice is also based on the German Federal Environmental Agency
(UBA) approach 2016 [UBA 2016a], which is mainly based on methods by CML in the Netherlands and
is also fully consistent with the requirements of ISO 14040 and ISO 14044. However, it is nearly im-
possible to carry out an assessment in such a high level of detail, that all environmental issues are
covered. A broad examination of as many environmental issues as possible is highly dependent on the
quality of the available inventory datasets and of the scientific acceptance of the certain assessment
methods.
The description of the different inventory categories and their indicators is based on the terminology
by [ISO 14044]. It has to be noted; that the impact categories, represent the environmental issues of
Material
Production(MP-A)
MSWI(MSWI-A)
MSWI(MSWI-B)
Allocation: 100% approach
Recovery(Rec-A)
+0% +100%
+100% +0%
MSWI(MSWI-B)
System A:
Pr-A+ Rec-A + MSWI-B
Material
Production
(MP-B)
Material
Production
(MP-A)
Product A
Production &
Use(Pr-A)
Product B
Production &
Use
(Pr-B)
+100% +0%
System BSystem A
System B:
MP-A + Pr-B
Material
Production(MP-A)
MSWI(MSWI-A)
MSWI(MSWI-B)
Allocation: 100% approach
Recovery(Rec-A)
+0% +100%
+100% +0%
MSWI(MSWI-B)
System A:
Pr-A+ Rec-A + MSWI-B
Material
Production
(MP-B)
Material
Production
(MP-A)
Product A
Production &
Use(Pr-A)
Product B
Production &
Use
(Pr-B)
+100% +0%
System BSystem A
System B:
MP-A + Pr-B

ifeu Life Cycle Assessment of SIGNATURE PACK – Addendum Netherlands 19
concern, to which life cycle inventory analysis results per functional unit are assigned, but do not
reflect actual environmental damages.
The selected impact categories and additional inventory categories to be assessed and presented in
this study are listed and briefly addressed below.
Impact categories related to emissions
Climate change
Climate Change addresses the impact of anthropogenic emissions on the radiative forcing of the at-
mosphere. Greenhouse gas emissions enhance the radiative forcing, resulting in an increase of the
earth’s temperature. The characterisation factors applied here are based on the category indicator
Global Warming Potential (GWP) for a 100-year time horizon [IPCC 2013]. In reference to the func-
tional unit (fu), the category indicator results, GWP results, are expressed as kg CO2-e/fu.
Note on biogenic carbon:
At the impact assessment level, it must be decided how to model and calculate CO2-based GWP. In
this context, biogenic carbon (the carbon content of renewable biomass resources) plays a special
role: as they grow, plants absorb carbon from the air, thus reducing the amounts of carbon dioxide in
the atmosphere. The question is how this uptake should be valued in relation to the (re-)emission of
CO2 at the material’s end of life, for example CO2 fixation in biogenic materials such as growing trees
versus the greenhouse gas’s release from thermal treatment of cardboard waste.
In the life cycle community two approaches are common. The non-fossil CO2 may be included at two
points in the model, its uptake during the plant growth phase attributed with negative GWP values
and the corresponding re-emissions at end of life with positive ones. Alternatively, neither the uptake
of non-fossil CO2 by the plant during its growth nor the corresponding CO2 emissions are taken into
account in the GWP calculation.
In the present study, the former approach has been applied for the impact assessment, as due to the
application of an allocation factor of 50% the carbon balance can’t be closed for the examined sys-
tem. The allocation affects the emissions and credits from incineration plants but not the uptake of
CO2 by plant growth. The carbon balance is closed in the sensitivity analyses with an allocation factor
of 100%. Please see section 1.7.2 for an explanation of the different allocation approaches.
Stratospheric Ozone Depletion
This impact category addresses the anthropogenic impact on the earth’s atmosphere, which leads to
the decomposition of naturally present ozone molecules, thus disturbing the molecular equilibrium in
the stratosphere. The underlying chemical reactions are very slow processes and the actual impact,
often referred to in a simplified way as the ‘ozone hole’, takes place only with considerable delay of
several years after emission. The consequence of this disequilibrium is that an increased amount of
UV-B radiation reaches the earth’s surface, where it can cause damage to certain natural resources or
human health. In this study, the ozone depletion potential (ODP) compiled by the World Meteorolog-
ical Organisation (WMO) in 2011 [WMO 2011] is used as category indicator. In reference to the func-
tional unit, the unit for Ozone Depletion Potential is kg CFC-11-e/fu.

20 ifeu Life Cycle Assessment of SIGNATURE PACK – Addendum Netherlands
Photo-Oxidant Formation / Summer Smog
Photo-oxidant formation also known as summer smog or Los Angeles smog is the photochemical
creation of reactive substances (mainly ozone), which affect human health and ecosystems. This
ground-level ozone is formed in the atmosphere by nitrogen oxides and volatile organic compounds
in the presence of sunlight.
In this study, ‘Maximum Incremental Reactivity‘ (MIR) developed in the US by William P. L. Carter is
applied as category indicator for the impact category photo-oxidant formation. MIRs expressed as [kg
O3-e / emission i are used in several reactivity-based VOC (Volatile Organic Compounds) regulations
by the California Air Resources Board (CARB 1993, 2000). The recent approach of William P. L. Carter
includes characterisation factors for individual VOC, unspecified VOC and NOx. The ‘Nitrogen-
Maximum Incremental Reactivity‘ (NMIR) for NOx is introduced for the first time in 2008 (Carter
2008). The MIRs and NMIRs are calculated based on scenarios where ozone formation has maximum
sensitivities either to VOC or NOx inputs. The recent factors applied in this study were published by
[Carter 2010]. According to [Carter 2008], “MIR values may also be appropriate to quantify relative
ozone impacts of VOCs for life cycle assessment analyses as well, particularly if the objective is to
assess the maximum adverse impacts of the emissions of the compounds involved.” The results re-
flect the potential where VOC or NOx reductions are the most effective for reducing ozone.
The MIR concept seem to be the most appropriate characterisation model for LCIA based on generic
spatial independent global inventory data and combines following needs:
Provision of characterisation factors for more than 1100 individual VOC, VOC mixtures, nitrogen
oxides and nitrogen dioxides
Consistent modelling of potential impacts for VOC and NOx
Considering of the maximum formation potential by inclusion of most supporting background con-
centrations of the gas mixture and climatic conditions. This is in accordance with the precautionary
principle.
Characterisation factors proposed by [CML 2002] and [ReCiPe 2008] are based on European condi-
tions regarding background concentrations and climate conditions. The usage of this characterisation
factors could lead to an underestimation of the photo-oxidant formation potential in regions with e.g.
a high solar radiation.
The unit for Photo-Oxidant Formation Potential is kg O3-e/fu.
Acidification
Acidification affects aquatic and terrestrial ecosystems by changing the acid-basic-equilibrium
through the input of acidifying substances. The acidification potential expressed as SO2-equivalents
according to [Heijungs et al. 1992] is applied here as category indicator.
The characterisation model by [Heijungs et al. 1992] is chosen as the LCA framework addresses po-
tential environmental impacts calculated based on generic spatial independent global inventory data.
The method is based on the potential capacity of the pollutant to form hydrogen ions. The results of

ifeu Life Cycle Assessment of SIGNATURE PACK – Addendum Netherlands 21
this indicator, therefore, represent the maximum acidification potential per substance without an
undervaluation of potential impacts.
The method by [Heijungs et al. 1992] is, in contrast to methods using European dispersion models,
applicable for emissions outside Europe. The authors of the method using accumulated exceedance
note that “the current situation does not allow one to use these advanced characterisation methods,
such as the AE method, outside of Europe due to a lack of suitable atmospheric dispersion models
and/or measures of ecosystem sensitivity” Posch et al. 2008 .
The unit for the Acidification potential is kg SO2-e/fu.
Eutrophication and oxygen-depletion
Eutrophication means the excessive supply of nutrients and can apply to both surface waters and
soils. As these two different media are affected in very different ways, a distinction is made between
water-eutrophication and soil-eutrophication:
1. Terrestrial Eutrophication (i.e., eutrophication of soils by atmospheric emissions)
2. Aquatic Eutrophication (i.e., eutrophication of water bodies by effluent releases)
Compounds containing nitrogen and phosphorus are among the most eutrophicating elements. The
eutrophication of surface waters also causes oxygen-depletion. A measure of the possible perturba-
tion of the oxygen levels is given by the Chemical Oxygen Demand (COD). In order to quantify the
magnitude of this undesired supply of nutrients and oxygen depletion substances, the eutrophication
potential by [Heijungs et al. 1992, CML 2002] category was chosen as impact indicator. The unit for
both types of Eutrophication is kg PO4-e/fu.
Human toxicity: PM2.5 / Particulate Matter
The category covers effects of fine particulates with an aerodynamic diameter of less than 2.5 µm
(PM 2.5) emitted directly (primary particles) or formed from precursors as NOx and SO2 (secondary
particles). Epidemiological studies have shown a correlation between the exposure to particulate
matter and the mortality from respiratory diseases as well as a weakening of the immune system.
Following an approach of [De Leeuw 2002], the category indicator aerosol formation potential (AFP)
is applied. Within the characterisation model, secondary fine particulates are quantified and aggre-
gated with primary fine particulates as PM2.5 equivalents1. This approach addresses the potential
impacts on human health and nature independent of the population density.
The characterisation models suggested by [ReCiPe 2008] and [JRC 2011] calculate intake fractions
based on population densities. This means that emissions transported to rural areas are weighted
lower than transported to urban areas. These approaches contradict the idea that all humans inde-
pendent of their residence should be protected against potential impacts. Therefore, not the intake
–––––––––––––––– 1 In previous LCA studies commissioned by SIG and conducted by ifeu the contribution to the fine particulate matter
potential was calculated by summing the products of the amounts of the individual harmful substances and the re-spective PM10 equivalent. According to UBA (2016) the characterisation factors of De Leeuw (2002) shall now be related to PM 2.5 equivalent. This recommendation is based on the respective guidelines of WHO (2005): It states that the fraction 2.5 is mainly responsible for toxic effects.

22 ifeu Life Cycle Assessment of SIGNATURE PACK – Addendum Netherlands
potential, but the formation potential is applied for the impact category particulate matter. In refer-
ence to the functional unit, the unit for Particulate Matter is kg PM 2.5-e/fu.
Note on human toxicity: The potential impacts of particulate matter on human health are part of the
often addressed impact category “human toxicity”. But, a generally accepted approach covering the
whole range of toxicological concerns is not available. The inclusion of particulate matter in USEtox is
desired but not existent. In general, LCA results on toxicity are often unreliable, mainly due to incom-
plete inventories, and also due to incomplete impact assessment methods and uncertainties in the
characterisation factors. None of the available methods is clearly better than the others, although
there is a slight preference for the consensus model USEtox. Based on comparisons among the differ-
ent methods, the USEtox authors employ following residual errors (RE) related to the square geomet-
ric standard deviation (GSD²):
Characterisation factor GSD²
Human health, emission to rural air 77
Human health, emission to freshwater 215
Human health, emission to agricultural soil 2,189
Freshwater ecotoxicity, emission to rural air 176
Freshwater ecotoxicity, emission to freshwater 18
Freshwater ecotoxicity, emission to agricultural soil 103
Figure 5: Model uncertainty estimates for USEtox characterisation factors (reference: [Rosenbaum et al. 2008])
To capture the 95% confidence interval, the mean value of each substance would have to be divided
and multiplied by the GSD². To draw comparative conclusions based on the existing characterisation
models for toxicity categories is therefore not possible.

ifeu Life Cycle Assessment of SIGNATURE PACK – Addendum Netherlands 23
Table 1.1: Examples of elementary flows and their classification to emission related impact categories
Impact categories Elementary flow examples Unit
Climate Change CO2* CH4** N2O C2F2H4 CF4 CCl4 C2F6 HCFC-22 kg CO2-e
Stratospheric
Ozone Depletion
CFC-11 N2O HBFC-123 HCFC-22 Halon-
1211
Methyl
Bromide
Methyl
Chloride
CCl4 kg CFC-11-e
Photo-Oxidant
Formation
CH4 NMVOC Benzene Formal-
dehyde
Ethyl acetate
VOC TOC Ethanol kg O3-e
Acidification NOx NH3 SO2 TRS*** HCl H2S HF kg SO2-e
Terrestrial Eutro-
phication
NOx NH3 SOx kg PO4-e
Aquatic Eutrophi-
cation
COD N NH4+
NO3-
NO2-
P kg PO4-e
Particulate matter PM2.5 SO2 NOX NH3 NMVOC kg PM2.5-e
* CO2 fossil and biogenic / ** CH4 fossil and CH4 biogenic included / *** Total Reduced Sulphur
Impact categories related to the use/consumption of resources
Abiotic resource depletion (ADP)
Abiotic resource depletion (ADP)
This category covers the extraction of minerals and fossil fuels. The characterisation model is based
on reserves and the rate of de-accumulation, the indicator being the depletion of the ultimate re-
serve in relation to annual use. Results are presented in kg Sb-e/fu.
The latest developed method by CML [CML 2013] to separate ADP into two single impact categories,
one for fossil resource depletion is not applied as the authors think that this leads to two separate
impact indicators to assess an environmental impact with the same area of protection which should
be avoided. Therefore the previous CML method without separating ADP in two categories is applied.
Table 1.2: Examples of elementary flows and their classification to resource related impact category
Impact categories Elementary flow examples Unit
ADP Crude oil Natural gas Hard coal Soft coal Al Ab Fe kg Sb-e
A note on use of nature:
Regarding the assessment of ‘use of nature’ (often referred to as land use) several methodological
approaches have emerged in recent years. In the authors’ view none of these achieve to deliver ro-
bust assessment results on the basis of the limited land use data available. Therefore no assessment

24 ifeu Life Cycle Assessment of SIGNATURE PACK – Addendum Netherlands
of the use of nature is included in this study. A presentation at the inventory level is not considered
helpful, as non-characterised area of land does not give any indication on actual environmental im-
pact.
Additional categories at the inventory level
Inventory level categories differ from impact categories to the extent that no characterisation step using characterisation factors is used for assessment.
Primary Energy (Cumulative Energy Demand)
The total Primary Energy Demand (CED total) and the non-renewable Primary Energy Demand (CED non-renewable) serve primarily as a source of information regarding the energy intensity of a system.
Total Primary Energy (Cumulative Energy Demand, total)
The Total Cumulative Energy Demand is a parameter to quantify the primary energy consumption of a system. It is calculated by adding the energy content of all used fossil fuels, nuclear and renewable energy (including biomass). This category is described in [VDI 1997] and has not been changed con-siderably since then. It is a measure for the overall energy efficiency of a system, regardless the type of energy resource which is used. The unit for Total Primary Energy is MJ/fu.
Non-renewable Primary Energy (Cumulative Energy Demand, non-renewable)
The category non-renewable primary energy (CED non-renewable) considers the primary energy con-sumption based on non-renewable, i.e. fossil and nuclear energy sources. The unit for Non-renewable Primary Energy is MJ/fu.
Table 1.3: Examples of elementary flows and their classification to inventory level categories
Categories at inventory level Elementary flow examples Unit
Total Primary Energy hard coal brown coal uranium
ore
hydro ener-
gy
solar
energy
wind
energy
biomass MJ
crude oil natural gas
Non-renewable Primary
Energy
hard coal brown coal crude oil natural gas uranium ore MJ

ifeu Life Cycle Assessment of SIGNATURE PACK – Addendum Netherlands 25
2 Packaging systems and scenarios
The Packaging systems examined in this study are:
a. cb3 1000 EcoPlus with combiCap opening - a beverage carton with LDPE and PA as additional barrier materials, it does not contain al-uminium foil. Its closure is made from PP.
b. cb3 1000 SIGNATURE PACK 100% with combiCap opening containing mass balance polymers - a beverage carton with the same specifications as the cb3 1000 EcoPlus apart from the source of polymers. It contains mass balance based LDPE and PP. Its closure is made from mass balance based PP.
c. cb3 1000 Standard with combiSwift opening - a beverage carton with LDPE and aluminium as additional barrier materials. Its closure is made from PP and HDPE.
d. cb3 1000 SIGNATURE PACK high barrier with combiSwift opening containing mass balance polymers - a beverage carton with the same specifications as the cb3 1000 Standard apart from the source of polymers. It contains mass balance based LDPE . Its closure is made from mass bal-ance based PP and HDPE.
In general terms packaging systems can be defined based on the primary, secondary and tertiary packaging elements they are made up of. The composition of each of these individual packaging ele-ments and their components’ masses depend strongly on the function they are designed to fulfil, i.e. on requirements of the filler and retailer as well as the distribution of the packaged product to the point-of-sale. Main function of the examined primary packaging is the packaging and protection of milk. The packaging protects the filled products’ freshness, flavours and nutritional qualities during transportation, whilst on sale and at home. All examined packaging systems are considered to achieve this.
All packaging systems examined in this study are presented in the following sections (2.1), including the applied end-of-life settings (2.2). Section 2.3 gives an overview of all regarded scenarios.

26 ifeu Life Cycle Assessment of SIGNATURE PACK – Addendum Netherlands
2.1 Packaging specifications Table 2.1: Packaging specifications
Packaging components cb3 1000 EcoPlus w/ cCap
cb3 1000 SIGNATURE PACK 100% w/ cCap
cb3 1000 Standard w/ cSwift
cb3 1000 SIGNATURE PACK
high barrier w/ cSwift
volume 1000 mL 1000 mL 1000 mL 1000 mL
primary packaging (sum per carton) 29.7g 29.7 g 30.3 g 30.3 g
composite material (sleeve) 27.7 g 27.7 g 27.6 g 27.6 g
- liquid packaging board 22.9 g 22.9 g 20.3 g 20.3 g
- LDPE 4.24 g 5.93 g
- ISCC Plus mass balanced green LDPE 4.24 g 5.93 g
- aluminium 1.36 g 1.36 g
- PA 0.51 g
- CMS71 mass balanced green PA 0.51 g
closure 2.01 g 2.01 g 2.71 g 2.71 g
- PP spout 1.41 g - ISCC Plus mass balanced green PP 1.41 g
- HDPE cap 1.30 g - ISCC Plus mass balanced green HDPE 1.30 g
- PP cap 2.01 g - ISCC Plus mass balanced green PP 2.01 g
Secondary packaging (tray) 134g 134g 134 g 134 g
Tertiary packaging (sum) 20,627 g 20,627 g 20,627 g 20,627 g
pallet 20,000 g 20,000 g 20,000 g 20,000 g
type of pallet (trip rate 25) EURO EURO EURO EURO
Stretch foil per pallet (LDPE) 627 g 627 g 627 g 627 g
Pallet configuration
Cartons per tray 12 12 12 12
Trays per pallet 12 12 12 12
Layers per pallet 5 5 5 5
Cartons per pallet 720 720 720 720

ifeu Life Cycle Assessment of SIGNATURE PACK – Addendum Netherlands 27
Table 2.1 shows the packaging specifications of the examined packaging. It shows that the specifica-
tions of cb3 1000 EcoPlus w/ cCap and cb3 1000 SIGNATURE PACK 100% w/ cCap, and those of cb3
1000 Standard w/ cSwift and cb3 1000 SIGNATURE PACK high barrier w/ cSwift repectively are very
similar.
Liquid packaging board, aluminium, the masses of all components, secondary packaging and pallet
configuration are the same for the compared packs. Also the mass of the used polymers does not
show any difference between the compared packs. The only difference lies in the kind of polymer
that is used. While cb3 1000 EcoPlus w/ cCap and cb3 1000 Standard w/ cSwift contain only “conven-
tional” fossil-based polymers the two SIGNATURE PACKS utilise polymers that are linked to renewable
resources via the mass balance approach.
These polymers are produced by using both, fossil and biogenic resources as input materials for the
same production process. In practice the input of biogenic materials (in this case tall-oil , a by-product
of paper production processes) to the polymerisation process is done at the same production process
where mainly fossil based ethylene and naphta is used. This leads to only one final product per pro-
duction process which is neither 100% fossil-based nor 100% bio-based material. To allocate the spe-
cific characteristics of fossil-based or bio-based input materials to the final product the producers
declare a certain share of their pro-duction as linked to renewable resources. That share, of course is
dependent on the share of bio-genic input material.
It is important to understand that in reality (in a physical sense) the (C2H4)n and (C3H6)n molecules
of the tall oil based polymers are in fact mainly non bio-based, as the share of bio-based ethylene is
below 1% of the total production. But as the polymers in the SIGNATURE PACKS are the ones to which
the tall-oil input is allocated to, they are modelled as if they would be 100% tall-oil based for the pur-
pose of this study. The allocation of inputs is certified by ISCC PLUS (International Sustainability &
Carbon Certification) [ISSC 2018] and CMS 71 (TÜV SÜD certification standard) [TÜV SÜD 2017] re-
spectively.
2.2 End-of-life
For each packaging system regarded in the study, a base scenario is modelled and calculated assum-ing an average recycling rate for post-consumer packaging for the Netherlands.
The applied collection quota of 41.2 % is based on the recovery quota of 37% obtained from [HEDRA 2016]. 57% of used beverage cartons collected for recycling are recycled in the Netherlands. The re-maining 43% are recycled in Germany [HEDRA 2016].
According to [EUROSTAT 2017] used beverage cartons that are not collected for recycling are inciner-ated in MSWI plants (97.08%) or landfilled (2.92%).
28 ifeu Life Cycle Assessment of SIGNATURE PACK – Addendum Netherlands
2.3 Scenario modelling
2.3.1 Base scenarios
For each of the studied packaging systems a base scenario for the Dutch market is defined, which is intended to reflect the most realistic situation under the described scope.
In the base scenarios the allocation factor applied for open-loop-recycling is 50%.
2.3.2 Sensitivity analysis with focus on the allocation factor
In the base scenarios of this study open-loop allocation is performed with an allocation factor of 50%.
Following the ISO norm’s recommendation on subjective choices, a sensitivity analysis is conducted in
this study to verify the influence of the allocation method on the final results. For that purpose, an
allocation factor of 100% will be applied in a ‘sensitivity analysis 100’ .

ifeu Life Cycle Assessment of SIGNATURE PACK – Addendum Netherlands 29
3 Life cycle inventory
Data on processes for packaging material production and converting were either collected in cooper-
ation with the industry or taken from literature and the ifeu database. Concerning background pro-
cesses (energy generation, transportation as well as waste treatment and recycling), the most recent
version of ifeu’s internal, continuously updated database was used. Table 2.1 gives an overview of
important datasets applied in the current study.
Table 2.1: Overview on inventory/process datasets used in the current study
Material / Process step Source Reference
period
Geographic scope
Plastics
PP Plastics Europe, published online April 2014 2011 Europe
HDPE Plastics Europe, published April 2014 2011 Europe
LDPE Plastics Europe, published April 2014 2011 Europe
PA 6 From producer, confidential 2015 Europe
Bio-PE (mass balance) Based on information provided by SIG Combibloc, litera-ture and ifeu database
2016 Finland/Europe
Bio-PP (mass balance) Based on information provided by SIG Combibloc, litera-ture and ifeu database
2016 Finland/Europe
Bio-PA 6 (mass balance) Based on information provided by SIG Combibloc & literature data and ifeu database
2016 Finland/Europe
Board
Corrugated cardboard [FEFCO 2012] 2012 Europe
Liquid packaging board ifeu data, obtained from ACE [ACE 2012] 2009 Finland/Sweden
Converting
BC converting SIG Combibloc 2009 Europe
Injection moulding of caps
SIG Combibloc 2009 Europe
Filling
Filling of beverage
cartons
Data provided by SIG Combibloc 2014 Europe
Recovery
Beverage carton recyc-ling
ifeu database, based on data from various European recycling plants
2008 Europe
Background data
electricity production, Finland & Sweden,
ifeu database, based on statistics and power plant mod-els
2012 Sp.

30 ifeu Life Cycle Assessment of SIGNATURE PACK – Addendum Netherlands
Material / Process step Source Reference
period
Geographic scope
Netherlands, Europe and Germany
municipal waste incine-ration
ifeu database, based on statistics and incineration plant models
2008 Netherlands
lorry transport ifeu database, based on statistics and transport models, emission factors based on HBEFA 3.1 [INFRAS 2010].
2009 Europe
rail transport [EcoTransIT 2010] 2010 Europe
sea ship transport [EcoTransIT 2010] 2010 Europe
3.1 Manufacture of plastic raw materials
The following plastics are used within the packaging systems under study:
3.1.1 Polypropylene (PP)
Polypropylene (PP) is produced by catalytic polymerisation of propylene into long-chained polypro-pylene. The two important processing methods are low pressure precipitation polymerisation and gas phase polymerisation. In a subsequent processing stage the polymer powder is converted to granu-late using an extruder. The present LCA study utilises data published by Plastics Europe [PlasticsEurope 2014a]. The dataset covers the production of PP from cradle to the polymer factory gate. The polymerisation data refer to the 2011 time period and were acquired from a total of 35 polymerisation plants producing. The total PP production in Europe (EU27+2) in 2011/2012 was 8,500,000 tonnes. The Plastics Europe data set hence represented 77% of PP production in Europe.
3.1.2 Low Density Polyethylene (LDPE)
Low density polyethylene (LDPE) is manufactured in a high pressure process and contains a high number of long side chains. The present LCA study uses the ecoprofile published on the website of Plastics Europe [Plastics Europe 2014b]. The data set covers the production of LDPE granulates from the extraction of the raw materials from the natural environment, including processes associated with this. The data refer to the 2011 time period. Data were acquired from a total of 22 participating polymerisation units. The data set repre-sent 72% of LDPE production in Europe (EU27+2).
3.1.3 High Density Polyethylene (HDPE)
High density polyethylene (HDPE) is produced by a variety of low pressure methods and has fewer side-chains than LDPE. The present LCA study uses the eco-profile published on the website of Plas-tics Europe [Plastics Europe 2014b].
The dataset covers the production of HDPE-granulate from the extraction of the raw materials from the natural environment, including processes associated with this. The data refer to the 2011 time period and were acquired from a total of 21 participating polymerisation units. The data set repre-sented 68% of HDPE production in Europe (EU27+2).
3.1.4 PA 6

ifeu Life Cycle Assessment of SIGNATURE PACK – Addendum Netherlands 31
Polyamide 6 is manufactured from the precursors benzene and hydroxylamine. The present LCA study uses an ecoprofile provided by a specific supplier within Europe. The applied datset covers the production of Polyamide granulates right from the extraction of the raw materials from the natural environment, including processes associated with this. The data refer to the year 2015 and is specific for the supplier of SIG Combibloc. Due to confidentiality reason the data cannot disclosed within this study.
3.1.5 Mass balanced PE and mass balanced PP dataset based on tall oil pitch
The production processes of LDPE and PP are based on tall oil. These plastics are produced by crack-ing and polymerization of renewable diesel. The renewable diesel is based on tall oil pitch. It is a dis-tillation product of crude tall oil, gained through acidulation of black liquor soap which is a by- prod-uct of paper pulp production.
The production of tall oil pitch is modelled as described in Cashman (2015) covering the production steps kraft pulping, acidulation and distillation and their related transportation. Allocation was neces-sary in the main processes of pulping and distillation. This is done on mass basis. Because crude tall oil produced from black liquor soap is a useful output a share of the pulping burdens is assigned to the tall oil.
For kraft pulping a kraftliner pulp process based on FEFCO (2012) is used. The share of Black Liquor Soap (BLS) in kraft pulp production is 4% (Cashman et al. 2015). By applying mass allocation 4% of pulp production’s burdens are taken for BLS.
The acidulation step to produce crude tall oil from black liquor soap is modelled with the in- and out-puts of Table 2 in Cashman et al. (2015).
Tall oil pitch is only one output of the tall oil distillation process. 27% of the total output mass of all distillation products is tall oil pitch. The distillation process is modelled with the in-and outputs of Table 1b in Cashman et al. (2015). As these in- and outputs apply for the sum of all distillation prod-ucts they are multiplied in this study with the mass allocation factor of 0.27 in order to account only the burdens of the tall oil pitch production
Renewable diesel is then produced from tall oil pitch by hydrotreatment. The dataset of this process is based on the studies ifeu (2006) and Nikander (2008). Both studies provide process data of the so-called NExBTL process of Neste Oil. If two different values existed, the average of both was used. The co-products fuel gas and bio-gasoline are produced as well. Bio-gasoline is internally used as thermal energy.
Allocation was done by mass and calorific value of renewable diesel and fuel gas. Renewable diesel accounts for 93.5% of the processes in- and outputs. According to several press releases2 of Neste Oil renewable diesel based on tall oil pitch is produced in its plant in Finland. The location of the plant was therefore set accordingly.
The cracking and polymerization processes for LDPE and PP are taken from the ifeu database. They are based on data representing the average from several polymerisation units in Europe.
–––––––––––––––– 2 https://www.neste.com/en/neste-oil-uses-tall-oil-pitch-produce-traffic-fuel

32 ifeu Life Cycle Assessment of SIGNATURE PACK – Addendum Netherlands
3.1.6 Mass balanced PA 6
The applied dataset of mass balanced Nylon 6 (PA6) refers to the production of PA6 based on tall oil. At this time, there is no official LCA dataset available for this tall oil based PA6. Tall oil based PA6 is produced similar to fossil PA6. The difference is the input of distilled tall oil instead of naphta.
In this study tall oil based PA6 was preliminarily modelled as described in the following:
The dataset of fossil PA6 was extended with the processes to produce tall oil pitch. The dataset for the production of tall oil pitch is modelled as described in Cashman (2015) covering the production steps kraft pulping, acidulation and distillation and their related transportation (see also section 3.1.5).
The replaced amount of naphtha was taken into account by subtracting its impacts during the life cycle impact assessment (LCIA). The dataset used for calculating the impacts of naphtha is taken from the ecoinvent database 2.2.
The amount of naphtha needed for 1kg of PA6 was calculated based on the used oil feedstock in MJ for the production of 1kg of PA6 and the used oil feedstock in MJ for the production of 1kg of naph-tha [PlasticsEurope 2014] as shown in equation 1.
22.01 𝑀𝐽 𝑜𝑖𝑙 𝑓𝑒𝑒𝑑𝑠𝑡𝑜𝑐𝑘
𝑘𝑔 𝑃𝐴6
45 𝑀𝐽 𝑜𝑖𝑙 𝑓𝑒𝑒𝑑𝑠𝑡𝑜𝑐𝑘
𝑘𝑔 𝑛𝑎𝑝ℎ𝑡ℎ𝑎
= 0.489 𝑘𝑔 𝑛𝑎𝑝ℎ𝑡ℎ𝑎
𝑘𝑔 𝑃𝐴6 (1)
The corresponding amount of tall oil pitch was calculated by equating the input of naphtha with the replacing tall oil pitch based on their energy values (equations 2 to 4). For this purpose the following lower heating values were used:
Table 3.2: lower heating values of naphtha and tall oil pitch
lower heating value Reference
Naphtha 41.8 kg/MJ [IPCC 2006]
Tall oil pitch 38 kg/MJ [U.C.Y. Energy n.d.]
0.489 𝑘𝑔 𝑛𝑎𝑝ℎ𝑡ℎ𝑎
𝑘𝑔 𝑃𝐴6∗ 41
𝑀𝐽 𝑛𝑎𝑝ℎ𝑡ℎ𝑎
𝑘𝑔 𝑛𝑎𝑝ℎ𝑡ℎ𝑎= 20.45
𝑀𝐽 𝑛𝑎𝑝ℎ𝑡ℎ𝑎
𝑘𝑔 𝑃𝐴6 (2)
20.45 𝑀𝐽 𝑛𝑎𝑝ℎ𝑡ℎ𝑎
𝑘𝑔 𝑃𝐴6= 20.45
𝑀𝐽 𝑡𝑎𝑙𝑙 𝑜𝑖𝑙 𝑝𝑖𝑡𝑐ℎ
𝑘𝑔 𝑃𝐴6 (3)
20.45 𝑀𝐽 𝑡𝑎𝑙𝑙 𝑜𝑖𝑙 𝑝𝑖𝑡𝑐ℎ
𝑘𝑔 𝑃𝐴6
38 𝑀𝐽 𝑡𝑎𝑙𝑙 𝑜𝑖𝑙 𝑝𝑖𝑡𝑐ℎ
𝑘𝑔 𝑡𝑎𝑙𝑙 𝑜𝑖𝑙 𝑝𝑖𝑡𝑐ℎ
= 0.538 𝑘𝑔 𝑡𝑎𝑙𝑙 𝑜𝑖𝑙 𝑝𝑖𝑡𝑐ℎ
𝑘𝑔 𝑃𝐴6 (4)
This approach of modeling the production of tall oil based PA6 is still preliminary. Limitations exist especially by using ecoinvent data for calculating the subtracted impacts of naphtha. There is no certainty and information which data is used for the naphtha input in the fossil PA6 dataset. When official data for tall oil based PA6 is available, this preliminary approach should be cross-checked and adapted if necessary.

ifeu Life Cycle Assessment of SIGNATURE PACK – Addendum Netherlands 33
3.2 Production of liquid packaging board (LPB)
The production of liquid packaging board (LPB) was modelled using data gathered from board pro-ducers in Sweden and Finland. It covers data from four different production sites where more than 95% of European LPB is produced. The reference year of these data is 2009. The forest model is based on [Giegrich et al. 1996].
Both data cover all process steps including pulping, bleaching and board manufacture. They were combined with data sets for the process chemicals used from IFEU´s database and ecoinvent 2.2 (based on the same datasets as those in ecoinvent 3.1), including a forestry model to calculate inven-tories for this sub-system. Energy required is supplied by electricity as well as by on-site energy pro-duction by incineration of wood and bark. The specific energy sources were taken into account.
3.3 Corrugated board and manufacture of cardboard trays
For the manufacture of corrugated cardboard and corrugated cardboard packaging the data sets pub-lished by FEFCO in 2012 [FEFCO 2012] were used. More specifically, the data sets for the manufacture of ‘Kraftliners’ (predominantly based on primary fibres), ‘Testliners’ and ‘Wellenstoff’ (both based on waste paper) as well as for corrugated cardboard packaging were used. The data sets represent weighted average values from European locations recorded in the FEFCO data (see also Table 3.3). The representativeness for Corrugated Cardboard and trays is relatively low. This data set is still con-sidered the best one available. The data refer to the year 2012.
Table 3.3 FEFCO datasets used for corrugated cardboard
Cardboard mate-rial
Publication date Reference year Representativeness
Kraftliner 2012 2012 >80%
Testliner 2012 2012 66%
Wellenstoff 2012 2012 66%
Corrugated cardboard and trays
2012 2012 38%
(221 plants)
In order to ensure stability, a fraction of fresh fibres is often used for the corrugated card-board trays. According to [FEFCO 2012] this fraction on average is 15% in Europe. Due to a lack of more specific information this split was also used for the present study.
3.4 Converting
The manufacture of composite board was modelled using data provided by the commissioner of the current study, SIG Combibloc, and refers to the year 2009. Process data has been collected from the converting site in Linnich, Germany. Due to very similar technology at other (and smaller) converting sites the collected data is considered as representative for all European converting sites by SIG.The converting process covers the lamination of LPB, LDPE and aluminium or PA respectively, printing, cutting, prefolding and packing of the composite material. The examined combibloc beverage cartons

34 ifeu Life Cycle Assessment of SIGNATURE PACK – Addendum Netherlands
are produced at European production sites of SIG Combibloc and printed with a rotogravure process. The packaging materials used for shipping of beverage carton sleeves to fillers are included in the model as well as the transportation of the package material.
Process data provided by SIG Combibloc was then coupled with required prechains, such as process heat, grid electricity, and inventory data for transport packaging used for shipping the coated compo-site board to the filler.
3.5 Closure production
The closures made of fossil and mass balanced PP and HDPE are produced by injection moulding. The data for the production were provided by SIG Combibloc and are based on values measured in SIG’s plant in Switzerland. The process data were coupled with required prechains such as the production of PE and grid electricity.
3.6 Pallet production
The manufacture of pallets was modelled using data from [ifeu 1994] and refers to the year 1991.The process data cover the required amount of wood within a saw mill for the production of timber and are combined with the respective energy prechains such as electricity grid mix and fuel oil. Energy prechain data refer to 2011. As the production of pallets has only extremely limited impact on overall results (due to their reuse, see table 2.1) the data is considered to be usable besides its early refer-ence year.
3.7 Filling
Filling processes for all examined beverage cartons are very similar in regard to material and energy flows. The respective data for this study was provided by SIG Combibloc, distinguishing between the consumption of electric and thermal energy as well as of water and air demand. A cross-check has been conducted with filling data from ifeu’s internal database, which relies on information from dif-ferent fillers and filling machine manufacturers.
3.8 Transport settings
The following Table 3.4 provides an overview of the transport settings (distances and modes) applied for packaging materials. Data were obtained from SIG Combibloc and several producers of raw mate-rials. Where no such data were available expert judgements were made, e.g. exchanges with repre-sentatives from the logistic sector and supplier.

ifeu Life Cycle Assessment of SIGNATURE PACK – Addendum Netherlands 35
Table 3.4 Transport distances and means: Transport defined by distance and mode [km/mode]
Packaging element Material producer to converter Converter to filler
HDPE, LDPE, PP granulate for all packages
500 / road
Paper board for composite board
300 / road 1200 / sea 400 / rail
Cardboard for trays
primary fibres:
500 / sea, 400 / rail, 250 / road secondary fibres: 300/road
Wood for pallets 100 / road
LDPE stretch foil 500/road (material production site = converter)
Trays 500 / road
Pallets 100 / road
Converted carton sleeves 700 / road
3.9 Distribution of filled packs from filler to point of sale
Large dairies (fillers) often serve not only regional markets. Transportation distance from filler to retailer is considered to be more closely related to the market structure than to the type of packaging used. Therefore, according to expert judgements by retailers and fillers, a transport distance of 300 km for the Netherlands has been selected in context of the present study for all types of packages examined. As this is the same number as has been used for the German scenarios in the original study, it could be argued that the total distance might be slightly lower in the Netherlands due to its higher population density. As robust data is very hard to get and the assumption is applied to all compared beverage cartons in the same way the authors chose to retain the same model.
The transport distance is implemented in the model as a two-stage delivery to retailers, where the first step indicates the transport to a central warehouse, and the second represents the delivery from a central warehouse to the supermarket (point-of-sale). In the life cycle model, environmental loads related to distribution have been allocated between beverage and packaging based on respective masses and on the degree of utilisation of the lorry. The lorry model for the 40-tonne articulated lorries is based on a 23-tonne maximum load and a maximum number of 34 pallets per lorry.

36 ifeu Life Cycle Assessment of SIGNATURE PACK – Addendum Netherlands
Table 3.5 Applied distribution distances in km for the examined packaging systems
Transport distance Vehicle type (percentage = share of distance)
fully loaded empty (=no
load)
articulated
lorry, 40 t
lorry + trailer,
40 t
lorry,
23 t
lorry,
16.5 t
Distribution – Step 1 225 km 75 km 50 % 50 % 0 % 0 %
Distribution – Step 2 75 km
60 km
34 % 0 % 33 % 33 %
Total distance 300 km 135 km
3.10 Recovery and recycling
Beverage cartons are typically positively sorted into a beverage carton fraction, which subsequently is sent to a paper recycling facility for fibre recovery. The secondary fibre material is used e.g. as a raw material for cardboard. The rejects (plastics and aluminium compounds) are assumed to be disposed in a MSWI plant or landfill. Related process data used are taken from ifeu’s internal database, refer-ring to the year 2004 and are based on data from various European recycling plants collected by ifeu.
Substitution factors
Substitution factors were used to model material recycling (where appropriate in combination with
the allocation factors). These substitution factors express the mass relation between a secondary
(recycled) material and the primary material it replaces in a (new) product. For example, a substitu-
tion factor of 0.8 (or 80%) means that 1 kg recycled (secondary) material replaces 0.8 kg primary ma-
terial, thus receiving a corresponding credit. A substitution factor < 1 also reflects so-called ‘down-
cycling’ effects which describes a recycling process in which waste materials are converted into new
materials of lesser quality.
The substitution factors used in the current LCA study to calculate the credits for recycled materials
provided for consecutive (down-stream) uses are based on expert judgments from German waste
sorting operator “Der Grüne Punkt – Duales System Deutschland GmbH” from the year 2002 [DSD
2000]
LDPE from foils: 0.94
Paper fibres
- from LPB (carton-based primary packaging): 0.9
- in cardboard trays (secondary packaging): 0.9
It could be argued that the substitution factor for paper fibres from cardboard trays may be lower
than that for LPB, because in trays mainly secondary fibres are used. As there is no robust data on
different substitution factors available, and all the examined packaging systems show the use of
the same cardboard tray, no specific factor is used for this study, though.

ifeu Life Cycle Assessment of SIGNATURE PACK – Addendum Netherlands 37
3.11 Background data
3.11.1 Transport processes
Lorry transport
The dataset used is based on standard emission data that were collated, validated, extrapolated and
evaluated for the German, Austrian and Swiss Environment Agencies (UBA Berlin, UBA Vienna and
BUWAL Bern) in the ‘Handbook of emission factors’ [INFRAS 2010]. The ‘Handbook’ is a database
application referring to the year 2009 and giving as a result the transport distance related fuel con-
sumption and the emissions differentiated into lorry size classes and road categories. Data are based
on average fleet compositions within several lorry size classes. The emission factors used in this study
refer to the year 2008. An update of the transport model is currently done at ifeu, but will not make it
into this report in time. As transport processes play only a minor role for overall results, in the view of
the authors it is justified to use the data described above.
Based on the above-mentioned parameters – lorry size class and road category – the fuel consump-
tion and emissions as a function of the transport load and distance were determined. Wherever cool-
ing during transport is required, additional fuel consumption is modelled accordingly based on data
from ifeu’s internal database.
Ship transport
The data used for the present study represent freight transport with an overseas container ship (10,5
t/TEU3) and a utilisation of capacity by 55%. Energy use is based on an average fleet composition of
this ship category with data taken from [EcoTransIT World 2011]. The Ecological Transport Infor-
mation Tool (EcoTransIT) calculates environmental impacts of any freight transport. Emission factors
and fuel consumption have been applied for direct emissions (tank-to-wheel) based on [EcoTransIT
World 2011]. For the consideration of well-to-tank emissions data were taken from ifeu’s internal
database.
Rail transport
The data used for rail transport for the present study also is based on data from [EcoTransIT World
2011]. Emission factors and fuel consumption have been applied for direct emissions based on [Eco-
TransIT World 2011].
3.11.2 Electricity generation
Modelling of electricity generation is particularly relevant for the production of base materials as well
as for converting and filling processes. Electric power supply is modelled using country specific grid
electricity mixes, since the environmental burdens of power production varies strongly depending on
the electricity generation technology. The country-specific electricity mixes are obtained from a mas-
ter network for grid power modelling maintained and annually updated at ifeu as described in [IFEU
2013]. It is based on national electricity mix data by [EUROSTAT 2013]. Electricity generation is con-
sidered using Swedish and Finnish mix of energy suppliers in the year 2012 for the production of pa-
–––––––––––––––– 3 Twenty-foot Equivalent Unit
38 ifeu Life Cycle Assessment of SIGNATURE PACK – Addendum Netherlands
perboard and the European mix of energy suppliers in the year 2012 for all other processes depend-
ing on their location.
3.11.3 Municipal waste incineration
It is assumed that from the energy content in the incinerated waste, 16% is recovered as electricity
and 8% as thermal energy. Those numbers are derived from Eurostat data on amounts of waste in-
cinerated and electricity and thermal energy sold by MSWI plants. The numbers are also supported by
a report of the European Waste Incineration Plant Operators [CEWEP 2013].
In the incineration model a technical standard (especially regarding flue gas cleaning) is assumed
which complies with the requirements given by the EU incineration directive, ([EC 2000] Council Di-
rective 2000/76/EC). The model calculation considers a grid-firing with boiler system with steam tur-
bine and flue gas cleaning.
The electric energy generated in MSWI plants is assumed to substitute Ducth grid electricity. Thermal
energy recovered in MSWI plants is assumed to serve as process heat, replacing process heat gener-
ated by light fuel oil (50%) and natural gas (50%). The latter mix of energy sources is an assumption
made by ifeu, as official data regarding this aspect are not available according to the knowledge of
the authors of this study.
3.11.4 Landfill
The landfill model accounts for the emissions and the consumption of resources for the deposition of
domestic wastes on a sanitary landfill site. As information regarding an average landfill standard in
the Netherlands is currently not available, assumptions regarding the equipment with and the effi-
ciency of the landfill gas capture system (the two parameters which determine the net methane re-
covery rate) had to be made.
Besides the parameters determining the landfill standard, another relevant system parameter is the
degree of degradation of the food carton material on a landfill. Empirical data regarding degradation
rates of laminated beverage cartons are not known to be available by the authors of the present
study.
The following assumptions, especially relevant for the degradable board material, underlay the land-
fill model applied in this LCA study:
it is assumed that 20% of methane generated is actually recovered via landfill gas capture sys-
tems. This recovery rate is according to [ETC/RWM 2008] considered a maximum technically
achievable recovery rate. Also the IPCC Guideline estimates a default value of 20% methane re-
covery [IPCC 2006].
regarding the degradation of the beverage carton board under landfill conditions, it is assumed
that it behaves like coated paper-based material in general. According to [Micales and Skog
1996], 30% of paper is decomposed anaerobically on landfills
it is assumed that the degraded carbon is converted into landfill gas with 50% methane content
(by volume).
Emissions of methane from biogenic materials (e.g. during landfill) are always accounted at the inven-
tory level AND in form of GWP.

ifeu Life Cycle Assessment of SIGNATURE PACK – Addendum Netherlands 39
4 Results
In this section the results of the examined packaging systems are presented separately for the different categories in graphic form.
The following individual life cycle elements are shown in sectoral (stacked) bar charts
production and transport of liquid packaging board (‘LPB’)
production and transport of plastics and additives for beverage carton
(‘plastics for sleeve’)
converting processes of cartons (‘converting’)
production and transport of base materials for closure (‘closure’)
production of secondary and tertiary packaging: wooden pallets, LDPE shrink foil
and corrugated cardboard trays (‘transport packaging’)
filling process including packaging handling (‘filling’)
retail of the packages from filler to the point-of-sale including cooling during transport if relevant
(‘distribution’)
sorting, recycling and disposal processes (‘recycling & disposal’)
regenerative CO2 emissions from incineration of biobased materials (‘CO2 reg. (EOL)’
Secondary products (recycled materials and recovered energy) are obtained through recovery pro-cesses of used packaging materials, e.g. recycled fibres from cartons may replace primary fibres. It is assumed, that those secondary materials are used by a subsequent system. In order to consider this effect in the LCA, the environmental impacts of the packaging system under investigation are reduced by means of credits based on the environmental loads of the substituted material. The so-called 50% allocation method has been used for the crediting procedure in the base scenarios.
The credits are shown in form of separate bars in the LCA results graphs. They are broken down into:
credits for material recycling (‘credits material’)
credits for energy recovery (replacing e.g. grid electricity) (‘credits energy’)
Uptake of atmospheric CO2 during the plant growth phase (‘CO2-uptake’)
The LCA results are relative expressions and do not predict impacts on category endpoints, the ex-ceeding of thresholds, safety margins or risks. Each impact category graph includes three bars per packaging system under investigation, which illustrate (from left to right):
sectoral results of the packaging system itself (stacked bar ‘environmental burdens’)
credits given for secondary products leaving the system (negative stacked bar ‘credits’)
net results as a result of the subtraction of credits from overall environmental loads (grey bar ‘net
results’)

40 ifeu Life Cycle Assessment of SIGNATURE PACK – Addendum Netherlands
All category results refer to the primary and transport packaging material flows required for the de-livery of 1000 L beverage to the point of sale including the end-of-life of the packaging materials.
A note on significance: For studies intended to be used in comparative assertions intended to be dis-closed to the public ISO 14044 asks for an analysis of results for sensitivity and uncertainty. It’s often not possible to determine uncertainties of datasets and chosen parameters by mathematically sound statistical methods. Hence, for the calculation of probability distributions of LCA results, statistical methods are usually not applicable or of limited validity. To define the significance of differences of results an estimated significance threshold of 10% is chosen. This can be considered a common prac-tice for LCA studies comparing different product systems. It means differences ≤ 10% are considered as insignificant.
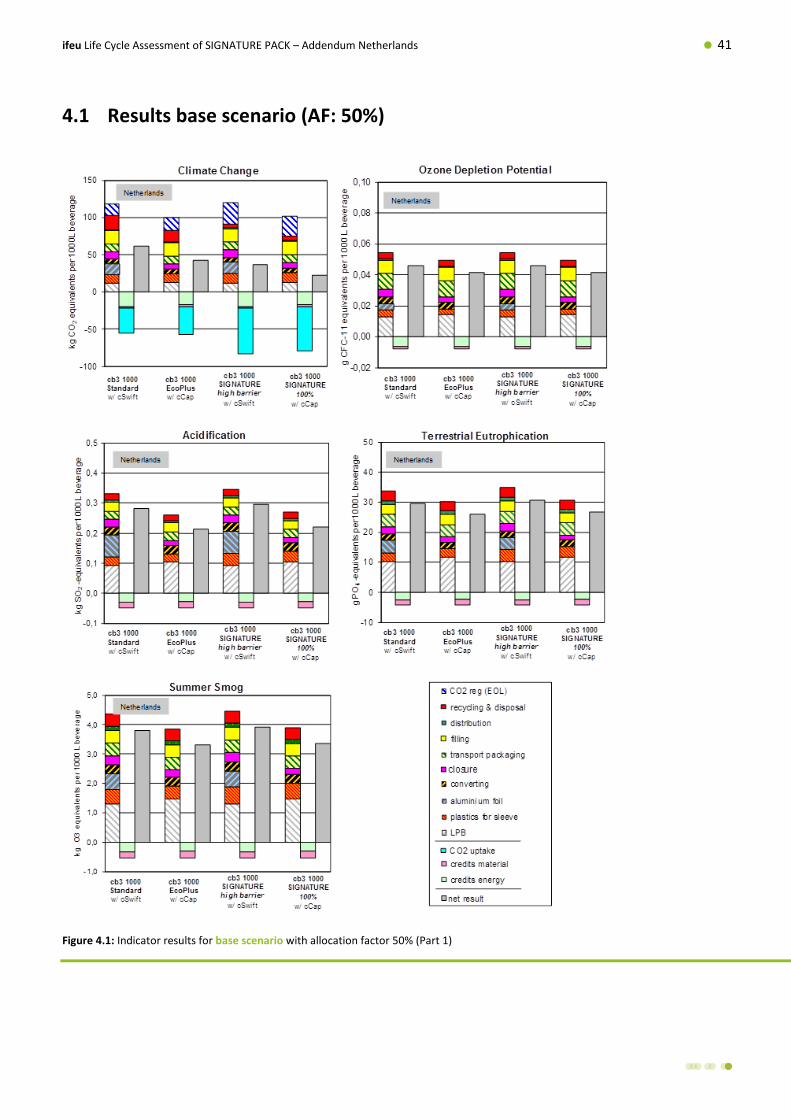
ifeu Life Cycle Assessment of SIGNATURE PACK – Addendum Netherlands 41
4.1 Results base scenario (AF: 50%)
Figure 4.1: Indicator results for base scenario with allocation factor 50% (Part 1)

42 ifeu Life Cycle Assessment of SIGNATURE PACK – Addendum Netherlands
Figure 4.2: Indicator results for base scenario with allocation factor 50% (Part 2)
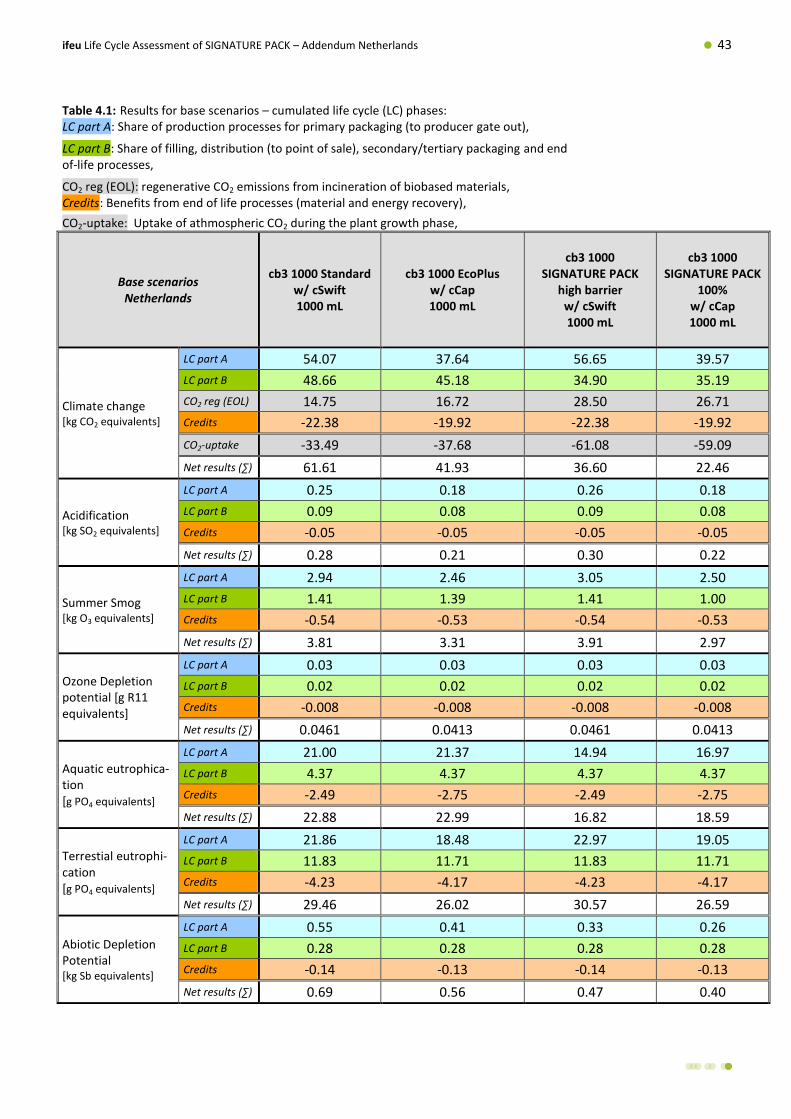
ifeu Life Cycle Assessment of SIGNATURE PACK – Addendum Netherlands 43
Table 4.1: Results for base scenarios – cumulated life cycle (LC) phases: LC part A: Share of production processes for primary packaging (to producer gate out),
LC part B: Share of filling, distribution (to point of sale), secondary/tertiary packaging and end of-life processes,
CO2 reg (EOL): regenerative CO2 emissions from incineration of biobased materials, Credits: Benefits from end of life processes (material and energy recovery),
CO2-uptake: Uptake of athmospheric CO2 during the plant growth phase,
Base scenarios Netherlands
cb3 1000 Standard w/ cSwift 1000 mL
cb3 1000 EcoPlus w/ cCap 1000 mL
cb3 1000
SIGNATURE PACK high barrier
w/ cSwift 1000 mL
cb3 1000 SIGNATURE PACK
100% w/ cCap 1000 mL
Climate change [kg CO2 equivalents]
LC part A 54.07 37.64 56.65 39.57
LC part B 48.66 45.18 34.90 35.19
CO2 reg (EOL) 14.75 16.72 28.50 26.71
Credits -22.38 -19.92 -22.38 -19.92
CO2-uptake -33.49 -37.68 -61.08 -59.09
Net results (∑) 61.61 41.93 36.60 22.46
Acidification [kg SO2 equivalents]
LC part A 0.25 0.18 0.26 0.18
LC part B 0.09 0.08 0.09 0.08
Credits -0.05 -0.05 -0.05 -0.05
Net results (∑) 0.28 0.21 0.30 0.22
Summer Smog [kg O3 equivalents]
LC part A 2.94 2.46 3.05 2.50
LC part B 1.41 1.39 1.41 1.00
Credits -0.54 -0.53 -0.54 -0.53
Net results (∑) 3.81 3.31 3.91 2.97
Ozone Depletion potential [g R11 equivalents]
LC part A 0.03 0.03 0.03 0.03
LC part B 0.02 0.02 0.02 0.02
Credits -0.008 -0.008 -0.008 -0.008
Net results (∑) 0.0461 0.0413 0.0461 0.0413
Aquatic eutrophica-tion [g PO4 equivalents]
LC part A 21.00 21.37 14.94 16.97
LC part B 4.37 4.37 4.37 4.37
Credits -2.49 -2.75 -2.49 -2.75
Net results (∑) 22.88 22.99 16.82 18.59
Terrestial eutrophi-cation [g PO4 equivalents]
LC part A 21.86 18.48 22.97 19.05
LC part B 11.83 11.71 11.83 11.71
Credits -4.23 -4.17 -4.23 -4.17
Net results (∑) 29.46 26.02 30.57 26.59
Abiotic Depletion Potential [kg Sb equivalents]
LC part A 0.55 0.41 0.33 0.26
LC part B 0.28 0.28 0.28 0.28
Credits -0.14 -0.13 -0.14 -0.13
Net results (∑) 0.69 0.56 0.47 0.40

44 ifeu Life Cycle Assessment of SIGNATURE PACK – Addendum Netherlands
(Table 4.1 continued)
Base scenarios Netherlands
cb3 1000 w/ cSwift 1000 mL
cb3 EcoPlus 1000 w/ cCap 1000 mL
cb3 1000
SIGNATURE PACK high barrier
w/ cSwift 1000 mL
cb3 1000 SIGNATURE PACK
100% w/ cCap 1000 mL
Human toxicity – PM2.5 [kg PM2.5 equivalents]
LC part A 0.22 0.17 0.24 0.17
LC part B 0.09 0.09 0.09 0.09
Credits -0.04 -0.04 -0.04 -0.04
Net results (∑) 0.27 0.21 0.28 0.22
Total primary ener-gy (PE) [GJ]
LC part A 1.93 1.62 1.44 1.26
LC part B 0.62 0.61 0.62 0.61
Credits -0.46 -0.46 -0.46 -0.46
Net results (∑) 2.08 1.77 1.59 1.41
Non-renewable PE [GJ]
LC part A 1.31 1.01 0.81 0.64
LC part B 0.53 0.53 0.53 0.53
Credits -0.28 -0.26 -0.28 -0.26
Net results (∑) 1.56 1.28 1.06 0.91
4.2 Description of results
4.2.1 Description by system
cb3 1000 Standard w/ cSwift 1000 mL
In all analysed impact/indicator categories, the major part of the environmental burdens originate from the production, provision and/or recycling of the (material) components of the beverage carton (and closure).
The LPB shows the largest contribution in the results of ‘Aquatic Eutrophication’, ‘Acidification’, ‘Ter-restrial eutrophication’, ‘Summer smog’, ‘Total primary energy demand’ and ‘Human toxicity: PM 2.5’.
For the plastic composites the highest share on the environmental loads can be observed in ‘Abiotic Depletion Potential’ and ‘Non-renewable primary energy’ demand.
The production of aluminium foil shows considerable impacts in most categories. The largest contri-butions are to ‘Climate Change’, ‘Acidification’, ‘Terrestrial eutrophication’, ‘Summer smog’ and ‘Hu-man toxicity: PM 2.5’
For the converting process low contributions to the environmental burdens can be observed in all impact and inventory categories.
The closure plays a visible role in ‘Climate Change’, ‘Abiotic Depletion Potential’, ‘Total primary energy demand’, ‘Non-renewable primary energy’ and ‘Climate change’. In the other categories the contribu-tion of the closure to the environmental burdens is of minor importance.
The transport packaging contributes to almost all examined categories.

ifeu Life Cycle Assessment of SIGNATURE PACK – Addendum Netherlands 45
The largest contribution by the filling process is observed in ‘Climate change’, ‘Abiotic Depletion Po-tential’ and ‘Total- and non-renewable primary energy’.
The recycling & disposal processes indicate a major contribution in ‘Climate change’ For the catego-ries aquatic and terrestrial eutrophication potentials and ‘Summer Smog’ the influence on the results are of less extent. Depending on the specific environmental impact/indicator level, the examined packaging systems receive credits for material and/or energy recovery in different shares.
The emission of biogenic C in the course of end-of-life processes (CO2 reg (EOL) plays a considerable role for the burdens at the environmental impact category ‘Climate Change’.
cb3 1000 EcoPlus w/ cCap 1000 mL
Throughout most analysed impact categories covered in the present study the biggest part of the environmental burdens is caused by the production of the components of the beverage carton.
The LPB accounts considerably for the burdens of the following impact and inventory categories: ‘Aquatic Eutrophication’, ‘Acidification’, ‘Summer Smog’, ‘Terrestrial Eutrophication’, ‘Human Toxicity: PM 2.5’ and ‘Total Primary Energy’.
For the plastic composites the highest share on the environmental loads can be observed in ‘Abiotic Depletion Potential’ and ‘Non-renewable primary energy’ demand.
For the converting process low contributions to the environmental burdens can be observed in all impact and inventory categories.
The closure plays a visible role in ‘Climate Change’, ‘Abiotic Depletion Potential’, ‘Total primary energy demand’, ‘Non-renewable primary energy’ and ‘Climate change’. In the other categories the contribu-tion of the closure to the environmental burdens is of minor importance.
The transport packaging contributes to almost all examined categories.
The filling process accounts to ‘Climate Change’, ‘Abiotic Depletion Potential’, ‘Terrestrial Eutrophica-tion’, ‘Acidification’, ‘Summer Smog’, ‘Human Toxicity: PM 2.5’ ,‘Non-renewable Primary Energy’ and ‘Total Primary Energy’.
The recycling & disposal process indicates a visible share in the category ‘Climate Change’. Main impact on ‘Climate Change’ comes from the uptake of carbon dioxide from the atmosphere. The emission of biogenic C in the course of end-of-life processes (CO2 reg (EOL) plays a considerable role for the burdens at the environmental impact category ‘Climate Change’.
cb3 1000 SIGNATURE PACK high barrier w/ cSwift 1000 mL
As the cb3 1000 SIGNATURE PACK high barrier w/ cSwift is identical to the cb3 1000 Standard w/ cSwift apart from the polymers, the results of all life cycle steps apart from plastics for sleeve, recy-cling & disposal, CO2 reg (EOL) and the credits are the same as for cb3 1000 Standard w/ cSwift.
Plastics for sleeves show the highest environmental loads in, ‘Human Toxicity: PM 2.5’ and ‘Summer Smog’.
The recycling & disposal process indicates a visible share in the category ‘Climate Change’. Main impact on ‘Climate Change’ comes from the uptake of carbon dioxide from the atmosphere.

46 ifeu Life Cycle Assessment of SIGNATURE PACK – Addendum Netherlands
The emission of biogenic C in the course of end-of-life processes (CO2 reg (EOL) plays a considerable role for the burdens at the environmental impact category ‘Climate Change’.
cb3 1000 SIGNATURE PACK 100% w/ cCap 1000 mL
As the cb3 1000 SIGNATURE PACK high barrier w/ cSwift is identical to the cb3 1000 EcoPlus w/ cCap apart from the polymers, the results of all life cycle steps apart from plastics for sleeve, recycling & disposal, CO2 reg (EOL) and the credits are the same as for cb3 1000 EcoPlus w/ cCap.
Plastics for sleeves show the highest environmental loads in, ‘Human Toxicity: PM 2.5’ and ‘Summer Smog’.
The recycling & disposal process indicates a visible share in the category ‘Climate Change’. Main impact on ‘Climate Change’ comes from the uptake of carbon dioxide from the atmosphere. The emission of biogenic C in the course of end-of-life processes (CO2 reg (EOL) plays a considerable role for the burdens at the environmental impact category ‘Climate Change’.
4.2.2 Comparison between systems
The following tables show comparisons of both SIGNATURE PACKS with the cb3 1000 Standard and cb3 1000 EcoPlus packs.
Table 4.2: Comparison of net results cb3 1000 SIGNATURE Pack high barrier w/ cSwift with cb3 1000 Standard w/ cSwift
RESULTS OF
cb3 1000 SIGNATURE Pack high barrier w/ cSwift
1000 mL
are LOWER
than those of
cb3 1000 Standard w/ cSwift
show
no significant differences
compared to those of
cb3 1000 Standard w/ cSwift
Climate Change
Aquatic Eutrophication
Abiotic Depletion
Total Primary Energy
Non-renewable primary energy
-41%
-27%
-32%
-24%
-32%
Summer Smog
Acidification
Ozone Depletion
Terrestrial Eutrophication
PM 2.5
+3%
+5%
±0%
+4%
+4%

ifeu Life Cycle Assessment of SIGNATURE PACK – Addendum Netherlands 47
Table 4.3: Comparison of net results cb3 1000 SIGNATURE Pack high barrier w/ cSwift with cb3 1000 EcoPlus w/ cCap
RESULTS OF
cb3 1000 SIGNATURE Pack high barrier w/ cSwift
1000 mL
are LOWER
than those of
cb3 1000 EcoPlus w/ cCap
are HIGHER
than those of
cb3 1000 EcoPlus w/ cCap
Climate Change
Aquatic Eutrophication
Abiotic Depletion
Total Primary Energy
Non-renewable primary energy
-13%
-27%
-16%
-11%
-17%
Summer Smog
Acidification
Ozone Depletion
Terrestrial Eutrophication
PM 2.5
+18%
+39%
+12%
+17%
+31%
Table 4.4: Comparison of net results cb3 1000 SIGNATURE Pack 100% w/ cCap with cb3 1000 Standard w/ cSwift
RESULTS OF
cb3 1000 SIGNATURE Pack 100% w/ cCap
1000 mL
are LOWER
than those of
cb3 1000 Standard c/Swift
are HIGHER
than those of
cb3 1000 Standard c/Swift
Climate Change
Summer Smog
Acidification
Terrestrial Eutrophication
Aquatic Eutrophication
PM 2.5
Ozone Depletion
Abiotic Depletion
Total Primary Energy
Non-renewable primary energy
-64%
-22%
-22%
-11%
-19%
-18%
-11%
-41%
-32%
-42%

48 ifeu Life Cycle Assessment of SIGNATURE PACK – Addendum Netherlands
Table 4.5: Comparison of net results cb3 1000 SIGNATURE Pack 100% w/ cCap with cb3 1000 EcoPlus w/ cCap
RESULTS OF
cb3 1000 SIGNATURE Pack 100% w/ cCap
1000 mL
are LOWER
than those of
cb3 1000 EcoPlus w/ cCap
show
no significant differences
compared to those of
cb3 1000 EcoPlus w/ cCap
Climate Change
Summer Smog
Aquatic Eutrophication
Abiotic Depletion
Total Primary Energy
Non-renewable primary energy
-46%
-11%
-19%
-28%
-20%
-29%
Acidification
Ozone Depletion
Terrestrial Eutrophication
PM 2.5
+4%
±0
+2%
+3%

ifeu Life Cycle Assessment of SIGNATURE PACK – Addendum Netherlands 49
5 Interpretation
5.1 Base scenarios
The biggest part of the environmental burdens in the beverage carton systems analysed is caused by the production of the components of the beverage carton sleeve and the closure.
For ‘Aquatic Eutrophication’ the LPB appears to be of special importance. It is also significantly rele-vant regarding ‘Acidification’, ‘Summer Smog’, ‘Terrestrial Eutrophication’, and ‘Human toxicity: PM2.5’.
The production of the paper based materials generates emissions that cause contributions to both aquatic and terrestrial eutrophication, the latter to a lesser extent. Approximately half of the aquatic eutrophication potential is caused by the high Chemical Oxygen Demand (COD). As the production of LPB causes high contributions of organic compounds into the surface water an overabundance of oxygen-consuming reactions takes place which therefore may lead to oxygen shortage in the water. In the terrestrial eutrophication potential nitrogen oxides are determined as main contributor.
For the separation of the cellulose needed for paper production from the ligneous wood fibres, the so called ‘Kraft process’ is applied, in which sodium hydroxide and sodium sulphide are used. This leads to additional emissions of SO2, thus contributing significantly to the acidifying potential.
The required energy for paper production mainly originates from recovered process internal residues (hemicellulose and lignin dissolved in black liquor). Therefore, the required process energy is mainly generated from renewable sources. That explains its relatively small influence on ‘Climate Change’.
Additionally the use of cardboard trays as secondary packaging raises the demand and the respective impacts.
The sectors plastics for sleeve and closure of the beverage cartons cb3 1000 Standard and cb3 1000
EcoPlus show considerable contributions in many impact categories. The share of plastic composites
(sleeve and closure) in the beverage cartons shows a major impact in ‘Summer Smog’ and ‘Abiotic
depletion potential’. It also causes visible effects regarding the consumption of ‘Primary energy’ (both
total and non-renewable).
The key raw material for the plastic composites originates from fossil resources (crude oil). Addition-ally, the production processes show a high energy demand. As the source for energy recovery is main-ly fossil fuels, the results show an increased consumption of ‘Non-renewable primary energy’’.
For the SIGNATURE PACKS with mass balanced plastics in sleeve and closure the direct impacts from the production is considerably lower only in the impact categories ‘Aquatic Eutrophication’ and ‘Abi-otic depletion potential’. The significant benefit to the overall net result in ‘Climate Change’ derives mainly from the additional uptake of regenerative CO2.
The end-of-life phase of the regarded beverage cartons is clearly most relevant in the impact category ‘Climate Change’. A share of the greenhouse gases (GHGs) is generated from the energy production required in the respective processes. Material recycling processes are commonly run on electricity,

50 ifeu Life Cycle Assessment of SIGNATURE PACK – Addendum Netherlands
thus this end-of-life treatment contributes directly to the result values for the impact on ‘Climate change’. When the packaging materials are incinerated in MSWI facilities, this also leads to GHG emissions. In the case of plastics made from fossil resources, the emitted CO2 is fully reflected in the results for ‘Climate change’. For the SIGNATURE PACKS, whose mass balanced plastics are considered as renewable for the purpose of modelling, the biogenic CO2 emissions from incineration are added to the separate sector CO2 reg (EOL).
5.2 Sensitivity analysis on system allocation
If an allocation factor of 100% is applied, all burdens and credits from recovery processes are allocat-ed to the examined systems. For the examined systems this leads to slightly lower net results in all regarded environmental impact categories apart from 'Climate Change'. For 'Climate Change' the benefit from receiving more credits does not outweigh the extra burdens obtained. The main reason for this are the emissions of the waste incineration plants which are now fully allocated to the exam-ined system. As regenerative CO2 emissions are accounted for 'Climate Change' in the same way as fossil CO2 emissions, no significant difference is visible between beverage cartons with mass bal-anced plastics and those without.
Although net results differ as described, the choice of system allocation factor does not change the overall ranking between the different packaging systems when compared to each other.
The result graphs for the sensitivity analysis with allocation factor 100% for all segments are present-ed on the following pages.
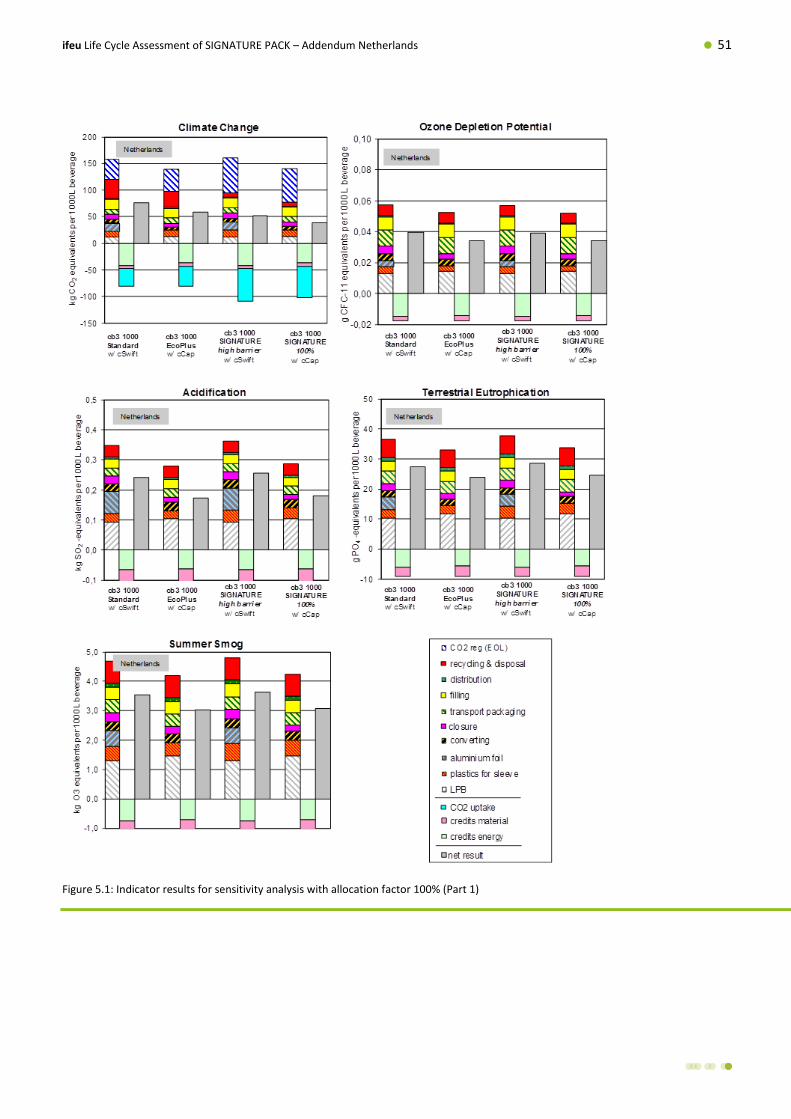
ifeu Life Cycle Assessment of SIGNATURE PACK – Addendum Netherlands 51
Figure 5.1: Indicator results for sensitivity analysis with allocation factor 100% (Part 1)

52 ifeu Life Cycle Assessment of SIGNATURE PACK – Addendum Netherlands
Figure 5.2: Indicator results for sensitivity analysis with allocation factor 100% (Part 2)

ifeu Life Cycle Assessment of SIGNATURE PACK – Addendum Netherlands 53
Table 5.1: Results for sensitivity analysis allocation factor 100%– cumulated life cycle (LC) phases: LC part A: Share of production processes for primary packaging (to producer gate out),
LC part B: Share of filling, distribution (to point of sale), secondary/tertiary packaging and end of-life processes,
CO2 reg (EOL): regenerative CO2 emissions from incineration of biobased materials, Credits: Benefits from end of life processes (material and energy recovery),
CO2-uptake: Uptake of athmospheric CO2 during the plant growth phase,
Sensitivity analysis 100% Netherlands
cb3 1000 Standard w/ cSwift 1000 mL
cb3 1000 EcoPlus w/ cCap 1000 mL
cb3 1000
SIGNATURE PACK high barrier
w/ cSwift 1000 mL
cb3 1000 SIGNATURE PACK
100% w/ cCap 1000 mL
Climate change [kg CO2 equivalents]
LC part A 54.07 37.64 56.65 39.57
LC part B 66.22 59.27 37.64 38.15
CO2 reg (EOL) 37.17 41.98 65.74 63.10
Credits -47.62 -43.01 -47.62 -43.01
CO2-uptake -33.49 -37.68 -61.08 -59.09
Net results (∑) 76.34 58.19 51.33 38.72
Acidification [kg SO2 equivalents]
LC part A 0.25 0.18 0.26 0.18
LC part B 0.10 0.10 0.10 0.10
Credits -0.11 -0.11 -0.11 -0.11
Net results (∑) 0.24 0.17 0.26 0.18
Summer Smog [kg O3 equivalents]
LC part A 2.94 2.46 3.05 2.50
LC part B 1.41 1.39 1.41 1.00
Credits -0.54 -0.53 -0.54 -0.53
Net results (∑) 3.81 3.31 3.91 2.97
Ozone Depletion potential [g R11 equivalents]
LC part A 0.03 0.03 0.03 0.03
LC part B 0.03 0.03 0.03 0.03
Credits -0.018 -0.018 -0.018 -0.018
Net results (∑) 0.0393 0.0343 0.0392 0.0343
Aquatic eutrophica-tion [g PO4 equivalents]
LC part A 21.00 21.37 14.94 16.97
LC part B 4.40 4.41 4.40 4.41
Credits -4.99 -5.49 -4.99 -5.49
Net results (∑) 20.42 20.28 14.35 15.88
Terrestial eutrophi-cation [g PO4 equivalents]
LC part A 21.86 18.48 22.97 19.05
LC part B 14.70 14.54 14.70 14.54
Credits -9.11 -9.07 -9.11 -9.07
Net results (∑) 27.44 23.95 28.55 24.53
Abiotic Depletion Potential [kg Sb equivalents]
LC part A 0.55 0.41 0.33 0.26
LC part B 0.29 0.29 0.29 0.29
Credits -0.30 -0.28 -0.30 -0.28
Net results (∑) 0.54 0.42 0.32 0.26

54 ifeu Life Cycle Assessment of SIGNATURE PACK – Addendum Netherlands
(Table 5.1 continued)
Sensitivity analysis 100% Netherlands
cb3 1000 w/ cSwift 1000 mL
cb3 EcoPlus 1000 w/ cCap 1000 mL
cb3 1000
SIGNATURE PACK high barrier
w/ cSwift 1000 mL
cb3 1000 SIGNATURE PACK
100% w/ cCap 1000 mL
Human toxicity – PM2.5 [kg PM2.5 equivalents]
LC part A 0,22 0.17 0.24 0.17
LC part B 0.11 0.11 0.11 0.11
Credits -0.10 -0.09 -0.10 -0.09
Net results (∑) 0.24 0.18 0.25 0.19
Total primary ener-gy (PE) [GJ]
LC part A 1.93 1.62 1.44 1.26
LC part B 0.63 0.63 0.63 0.63
Credits -0.97 -0.97 -0.97 -0.97
Net results (∑) 1.60 1.28 1.11 0.93
Non-renewable PE [GJ]
LC part A 1.31 1.01 0.81 0.64
LC part B 0.55 0.55 0.55 0.55
Credits -0.61 -0.57 -0.61 -0.57
Net results (∑) 1.26 0.99 0.75 0.63

ifeu Life Cycle Assessment of SIGNATURE PACK – Addendum Netherlands 55
6 Limitations, completeness and consistency
The results of the analysed packaging systems and the respective comparisons between packaging systems are valid within the framework conditions described in sections 1 and 2. The following limita-tions must be taken into account however.
Limitations arising from the selection of market segments: The results are valid only for the filling product, UHT milk. Even though carton packaging systems are common in other market segments, other filling products create different requirements towards their packaging and thus certain characteristics may differ strongly, e.g. barrier functions.
Limitations concerning packaging system specifications: The results are valid only for the examined packaging systems as defined by the specific system pa-rameters, since any alternation of the latter may potentially change the overall environmental profile.
It is not possible to transfer the results of this study to packages with other filling volumes or weight specifications.
Each packaging system is defined by multiple system parameters which may potentially alter the overall environmental profile. All packaging specifications of the carton packaging systems were pro-vided by SIG Combibloc.
To some extent, there may be a certain variation of design (i.e. specifications) within a specific pack-aging system. Packaging specifications different from the ones used in this study cannot be compared directly with the results of this study.
Limitations concerning the chosen environmental impacts and applied assessment method: The selection of the environmental categories applied in this study covers impact categories that are widely accepted within the LCA practitioner community. It should be noted that the use of other im-pact assessment methods could lead to different results. The results are valid only for the specific characterisation model used for the step from inventory data to impact assessment.
Limitations concerning the analysed categories: The results are valid only for the environmental impact categories, which were examined. They are relative expressions and do not predict impacts on category endpoints, the exceeding of thresholds, safety margins or risks.
Limitations concerning geographic boundaries: The results are valid only for the indicated geographic scope and cannot be assumed to be valid in geographic regions other than the Netherlands, even for the same packaging systems.
This applies particularly for the end-of-life settings as the mix of waste treatment routes (recycling and incineration) and specific technologies used within these routes may differ, e.g. in other coun-tries.

56 ifeu Life Cycle Assessment of SIGNATURE PACK – Addendum Netherlands
Regarding the production of tall oil based polymers the results are only valid as long as the tall oil originates from Finland as the tall oil related processes are modelled with Finnish electricity for this study.
Limitations concerning the reference period: The results are valid only for the indicated time scope and cannot be assumed to be valid for (the same) packaging systems at a different point in time.
Limitations regarding retail distances: The distances of the two transport steps – empty packaging from converter to filler and filled packs from filler to point of sale – are based on expert judgements. Individual logistic and supply chains can therefore deviate from transport distances applied.
Limitations concerning data: The results are valid only for the data used and described in this report: To the knowledge of the au-thors the data mentioned in section 3 represents the best available and most appropriate data for the purpose of this study. It is based on figures provided by the commissioner and data from ifeu’s inter-nal database.
For all packaging systems, the same methodological choices were applied concerning allocation rules, system boundaries and calculation of environmental categories.

ifeu Life Cycle Assessment of SIGNATURE PACK – Addendum Netherlands 57
7 Conclusions and Recommendations
7.1 Comparison of beverage cartons with and without mass-balanced polymers
The comparison between the cb3 1000 SIGNATURE PACK high barrier with the cb3 1000 Standard and the comparison of the cb3 1000 SIGNATURE PACK 100% with the cb3 1000 EcoPlus shows that the use of tall-oil based polymers in the sleeve and closures results into lower results for ‘Climate change’, ‘Aquatic Eutrophication’ and ‘Abiotic Depletion Potential’ and ‘Summer Smog’ in the latter comparison. It leads to no significant differences for the remaining impact categories.
A comparison of the cb3 1000 SIGNATURE PACK 100% (without aluminium foil) with the cb3 1000 Standard containing aluminium foil shows lower environmental impacts of the cb3 1000 SIGNATURE PACK 100% in all examined impact categories.
7.2 Recommendations
Based on the findings summarised in the previous sections the authors developed the following rec-ommendations:
As the environmental results of the beverage cartons are significantly influenced by the production
of its main components for the sleeve and closure - LPB, Al, PE, PA6, and PP - measures to ensure
the same functionality by the use of less material are recommended.
The substitution of fossil polymers by mass balanced polymers based on tall oil leads to lower re-
sults in some environmental impact categories including ‘Climate Change’ and no higher impacts
in any of the other categories. The implementation of polymers based on tall oil via a mass balance
system is therefore recommended.
It is also recommended to actually achieve a more significant physical share of tall oil based input
materials for the production of polymers. The utilisation and demand of mass balanced polymers
by SIG Combibloc might be a driver to do so.

58 ifeu Life Cycle Assessment of SIGNATURE PACK – Addendum Netherlands
References
[ACE 2016]: http://www.beveragecarton.eu/mediaroom/84/50/Beverage-Carton-recycling-continues-its-growth (Access November 2016)
[Carter 2010]: Carter, W. P. L.: Development of the SARC-07 Chemical Mechanism and Updated Ozone Reactivity Scales. Updated Chemical Mechanisms for Airshed Model Applications. Supplemen-tary Material. California Air Resources Board, May 2012
[Carter 2008]: Carter, W. P. L.: Estimation of the Maximum Ozone Impacts of Oxides of Nitrogen. College of Engineering Center for Environmental Research and Technology (CE-CERT) University of California, Riverside, CA, January 2008
[Casham 2015]: Cashman, S.A., Moran, K.M. & Gaglione, A.G., 2015. Greenhouse Gas and Energy Life Cycle Assessment of Pine Chemicals Derived from Crude Tall Oil and Their Substitutes. Journal of Industrial Ecology, 20(5).
[CEWEP 2013]: Confederation of European Waste-to-Energy Plants: CEWEP country report 2012-2013 – Netherlands, 2013.
CML 2002]: Guinée, J.B. (Ed.) – Centre of Environmental Science – Leiden University (CML). de Bruijn. H.. van Duin. R.. Huijbregts. M.. Lindeijer. E.. Roorda. A.. van der Ven. B.. Weidema. B.: Handbook on Life Cycle Assessment. Operational Guide to the ISO Standards, Eco-Efficiency in Industry and Science Vol. 7, Kluwer Academic Publishers.,Netherlands 2002.
[CML 2013]: CML-IA database that contains characterisation factors for life cycle impact assessment (LCIA) for all baseline characterisation methods mentioned in [CML 2002]. Database CML-IA v3.7, Institute of Environmental Sciences, Leiden University, Leiden, April 2013; http://www.cml.leiden.edu/software/data-cmlia.html
[De Leeuw 2002]: De Leeuw, F.: A set of emission categories for long-range transboundary air pollu-tion. Bilthoven 2002
[EcoTransIT 2010]: http://www.ecotransit.org (October 2010).
[EPA 1996]: AP 42 Compilation of Air Pollutant Emission Factors, Washington, D.C. 1996
[EUROSTAT 2013]: Energy – Yearly statistics 2013. Eurostat, Luxembourg, 2013 http://epp.eurostat.ec.europa.eu/portal/page/portal/eurostat/home
[EUROSTAT 2017]: Eurostat Municipal Waste, table: env_wasmun, Luxembourg,2017. http://appsso.eurostat.ec.europa.eu/nui/show.do?dataset=env_wasmun&lang=en
[FEFCO 2012]: Fédération Européenne des Fabricantes de Papiers pour Ondulé (FEFCO) and Cepi Con-tainer Board: European Database for Corrugated Board Life Cycle Studies. Brussels, 2012.
[Frischknecht 1998]: Frischknecht, R., Life Cycle Inventory Analysis for Decision-Making: Scope-dependent Inventory System Models and Context-specific Joint Product Allocation. PhD Thesis. ETH Zürich. Switzerland, 1998.
[HEDRA 2016]: Confidential data from Hergebruik Kartonnen Drankverpakkingen (HEDRA)

ifeu Life Cycle Assessment of SIGNATURE PACK – Addendum Netherlands 59
[Heijungs et al. 1992]: Heijungs, R, Guinèe, J, Lankreijer, RM, Udo de Haes, HA, Wegener, Sleeswijk Environmental life cycle assessment of products – Guide. Novem, rivm, Centre of Environmental Sci-ence (CML), Leiden, The Netherlands, October 1992
[IFEU 1994]: Franke, B. et al. Ökobilanz von Verpackungen (Teilbericht: Energie-Transport-Entsorgung), IFEU, Heidelberg, 1994.
[IFEU 2006]: Gärtner, S. et al., 2006. Final Report An Assessment of Energy and Greenhouse Gases of NExBTL, ifeu - Institute for Energy and Environmental Research Heidelberg GmbH.
[IFEU 2013]: Lauwigi, C., Fehrenbach, H.: Documentation for the UMBERTO based electricity grid model created by IFEU. 2013. http://www.ifeu.de/industrieundemissionen/pdf/Documentation Electricity Mix IFEU_version_2013.pdf
[IFEU 2014]: Markwardt, S., Wellenreuther, F.: Comparative Life Cycle Assessment of beverage car-tons combiblocSlimline and combiblocSlimline EcoPlus for UHT milk. (LCA SIG / CB-100730), July 2014
[INFRAS 2010]: HBEFA. Handbuch Emissionsfaktoren des Straßenverkehrs, Version 3.1, INFRAS. UBA Berlin, UBA Wien, BUWAL Bern, 2010.
[IPCC 2006]: Garg, A.; Kazunari, K.; Pulles, T.: 2006 IPCC Guidelines for National Greenhouse Gas In-ventories, Volume 2 Energy, Chapter 1. IGES, Japan
[IPCC 2013]: Stocker, T.F.; Qin, D.; Plattner, D.-K.; Tignor, M.; Allen, S.K.; Boschung, J.; Nauels, A.; Xia, Y.; Bex, V.; Midgley, P.M. (eds.): Climate Change 2013: The Physical Science Basis. Contribution of Working Group I to the Fifth Assessment Report of the Intergovernmental Panel on Climate Change. Cambridge University Press, Cambridge, United Kingdom and New York, NY, USA.
[ISO 14040]: Environmental management – Life cycle assessment – Principles and framework (ISO 14040:2006); German and English version EN ISO 14040:2006.
[ISO 14044]: Environmental management – Life cycle assessment – Requirements and guidelines (ISO 14044:2006); German and English version EN ISO 14044:2006.
[ISSC 2018]: https://www.iscc-system.org/process/certification-scopes/
[JRC 2016]: Environmental footprint – Update of Life Cycle Impact methods; Draft for TAB. Resources, water, land. May 2016.
[Klöpffer 1996]: Allocation rule for open-loop recycling in LCA; Klöpffer. in Int. J. LCA 1 (1) 27-32 (1996)
[Klöpffer 2007]: personal communication, November 27th, 2007
[Macedo 2008]: Macedo, I.C.; Seabra, J.E.A.; Silva, J.E.A.R.: Greenhouse gases emissions in the pro-duction and use of ethanol from sugarcane in Brazil: The 2005/2006 averages and a prediction for 2020 in Biomass and Bioenergy 32 (2008) p. 582-595. Elsevier, 2008
[Mubofu 2016]: Mubofu, E.B. Castor oil as a potential renewable resource for the production of func-tional materials. Sustainable Chemical Processes, DOI: 10.1186/s40508-016-0055-8. 2016.

60 ifeu Life Cycle Assessment of SIGNATURE PACK – Addendum Netherlands
[Nikander 2008]: Nikander, S., Greenhouse gas and energy intensity of product chain: Case transport biofuel. Helsiniki University of Technology. 2008.
[PlasticsEurope 2014a]: Eco-profiles and Environmental Product Declarations of the European Plastic Manufactures – Polypropylene (PP), PlasticsEurope, April 2014. (download May 2014 http://www.lca.plasticseurope.org/index.htm)
[PlasticsEurope 2014b]: Eco-profiles and Environmental Product Declarations of the European Plastic Manufactures – High-Density Polyethylene (HDPE), Low-Density Polyethylene (LDPE), Linear Low-Density Polyethylene (LLDPE), PlasticsEurope, April 2014. (download May 2014 http://www.lca.plasticseurope.org/index.htm)
[PlasticsEurope 2014 c]: Eco-profiles and Environmental Product Declerations of the European Plastics Manufacturers - Polyamide 6.6 (PA6.6), PlasticsEurope. April 2014. (download July 2014 http://www.lca.plasticseurope.org/index.htm)
[Plastics Europe 2005]: Boustead, I.: Eco-profiles of the European plastics Industry – Nylon 6 (PA6), data last calculated March 2005, report prepared for Plastics Europe, Brussels, 2005. (download Au-gust 2005 von http://www.lca.plasticseurope.org/index.htm)
[Posch et al. 2008]: Posch, M., Seppälä, J., Hettelingh, J.P., Johansson, M., Margni M., Jolliet, O. (2008): The role of atmospheric dispersion models and ecosystem sensitivity in the determination of characterisation factors for acidifying and eutrophying emissions in LCIA. International Journal of Life Cycle Assessment (13) pp.477–486.
[Rosenbaum et al. 2008]: Rosenbaum, R. K.; Bachmann, T. M.; Gold, L. S.; Huijbregts, M. A. J.; Jolliet, O.; Juraske, R.; Koehler, A.; Larsen,H.F.; MacLeod,M.; Margni,M.; McKone,T.E.; Payet,J.; Schuhmacher,M.; van der Meent,D.; Hauschlid,M.Z. (2008). USEtox—the UNEP-SETAC toxicity model: recommended characterisation factors for human toxicity and freshwater ecotoxicity in life cycle impact assessment. The International Journal of Life Cycle Assessment.
[Tiedemann A. 2000]: Ökobilanzen für graphische Papieren; Umweltbundesamt Texte 22/00
[TÜV SÜD 2017]: https://www.tuev-sued.de/uploads/images/1495439928171722620209/ zertifizie-rungsstandard-erneuerbare-rohstoffe.pdf
[UBA 2000]: Umweltbundesamt. Berlin (Hrsg.): Ökobilanz für Getränkeverpackungen II. Hauptteil, UBA-Texte 37/00,Berlin, 2000.
[UBA 2016a] Umweltbundesamt. Berlin (Hrsg.): Prüfung und Aktualisierung der Ökobilanzen für Ge-tränkeverpackungen. UBA-Texte 19/2016. Berlin. 2016.
[UBA 2016b]: Umweltbundesamt Dessau (Hrsg.): Aufkommen und Verwertung von Verpackungsabfäl-len im Jahr 2014. UBA-Texte 64/2016. Dessau. 2016. [U.C.Y. Energy n.d.]: Tall oil products. http://www.ucy-energy.com/english/Dateien/tall%20oil/ 120219_catalogue_tall_oil_products.pdf. U.C.Y. Energy, Alfter, Germany. (Access July 2017)
[VDI 1997]: VDI 4600: Kumulierter Energieaufwand (Cumulative Energy Demand), German and Eng-lish, VDI-Gesellschaft Energietechnik Richtlinienausschuß Kumulierter Energieaufwand, Düsseldorf 1999

ifeu Life Cycle Assessment of SIGNATURE PACK – Addendum Netherlands 61
[WHO 2005]: World Health Organization and United Nations Economic Commission for Europe: Air Quality Guidelines, Global Update 2005, Particulate matter, ozone, nitrogen dioxide and sulphur diox-ide, Copenhagen. 2006.
[WMO 2011]: WMO (World Meteorological Organization), Scientific Assessment of Ozone Depletion: 2010, Global Ozone Research and Monitoring Project–Report No. 52, 516 pp., Geneva, Switzerland, 2011.

62 ifeu Life Cycle Assessment of SIGNATURE PACK – Addendum Netherlands
8 Appendix: Critical review statement
Produkte Products
Kritische Prüfung, Prüfbericht-Nr.: 21288337_002 Critical Review, Test Report No.: 21288337_002
Seite 1 von 8 Page 1 of 8
Dokumentation zur Kritischen Prüfung
Documentation for Critical Review
On behalf of
SIG Combibloc
Critical review of
“Life Cycle Assessment of SIGNATURE PACK: a beverage carton containing polymers based
on the mass balanced renewable material approach – Addendum for the Dutch market”
was performed by:
TÜV Rheinland LGA Products GmbH
Dominik Müller
Berlin, 10th of July 2018

Produkte Products
Kritische Prüfung, Prüfbericht-Nr.: 21288337_002 Critical Review, Test Report No.: 21288337_002
Seite 2 von 8 Page 2 of 8
Dokumentation zur Kritischen Prüfung
Documentation for Critical Review
Content
1 General Information and Background of the Study
2 Standards and Criteria
3 Results of the Critical Review
3.1 Objective and Use of the Study
3.2 Used Methods in this Analysis
3.3 Used Data
3.4 Transparency and Consistency of the Study
4 Summary of the Critical Review
Literature

Produkte Products
Kritische Prüfung, Prüfbericht-Nr.: 21288337_002 Critical Review, Test Report No.: 21288337_002
Seite 3 von 8 Page 3 of 8
Dokumentation zur Kritischen Prüfung
Documentation for Critical Review
1 General Information and Background of the Study
SIG is one of the world’s leading solution providers for the food and beverage industry within the field of carton
packs and filling technology.
ifeu conducts research and provides a worldwide consultancy service in relation to all major environmental and
sustainability issues. With almost 40 years of experience, ifeu is one of the most important ecological research
institutes in Germany.
Dominik Müller (reviewer) from TÜV Rheinland LGA Products GmbH was commissioned by SIG to carry out
the critical review of “Life Cycle Assessment of SIGNATURE PACK: a beverage carton containing polymers
based on the mass balanced renewable material approach – Addendum for the Dutch market”. The study is an
amendment based on the reviewed LCA report for the provision of 1,000 litre of milk at the point of sale in four
beverage carton packaging alternatives at German and European market conditions. This addendum to the
original study aims to deliver the same information for the Dutch market. The
examined beverage cartons are the same as for the German and European markets regarded in the
original study:
- cb3 1000 EcoPlus with combiCap opening
- cb3 1000 SIGNATURE PACK 100% with combiCap opening containing mass balance polymers
- cb3 1000 Standard with combiSwift opening
- cb3 1000 SIGNATURE PACK high barrier with combiSwift opening containing mass balance polymers
Originators of the study are Frank Wellenreuther and Stefanie Markwardt (ifeu). Client and provider of process
information is Udo Felten (SIG Combibloc).
Since the present study claims to be in line with the international standards ISO 14040:2006 and ISO
14044:2006 a critical review is necessary. This has to be done in accordance with the mentioned standards,
which means the study has to be reviewed by an independent expert/s. Because the international standards
do not specify whether the critical review carried out concomitantly or a posteriori, both embodiments are in
accordance with the standards. The reviewer was commissioned after the study was finished.
A preliminary report was delivered on 22nd
of June 2018. Recommendations concerning the report and open
questions were discussed during a conference call on 2nd
of July 2018. The originators of the study have
integrated the comments afterwards and provided the final version of the report on 10th of July 2018.
The aim of the critical review is to check the reliability, transparency, relevance and representativeness of the
used methods and data in this Life Cycle Assessment (LCA) study.
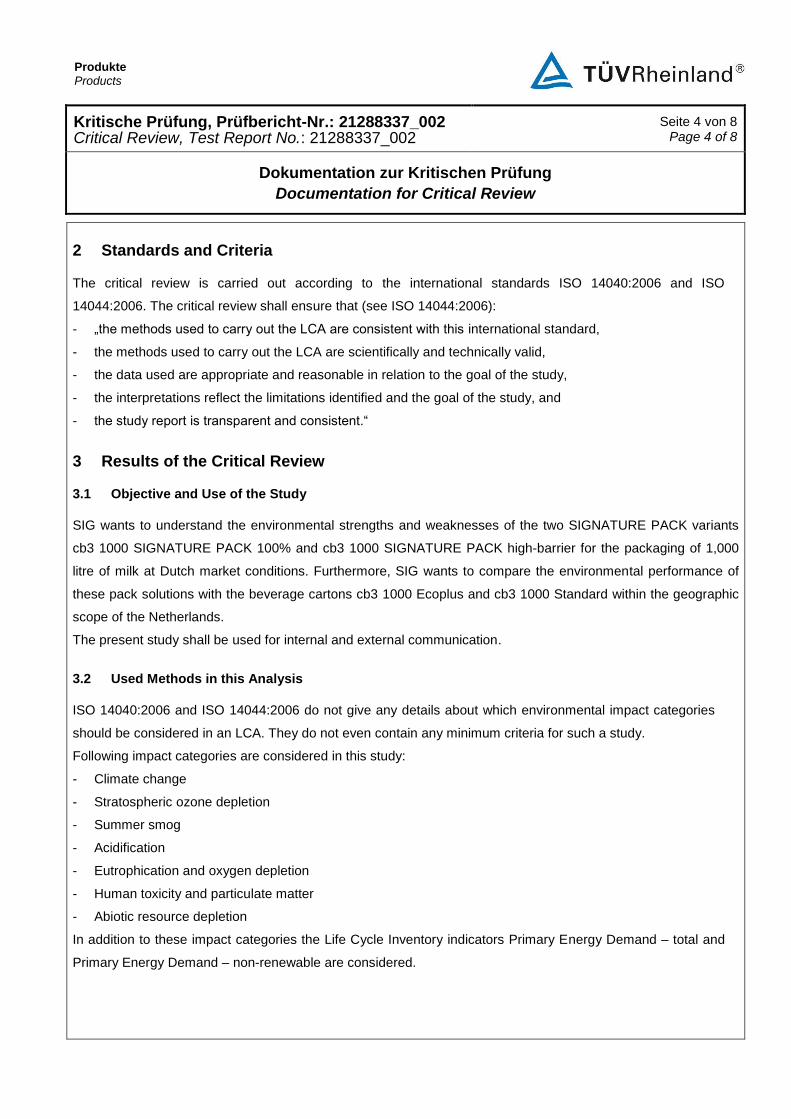
Produkte Products
Kritische Prüfung, Prüfbericht-Nr.: 21288337_002 Critical Review, Test Report No.: 21288337_002
Seite 4 von 8 Page 4 of 8
Dokumentation zur Kritischen Prüfung
Documentation for Critical Review
2 Standards and Criteria
The critical review is carried out according to the international standards ISO 14040:2006 and ISO
14044:2006. The critical review shall ensure that (see ISO 14044:2006):
- „the methods used to carry out the LCA are consistent with this international standard,
- the methods used to carry out the LCA are scientifically and technically valid,
- the data used are appropriate and reasonable in relation to the goal of the study,
- the interpretations reflect the limitations identified and the goal of the study, and
- the study report is transparent and consistent.“
3 Results of the Critical Review
3.1 Objective and Use of the Study
SIG wants to understand the environmental strengths and weaknesses of the two SIGNATURE PACK variants
cb3 1000 SIGNATURE PACK 100% and cb3 1000 SIGNATURE PACK high-barrier for the packaging of 1,000
litre of milk at Dutch market conditions. Furthermore, SIG wants to compare the environmental performance of
these pack solutions with the beverage cartons cb3 1000 Ecoplus and cb3 1000 Standard within the geographic
scope of the Netherlands.
The present study shall be used for internal and external communication.
3.2 Used Methods in this Analysis
ISO 14040:2006 and ISO 14044:2006 do not give any details about which environmental impact categories
should be considered in an LCA. They do not even contain any minimum criteria for such a study.
Following impact categories are considered in this study:
- Climate change
- Stratospheric ozone depletion
- Summer smog
- Acidification
- Eutrophication and oxygen depletion
- Human toxicity and particulate matter
- Abiotic resource depletion
In addition to these impact categories the Life Cycle Inventory indicators Primary Energy Demand – total and
Primary Energy Demand – non-renewable are considered.

Produkte Products
Kritische Prüfung, Prüfbericht-Nr.: 21288337_002 Critical Review, Test Report No.: 21288337_002
Seite 5 von 8 Page 5 of 8
Dokumentation zur Kritischen Prüfung
Documentation for Critical Review
The selected impact categories follow the requirements of the international standards ISO 14040:2006 and
ISO 14044:2006. In addition, they are in line with the defined goal and scope of the LCA study. The used
impact categories reflect a comprehensive set of environmental topics connected with the product system.
The analysis uses a life cycle approach including all relevant life cycle steps from cradle to grave.
Allocation factors have been applied on a mass basis and where appropriate have been combined with
substitution factors. The substitution factor indicates what amount of the secondary material substitutes for a
certain amount of primary material. For the base scenario a system allocation factor of 50% is chosen. This
corresponds to the system allocation approaches recommended by the German Federal Environment Agency.
The used allocation methods in this study are state of the art and seem to be appropriate for the respective
processes.
Sensitivity and scenario analysis are an accepted procedure to determine the effect of changes in data and
choice of the methodological approach. The following scenario was considered in the study:
- In the base scenarios of this study open-loop allocation is performed with an allocation factor of 50%.
Following the ISO standards recommendation on subjective choices, a sensitivity analysis is
conducted in this study to verify the influence of the allocation method on the final results. For that
purpose, an allocation factor of 100% was applied in a ‘sensitivity analysis 100’ for Dutch market.
The individual analysis steps are justified on scientific basis and reflect the state of the art.

Produkte Products
Kritische Prüfung, Prüfbericht-Nr.: 21288337_002 Critical Review, Test Report No.: 21288337_002
Seite 6 von 8 Page 6 of 8
Dokumentation zur Kritischen Prüfung
Documentation for Critical Review
3.3 Used Data
Data on processes for packaging material production and converting were either collected in cooperation with the
industry or taken from literature and the ifeu database. Concerning background processes (energy generation,
transportation as well as waste treatment and recycling), the most recent version of ifeu’s internal, continuously
updated database was used. The data reflect the year 2018. Secondary data were selected to be as up-to-date
as possible. Altogether the data quality of the data is high. It can be assumed that these data are appropriate.
Nonetheless, a quality check in form of a factory inspection was not performed. To ensure the traceability of data,
calculations and documentation were explained to the reviewer in detail. Thus, the data collection was examined
by the reviewer. All data seem to be sufficiently and conclusive in itself and in relation to the objective of the
study.
3.4 Transparency and Consistency of the Study
It was noted by the reviewer, that the report follows the requirements of ISO 14040:2006 and ISO
14044:2006. The ISO standards provide a framework for presenting an LCA study in a clear and
understandable way. The final report itself is coherent, legible, and clear. The results were presented
consistently and transparently. The calculation and presentation of the results are complete and
understandable. Both, the tabular and graphical representations of results are clear and comprehensible. The
explanations concerning assumptions and results are sufficient. Furthermore conclusions and
recommendations are included, which outline the most important influence factors in a reasonable and
transparent way.
Produkte Products
Kritische Prüfung, Prüfbericht-Nr.: 21288337_002 Critical Review, Test Report No.: 21288337_002
Seite 7 von 8 Page 7 of 8
Dokumentation zur Kritischen Prüfung
Documentation for Critical Review
4 Summary of the Critical Review
A critical review in accordance with the standards ISO 14040:2006 and ISO 14044:2006 was carried out for
the LCA study called " Life Cycle Assessment of SIGNATURE PACK: a beverage carton containing polymers
based on the mass balanced renewable material approach – Addendum for the Dutch market”. The present
study is on behalf of SIG Combibloc and was calculated by Frank Wellenreuther and Stefanie Markwardt
from ifeu.
All steps of the study were carried out according to the standards ISO 14040:2006 and ISO 14044:2006. They
are scientifically based and reflecting the state of the art. Results and data are consistent. Used data are
appropriate for the goal and scope of the study. Necessary recommendations for the report were discussed
during the review. The presentation of results is transparent and consistent.

Produkte Products
Kritische Prüfung, Prüfbericht-Nr.: 21288337_002 Critical Review, Test Report No.: 21288337_002
Seite 8 von 8 Page 8 of 8
Dokumentation zur Kritischen Prüfung
Documentation for Critical Review
Literature
ISO 14040:2006: International Organisation for Standardisation:
Environmental Management – Life Cycle Assessment – Principles and Framework
ISO 14044:2006: International Organisation for Standardisation:
Environmental Management – Life Cycle Assessment – Requirements and Guidelines
Berlin, 10th of July 2018
Dominik Müller Senior Sustainability Consultant