life-cycle assessment of net greenhouse-gas flux for - usda et al... · life-cycle assessment of...
TRANSCRIPT
Ecological Applications, 17(3), 2007, pp. 675–691� 2007 by the Ecological Society of America
LIFE-CYCLE ASSESSMENT OF NET GREENHOUSE-GAS FLUX FORBIOENERGY CROPPING SYSTEMS
PAUL R. ADLER,1,4 STEPHEN J. DEL GROSSO,2,3 AND WILLIAM J. PARTON3
1Pasture Systems and Watershed Management Research Unit, United States Department of Agriculture-Agricultural ResearchService, University Park, Pennsylvania 16802 USA
2Soil Plant Nutrient Research Unit, United States Department of Agriculture-Agricultural Research Service,Fort Collins, Colorado 80526 USA
3Natural Resource Ecology Laboratory, Colorado State University, Fort Collins, Colorado 80523 USA
Abstract. Bioenergy cropping systems could help offset greenhouse gas emissions, butquantifying that offset is complex. Bioenergy crops offset carbon dioxide emissions byconverting atmospheric CO2 to organic C in crop biomass and soil, but they also emit nitrousoxide and vary in their effects on soil oxidation of methane. Growing the crops requires energy(e.g., to operate farm machinery, produce inputs such as fertilizer) and so does converting theharvested product to usable fuels (feedstock conversion efficiency). The objective of this studywas to quantify all these factors to determine the net effect of several bioenergy croppingsystems on greenhouse-gas (GHG) emissions. We used the DAYCENT biogeochemistrymodel to assess soil GHG fluxes and biomass yields for corn, soybean, alfalfa, hybrid poplar,reed canarygrass, and switchgrass as bioenergy crops in Pennsylvania, USA. DAYCENTresults were combined with estimates of fossil fuels used to provide farm inputs and operateagricultural machinery and fossil-fuel offsets from biomass yields to calculate net GHG fluxesfor each cropping system considered. Displaced fossil fuel was the largest GHG sink, followedby soil carbon sequestration. N2O emissions were the largest GHG source. All croppingsystems considered provided net GHG sinks, even when soil C was assumed to reach a newsteady state and C sequestration in soil was not counted. Hybrid poplar and switchgrassprovided the largest net GHG sinks, .200 g CO2e-C�m�2�yr�1 for biomass conversion toethanol, and .400 g CO2e-C�m�2�yr�1 for biomass gasification for electricity generation.Compared with the life cycle of gasoline and diesel, ethanol and biodiesel from corn rotationsreduced GHG emissions by ;40%, reed canarygrass by ;85%, and switchgrass and hybridpoplar by ;115%.
Key words: biofuel; carbon sequestration; greenhouse gas (GHG); life-cycle assessment; nitrous oxide.
INTRODUCTION
Changes in land use and combustion of fossil fuels
have been the largest human impacts on the global
carbon cycle (Janzen 2004). Burning fossil fuels has
added tremendous quantities of carbon dioxide (CO2) to
the atmosphere; more than 400 times the earth’s current
net primary productivity were required to produce the
quantity of fossil fuels burned in 1997 (Dukes 2003). To
stabilize atmospheric CO2 at 500 ppm and prevent
doubling of the preindustrial concentration of 280 ppm,
Pacala and Socolow (2004) identified 15 carbon-mitiga-
tion strategies based on known technologies already
deployed at an industrial scale that could be scaled up;
biofuels were identified as one of the options. However,
production of biofuels requires fossil-fuel inputs and
impacts the fluxes of non-CO2 greenhouse gases.
Without a complete accounting of net greenhouse-gas
(GHG) fluxes, developing and evaluating mitigation
strategies is not possible (Robertson and Grace 2004).
The major sources of GHG fluxes associated with crop
production are soil nitrous oxide (N2O) emissions, soil
CO2 and methane (CH4) fluxes, and CO2 emissions
associated with agricultural inputs and farm equipment
operation (Robertson et al. 2000, Del Grosso et al.
2001a, West and Marland 2002). Crop systems emit
N2O directly, produced through nitrification and deni-
trification in the cropped soil, and also indirectly, when
N is lost from the cropped soil as some form other than
N2O (NOx, NH3, NO3) and later converted to N2O off
the farm. Independent of GHG accounting, NO3
leaching is also important from a water-quality perspec-
tive because it contributes to aquatic eutrophication and
can pose a health risk to humans.
Bioenergy cropping systems vary with respect to
length of the plant life cycle, yields, feedstock conversion
efficiencies, nutrient demand, soil carbon inputs, nitro-
gen losses, and other characteristics, all impacting
management operations. These factors affect the mag-
nitude of the components contributing to net GHG flux
and N loss vectors. N2O emissions and NO3 leaching
vary with amount of N fertilizer applied and the
Manuscript received 20 December 2005; revised 21 June2006; accepted 10 July 2006. Corresponding Editor: B. A.Hungate.
4 E-mail: [email protected]
675
integration of rainfall, soil temperature and texture, and
crop rotation. Soil organic carbon (SOC) sequestrationis affected by crop management decisions, which impact
the quantity and quality of crop residue added to the soiland rate of decomposition (Paustian et al. 2000, Jarecki
and Lal 2003). Crops have different requirements forfarm machinery inputs from crop planting, soil tillage,fertilizer and pesticide application, and harvest (West
and Marland 2002). Several studies have evaluated theenergy balance (Marland and Turhollow, 1991, Sha-
pouri et al. 2002, Farrell et al. 2006) and GHG fluxes(Sheehan et al. 1998, 2004, McLaughlin et al. 2002,
Heller et al. 2003, Spath and Mann 2004, Updegraff etal. 2004, Kim and Dale 2005) of specific bioenergy
crops, but there is limited information comparing arange of crops (Kim and Dale 2004b) and a need to
integrate factors contributing to the impact of land-usechange on GHG fluxes. The biogeochemistry model
DAYCENT can integrate climate, soil properties, andland use (Del Grosso et al. 2001a) and can dynamically
evaluate the impact of cropping systems on cropproduction, soil organic carbon, and trace-gas fluxes.
Ethanol and biodiesel from corn and soybean arecurrently the main biofuel crops in the United States,
but the perennial crops alfalfa, hybrid poplar, reedcanarygrass, and switchgrass have been proposed asfuture dedicated energy crops (McLaughlin et al. 2002,
Lamb et al. 2003, Lewandowski et al. 2003, Spath andMann 2004). Rotations of annual and perennial crops
are common and the diversity of individual crops willaffect GHG fluxes of the cropping system (Robertson et
al. 2000). Corn–soybean and corn–soybean–alfalfarotations are common cropping systems in Pennsylva-
nia, USA. Crop residues have also been proposed as acurrent source of biomass for energy production (Kim
and Dale 2004a) such as including corn stover (leavesand stalks of corn) harvest (Sheehan et al. 2004),
although this practice is not without controversy (Lal2005). We considered conversion of biomass to ethanol
or biodiesel and gasification of biomass for electricitygeneration for the perennial grasses and hybrid poplar
but only conversion to ethanol or biodiesel for therotations involving corn, soybean, and alfalfa. Ourobjective was to use DAYCENT (Del Grosso et al.
2001a) to model the net GHG fluxes of bioenergycropping systems in Pennsylvania for inclusion in a full
assessment of GHG emissions associated with energyproduction from crops.
METHODS
DAYCENT model description
DAYCENT is the daily time-step version of theCENTURY (Parton et al. 1994) biogeochemical model.
DAYCENT (Parton et al. 1998, Del Grosso et al. 2001a)simulates fluxes of carbon (C) and nitrogen (N) betweenthe atmosphere, vegetation, and soil. From weather
(daily maximum and minimum air temperature, precip-itation), soil-texture class, and land-use inputs, DAY-
CENT simulates crop production, soil organic-matter
changes, and trace-gas fluxes. Key submodels include
soil water content and temperature by layer, plant
production and allocation of net primary productivity
(NPP), decomposition of litter and soil organic matter
(SOC), mineralization of nutrients, N gas emissions
from nitrification and denitrification, and CH4 oxida-
tion in nonsaturated soils. Flows of C and N between
the different pools are controlled by the size of the
pools, C/N and lignin content of material, and abiotic
water/temperature controls. The ability of DAYCENT
to simulate NPP, SOC, N2O emissions, NO3 leaching,
and CH4 oxidation has been tested with data from
various native and managed systems (Del Grosso et al.
2001b, 2002, 2005). Simulated and observed grain yields
for major cropping systems in North America agreed
well with data at both the site (r2 ¼ 0.90) and regional
levels (r2 ¼ 0.66) (Del Grosso et al. 2005). The CH4
oxidation submodel correctly simulated the high uptake
rates observed in deciduous forests, the intermediate
rates observed in coniferous and tropical forests and
grasslands, and the low uptake rates observed in
cultivated soils (Del Gross et al. 2000). N2O emission
data from eight cropped sites and NO3 leaching data
from 3 cropped sites showed reasonable model perfor-
mance with r2 values of 0.74 for N2O and 0.96 for NO3
leaching (Del Grosso et al. 2005).
Model simulations
Simulations of net greenhouse-gas (GHG) fluxes using
DAYCENT were performed for the following bioenergy
crops grown in Pennsylvania: corn (Zea mays L.),
soybeans (Glycine max Merr.), alfalfa (Medicago sativa
L.), hybrid poplar (Populus spp.), reed canarygrass
(Phalaris arundinacea L.), and switchgrass (Panicum
virgatum L.). Five bioenergy cropping systems were
compared: (1) switchgrass, (2) reed canarygrass, (3)
corn–soybean rotation (2 years of corn followed by 1
year of soybeans), (4) corn–soybean–alfalfa rotation (3
years corn, 1 year soybeans, followed by 4 years of
alfalfa), and (5) hybrid poplar. Conventional and no
tillage were compared within the corn–soybean and
corn–soybean–alfalfa rotations. All simulations were for
30 years.
Daily weather data for central Pennsylvania (USA)
required to drive DAYCENT were acquired from
DAYMET. DAYMET (Thornton et al. 1997, 2000,
Thornton and Running 1999; program available online)5
generates meteorological data at 1-km2 resolution for
the United States using weather-station observations
and an elevation model. To represent central Pennsyl-
vania, weather from the 1-km2 cell that was closest to
the area-weighted geographical center of cropped land
in Centre County, Pennsylvania, was selected. Soil
properties representative of central Pennsylvania were
5 hhttp://www.daymet.org/i
PAUL R. ADLER ET AL.676 Ecological ApplicationsVol. 17, No. 3

obtained from the erosion–productivity impact calcula-
tor (EPIC, Sharpley and Williams 1990). Soil physical
properties needed for model inputs were calculated from
texture class and Saxton et al.’s (1986) hydraulic
properties calculator (available online).6 Soil texture
class was loam (30% sand, 48% silt, and 22% clay), the
mean annual air temperature was 9.28C, and total mean
annual precipitation was 111 cm.
Land-use parameters were defined for each crop,
including crop growth dynamics, N application rate,
harvest schedule, and tillage. Crop yields from DAY-
CENT simulations were calibrated using 10-year aver-
ages from agricultural statistics in Centre County,
Pennsylvania, for corn, soybeans, and alfalfa (USDA-
National Agricultural Statistics Service 2004); and for
switchgrass (Adler et al. 2006), reed canarygrass
(Cherney et al. 2003), and hybrid poplar (Walsh et al.
2003) were based on regional estimates. To minimize
erosion and maintain tolerable soil-loss limits (Nelson
2002, Sheehan et al. 2004), only 50% of the corn stover
was harvested for biofuel.
Production parameters for management of alfalfa as a
biofuel were based on Lamb et al. (2003). Only alfalfa
stems were used for production of biofuel, while leaves
were assumed separated for use as a protein source for
livestock. The quantity of alfalfa biomass for use as
biofuel was calculated by multiplying the yield from
DAYCENT by 0.5, since alfalfa stems account for
;50% of total alfalfa biomass when it is managed as a
biofuel crop (Lamb et al. 2003). Nitrogen fertilizer
application rates were 12.7 g N�m�2�yr�1 for corn, 5.6 g
N�m�2�yr�1 for switchgrass, 15.4 g N�m�2�yr�1 for reed
canarygrass with half applied in the spring and the other
after the first harvest, and 8.4 g N/m�2 in years 3, 5, 7,
and 9 for hybrid poplar. Nitrogen from soybean and
alfalfa supplemented the first year of N applied to corn
following the legume crops. In corn following soybean in
the 2-year corn–1-year soybean rotation, 3.7 of the 12.7
g N�m�2�yr�1 was assumed to come from soybeans. In
corn following alfalfa in the 3-year corn–1-year soy-
bean–4-year alfalfa rotation, 8.7 of the 12.7 g
N�m�2�yr�1 was assumed to come from alfalfa. About
one third of the N applied to corn was at planting, the
remainder was applied mid-June. Corn, soybeans, and
switchgrass were harvested in the fall annually. Alfalfa
and reed canarygrass were harvested twice annually in
late June and September. Hybrid poplar was harvested
once every 10 years. Output from DAYCENT was
compiled for above- and belowground NPP with grain
yields included separately, SOC changes, and trace-gas
fluxes.
Model outputs are sensitive to current SOC levels,
which in turn are influenced by previous vegetation
cover and land management. To acquire reasonable
modern SOC levels, about 1800 years of native
vegetation followed by tree clearing, plowing, and about
200 years of cropping were simulated. Native vegetation
was assumed to be the potential vegetation from
VEMAP (1995) analysis. Plow out was assumed to
occur in the year 1789. Historically accurate cropping
systems were simulated and improved cultivars and
fertilizer applications were introduced at appropriate
times. The simulations of the different biofuel systems
all used identical initial conditions that included the
legacy effects of 215 years of conventional tillage
cropping.
Net greenhouse-gas flux determination
Two scenarios comparing net greenhouse-gas (GHG)
fluxes for the bioenergy cropping systems were evaluat-
ed, near- and long-term net GHG emissions, including
the net GHG emissions from crop production through
energy generation or fuel use, cradle-to-grave or ‘‘well-
to-wheel’’ in life-cycle assessment terminology. The
near-term net GHG emissions were calculated as: net
greenhouse gas (GHGnet)¼ (�Cdff)þ (�DCsys)þ (6CFC)
þ (�CCH4) þ CN2O Dir þ CN2O Ind þ CChIn þ CAgMa, where
the sinks were the amount of fossil fuel (e.g., gasoline,
diesel, and coal) displaced by electricity generated from
gasification of biomass or ethanol or biodiesel (displaced
fossil-fuel C, Cdff), the change in soil organic carbon
(SOC) and belowground biomass C (change in system C,
DCsys), the amount of CO2e (carbon dioxide equivalents)
emitted from fossil fuels used in feedstock transport to
the biorefinery, conversion to biofuel, and subsequent
distribution (6feedstock-conversion C, CFC; this can be
positive or negative depending on the size of the
electricity credit for combustion of the coproduct lignin
at the biorefinery during production of ethanol from
biomass; other coproducts described below can reduce
the quantity of energy allocated to feedstock conver-
sion), and CH4 uptake by the soil (CCH4); the sources
were CO2e of direct (CN2O Dir) and indirect (CN2O Ind) N2O
emissions, CO2 emission from manufacture of chemical
inputs (CCI), and fuel used by agricultural machinery for
tillage, planting, fertilizer and pesticide application,
harvesting, and drying corn grain (CAgMa). The long-
term GHGnet assumed that DCsys was zero because soils
were equilibrated and no longer sequestering additional
C. The components for GHGnet were either from
DAYCENT output or calculated as described below.
DAYCENT outputs were used to determine Cdff, DCsys,
CN2O Dir, CN2O Ind, and CCH4for the GHGnet calculations.
All DAYCENT outputs are presented as annual means
over the entire 30-yr simulation period.
The ethanol yield for cellulosic biomass crops was
determined by multiplying the aboveground biomass by
about 90% of the theoretical ethanol yield (U.S.
Department of Energy 2006a) and ethanol yields, using
oven-dried biomass (dm) were as follows: corn stover,
381 L/Mg dm; alfalfa stem, 303 L/Mg dm; hybrid
poplar, 413 L/Mg dm; reed canarygrass, 311 L/Mg dm;
and switchgrass, 391 L/Mg dm. Yields assumed for corn6 hhttp://www.bsyse.wsu.edu/saxton/soilwateri
April 2007 677LCA OF NET GHG FLUX FOR BIOENERGY CROPS
grain ethanol were 467 L/Mg dm (Wang 2001) and from
soybean grain for biodiesel were 234 L/Mg dm (Ahmed
et al. 1994). The amount of electricity produced from
gasification of the various biomass sources was calcu-
lated from the product of yield, higher heating value of
the biomass (the energy released as heat when a
compound undergoes complete combustion with oxy-
gen), and conversion efficiency of the gasification
system. The higher heating values were determined from
literature (Miles et al. 1996, Brown 2003, Dien et al.
2006, U.S. Department of Energy 2006b) as follows:
corn stover, 18.0 MJ/kg; alfalfa stem, 18.6 MJ/kg;
hybrid poplar, 19.3 MJ/kg; reed canarygrass, 17.7
MJ/kg; and switchgrass, 18.5 MJ/kg. The conversion
efficiency of the biomass gasification system was
assumed to be the same 37.2% for all biomass sources
(Heller et al. 2004).
The quantity of fossil fuel displaced by biofuel was
calculated from either the product of biofuel yield of
ethanol or biodiesel from the bioenergy crops and the
fuel economy ratio of fossil fuel to biofuel (fuel economy
values are from Sheehan et al. [2004]) [6.75 km/L
ethanol divided by 10.3 km/L gasoline] and based on
Sheehan et al. [1998] [0.203 L diesel/bhp-h divided by
0.231 L biodiesel/bhp-h] where ‘‘bhp-h’’ means ‘‘brake
horsepower-hour’’) or the product of the quantity of
electricity generated from gasification of biomass
(megajoules of electricity per square meter) and the heat
rate of coal (3.00 MJ/MJ electricity). The heat rate is the
amount of energy required in fuel to generate 1 MJ of
electricity by the power plant and accounts for all the
electricity it consumes to operate. The lower the heat
rate, the more efficient an electrical power plant is in
turning fuel energy into electrical energy.
The quantity of greenhouse gases from the life cycle of
fossil fuel displaced by biofuel (Cdff) was calculated from
the product of the quantity of fossil fuel displaced by
biofuel (as described above) and the total emissions of
CO2, CH4, and N2O during the fossil-fuel life cycle
(based on Sheehan et al. [2004] for gasoline [;671.3 g
CO2e-C will be emitted per liter of gasoline consumed],
Sheehan et al. [1998] for diesel [;857.7 g CO2e-C will be
emitted per liter of diesel consumed], and on Heller et al.
[2004] for electricity generated from the U.S. grid
average [;74.9 g CO2e-C will be emitted per megajoule
of electricity consumed from the U.S. grid]). The DCsys
was the average annual change in SOC to a depth of 20
cm and belowground biomass C. The average annual
DCsys was calculated as the mean of annual differences
between initial and final system C levels.
The feedstock-conversion C (CFC) was determined
separately for ethanol production from corn stover and
other biomass sources and corn grain, biodiesel produc-
tion from soybean grain, and electricity generation from
biomass sources. The CFC for corn stover was calculated
to be �135.2 CO2e-C/L ethanol produced at the
biorefinery (Sheehan et al. 2004) and was applied to
the other biomass sources. The CFC for corn grain was
calculated to be 293.3 CO2e-C/L ethanol (Shapouri et al.
2002) and for soybean grain was 132.4 CO2e-C/L
biodiesel (Sheehan et al. 1998).
Various coproducts are also generated during pro-
duction of ethanol and biodiesel from crops. Coproducts
such as lignin from biomass converted to ethanol, were
already factored into CFC for biomass and was the
reason it was negative, a net generator of energy. Other
coproducts are generated, such as distiller’s dried grains
with solubles from corn grain during ethanol produc-
tion, and soy meal and glycerin from soybean grain
during biodiesel production. Since these coproducts
have a positive economic value and displace competing
products that require energy to make, energy from
production needs to be allocated to the coproducts. To
determine the amount of energy allocated to coproducts,
the displacement method was used, which credits
coproducts with the energy required to produce a
functionally equivalent quantity of the nearest substitute
(Farrell et al. 2006). The coproduct energy and emission
credits allocated to corn grain were 109.4 g CO2e-C/L
ethanol (Wang 2001) and to soybean grain were 172.3 g
CO2e-C/L biodiesel (Ahmed et al. 1994). In the future,
other coproducts will be extracted from crops at the
biorefinery and credited, thereby reducing the energy
and emissions associated with biofuel production.
Methane uptake from the soil (CCH4) was determined
from the mean annual CH4 uptake over the simulation
period with DAYCENT. CH4 uptake was converted to
CO2e by assuming that its global-warming potential is
23 times that of CO2 on a mass basis (IPCC 2001).
Two ways in which N fertilizers contribute to GHG
emissions were modeled by DAYCENT: direct N2O
emissions from the soil (CN2O Dir) and indirect N2O
emissions from offsite denitrification of NO3 and
volatilized N that is deposited offsite and converted to
N2O (CN2O Ind). The CN2O Dir was the mean annual N2O
emissions over the simulation period. To calculate
indirect N2O, we combined DAYCENT outputs for
NO3 leached and N volatilized with IPCC (1997)
methodology. IPCC (1997) methodology assumes that
2.5% of NO3-N leached is eventually denitrified to N2O-
N in water ways and that 1% of volatilized N
(NOxþNH3) is deposited on soil and converted to
N2O. N2O emissions were converted to CO2e by
assuming that its global warming potential is 296 times
that of CO2 on a mass basis (IPCC 2001). For
comparison with direct N2O emissions generated from
DAYCENT, direct N2O emissions were also determined
using the IPCC (2000) protocol and calculated by
multiplying 1.25% by the sum of N in crop residue,
aboveground N fixed by crops, and 90% of fertilizer N
applied to soils.
Fuel used by agricultural machinery for tillage,
planting, fertilizer and pesticide application, harvesting,
and drying corn grain (CAgMa) (Table 1) were deter-
mined with the following protocol. Using agricultural
machinery management data documented in the Amer-
PAUL R. ADLER ET AL.678 Ecological ApplicationsVol. 17, No. 3

TABLE 1. Fossil-fuel energy requirements and carbon dioxide emissions from agricultural machinery.
Farm operation
Conventional tillage No-till
Fuel usage(L/ha)
Energy(GJ/ha)
CO2 emissions(kg C/ha)
Fuel usage(L/ha)
Energy(GJ/ha)
CO2 emissions(kg C/ha)
Tillage
Plow 20.05 0.78 17.01 ��� ��� ���Disk 5.48 0.21 4.65 ��� ��� ���Seedbed preparation 5.15 0.20 4.37 ��� ��� ���Cultivation 5.12 0.20 4.34 ��� ��� ���
Planting
Corn planting 4.64 0.18 3.94 11.25 0.43 9.54Grain drill planting 3.57 0.14 3.03 8.53 0.33 7.24
Crop management
Fertilizer application 1.58 0.06 1.34 1.58 0.06 1.34Pesticide application 2.63 0.10 2.23 2.63 0.10 2.23Lime application 1.58 0.06 1.34 1.58 0.06 1.34
Grain crop harvest
Corn grain harvest 33.18 1.28 28.15 33.18 1.28 28.15Soybean harvest 31.33 1.21 26.59 31.33 1.21 26.59
Forage crop harvest
Alfalfa mowing
First harvest 5.09 0.20 4.32 5.09 0.20 4.32Second harvest 4.73 0.18 4.01 4.73 0.18 4.01
Alfalfa baling
First harvest 4.50 0.17 3.82 4.50 0.17 3.82Second harvest 3.05 0.12 2.59 3.05 0.12 2.59
Switchgrass mowing
Seeding year 6.64 0.26 5.63 6.64 0.26 5.63Established stand 8.65 0.33 7.34 8.65 0.33 7.34
Switchgrass baling
Seeding year 8.56 0.33 7.27 8.56 0.33 7.27Established stand 11.58 0.45 9.83 11.58 0.45 9.83
Reed canarygrass mowing
First harvest 5.29 0.20 4.49 5.29 0.20 4.49Second harvest 4.90 0.19 4.16 4.90 0.19 4.16
Reed canarygrass baling
First harvest 5.49 0.21 4.66 5.49 0.21 4.66Second harvest 3.51 0.14 2.98 3.51 0.14 2.98
Forage raking 1.11 0.04 0.94 1.11 0.04 0.94
Tree harvest
Felling 120.89 4.67 102.57 ��� ��� ���Skidding 115.85 4.48 98.30 ��� ��� ���Chipping 431.97 16.70 366.52 ��� ��� ���Herbicide (Rounduppost-harvest)�
2.63 0.10 2.23 ��� ��� ���
Post-harvest
Corn grain drying� 105.46 2.81 52.45 105.46 2.81 52.45Corn stover mowing§ 5.29 0.20 4.49 5.29 0.20 4.49Corn stover baling§ 3.51 0.14 2.98 3.51 0.14 2.98Soybean stubble mowing ��� ��� ��� 4.57 0.18 3.87
Notes: Ellipses indicate that farm operation was not used with no-till practice. Fuel usage values were determined from theAmerican Society of Agricultural Engineers standards (ASAE 2000). Fuel usage for harvest operations is dependent on crop yield(all numbers are for dry mass): corn, 5.3 Mg/ha; soybean, 2.2 Mg/ha; alfalfa (1st harvest), 3.8 Mg/ha; alfalfa (2nd harvest), 2.0Mg/ha; seeding-year switchgrass, 6 Mg/ha; established-stand switchgrass, 10 Mg/ha; reed canarygrass (1st harvest), 5 Mg/ha; reedcanarygrass (2nd harvest), 2.7 Mg/ha; mowing corn stover, 5.3 Mg/ha; baling corn stover, 2.65 Mg/ha; soybean stubble, 1 Mg/ha.
� Roundup (glyphosate) was applied after harvest of hybrid poplar.� Corn grain was dried 10 percentage points (e.g., from 25.5% to 15.5% water) with propane fuel.§ Corn ‘‘stover’’ refers to the leaves and stalks of corn.
April 2007 679LCA OF NET GHG FLUX FOR BIOENERGY CROPS
ican Society of Agricultural Engineers (ASAE) machin-
ery management standards (ASAE 2000), the integratedfarm system model (IFSM; Rotz 2004) was used to
calculate fuel use for management practices. Energy usefor the hybrid poplar harvest operation was determined
as follows: hybrid poplar were felled using a Timberjack643 H Feller Buncher (Deere and Company, Moline,Illinois, USA) and transported for processing with a
Timberjack 648 G III Single Arch Grapple Skidder(Deere and Company) (L. H. Nancarrow [Deere and
Company], personal communication), and processedusing the Peterson Pacific DDC 5000-G Delimber–
Debrancher–Chipper (Peterson Pacific Corporation,Eugene, Oregon, USA) (C. Peterson [Peterson Pacific
Corporation], personal communication; J. Goetsch[Daishowa-Marubeni International Ltd., Vancouver,
British Columbia, Canada], personal communication);Hartsough et al. 2002). The CO2 emissions associated
with the manufacture of chemical farm inputs (fertiliz-ers, limestone, herbicides, insecticides) were from West
and Marland (2002). For limestone, 50% of the C inCaCO3 applied was assumed to be emitted as CO2 (West
and McBride 2005), the rest leached from the soilprofile.
RESULTS
Crop and biofuel yield
Hybrid poplar, corn, and switchgrass had the highest
harvested biomass yields of the crops considered (Fig.1a). When considering the annualized yields of the
cropping systems, hybrid poplar and switchgrass had thehighest yields (Fig. 1c) because corn is typically grown in
rotation with soybean, which is much lower yielding.Biofuel production is directly related to crop yield but
not linearly because biomass composition affects con-version efficiency. Ethanol and biodiesel yields for the
individual crops ranged from 1.8 to 7.5 MJ�m�2�yr�1;corn (grain plus 50% stover) had the highest biofuel
yield, hybrid poplar and switchgrass were similar butabout 10–15% lower than corn, reed canarygrass was;40% lower, and alfalfa stems and soybean grain had
about 75–85% lower biofuel yields (Fig. 1b). The patternbetween crop and biofuel yield among cropping systems
was similar, with hybrid poplar comparable to switch-grass, and corn–soybean rotation, reed canarygrass,
corn–soybean–alfalfa rotation having progressively low-er yields (Fig. 1d). The electricity yields from gasification
of biomass for cropping systems were highest for hybridpoplar and switchgrass, and reed canarygrass was ;20%
lower (Table 2).The quantity of gasoline and diesel displaced by the
production of ethanol and biodiesel from croppingsystems followed the same pattern as ethanol/biodiesel
yields, but values were lower (Table 3, Fig. 1d) becausealthough the energy content of biodiesel and diesel are
similar, ethanol has about two thirds the energy contentof gasoline. The quantity of coal displaced by the
production of electricity from gasification of biomass
from cropping systems ranged from 14.7 to 18.4
MJ�m�2�yr�1 for the perennial crops (Table 2).
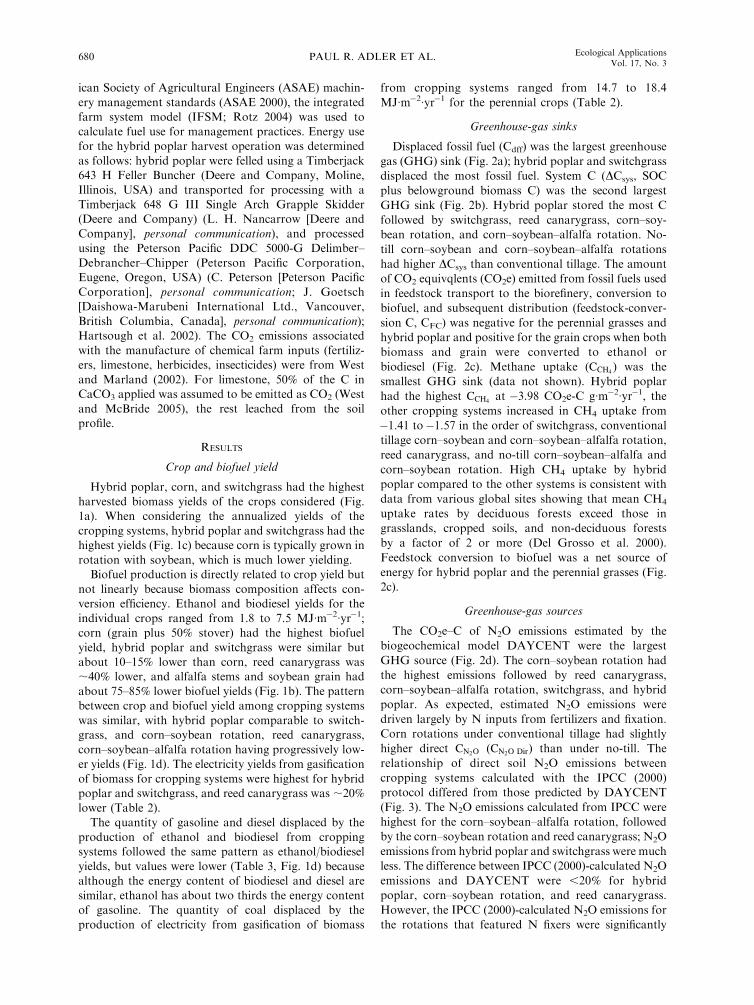
Greenhouse-gas sinks
Displaced fossil fuel (Cdff) was the largest greenhouse
gas (GHG) sink (Fig. 2a); hybrid poplar and switchgrass
displaced the most fossil fuel. System C (DCsys, SOC
plus belowground biomass C) was the second largest
GHG sink (Fig. 2b). Hybrid poplar stored the most C
followed by switchgrass, reed canarygrass, corn–soy-
bean rotation, and corn–soybean–alfalfa rotation. No-
till corn–soybean and corn–soybean–alfalfa rotations
had higher DCsys than conventional tillage. The amount
of CO2 equivqlents (CO2e) emitted from fossil fuels used
in feedstock transport to the biorefinery, conversion to
biofuel, and subsequent distribution (feedstock-conver-
sion C, CFC) was negative for the perennial grasses and
hybrid poplar and positive for the grain crops when both
biomass and grain were converted to ethanol or
biodiesel (Fig. 2c). Methane uptake (CCH4) was the
smallest GHG sink (data not shown). Hybrid poplar
had the highest CCH4at �3.98 CO2e-C g�m�2�yr�1, the
other cropping systems increased in CH4 uptake from
�1.41 to�1.57 in the order of switchgrass, conventional
tillage corn–soybean and corn–soybean–alfalfa rotation,
reed canarygrass, and no-till corn–soybean–alfalfa and
corn–soybean rotation. High CH4 uptake by hybrid
poplar compared to the other systems is consistent with
data from various global sites showing that mean CH4
uptake rates by deciduous forests exceed those in
grasslands, cropped soils, and non-deciduous forests
by a factor of 2 or more (Del Grosso et al. 2000).
Feedstock conversion to biofuel was a net source of
energy for hybrid poplar and the perennial grasses (Fig.
2c).
Greenhouse-gas sources
The CO2e–C of N2O emissions estimated by the
biogeochemical model DAYCENT were the largest
GHG source (Fig. 2d). The corn–soybean rotation had
the highest emissions followed by reed canarygrass,
corn–soybean–alfalfa rotation, switchgrass, and hybrid
poplar. As expected, estimated N2O emissions were
driven largely by N inputs from fertilizers and fixation.
Corn rotations under conventional tillage had slightly
higher direct CN2O (CN2O Dir) than under no-till. The
relationship of direct soil N2O emissions between
cropping systems calculated with the IPCC (2000)
protocol differed from those predicted by DAYCENT
(Fig. 3). The N2O emissions calculated from IPCC were
highest for the corn–soybean–alfalfa rotation, followed
by the corn–soybean rotation and reed canarygrass; N2O
emissions from hybrid poplar and switchgrass were much
less. The difference between IPCC (2000)-calculated N2O
emissions and DAYCENT were ,20% for hybrid
poplar, corn–soybean rotation, and reed canarygrass.
However, the IPCC (2000)-calculated N2O emissions for
the rotations that featured N fixers were significantly
PAUL R. ADLER ET AL.680 Ecological ApplicationsVol. 17, No. 3

higher than DAYCENT (almost 40% and .50% for the
corn–soybean–alfalfa rotation under conventional and
no-till, respectively). IPCC (2000) estimates of N2O
emissions from switchgrass are ;35% lower than DAY-
CENT. Indirect N2O emissions differed widely among
crops (combined with direct N2O emissions in Fig. 2d).
NO3 leaching, the major source of indirect emissions in
this case, ranged from ;0.5 g N�m�2�yr�1 for switchgrass,to ;1 g N�m�2�yr�1 for hybrid poplar, to .2 g
N�m�2�yr�1 for reed canarygrass and the corn rotations.
Emissions from chemical inputs were low for hybrid
poplar and switchgrass and somewhat higher for the
other cropping systems (Table 4, Fig. 2e). Emissions
from chemical inputs were high for reed canarygrass and
the corn–soybean rotation largely because N fertilizer
inputs are high for these crops.
The energy required for farm operations varied widely,
with CO2 emissions ranging from 128 kg CO2-
C�ha�1�yr�1 for corn to ,20 kg CO2-C�ha�1�yr�1 for
established alfalfa and switchgrass (Table 5). Differences
are a result of the frequency of farm implement use, the
load the equipment was under during operation, and the
required crop-specific equipment. These data are similar
to those collected by others (West andMarland 2002, Lal
FIG. 1. Crop and fuel yield from bioenergy cropping systems. Yields are expressed either as crop component (a, b) or system (c,d) yields. Corn yields assumed that only 50% of the corn stover (leaves and stalks) was harvested; alfalfa yields only containedstems, 50% of the total yield. (a) Component yields are presented; the 2-yr corn and 1-yr soybean (c2b1) rotation and 3-yr corn, 1-yrsoybean, and 4-yr alfalfa (c3b1a4) rotation yields are from the conventional-tillage system. (b) All crop components were convertedto ethanol except soybean grain, which was converted to biodiesel. (c) System yields were combined from crop rotations andannualized over the rotation cycle. (d) Crop component fuel yields of ethanol and biodiesel were combined to give system yields.
April 2007 681LCA OF NET GHG FLUX FOR BIOENERGY CROPS

2004), but the integrated farm system model (IFSM;
Rotz 2004) allowed comparison of current energy use
from agricultural machinery between all farm operations
under standardized conditions. The exception was for
hybrid poplar; since IFSM does not include forestry
operations, data from separate sources, as described
above (see Methods: Net GHG flux. . .), were used.
Perennial cropping systems can have lower agricultural
machinery inputs than annual systems thereby reducing
CaAgMa as seen in this study (Fig. 2f). The exception to
this trend is hybrid poplar because energy costs of
harvesting are high (Table 6). Propane was used to dry
corn and usually accounted for about one third of the C
emissions for the corn rotations. Tillage accounted for
almost 30% of the C emissions in the corn rotations but
less than 10% in the switchgrass and reed canarygrass
and less than 2% in hybrid poplar, where tillage was only
used the first year. Harvesting was responsible for the
majority of emissions for the hybrid poplar and perennial
grass systems and at least 30% for the corn rotations.
Feedstock conversion to biofuel was a net consumer of
energy for all the corn, soybean, and alfalfa rotations
(Fig. 2c) and was also a net consumer when the grasses
and hybrid poplar were gasified for electricity generation.
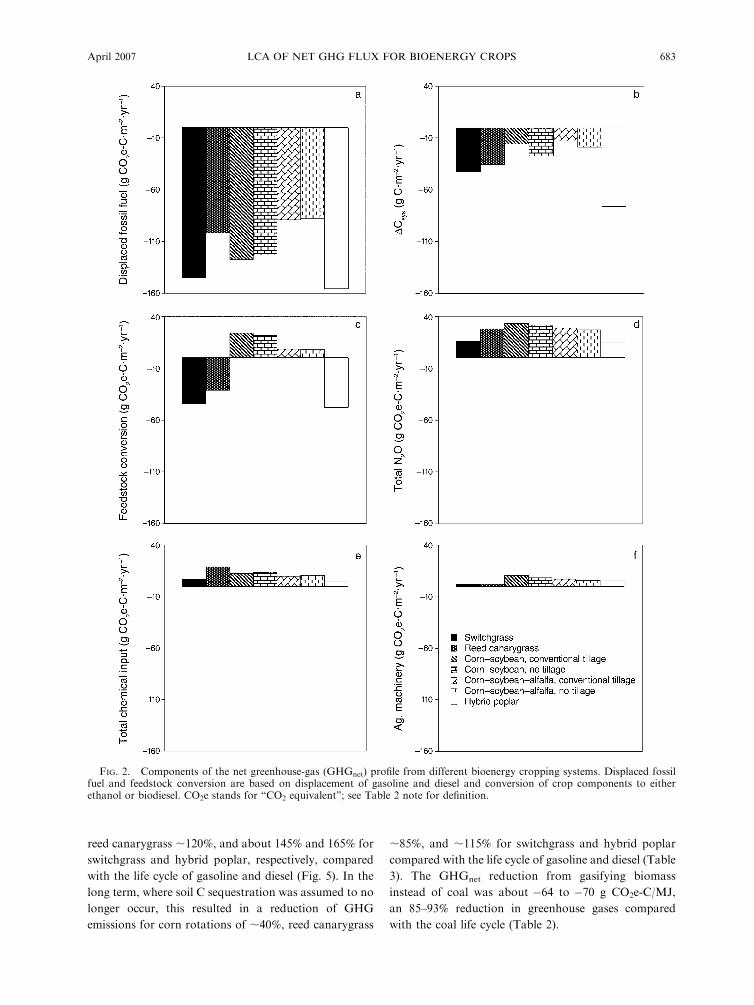
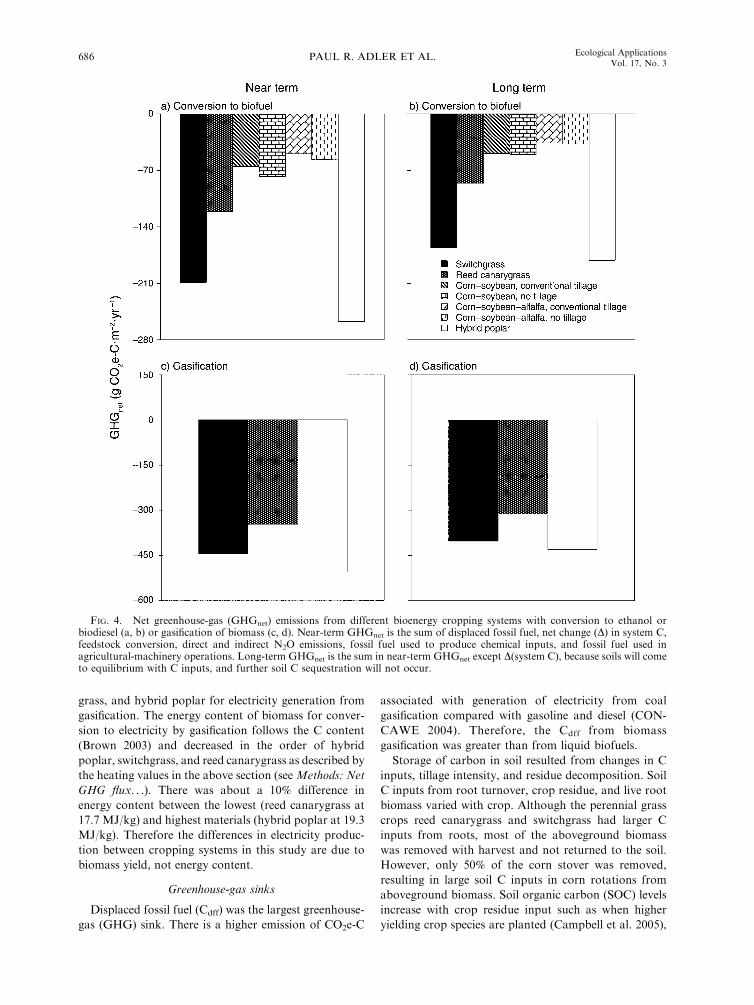
Net greenhouse-gas flux
Hybrid poplar and switchgrass provided the largest
net GHG sinks with both systems having net CO2 e-C
fluxes of less than �200 g�m�2�yr�1 for the near term
scenario when biomass and grain are converted to
ethanol and biodiesel (Fig. 4a). The sink for reed
canarygrass was about �120 g�m�2�yr��1 and the sink
for the conventional-till corn–soybean–alfalfa rotation
was the smallest at about �50 g�m�2�yr�1 for the near-
term scenario. Trends among the different cropping
systems for the long-term scenario were similar, but the
sinks were smaller because C storage in soil and
belowground biomass was considered negligible in the
long term (Fig. 4b). The sinks were even greater when
biomass was converted to electricity by gasification at
the power plant, and there was a similar relationship
among cropping systems (Fig. 4c, d). On a unit-area
basis of crop production, gasification of the grasses and
hybrid poplar yielded more than twice the GHG
reduction than did converting these crops to ethanol
(Table 2). Net GHG emissions were from about �8 to
�9 g CO2e-C/MJ ethanol for corn rotations, but about
�18 g CO2e-C/MJ for reed canarygrass and less than
�24 g CO2e-C/MJ for switchgrass and hybrid poplar
(Table 3). This resulted in a reduction of GHG emissions
for corn rotations in the near term of about 50–65%,
TABLE 2. Energy yields and greenhouse gas (GHG) emissions from gasification of biomass forproduction of electricity.
Energy and emissions parameters
Biomass Type
SwitchgrassReed
canarygrassHybridpoplar
Energy yield (MJ�m�2�yr�1) 5.80 4.90 6.15Coal displaced (MJ�m�2�yr�1) 17.4 14.7 18.4Displaced fossil fuel (g CO2e-C�m�2�yr�1) 435 367 460Net GHG emissions (%)� �93 �85 �93Net GHG emissions (g CO2e-C/MJ)� �69 �64 �70Net GHG emissions ratio (gasification : ethanol)� 2.42 3.65 2.37
Notes: Carbon dioxide equivalent (CO2e) of carbon is the common currency used forcomparison purposes. N2O emissions and CH4 uptake were converted to CO2e by assuming that itsglobal-warming potential is 296 and 23 times that of CO2 on a mass basis, respectively (IPCC2001).
� Reduction in net GHG emissions associated with using biomass gasification compared withcoal expressed either as a percentage (quotient of values in Fig. 4d divided by values above underdisplaced fossil fuel) or unit biomass energy yield (quotient of values in Fig. 4d divided by valuesabove under energy yield).
� Ratio of long-term net GHG emissions (quotient of values in Fig. 4d divided by values in 4b)displaced by gasifying biomass and substituting for coal compared to conversion to ethanol orbiodiesel and substituting for gasoline or diesel.
TABLE 3. Quantity of gasoline and diesel displaced byproduction of ethanol and biodiesel and reduction ofgreenhouse gas (GHG) emissions from life cycle of ethanoland biodiesel compared with gasoline and diesel.
Bioenergycropping system
Gasoline ordiesel displaced(MJ�m�2�yr�1)
Net GHGemissions�
(%)(g CO2e-C/MJ ethanol)
Switchgrass 6.96 �114 �23.9Reed canarygrass 4.88 �84 �17.5Corn–soybean
Conventional tillage 6.05 �38 �8.1No till 5.84 �41 �8.6
Corn–soybean–alfalfa
Conventional tillage 4.24 �41 �8.6No till 4.16 �43 �9.0
Hybrid poplar 7.45 �117 �24.3
� Reduction in net GHG emissions associated with usingethanol or biodiesel compared with gasoline or diesel expressedeither as a percentage (quotient of values in Fig. 4b divided byvalues in Fig. 2a) or unit ethanol consumed (quotient of valuesin Fig. 4b divided by values in Fig. 1d).
PAUL R. ADLER ET AL.682 Ecological ApplicationsVol. 17, No. 3
reed canarygrass ;120%, and about 145% and 165% for
switchgrass and hybrid poplar, respectively, compared
with the life cycle of gasoline and diesel (Fig. 5). In the
long term, where soil C sequestration was assumed to no
longer occur, this resulted in a reduction of GHG
emissions for corn rotations of ;40%, reed canarygrass
;85%, and ;115% for switchgrass and hybrid poplar
compared with the life cycle of gasoline and diesel (Table
3). The GHGnet reduction from gasifying biomass
instead of coal was about �64 to �70 g CO2e-C/MJ,
an 85–93% reduction in greenhouse gases compared
with the coal life cycle (Table 2).
FIG. 2. Components of the net greenhouse-gas (GHGnet) profile from different bioenergy cropping systems. Displaced fossilfuel and feedstock conversion are based on displacement of gasoline and diesel and conversion of crop components to eitherethanol or biodiesel. CO2e stands for ‘‘CO2 equivalent’’; see Table 2 note for definition.
April 2007 683LCA OF NET GHG FLUX FOR BIOENERGY CROPS

DISCUSSION
Crop and biofuel yield
Yields for cropping systems depended on the compo-
nent crops. Since soybean and alfalfa had lower yields
than the other crops, their inclusion in the crop rotation
reduced overall yield of the corn cropping system. If
100% of the corn stover (stalks and leaves) was
harvested, that too would have increased the biomass
yield of the corn rotations. However, only 50% of the
stover was harvested, to provide residue to reduce soil
erosion (Nelson 2002).
Both crop yield and composition affect biofuel
production from energy crops. There are more differ-
ences in the components of composition between grain
and biomass that affect energy yield than between
different sources of biomass (U.S. Department of Energy
2006a) resulting in greater differences in biofuel yield
than crop yield when comparing grain and biomass
crops. The effect of composition on biofuel yield is why
corn biofuel yield was 10–15% higher than hybrid poplar
and switchgrass even though crop yields of corn, hybrid
poplar, and switchgrass were all within ;5% of each
other. Based on composition, grain has higher conver-
sion efficiency to ethanol per unit mass than non-grain
biomass, ;20% higher than switchgrass. Therefore some
differences between crop yield and ethanol and biodiesel
yield are expected, as was seen in this study. Since the
composition between non-grain biomass sources is
similar, ethanol yield differences per unit mass are small
(U.S. Department of Energy 2006a) and biomass yield is
the most important factor determining biofuel produc-
tion from a cropping system. As expected, the crops with
the highest biofuel yield were those with the highest
biomass yield. Corn is typically grown in rotation with
other crops and in this study the crops in the rotation
with corn—soybean and alfalfa—had much lower
biofuel yields than corn; therefore the system yields were
lower than the other cropping systems. We assumed that
electricity generation was only from gasification of
biomass in cropping systems and did not include grain.
Therefore we only considered switchgrass, reed canary-
FIG. 3. DAYCENT (Del Grosso et al. 2001a) andIntergovernmental Panel on Climate Change (IPCC 2000)calculated direct N2O emissions from bioenergy croppingsystems.
TABLE 4. Carbon dioxide emissions from production of N, P, K, limestone, and pesticides used inbioenergy cropping systems.
Bioenergy croppingsystems
CO2 emissions (g CO2-C�m�2�yr�1)
N P K Limestone� Herbicides Insecticides
Switchgrass 4.48 0.37 0.49 1.70 0.04 0.00Reed canarygrass 12.33 1.04 2.50 3.02 0.03 0.00Corn–soybean
Conventional tillage 6.12 1.01 1.09 3.02 1.05 0.04No till 6.12 1.01 1.09 3.02 2.44 0.04
Corn–soybean–alfalfa
Conventional tillage 3.12 0.89 1.45 3.26 0.78 0.16No till 3.12 0.89 1.45 3.26 1.63 0.16
Hybrid poplar 2.88 0.19 0.26 0.85 0.14 0.11
� Limestone, CaCO3 equivalents.
PAUL R. ADLER ET AL.684 Ecological ApplicationsVol. 17, No. 3
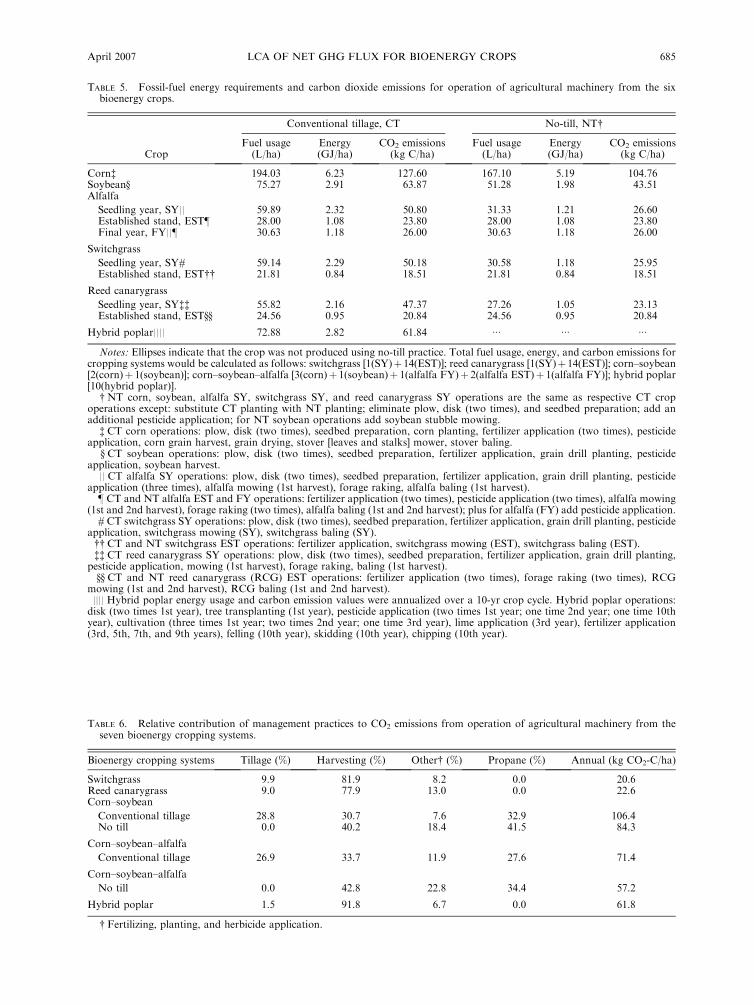
TABLE 5. Fossil-fuel energy requirements and carbon dioxide emissions for operation of agricultural machinery from the sixbioenergy crops.
Crop
Conventional tillage, CT No-till, NT�
Fuel usage(L/ha)
Energy(GJ/ha)
CO2 emissions(kg C/ha)
Fuel usage(L/ha)
Energy(GJ/ha)
CO2 emissions(kg C/ha)
Corn� 194.03 6.23 127.60 167.10 5.19 104.76Soybean§ 75.27 2.91 63.87 51.28 1.98 43.51Alfalfa
Seedling year, SY|| 59.89 2.32 50.80 31.33 1.21 26.60Established stand, EST} 28.00 1.08 23.80 28.00 1.08 23.80Final year, FY||} 30.63 1.18 26.00 30.63 1.18 26.00
Switchgrass
Seedling year, SY# 59.14 2.29 50.18 30.58 1.18 25.95Established stand, EST�� 21.81 0.84 18.51 21.81 0.84 18.51
Reed canarygrass
Seedling year, SY�� 55.82 2.16 47.37 27.26 1.05 23.13Established stand, EST§§ 24.56 0.95 20.84 24.56 0.95 20.84
Hybrid poplar|||| 72.88 2.82 61.84 ��� ��� ���
Notes: Ellipses indicate that the crop was not produced using no-till practice. Total fuel usage, energy, and carbon emissions forcropping systems would be calculated as follows: switchgrass [1(SY)þ14(EST)]; reed canarygrass [1(SY)þ14(EST)]; corn–soybean[2(corn)þ 1(soybean)]; corn–soybean–alfalfa [3(corn)þ 1(soybean)þ 1(alfalfa FY)þ 2(alfalfa EST)þ 1(alfalfa FY)]; hybrid poplar[10(hybrid poplar)].
� NT corn, soybean, alfalfa SY, switchgrass SY, and reed canarygrass SY operations are the same as respective CT cropoperations except: substitute CT planting with NT planting; eliminate plow, disk (two times), and seedbed preparation; add anadditional pesticide application; for NT soybean operations add soybean stubble mowing.
� CT corn operations: plow, disk (two times), seedbed preparation, corn planting, fertilizer application (two times), pesticideapplication, corn grain harvest, grain drying, stover [leaves and stalks] mower, stover baling.
§ CT soybean operations: plow, disk (two times), seedbed preparation, fertilizer application, grain drill planting, pesticideapplication, soybean harvest.
|| CT alfalfa SY operations: plow, disk (two times), seedbed preparation, fertilizer application, grain drill planting, pesticideapplication (three times), alfalfa mowing (1st harvest), forage raking, alfalfa baling (1st harvest).} CT and NT alfalfa EST and FY operations: fertilizer application (two times), pesticide application (two times), alfalfa mowing
(1st and 2nd harvest), forage raking (two times), alfalfa baling (1st and 2nd harvest); plus for alfalfa (FY) add pesticide application.# CT switchgrass SY operations: plow, disk (two times), seedbed preparation, fertilizer application, grain drill planting, pesticide
application, switchgrass mowing (SY), switchgrass baling (SY).�� CT and NT switchgrass EST operations: fertilizer application, switchgrass mowing (EST), switchgrass baling (EST).�� CT reed canarygrass SY operations: plow, disk (two times), seedbed preparation, fertilizer application, grain drill planting,
pesticide application, mowing (1st harvest), forage raking, baling (1st harvest).§§ CT and NT reed canarygrass (RCG) EST operations: fertilizer application (two times), forage raking (two times), RCG
mowing (1st and 2nd harvest), RCG baling (1st and 2nd harvest).|||| Hybrid poplar energy usage and carbon emission values were annualized over a 10-yr crop cycle. Hybrid poplar operations:disk (two times 1st year), tree transplanting (1st year), pesticide application (two times 1st year; one time 2nd year; one time 10thyear), cultivation (three times 1st year; two times 2nd year; one time 3rd year), lime application (3rd year), fertilizer application(3rd, 5th, 7th, and 9th years), felling (10th year), skidding (10th year), chipping (10th year).
TABLE 6. Relative contribution of management practices to CO2 emissions from operation of agricultural machinery from theseven bioenergy cropping systems.
Bioenergy cropping systems Tillage (%) Harvesting (%) Other� (%) Propane (%) Annual (kg CO2-C/ha)
Switchgrass 9.9 81.9 8.2 0.0 20.6Reed canarygrass 9.0 77.9 13.0 0.0 22.6Corn–soybean
Conventional tillage 28.8 30.7 7.6 32.9 106.4No till 0.0 40.2 18.4 41.5 84.3
Corn–soybean–alfalfa
Conventional tillage 26.9 33.7 11.9 27.6 71.4
Corn–soybean–alfalfa
No till 0.0 42.8 22.8 34.4 57.2
Hybrid poplar 1.5 91.8 6.7 0.0 61.8
� Fertilizing, planting, and herbicide application.
April 2007 685LCA OF NET GHG FLUX FOR BIOENERGY CROPS
grass, and hybrid poplar for electricity generation from
gasification. The energy content of biomass for conver-
sion to electricity by gasification follows the C content
(Brown 2003) and decreased in the order of hybrid
poplar, switchgrass, and reed canarygrass as described by
the heating values in the above section (seeMethods: Net
GHG flux. . .). There was about a 10% difference in
energy content between the lowest (reed canarygrass at
17.7 MJ/kg) and highest materials (hybrid poplar at 19.3
MJ/kg). Therefore the differences in electricity produc-
tion between cropping systems in this study are due to
biomass yield, not energy content.
Greenhouse-gas sinks
Displaced fossil fuel (Cdff) was the largest greenhouse-
gas (GHG) sink. There is a higher emission of CO2e-C
associated with generation of electricity from coal
gasification compared with gasoline and diesel (CON-
CAWE 2004). Therefore, the Cdff from biomass
gasification was greater than from liquid biofuels.
Storage of carbon in soil resulted from changes in C
inputs, tillage intensity, and residue decomposition. Soil
C inputs from root turnover, crop residue, and live root
biomass varied with crop. Although the perennial grass
crops reed canarygrass and switchgrass had larger C
inputs from roots, most of the aboveground biomass
was removed with harvest and not returned to the soil.
However, only 50% of the corn stover was removed,
resulting in large soil C inputs in corn rotations from
aboveground biomass. Soil organic carbon (SOC) levels
increase with crop residue input such as when higher
yielding crop species are planted (Campbell et al. 2005),
FIG. 4. Net greenhouse-gas (GHGnet) emissions from different bioenergy cropping systems with conversion to ethanol orbiodiesel (a, b) or gasification of biomass (c, d). Near-term GHGnet is the sum of displaced fossil fuel, net change (D) in system C,feedstock conversion, direct and indirect N2O emissions, fossil fuel used to produce chemical inputs, and fossil fuel used inagricultural-machinery operations. Long-term GHGnet is the sum in near-term GHGnet except D(system C), because soils will cometo equilibrium with C inputs, and further soil C sequestration will not occur.
PAUL R. ADLER ET AL.686 Ecological ApplicationsVol. 17, No. 3

increased fertilizer applied (Studdert and Echeverria
2000, Campbell et al. 2005), and with cropping
frequency when fallow is part of the crop rotation
(Campbell et al. 2005). A decrease in residue decompo-
sition due to reduced soil tillage (Paustian et al. 2000,
West and Post 2002) and reduced quality of crop
residues (Heal et al. 1997) also increases SOC. Results
from this study are consistent with these previous
findings; the higher yielding crop species with lower
quality residues had higher SOC. The no-till corn
rotations also had higher SOC compared to conven-
tional-tillage rotations.
Increased crop diversity in rotations will increase SOC
if subsequent crops included in the rotation add greater
amounts of residue to the soil and/or decrease SOC
decomposition, such as crops with more recalcitrant
residue or perennials that have reduced tillage. Mono-
culture corn has been observed to have higher SOC than
corn–soybean rotation (Havlin et al. 1990, Studdert and
Echeverria 2000, West and Post 2002) since soybean
provides less residue input to the soil than corn.
Replacing wheat with lower-yielding flax reduced SOC
(Campbell et al. 2005). Perennial crops can increase SOC
through elimination of tillage and increased root
biomass relative to annual crops. However, in contrast
to Russell et al. (2005), alfalfa reduced SOC when added
to the corn–soybean rotation.
The change in SOC and belowground biomass C, Dsystem C (DCsys) will approach zero as soil C levels reach
equilibrium for a given quantity of C inputs and C losses
from decomposition (Paustian et al. 2000). However,
even though changes in soil C will approach zero, some
cropping systems will have higher long-term SOC
storage due to higher inputs and/or reduced decompo-
sition. The long-term C sequestration potential of soils is
also affected by soil properties such as texture, and some
will saturate at higher SOC levels than others (Six et al.
2002). Therefore the potential long-term storage of SOC
will depend on the cropping system and how it is
managed, and the specific soil. Variation in SOC under
the same crop is expected due to the identity of other
crops in the rotation, crop yield, tillage intensity, and
soil texture.
The feedstock-conversion C (CFC) varied from being
positive (a net consumer of energy) to negative (a net
producer of energy). Initially, this may seem to be a
surprising result. However, negative values result from
an electricity credit at the conversion facility for
combustion of the lignin fraction of biomass (Sheehan
et al. 2004). The lignin fraction of biomass is not
converted to ethanol, but to electricity when combusted.
Cropping systems with a smaller electricity credit are net
consumers of energy for this component and have
positive values. Hybrid poplar, switchgrass, and reed
canarygrass were net producers of energy during
conversion (Fig. 2c) and the corn–soybean–alfalfa
rotation used less energy than the corn–soybean rotation
due to higher production of biomass relative to grain.
Cropping systems with grain crops had higher CFC than
biomass crops because they lacked the coproduct lignin,
which was a source of energy when combusted.
Greenhouse-gas sources
There were four sources of greenhouse gases quanti-
fied in this study, direct soil N2O emissions (CN2O Dir),indirect N2O emissions from offsite denitrification of
NO3 and volatilized N that was deposited offsite and
converted to N2O in soil (CN2O Ind), CO2 emissions from
manufacture of fertilizers, lime, and pesticides (chemi-
FIG. 5. Comparison of the life-cycle greenhouse-gas (GHG)emissions associated with the quantity of gasoline and dieseldisplaced by ethanol and biodiesel produced from the croppingsystems (displaced fossil-fuel C [Cdff]) with the quantity ofGHG emissions associated with the life cycle of biofuel (ethanoland biodiesel) production (feedstock-conversion C [CFC]þCCH4
þ direct CN2O þ indirect CN2O þ chemical-inputs C [CCI] þagricultural-machinery C [CAgMa]); near-term includes changein system C [DCsys]). The percentage reduction in GHGemissions was calculated as the difference in the biofuelemissions and fossil-fuel emissions displaced from biofuelproduced by a given crop expressed as a percentage of thedisplaced fossil-fuel emissions.
April 2007 687LCA OF NET GHG FLUX FOR BIOENERGY CROPS
cal-inputs C, CCI), and CO2 from fuel used by
agricultural machinery for tillage, planting, fertilizer
and pesticide application, harvesting, and drying corn
grain (CAgMa). It has often been observed that N2O
emissions increase with conversion of conventional
tillage land to no-till (Six et al. 2004, Smith and Conen
2004). However, Six et al. (2004) found that while N2O
emissions were higher the first 10 years after conversion
to no-till from conventional tillage, 20 years after no-till
adoption, N2O emissions were higher in conventional-
tillage systems as was observed in this study. Our
simulations were for 30 years and estimating higher N2O
emissions with conventional tillage would be consistent
with what has been observed in other studies (Six et al.
2004).
The comparison of Integrate Panel on Climate
Change (IPCC 2000)-calculated N2O emissions with
those determined by DAYCENT varied with cropping
system (Fig. 3). As the proportion of legumes in the crop
rotations increased, the overestimate of N2O emissions
by IPCC relative to DAYCENT increased as observed
with the corn–soybean–alfalfa rotation. These results
are consistent with previous work showing that DAY-
CENT and IPCC (2000) methodology estimated similar
emissions for non-N-fixing crops, but IPCC (2000)
methodology was about twice as high for N fixers (Del
Grosso et al. 2005). Data from soybean and alfalfa
cropping in Canada (Rochette et al. 2004) and Michigan
(Robertson et al. 2000) suggest that IPCC (2000)
methodology overestimates N2O emissions from N
fixers. In contrast to the N-fixing crops, IPCC (2000)
estimates of N2O emissions from switchgrass were lower
than DAYCENT. Since IPCC (2000) methodology
bases N2O emissions strictly on N inputs from fixation,
fertilization, and aboveground residue, IPCC does well
estimating N2O fluxes from crops where the majority of
N comes from these sources. However switchgrass does
not fix N, has low N fertilizer inputs, and aboveground
inputs of N from residue are close to 0 because virtually
all of the biomass is harvested. More N comes from
decomposition of SOC and roots, a source not
considered by IPCC. In DAYCENT, N2O emissions
are based not only on N inputs from fixation,
fertilization, and aboveground residue, but also on N
inputs from decomposition of belowground residue and
mineralization of soil organic matter. Consequently,
DAYCENT estimates higher emissions than IPCC
(2000) methodology for this crop. Indirect N2O emis-
sions from NO3 leaching and volatilization, like direct
soil N2O emissions, varied across cropping systems
largely as a function of N inputs from fertilizer and
fixation. This is because other factors that influence N
losses (soil texture, weather) were considered constant
for this study. The rate and time of N fertilizer
application are critical components of N fertilizer
management (Dinnes et al. 2002) and followed standard
recommendations in this study. Farmers will often apply
all the nitrogen at corn planting; however, in this study,
only one third of the N was applied at planting, to
ensure greater N-use efficiency. DAYCENT predicted a
small reduction in NO3 leaching under no-till compared
to conventional tillage in crop rotations. Soil NO3
concentrations tend to be higher under conventional
tillage but the volume of water flowing through the soil
tends to be higher under no-till, leading to variable
results on the effect of tillage on NO3 leaching (Dinnes
et al. 2002).
The CO2 costs of chemical inputs were mainly due to
fertilizer production, followed by limestone, herbicides,
and insecticides. N production was responsible for most
of the CO2 costs from fertilizer input for all the cropping
systems. However, because N was only applied in years
corn was grown in the corn rotations and in the other
years soybean and alfalfa legume crops contributed fixed
N, the average N application rate for the corn cropping
systems was much lower than the annual N application
for corn. Reducing synthetic N use is important to
decreasing GHG emissions from cropping systems
whether through use of legumes in the cropping systems,
or more efficient N-use strategies or crops.
CAgMa and CCI are affected by both the choice of crop
and management practices. Reducing farm operations
through reducing tillage, planting, and N fertilizer
applications significantly reduced net GHG emissions
as shown in this study (Table 5) and others (West and
Marland 2002, Kim and Dale 2004b). However, the fuel
savings from less plowing with no till is partially offset
by higher emissions from herbicide inputs (Table 4).
Some of these decisions are inherent with the specific
crop chosen, e.g., no tillage with perennial crops or no N
application with legume crops. However, other manage-
ment practices, such as no-till vs. conventional tillage for
annuals, are decisions made by the farm manager.
Global-warming potential
The near-term scenario combined all the GHG sinks
and sources evaluated in this study, and considered how
using biofuels would reduce GHGnet compared to
continuing to use fossil fuels in the near-term. The
displaced fossil-fuel C (Cdff) was the dominant factor in
determining GHGnet. In general, switchgrass and hybrid
poplar had higher yields, greater soil C sequestration,
reduced GHG emission from feedstock conversion,
reduced soil N2O emissions, and reduced GHG emis-
sions from chemical input manufacture and agricultural
machinery operation.
The long-term GHGnet assumed that DCsys was zero
because soils were equilibrated and no longer seques-
tering additional C (Six et al. 2002). This scenario
considers how using biofuels would reduce GHGnet
compared to continuing to use fossil fuels in the long
term. All cropping systems were still GHG sinks
compared to their fossil fuel counterparts. Biofuels have
been considered to have a near-zero net emission of
greenhouse gases (McLaughlin et al. 2002). However,
coproducts such as lignin and protein, along with soil C
PAUL R. ADLER ET AL.688 Ecological ApplicationsVol. 17, No. 3

sequestration, can reduce GHGnet, making these system
sinks, and when compared with the life-cycle GHG
emissions of the displaced fossil fuel, our analysis showsbiofuels having net GHG benefits.
Producing energy from crops is a land extensive
approach to energy production. In addition to having
metrics that allow easy comparison across technologies
(Farrell et al. 2006; e.g., GHG emissions per megajoule
of fuel), to evaluate land-use implications of bioenergycropping systems, a metric expressed in terms of policy
impact per unit land area is needed. In this study
cellulosic crops had higher biofuel yield and lower GHG
emissions per unit land area than corn rotations.Cellulosic crops also had a greater reduction in GHG
emissions per unit biofuel produced than corn rotations,
resulting in greater reductions in GHG emissions
associated with energy use compared with fossil fuels.
Capture of CO2 from fuel production and energygeneration would further increase the impact of biofuels
on reducing GHGnet. Only a portion of biomass C is
retained in ethanol and biodiesel. In an ethanol
conversion facility for corn stover, about one third ofthe biomass C is converted to ethanol, the remainder of
biomass C was emitted as combustion exhaust and
fermentation-generated CO2 (Sheehan et al. 2004).
Similar proportions of biomass C were converted to
ethanol in this study. Two thirds of the C could becaptured at a biorefinery and nearly 100% could be
captured at a biomass-gasification power plant (Spath
and Mann 2004). Spath and Mann (2004) have
quantified the impact of CO2 capture for both coaland biomass-gasification systems. They found that even
with CO2 capture, fossil-based systems still have greater
GHG emissions per kilowatt-hour of electricity than for
biomass power-generation systems without C capture.
Carbon credit markets associated with GHG mitiga-tion strategies have been developed (McCarl and
Schneider 2001, Paustian and Babcock 2004). Short-term
strategies for mitigating greenhouse gases using biofuels
include soil C sequestration. However, displacement ofgreenhouse gases associated with the use of fossil fuels is
the only long-term mitigation mechanism when using
biofuels and would be easier to track for carbon markets.
Implications of bioenergy on the net greenhouse-gas
flux of energy use
The use of biofuel could reduce the net GHG flux of
energy use, whether from production of liquid fuels, e.g.,
ethanol and biodiesel, or generation of electricity fromgasification of biomass. The choice of crop and manage-
ment practiceswill affect the netGHGfluxes of energy use
from biofuel. Cellulosic energy crops such as switchgrass
and hybrid poplar have the greatest potential to reducenet emissions of energy use in the near- and long-term.
ACKNOWLEDGMENTS
We thank Matthew Myers for assistance with compilingagricultural machinery data. The comments of two anonymousreviewers greatly improved the manuscript.
LITERATURE CITED
Adler, P. R., M. A. Sanderson, A. A. Boateng, P. J. Weimer,and H. G. Jung. 2006. Biomass yield and biofuel quality ofswitchgrass harvested in fall or spring. Agronomy Journal 98:1518–1525.
Ahmed, I., J. Decker, and D. Morris. 1994. How much energydoes it take to make a gallon of soydiesel? Institute for LocalSelf-Reliance, Minneapolis, Minnesota, USA.
ASAE [American Society of Agricultural Engineers]. 2000.Agricultural machinery management. ASAE D497.4 andEP496.2. In ASAE standards, 47th edition. ASAE, SaintJoseph, Michigan, USA.
Brown, R. C. 2003. Biorenewable resources: engineering newproducts from agriculture. Iowa State Press, Ames, Iowa,USA.
Campbell, C. A., H. H. Janzen, K. Paustian, E. G. Gregorich,L. Sherrod, B. C. Liang, and R. P. Zentner. 2005. Carbonstorage in soils of the north american great plains: effect ofcropping frequency. Agronomy Journal 97:349–363.
Cherney, J. H., D. J. R. Cherney, and M. D. Casler. 2003. Lowintensity harvest management of reed canarygrass. Agrono-my Journal 95:627–634.
CONCAWE [Conservation of Clean Air and Water inEurope—the oil companies’ European association], EUCAR[European Council for Automotive Research and Develop-ment], and ECJRC [European Commission Joint ResearchCentre]. 2004. Well-to-wheels analysis of future automotivefuels and powertrains in the European context. Well-to-wheels report, version 1b (January 2004). hhttp://www.enpc/f r / f r / fo rmat ions /dea_mas t e r s / t r add /document s /Welltowheeleucar.pdfi
Del Grosso, S. J., A. R. Mosier, W. J. Parton, and D. S. Ojima.2005. DAYCENT model analysis of past and contemporarysoil N2O and net greenhouse gas flux for major crops in theUSA. Soil Tillage Research 83:9–24. [10.1016/j.still.2005.02.007]
Del Grosso, S. J., D. S. Ojima, W. J. Parton, A. R. Mosier,G. A. Peterson, and D. S. Schimel. 2002. Simulated effects ofdryland cropping intensification on soil organic matter andGHG exchanges using the DAYCENT ecosystem model.Environmental Pollution 116:S75–S83.
Del Grosso, S. J., W. J. Parton, A. R. Mosier, M. D. Hartman,J. Brenner, D. S. Ojima, and D. S. Schimel. 2001a. Simulatedinteraction of carbon dynamics and nitrogen trace gas fluxesusing the DAYCENT model. Pages 303–332 in M. Schaffer,L. Ma, and S. Hansen, editors. Modeling carbon andnitrogen dynamics for soil management. CRC Press, BocaRaton, Florida, USA.
Del Grosso, S. J., W. J. Parton, A. R. Mosier, M. D. Hartman,C. A. Keough, G. A. Peterson, D. S. Ojima, and D. S.Schimel. 2001b. Simulated effects of land use, soil texture,and precipitation on N gas emissions using DAYCENT.Pages 413–421 in R. F. Follett and J. L. Hatfield, editors.Nitrogen in the environment: sources, problems, andmanagement. Elsevier Science Publishers, Amsterdam, TheNetherlands.
Del Grosso, S. J., W. J. Parton, A. R. Mosier, D. S. Ojima,C. S. Potter, W. Borken, R. Brumme, K. Butterbach-Bahl,P. M. Crill, K. Dobbie, and K. A. Smith. 2000. General CH4
oxidation model and comparisons of CH4 oxidation innatural and managed systems. Global Biogeochemical Cycles14:999–1019.
Dien, B. S., H. G. Jung, K. P. Vogel, M. D. Casler, J. F. S.Lamb, L. Iten, R. B. Mitchell, and G. Sarath. 2006. Chemicalcomposition and response to dilute-acid pretreatment andenzymatic saccharification of alfalfa, reed canarygrass, andswitchgrass. Biomass Bioenergy 30:880–891.
Dinnes, D. L., D. L. Karlen, D. B. Jaynes, T. C. Kaspar, J. L.Hatfield, T. S. Colvin, and C. A. Cambardella. 2002.Nitrogen management strategies to reduce nitrate leaching
April 2007 689LCA OF NET GHG FLUX FOR BIOENERGY CROPS

in tile-drained midwestern soils. Agronomy Journal 94:153–171.
Dukes, J. S. 2003. Burning buried sunshine: Human consump-tion of ancient solar energy. Climatic Change 61:31–44.
Farrell, A. E., R. J. Plevin, B. T. Turner, A. D. Jones, M.O’Hare, and D. M. Kammen. 2006. Ethanol can contributeto energy and environmental goals. Science 311:506–508.
Hartsough, B. R., R. Spinelli, and S. J. Pottle. 2002. Delimbinghybrid poplar priortoprocessing with a flail/chipper. ForestProdusts Journal 52:85–93.
Havlin, J. L., D. E. Kissel, L. D. Maddux, M. M. Claassen, andJ. H. Long. 1990. Crop-rotation and tillage effects on soilorganic-carbon and nitrogen. Soil Science Society of AmericaJournal 54:448–452.
Heal, O. W., J. M. Anderson, and M. J. Swift. 1997. Plant litterquality and decomposition: An historical overview. Pages 3–30 in G. Cadisch and K. E. Giller, editors. Driven by nature:plant litter quality and decomposition. CAB International,Wallingford, UK.
Heller, M. C., G. A. Keoleian, M. K. Mann, and T. A. Volk.2004. Life cycle energy and environmental benefits ofgenerating electricity from willow biomass. RenewableEnergy 29:1023–1042.
Heller, M. C., G. A. Keoleian, and T. A. Volk. 2003. Life cycleassessment of a willow bioenergy cropping system. BiomassBioenergy 25:147–165.
IPCC [International Panel on Climate Change]. 2000. Goodpractice guidance and uncertainty management in nationalgreenhouse gas inventories. J. Penman, D. Kruger, I.Galbally, T. Hiraishi, B. Nyenzi, S. Emmanul, L. Buendia,R. Hoppaus, T. Martinsen, J. Meijer, K. Miwa, and K.Tanabe, editors. IPCC national greenhouse gas inventoriesprogramme. Institute for Global Environmental Strategies,Hayama, Kanagawa, Japan.
IPCC [International Panel on Climate Change]. 2001. Climatechange 2001: the science of climate change. Contribution ofWorking Group I to the Third Assessment Report of theIntergovernmental Panel on Climate Change. J. T. Hough-ton, L. G. Meira Filho, B. A. Callander, N. Harris, A.Kattenberg, and K. Maskell, editors. Cambridge UniversityPress, Cambridge, UK.
IPCC/UNEP/OECD/IEA [International Panel of ClimateChange/United Nations Environment Programme/Organiza-tion for Economic Co-operation and Development/Interna-tional Energy Agency]. 1997. Revised 1996 IPCC guidelinesfor national greenhouse gas inventories. J. T. Houghton, L. G.Meira Filho, B. Lim, K. Treanton, I. Mamaty, Y. Bonduki,D. J. Griggs, and B. A. Callender, editors. IPCC, c/o WorldMeteorological Organization, Geneva, Switzerland.
Janzen, H. H. 2004. Carbon cycling in earth systems–a soilscience perspective. Agric. Ecosyst. Environ. 104:399–417.
Jarecki, M. K., and R. Lal. 2003. Crop management for soilcarbon sequestration. Critical Reviews in Plant Science 22:471–502.
Kim, S., and B. E. Dale. 2004a. Global potential bioethanolproduction from wasted crops and crop residues. BiomassBioenergy 26:361–375.
Kim, S., and B. E. Dale. 2004b. Cumulative energy and globalwarming impact from the production of biomass forbiobased products. Journal of Industrial Ecology 7:147–162.
Kim, S., and B. E. Dale. 2005. Environmental aspects ofethanol derived from no-tilled corn grain: nonrenewableenergy consumption and greenhouse gas emissions. BiomassBioenergy 28:475–489.
Lal, R. 2004. Carbon emission from farm operations. Environ-ment International 30:981–990.
Lal, R. 2005. World crop residues production and implicationsof its use as a biofuel. Environment International 31:575–584.
Lamb, J. F. S., C. C. Sheaffer, and D. A. Samac. 2003.Population density and harvest maturity effects on leaf andstem yield in alfalfa. Agronomy Journal 95:635–641.
Lewandowski, I., J. M. O. Scurlock, E. Lindvall, and M.Christou. 2003. The development and current status ofperennial rhizomatous grasses as energy crops in the US andEurope. Biomass Bioenergy 25:335–361.
Marland, G., and A. F. Turhollow. 1991. CO2 emissions fromthe production and combustion of fuel ethanol from corn.Energy 16:1307–1316.
McCarl, B. A., and U. A. Schneider. 2001. Greenhouse gasmitigation in U.S. agriculture and forestry. Science 294:2481–2482.
McLaughlin, S. B., D. G. De La Torre Ugarte, C. T. Garten,Jr., L. R. Lynd, M. A. Sanderson, V. R. Tolbert, and D. D.Wolf. 2002. High-value renewable energy from prairiegrasses. Environmental Science and Technology 36:2122–2129.
Miles, T. R., T. R. Miles, Jr., L. L. Baxter, R. W. Bryers, B. M.Jenkins, L. L. Oden, D. C. Dayton, and T. A. Milne. 1996.Alkali deposits found in biomass power plants. Volume I. Apreliminary investigation of their extent and nature. VolumeII. The behavior of inorganic material in biomass-fired powerboilers—field and laboratory experiences. NREL/TP-433-8142; Sand 96-8225. National Technical Information Service,Springfield, Virginia, USA.
Nelson, R. G. 2002. Resource assessment and removal analysisfor corn stover and wheat straw in the Eastern andMidwestern United States–rainfall and wind-induced soilerosion methodology. Biomass Bioenergy 22:349–363.
Pacala, S., and R. Socolow. 2004. Stabilization wedges: solvingthe climate problem for the next 50 years with currenttechnologies. Science 305:968–972.
Parton, W. J., M. D. Hartman, D. S. Ojima, and D. S. Schimel.1998. DAYCENT and its land surface submodel: descriptionand testing. Global and Planetary Change 19:35–48.
Parton, W. J., D. S. Ojima, C. V. Cole, and D. S. Schimel. 1994.A general model for soil organic matter dynamics: sensitivityto litter chemistry, texture and management. Pages 147–167in R. B. Bryant and R. W. Arnold, editors. Quantitativemodeling of soil forming processes. Soil Science Society ofAmerica, Madison, Wisconsin, USA.
Paustian, K., and B. A. Babcock. 2004. Climate change andgreenhouse gas mitigation: challenges and opportunities foragriculture. Task Force Report number 141. CAST [Councilfor Agricultural Science and Technology], Ames, Iowa, USA.
Paustian, K., J. Six, E. T. Elliott, and H. W. Hunt. 2000.Management options for reducing CO2 emissions fromagricultural soils. Biogeochemistry 48:147–163.
Robertson, G. P., and P. R. Grace. 2004. Greenhouse gas fluxesin tropical and temperate agriculture: the need for a full-costaccounting of global warming potentials. Environment,Development and Sustainability 6:51–63.
Robertson, G. P., E. A. Paul, and R. R. Harwood. 2000.Greenhouse gases in intensive agriculture: Contributions ofindividual gases to the radiative forcing of the atmosphere.Science 289:1922–1925.
Rochette, P., D. A. Angers, G. Belanger, M. H. Chantigny, D.Prevost, and G. Levesque. 2004. Emissions of N2O fromalfalfa and soybean crops in eastern Canada. Soil ScienceSociety of America Journal 68:493–506.
Rotz, C. A. 2004. The integrated farm system model: a tool fordeveloping more economically and environmentally sustain-able farming systems for the Northeast. NABEC-04-0022.American Society of Agricultural Engineers, St. Joseph,Michigan, USA.
Russell, A. E., D. A. Laird, T. B. Parkin, and A. P. Mallarino.2005. Impact of nitrogen fertilization and cropping system oncarbon sequestration in midwestern mollisols. Soil ScienceSociety of America Journal 69:413–422.
Saxton, K. E., W. J. Rawls, J. S. Romberger, and R. I.Papendick. 1986. Estimating generalized soil-water charac-teristics from texture. Soil Science Society of America Journal50:1031–1036.
PAUL R. ADLER ET AL.690 Ecological ApplicationsVol. 17, No. 3
Shapouri, H., J. A. Duffield, and M. Wang. 2002. The energybalance of corn ethanol: an update. Agricultural EconomicReport 813. U.S. Department of Agriculture, Washington,D.C., USA.
Sharpley, A. N., and J. R. Williams, editors. 1990. EPICerosion–productivity impact calculator: 1. Model documen-tation. USDA Technical Bulletin Number 1768. U.S.Government Printing Office, Washington, D.C., USA.
Sheehan, J., A. Aden, K. Paustian, K. Killian, J. Brenner, M.Walsh, and R. Nelson. 2004. Energy and environmentalaspects of using corn stover for fuel ethanol. Journal ofIndustrial Ecology 7:117–146.
Sheehan, J., V. Camobreco, J. Duffield, M. Graboski, and H.Shapouri. 1998. Life cycle inventory of biodiesel andpetroleum diesel for use in an urban bus. NREL/SR-580-24089. National Renewable Energy Laboratory, Golden,Colorado, USA.
Six, J., R. T. Conant, E. A. Paul, and K. Paustian. 2002.Stabilization mechanisms of soil organic matter: implicationsfor C-saturation of soils. Plant Soil 241:155–176.
Six, J., S. M. Ogle, F. J. Breidt, R. T. Conant, A. R. Mosier,and K. Paustian. 2004. The potential to mitigate globalwarming with no-tillage management is only realized whenpracticed in the long term. Global Change Biology 10:155–160.
Smith, K. A., and F. Conen. 2004. Impacts of landmanagement on fluxes of trace greenhouse gases. Soil UseManagement 20:255–263.
Spath, P. L., and M. K. Mann. 2004. Biomass power andconventional fossil systems with and without CO2 sequestra-tion. Comparing the energy balance, greenhouse gas emis-sions and economics. NREL/TP-510-32575. NationalRenewable Energy Laboratory, Golden, Colorado, USA.
Studdert, G. A., and H. E. Echeverria. 2000. Crop rotationsand nitrogen fertilization to manage soil organic carbondynamics. Soil Science Society of America Journal 64:1496–1503.
Thornton, P. E., H. Hasenauer, and M. A. White. 2000.Simultaneous estimation of daily solar radiation andhumidity from observed temperature and precipitation: anapplication over complex terrain in Austria. Agricultural andForest Meteorology 104:255–271.
Thornton, P. E., and S. W. Running. 1999. An improvedalgorithm for estimating incident daily solar radiation from
measurements of temperature, humidity, and precipitation.Agriculture and Forest Meteorology 93:211–228.
Thornton, P. E., S. W. Running, and M. A. White. 1997.Generating surfaces of daily meteorology variables over largeregions of complex terrain. Journal of Hydrology (Amster-dam) 190:214–251.
Updegraff, K., M. J. Baughman, and S. J. Taff. 2004.Environmental benefits of cropland conversion to hybridpoplar: economic and policy considerations. Biomass Bio-energy 27:411–428.
USDA National Agricultural Statistics Service. 2004. Quickstats: agricultural statistics data base. hhttp://www.nass.usda.gov/QuickStats/i
U.S. Department of Energy. 2006a. Theoretical ethanol yieldcalculator . hhttp://www.eere.energy.gov/biomass/ethanol_yield_calculator.htmli
U.S. Department of Energy. 2006b. Biomass feedstock compo-sition and property database. hhttp://www1.eere.energy.gov/biomass/feedstock_databases.htmli
VEMAP [Vegetation/ecosystem modeling and analysis project]members (J. M. Mellilo et al.). 1995. Vegetation/ecosystemmodeling and analysis project (VEMAP). Comparing bioge-ography and biogeochemistry models in a continental-scalestudy of terrestrial ecosystem responses to climate changeand CO2 doubling. Global Biogeochemical Cycles 9:407–438.
Walsh, M. E., D. G. De La Torre Ugarte, H. Shapouri, andS. P. Slinsky. 2003. Bioenergy crop production in the UnitedStates. Environmental Resource Economics 24:313–333.
Wang, M. Q. 2001. Development and use of GREET 1.6 fuel-cycle model for transportation fuels and vehicle technologies.Technical Report ANL/ESD/TM-163. Argonne NationalLaboratory, Argonne, Illinois, USA. hwww.transportation.anl.gov/pdfs/TA/153.pdfi
West, T. O., and G. Marland. 2002. A synthesis of carbonsequestration, carbon emissions, and net carbon flux inagriculture: comparing tillage practices in the United States.Agriculture, Ecosystems & Environment 91:217–232.
West, T. O., and A. C. McBride. 2005. The contribution ofagricultural lime to carbon dioxide emissions in the UnitedStates: dissolution, transport, and net emissions. Agriculture,Ecosystems & Environment 108:145–154.
West, T. O., and W. M. Post. 2002. Soil organic carbonsequestration rates by tillage and crop rotation: a global dataanalysis. Soil Science Society of America Journal 66:1930–1946.
April 2007 691LCA OF NET GHG FLUX FOR BIOENERGY CROPS