life cycle assessment of electricity systems - orbit.dtu.dk · (2011) life cycle assessment of...
TRANSCRIPT

General rights Copyright and moral rights for the publications made accessible in the public portal are retained by the authors and/or other copyright owners and it is a condition of accessing publications that users recognise and abide by the legal requirements associated with these rights.
Users may download and print one copy of any publication from the public portal for the purpose of private study or research.
You may not further distribute the material or use it for any profit-making activity or commercial gain
You may freely distribute the URL identifying the publication in the public portal If you believe that this document breaches copyright please contact us providing details, and we will remove access to the work immediately and investigate your claim.
Downloaded from orbit.dtu.dk on: Aug 08, 2019
Life Cycle Assessment of Electricity Systems
Turconi, Roberto
Publication date:2014
Document VersionPublisher's PDF, also known as Version of record
Link back to DTU Orbit
Citation (APA):Turconi, R. (2014). Life Cycle Assessment of Electricity Systems. Kgs. Lyngby: DTU Environment.

PhD ThesisApril 2014
Roberto Turconi
Life Cycle Assessment of Electricity Systems


Life Cycle Assessment of Electricity Systems
Roberto Turconi
PhD Thesis April 2014
DTU Environment Department of Environmental Engineering
Technical University of Denmark

DTU Environment
April 2014
Department of Environmental Engineering
Technical University of Denmark
Miljoevej, building 113
2800 Kgs. Lyngby
Denmark
+45 4525 1600
+45 4593 2850
http://www.env.dtu.dk
Vester Kopi
Torben Dolin
Address:
Phone reception:
Fax:
Homepage:
E-mail:
Printed by:
Cover:
Roberto Turconi
Life Cycle Assessment of Electricity Systems
PhD Thesis, April 2014
The synopsis part of this thesis is available as a pdf-file for download from the
DTU research database ORBIT: http://www.orbit.dtu.dk

i
Preface The work presented in this PhD thesis was conducted at the Department of Environmental Engineering of the Technical University of Denmark (DTU) under the supervision of Associate Professor Thomas Fruergaard Astrup. The work was conducted from September 2010 to February 2014. The PhD project was funded by the Danish Agency for Science Technology and Innovation.
The content of the thesis is based on four scientific journal papers prepared in collaboration with internal and external partners. The publications are referred to by their Roman numerals throughout the thesis (e.g. “Turconi et al. (I)”).
I. Turconi R, Boldrin A, Astrup TF. (2013) Life cycle assessment
(LCA) of electricity generation technologies – overview, comparability and limitations. Renewable and Sustainable Energy Reviews. DOI: 10.1016/j.rser.2013.08.013.
II. Turconi R, Simonsen CG, Byriel IP, Astrup TF. (2014) Life cycle assessment of the Danish electricity distribution network. The International Journal of Life Cycle Assessment. DOI: 10.1007/ s11367-013-0632-y.
III. Turconi R, O’Dwyer C, Flynn D, Astrup TF. - Emissions from cycling of thermal power plant in electricity systems with high penetration of wind power: life cycle assessment for Ireland. Submitted to Applied Energy.
IV. Turconi R, Tonini D, Nielsen CFB, Simonsen CG, Astrup TF. - Environmental Impacts of Future Low-Carbon Electricity Systems: Detailed life cycle assessment of a Danish case study. Submitted to Applied Energy.
In this online version of the thesis, the articles are not included but can be obtained from electronic article databases e.g. via www.orbit.dtu.dk or on request from DTU Environment, Technical University of Denmark, Miljøvej, Building 113, 2800 Kgs. Lyngby, Denmark, [email protected].

ii
In addition, one report and two scientific journal papers have been produced during the PhD:
• Turconi R, Clavreul J, Damgaard A, Astrup T. (2013) EASETECH Energy Manual. DTU Environment Report. Available at www.easetech.dk.
• Astrup TF, Tonini D, Turconi R, Boldrin A. - Life Cycle Assessment of Thermal Waste-to-Energy Technologies: Review and Recommendations. Submitted to Waste Management.
• Turconi R, Butera S, Boldrin A, Grosso M, Rigamonti L, Astrup TF. (2011) Life cycle assessment of waste incineration in Denmark and Italy using two LCA models. Waste Management & Research. DOI: 10.1177/ 0734242X11417489.
April 2014
Roberto Turconi

iii
Acknowledgements First and foremost, I would like to express my sincere gratitude to my supervisor, Prof. Thomas Astrup, for his continuous support and guidance throughout my PhD study. His passion and enthusiasm have been constant sources of inspiration and encouragement.
Special thanks to Alessio Boldrin, who is a great friend and who provided answers and guidance whenever I asked for it. And it was often.
Thanks for the interesting discussions and constructive collaboration to: Davide Tonini, Anders Damgaard, Julie Clavreul and Thomas Christensen (DTU Environment); Inger Byriel, Christian Simonsen and Christian Nielsen (Energinet.dk); Allan Jensen (Dansk Energi); and Damian Flynn and Ciara O’Dwyer (University College Dublin). I would also like to thank Prof. Vasilis Fthenakis, Thomas Nikolakakis and Rob Van Haaren at Columbia University for their support during my external research stay. Thanks also to Garvin Heath (NREL) for the constructive discussions.
I am grateful for being part of such a fantastic academic community as the Residual Resources Engineering research group at DTU Environment; thanks especially to Line, Elisa, Stefania, Vincent, Vero, Alberto and Morten. Thanks also to Torben, Anne, Ellen, Hugo and Charlotte for making my life here at DTU easy.
I would also like to thank my friends here in Copenhagen, in particular Thore, Nemanja and Fabrizio. Thanks also to all my friends in Italy, especially to Bobo and Grace, who make me feel as if I had never left every time I visit.
Thanks to my parents and my sister for all their support, not only during this PhD, but with everything I do. Most of all, however, I thank Ramona, for her endless patience, support and encouragement.

iv
Summary Electricity systems represent a major source of global pollutants. Whilst currently relying heavily on fossil fuels, electricity systems are progressively shifting towards renewable sources to mitigate climate change and enhance energy security. The goal of this PhD project was to develop a systematic framework for the life cycle assessment (LCA) of electricity systems, which aimed at providing:
Scientifically sound recommendations for decision-making processes, leading to more sustainable energy systems;
Accurate and transparent LCA data for electricity supply, thereby increasing the robustness of LCA results for a multitude of products producing or consuming electricity throughout the lifecycle.
The main findings in relation to: (i) electricity generation, (ii) power transmission and distribution and (iii) low-carbon electricity systems are reported in the following paragraphs.
A great deal of variability was found in the literature regarding LCA of electricity generation in terms of modelling methodology and power plant characteristics, both of which strongly affected the results of the LCA. Major issues for individual electricity generation technologies were identified and discussed. For example, electricity used during the manufacturing of the power plant, reference year and data collection approach (process-chain or input-output analysis) strongly affected the impacts of hydro, wind and solar power. This information needs to be documented, to ensure comparability between studies. Based on information gathered from the literature, typical emission factor ranges for each technology were provided. Results showed that emission factors per unit of energy input should be used for thermal conversion processes (as opposed to emission factors per unit of electricity produced), as the efficiency may vary depending on the operation of the plant within the power system.
The choice of LCA approach used to solve multi-functionality for combined heat and power plants strongly influenced how the environmental impact of electricity produced at such plants was estimated. When it is not possible to expand the assessment’s system boundaries, exergy allocation should be used, as it is more consistent with the general principles of LCA. Lastly, land use changes (LUC) were found to increase greenhouse gas (GHG) emissions from energy crops to

v
levels comparable to those of fossil fuels; consequently, it might be preferable to use energy crops for purposes other than producing electricity.
Transmission and distribution of electricity are often not included in LCA of power systems. An LCA of the Danish transmission and distribution systems was performed, showing that the distribution network makes a significant contribution to the impacts of electricity delivered to customers. In the future, because of the implementation of smart grids and low-carbon electricity systems, these results might change radically. It is thus recommended to include transmission and distribution in future LCA studies, while developing data on smart grids should be a priority for future research.
The environmental impacts of low-carbon electricity systems were assessed by combining LCA with power system modelling. Possible scenarios for the island of Ireland in 2025 and Denmark in 2030, with high amounts of wind power, were developed using Unit Commitment and Economic Dispatch, including wind and demand forecasts. This approach allows for assessing the influence of the fluctuating nature of wind on other electricity sources – this was not found in the LCA literature on renewable-based electricity systems, as it is based mostly on aggregated modelling. The results showed that an increase in wind power causes greater emissions from other power plants in the electricity system (which need to ‘cycle’ – adjust their production – more frequently); however, considering the entire electricity system, increasing wind power penetration reduces the overall emissions. Electricity storage limits the amount of cycling but environmental benefits are related to the base load fleet in the system, i.e. having coal as base load causes an increase in emissions. Electricity imports and exports are likely to increase with the expansion of wind power: transparent LCA modelling and adequate data for neighboring countries’ power systems are hence important for reliable and usable results.
Focusing on the Danish electricity system, it was found that using energy crops for electricity production did not lead to GHG reductions, owing to LUC-related impacts. Conversely, it will be possible to reduce GHG significantly, by increasing power production from residual biomass and wind and decreasing electricity production based on fossil fuels.

vi
Dansk Sammenfatning Elsystemer udgør globalt en væsentlig kilde til udledning af forurenende stoffer og afhænger i dag i høj grad af fossile brændsler. Derfor går elsystemer gradvist i retning mod brug af vedvarende energikilder for at mindske klimaforandringer og øge energisikkerheden. Dette ph.d.-projekt havde til formål at udvikle en systematisk ramme for livscyklusvurdering (LCV) af elsystemer. Dette er fuldført ved fremsættelse af:
videnskabeligt funderede anbefalinger til beslutningsprocesser, der fører i retning af mere bæredygtige energisystemer
præcise og transparente LCV-data for elforsyning, som øger robustheden af LCV resultater for en lang række el-forbrugende produkter
De vigtigste resultater i relation til: (i) elproduktion, (ii) transmission og distribution af elektricitet, og (iii) ”low-carbon” elsystemer er rapporteret i følgende afsnit.
Stor variation blev fundet i litteraturen om LCV af elproduktion i form af modelleringsmetoder og for kraftværkers karakteristika, som viste sig at have stor betydning for resultaterne af LCVer. De væsentligste problemstillinger for de enkelte elproduktionsteknologier blev identificeret og diskuteret. Påvirkningerne af vandkraft, vindkraft og solenergi var f.eks. meget afhængig af input af elektricitet under konstruktion af anlægget, referenceår og metode til dataindsamling (proces-kæde eller input-output). Disse oplysninger skal dokumenteres for at sikre sammenlignelighed mellem studier. Intervaller af emissionsfaktorer for hver teknologi blev samlet fra litteraturen og præsenteret. Resultaterne viste, at emissionsfaktorer per energitilførsel bør anvendes til termiske processer (i modsætning til emissionsfaktorer per elektricitetsenhed produceret), da effektiviteten kan variere afhængigt af driften af anlægget i elsystemet.
Valget af LCV fremgangsmåde til at løse multifunktionalitet for kombinerede kraftvarmeværker påvirker i høj grad estimeringen af de miljømæssige påvirkninger fra elektricitetsproduktionen på sådanne anlæg. Hvis det ikke er muligt at lave systemudvidelse i livscyklusvurderingen, bør exergi allokering anvendes, hvilket også er konsistent med de generelle principper for LCV. Derudover blev ændringer i arealanvendelsen fundet til at øge emissionen af drivhusgas fra energiafgrøder til niveauer svarende til dem fra fossile

vii
brændstoffer, og det vil være at foretrække at bruge energiafgrøder til andre formål end at producere elektricitet.
Transmission og distribution af elektricitet er ofte ikke medtaget i LCVer af elsystemer. En LCV af de danske transmissions- og distributionssystemer blev udført, og viste at distributionsnettet har et væsentligt bidrag til miljøpåvirkningerne fra elektricitet leveret til kunder. På grund af gennemførelsen af intelligente net og ”low-carbon” elsystemer, kan disse resultater i fremtiden ændre sig radikalt. Det anbefales derfor at inkludere transmission og distribution i fremtidige LCV-studier, og udvikling af data om intelligente net bør prioriteres i fremtidig forskning.
De miljømæssige konsekvenser af ”low-carbon” elsystemer blev vurderet ved at kombinere LCV med modellering af elsystemer. Potentielle energiscenarier for Irland 2025 og Danmark 2030 med høje andele af vindkraft blev udviklet under hensyntagen til de enkelte produktionsenheders drift og forventninger til driftsbehov. Denne tilgang gør det muligt at vurdere indflydelsen af vind som fluktuerende kilde på andre energikilder. Dette blev ikke fundet i LCV litteraturen om vedvarende energisystemer, som hovedsageligt er baseret på aggregeret modellering. Resultaterne viste, at stigningen i brug af vindkraft medfører større emissioner fra andre kraftværker i elsystemet (som dermed må justere deres produktion oftere), men i forhold til det samlede el-system, reduceres de samlede emissioner ved øget brug af vindkraft. Lagring af elektricitet øger brugen af vindkraft. Emissionerne fra elsystemet mindskes dog ikke, fordi lagring bruger elektricitet fra grundlasten, hvilket i dette tilfælde er baseret på kul. Import og eksport af elektricitet vil sandsynligvis stige med vindkraft. Gennemsigtighed i LCV modellering og fyldestgørende data for nabolandenes energisystem er derfor vigtigt for pålidelige og brugbare resultater.
Med fokus på det danske elsystem, blev det vist at anvendelse af energiafgrøder til elproduktion ikke førte til drivhusgasreduktioner på grund af arealanvendelses relaterede påvirkninger. Omvendt vil det være muligt at reducere drivhusgasser ved at øge elproduktionen fra resterende biomasse og vind, og mindske elproduktion fra fossile brændstoffer.

viii

ix
List of Contents Preface .................................................................................................................... i Acknowledgements .............................................................................................. iii Summary .............................................................................................................. iv Dansk Sammenfatning ........................................................................................ vi List of Contents .................................................................................................... ix List of Abbreviations ........................................................................................... xi 1. Introduction .................................................................................................... 1
1.1 Background ............................................................................................... 1 1.2 Aim of the PhD ......................................................................................... 2 1.3 Content of the Thesis ................................................................................ 3
2. Methods and Tools ......................................................................................... 5 2.1 Life Cycle Assessment .............................................................................. 5
2.1.1 EASETECH Energy ........................................................................... 6 2.2 Power System Modelling .......................................................................... 8
3. Key Issues in Electricity-Related LCA ...................................................... 11 3.1 Functional Unit ....................................................................................... 11 3.2 Selection of Impact Categories ............................................................... 13 3.3 Technological, Geographical and Temporal Scope ................................ 14 3.4 Attributional vs. Consequential LCA ..................................................... 14 3.5 Data Sources ........................................................................................... 15 3.6 System Boundaries .................................................................................. 16
3.6.1 Process Description .......................................................................... 16 3.6.2 Process Cut-off ................................................................................. 18 3.6.3 Process Multifunctionality ............................................................... 19 3.6.4 Transmission and Distribution ......................................................... 21 3.6.5 Electricity Import/Export ................................................................. 21
4. Results and Discussion ................................................................................ 23 4.1 Electricity Generation ............................................................................. 23
4.1.1 Case Study: Combined Heat and Power Plants ............................... 29 4.1.2 Case Study: Source of Biomass ....................................................... 30
4.2 Electricity Transmission and Distribution .............................................. 33 4.2.1 Distribution Network Components .................................................. 34 4.2.2 Life Cycle Assessment for Denmark ............................................... 34
4.3 Electricity Systems .................................................................................. 36 4.3.1 Case Study: Ireland .......................................................................... 37 4.3.2 Case Study: Denmark ....................................................................... 41
5. Conclusions and Recommendations ........................................................... 47 6. Future Research ........................................................................................... 51 7. References ..................................................................................................... 53 8. Publications .................................................................................................. 61

x

xi
List of Abbreviations BaU Business as Usual
CCGT Combined Cycle Gas Turbine
CHP Combined Heat and Power
EASETECH Environmental Assessment System for Environmental TECHnologies
EC-JRC Joint Research Centre of the European Commission
EU European Union
FGC Flue Gas Cleaning
GHG Greenhouse Gas
IEA International Energy Agency
ILCD International reference Life Cycle Data system
IOA Input-Output Analysis
IPCC Intergovernmental Panel on Climate Change
ISO International Organization for Standardization
LCA Life Cycle Assessment
LCI Life Cycle Inventory
LCIA Life Cycle Impact Assessment
LHV Lower Heating Value
LPG Liquefied Petroleum Gas
LUC Land Use Change
MSW Municipal Solid Waste
NERI National Environmental Research Institute (Denmark)
NREL National Renewable Energy Laboratory (United States)
OCGT Open Cycle Gas Turbine
PCA Process-Chain Analysis
PV (solar) Photovoltaic
T&D Transmission and Distribution
TS Total Solids
UC-ED Unit Commitment and Economic Dispatch

1
1. Introduction 1.1 Background The electric power sector, today responsible for approximately 40% of global greenhouse gas (GHG) emissions (IEA 2012a), will face a drastic change in the coming years in order to reduce global warming and enhance energy security; for example, Denmark is committed to a move to 100% renewable power by 2035 (Danish Government, 2011). Significant commercial and industrial interests relate to the development of the electricity system and the implementation of new sustainable energy technologies; however, environmental aspects related to renewable energy technologies and their integration into the energy system are often not clear.
To assess the environmental performance of an electricity system, a holistic system perspective is required. If not, the risk is that only environmental impacts arising directly from the technology itself are considered, without taking into account indirect upstream and downstream contributions and savings (e.g. environmental impacts related to biomass production, and environmental savings related to bi-products from electricity production), as well as interactions with other components in the energy system, i.e. the heating and transport sectors. Life cycle assessment (LCA) is a tool used to quantify all interactions between a product’s system and the environment, and it is used here to evaluate the environmental performance of electricity systems.
Having the ability to assess the environmental performance of an electricity system is important for two reasons: (i) to have a sound basis for making decisions regarding how to develop such an electricity system and ensuring environmental protection; and (ii) to account properly for electricity use in product LCAs, which are becoming more and more popular and whose results often depend on power consumption during the manufacture or use of the product (Curran et al., 2005). Additionally, LCAs of electricity generation technologies represent a reference for comparing environmental assessments of electricity generation from residual materials (e.g. waste and residual biomass), which will play an important role in future electricity systems (Münster and Meibom, 2011).
To provide a more integrated environmental assessment of electricity technologies, the methodological basis for systematically accounting for the system-wide benefits related to implementing a given electricity technology into

2
the electricity system needs to be developed. Furthermore, LCAs of important electricity technologies and low-carbon electricity systems have to be carried out, in order to illustrate clearly the benefits and drawbacks of potential future technologies.
1.2 Aim of the PhD The main goal of the project is to develop a systematic framework for the environmental assessment of electricity systems. This aims at: (i) providing scientifically sound recommendations for decision-making processes, leading towards more sustainable energy systems, and (ii) providing accurate and transparent electricity supply LCA data, thereby increasing the robustness of LCA results for a multitude of products consuming electricity throughout the lifecycle.
The PhD includes the following objectives:
Investigate and discuss technological and methodological aspects in LCA of electricity generation;
Develop a methodological framework for an LCA modelling tool dedicated to energy systems: EASETECH Energy;
Develop inventory data for electricity distribution and evaluate the importance of electricity transmission and distribution in the environmental performance of a power system;
Identify and address the main challenges in LCA of power systems with high shares of renewables;
Perform an LCA on current and future scenarios for the Danish electricity system;
Recommend best practices for LCA of electricity systems based on the above elements.

3
1.3 Content of the Thesis The thesis is structured as follows:
Section 2 describes the methodologies used (LCA and power systems modelling) and the tool (EASETECH Energy) for an energy system LCA developed during this PhD;
Section 3 identifies and discusses key factors in electricity-related LCA;
Section 4 highlights and discusses the major findings regarding LCA of electricity generation technologies, power transmission and distribution and electricity systems;
Section 5 concludes on the outcomes of the thesis;
Section 6 identifies and discusses issues and topics suitable for further scientific investigation.

4

5
2. Methods and Tools Three main criteria are used to evaluate energy systems: security of supply, economic efficiency and environmental impacts (Edenhofer et al., 2011; World Economic Forum, 2012). Power system modelling assesses whether the first two criteria have been fulfilled, and it is always carried out to ensure that a power system is reliable and economically efficient. Conversely, the minimization of environmental impacts has only been introduced recently as an objective of a power system, mainly due to CO2 taxation, though such an approach fails to include (i) GHG emissions other than those at the power plant and (ii) other environmental impacts. Throughout this PhD, LCA was used to assess the environmental performance of electricity systems (Turconi et al., III and IV), thus broadening the focus of the assessment from CO2 emissions at power plant stacks to all input/outputs during the lifetime of an electricity system. Power system modelling provided feasible scenarios, the environmental impacts of which were assessed through LCA. Power system analysis and LCA can therefore be complementary in evaluating the sustainability of an electric system.
2.1 Life Cycle Assessment In an LCA, potential environmental impacts associated with the lifecycle of a product/service are assessed based on relevant input/output data and emissions compiled for the system associated with the product/service in question (ISO 2006a, 2006b). LCA studies provide a well-established and comprehensive framework with which to compare renewable energy sources with fossil-based and nuclear energy technologies (Edenhofer et al., 2011).
ISO (2006a) defines four phases for an LCA (Figure 1), namely (1) Goal and scope definition, which includes a specification of the aim of the study, its functional unit (the unit which qualitatively and quantitatively describes the service provided by the system under assessment) and the system boundaries; (2) Inventory analysis, where a life cycle inventory (LCI) of system input/output data is collected; (3) life cycle impact assessment (LCIA), where system input/output data are characterized and aggregated to better understand their environmental significance; and (4) Interpretation, where the results are discussed in accordance with the goal and scope of the study.

6
Figure 1: Stages of an LCA (ISO 2006a)
Providing LCIs of electricity technologies and systems is a particularly challenging task, because of the complexity of the system being analyzed. According to Curran et al. (2005), one of the main challenges is “the wide variation among generation stations in emissions and inputs per unit generation across and even within fuel types.” To enhance the transparency and flexible modelling of energy systems, a new software modelling tool was developed during this PhD, namely EASETECH Energy. The model is described in the following section and was used in Turconi et al. (IV) for the LCA of current and future scenarios for the Danish electricity system. Conversely, in Turconi et al. (II and III), two of the most popular commercial LCA software packages were used, namely GaBi 4.4 (PE International, 2010) and SimaPro 7 (Pré Consultants, 2010), respectively.
2.1.1 EASETECH Energy
To better facilitate detailed LCAs of energy technologies, a new LCA model software was developed at DTU Environment in 2012, based on substantial experience with the LCA modelling of waste management systems (EASEWASTE, 2013; Kirkeby et al., 2006). The model in the present study, EASETECH Energy, is a specific version of EASETECH (Clavreul et al., 2013), in that it focuses on energy systems. EASETECH Energy provides unprecedented flexibility with respect to LCA modelling of energy technologies and systems, as it allows the simultaneous balancing of mass and energy flows throughout the system under assessment. This is achieved by a functional matrix representing the physical and chemical compositions of the materials being modelled. All calculations are based on this matrix format throughout the modelling process, so an environmental impact can be traced back at any time to the material leading to
Goal and Scopedefinition
Inventoryanalysis
Impactassessment
Interpretation

7
the impact. Similarly, the flow of energy is tracked through the model, so the energy content in an end product can be traced back to the initial energy carriers. Table 1 shows an example of fuel characteristics that can be included in EASETECH Energy.
Table 1. Example fuel characteristics (MSW=Municipal Solid Waste, LPG= Liquefied Petroleum Gas; TS=Total Solids).
Fuel Water
(%) TS (%)
Energy (MJ/kgTS)
Ash (%TS)
Cbiogenic (%TS)
Cfossil (%TS)
S (%TS)
Ref
Coal 11.3 88.7 27.71 12.75 0 71.58 0.795 a, b
Wood 19.38 80.62 19.19 2.88 57.58 0 0.024 a, b
MSW 42 58 19.87 33.98 40.7 20.05 0.015 c
Straw 16.15 83.85 17.76 2.66 53.29 0 0.115 a, b
Residual oil 0 100 40.65 0 0 87.86 0.699 b,d
Gas oil 0 100 42.7 0 0 86.18 0.049 b,d
LPG 0 100 46 0 0 79.16 0 b,d
Petroleum coke 3.94 96.06 30.81 0 0 77.32 0.932 b,d
Natural gas 0 100 39.5* 0 0 61.37 0.0006 b,d
Biogas 0 100 23* 0 52.44 0 0.029 b,d
Refinery Gas 0 100 52* 0 0 82.09 0.0026 b,d
* based on volume (m3). References: a=ECN (2014), b=NERI (2010), c=Riber, Petersen, and Christensen (2009), d=Energinet.dk and Energi Styrelsen (2012).
The basis for building the different technologies in EASETECH Energy lies in the use of a toolbox of template material processes. The toolbox offers a set of generic process modules to create, modify and split flows, which allows a user to divide a process up into a number of sub-processes and therefore allow for more detailed modelling. The user can choose any preferred combination and sequence of technologies, since the matrix format is maintained from the input to the output of each process, thus allowing for any number of combinations of modules. An EASETECH Energy manual, which can be found at www.easetech.dk, describes the tool’s methodological framework and the key characteristics that facilitate the modelling of energy technologies and systems.
The software is provided with a predefined set of common power generation technologies representative of Danish and European conditions. Thanks to the modularity of the modelling, each technology can be adapted to different geographical and technological conditions, i.e. modifying energy recovery efficiency or flue gas cleaning efficiency. For example, power and heat production from a coal power plant (Figure 2) is modelled as a combination of different processes: module [1] creates an energy flow (with associated mass and

8
substances) defining fuel composition and including fuel extraction and transportation; [2] splits the input flow according to different properties (energy content, ashes and S) modelling the combustion of the fuel. Outputs from the combustion process are diverted to: electricity output ([3]), heat output ([4]), handling of solid residues ([5]), and flue gas cleaning ([6], which translates input flow (S) into release to an environmental compartment (SO2 to air)). This new way of defining processes from the detailed level up to the full process makes the software flexible and allows, for example, users to model new possible processes easily by combining parts of already existing ones.
Figure 2. EASETECH Energy modelling of power and heat generation in a coal power plant. Each box is an independent module.
2.2 Power System Modelling Power generation should always meet the demand (net of import/export). To determine which power plants should generate electricity, unit commitment and economic dispatch (UC-ED) are necessary. Given a number of power-generating units, the aim of UC-ED is to determine a combination of online units and corresponding generation levels so that the demand is satisfied at the least possible cost.
Increasing renewable energy penetration makes balancing electric generation and load more challenging, because of the variability1 of renewable sources (i.e. wind and solar) (Kristoffersen and Meibom, 2013). This leads to increased operational costs, which can be quantified using UC-ED (Denny and O’Malley, 2007). The additional operational costs of a power system with high wind penetration are related to power plant cycling (i.e. power plants are required to vary their
1 Variability (or intermittency) is the extent to which a power source may exhibit undesired or uncontrolled changes in output (http://www.ukerc.ac.uk/Downloads/PDF/05/050705TPASindenpres.pdf).

9
electricity production to compensate for wind variability), thus leading to: (i) lower efficiency, (ii) additional fuel required for start-ups, (iii) increased wear and tear on power plant components (Denny and O’Malley, 2007), and (iv) need for additional reserves (i.e. electricity available at short notice, in case of unexpected changes in demand, failures or wind fluctuations) (Soder, 1993). These additional operational costs translate into increased emissions (Denny and O’Malley, 2005), which are quantified and included in LCA in Turconi et al. (III and IV).
UC-ED was completed for the Irish and Danish power systems in Turconi et al. (III and IV, respectively), in order to determine the operating levels of conventional generators and resulting emissions as wind generation increases. These data were then used to perform LCA for the different scenarios modelled herein. For both the Irish and the Danish power systems, an hourly resolution was used. Optimization included wind and demand forecasting, to ensure that storage and plant start-ups were scheduled appropriately. Energy and reserves were co-optimized, minimizing the total generation cost for the system. Costs included in the objective function were fuel costs, carbon costs and start-up costs. Each generator was modelled with a number of constraints, including maximum and minimum generation levels, minimum up and down times, and ramp rates2.
Power system modelling was not performed actively within this thesis. However, the output of PLEXOS for Power Systems (Energy Exemplar Pty Ltd, 2010) was used in Turconi et al. (III), and that of SIVAEL (Energinet.dk, 2010c) in Turconi et al. (IV).
2 Ramp rate is the rate, usually expressed in megawatts per minute, at which a generator changes its output (http://www.nerc.com/files/glossary_of_terms.pdf).

10
11
3. Key Issues in Electricity-Related LCA Quantifying the environmental impacts of electricity production is very important, because electric power is a key factor in the environmental footprint of many different products (Curran et al., 2005). Nevertheless, as electricity systems and technologies are very complex and in constant evolution, assessing their environmental impacts is far from a simple or straightforward task. This has been a long-discussed topic. For example, in 2001, a workshop titled ‘International Workshop on Electricity Data for Life Cycle Inventories’ was held, and in its final report (Curran et al., 2005) the authors identified several challenges that needed to be addressed, in order to understand and properly model the environmental impacts of power generation. According to Edenhofer et al. (2011), “general conclusions from results of individual LCA are thwarted by potential system boundary problems, differences in technology and background energy system characteristics, geographic location, data source type and other central methods and assumptions.”
This chapter provides an overview of the challenges to the accuracy and transparency of LCA of electricity technologies and systems identified among those presented by Curran et al. (2005) and Edenhofer et al. (2011). Possible solutions are proposed, based on both the literature and original ideas developed during this PhD. Section 4 expands on the selected topics, by providing quantitative solutions, discussions and examples which help to understand the magnitude of individual issues on the overall impacts of a power system.
3.1 Functional Unit The International Organization for Standardization (ISO 2006b) defines functional unit as “quantified performance of a product system for use as a reference unit”; furthermore, “comparisons between systems shall be made on the basis of the same function(s), quantified by the same functional unit(s) in the form of their reference flows.” With regards to electricity generation, the functional unit is commonly expressed as unit of electricity produced, i.e. 1 kWh. In some cases this might represent an oversimplification, since different types of power plant can provide different services; for example, a coal-fired steam turbine and a gas turbine provide base- and peak-load to the system, respectively, thus they are not fully comparable (Turconi et al., I).

12
In addition to technical characteristics (e.g. ramp rate, minimum stable level), the mode of operation for a power generation technology is determined by the electricity system in which the technology is installed (Turconi et al., III). Demand and generation fluctuations (i.e. from variable renewables) cause dispatchable3 power plants to adjust their power output (cycle), in order to always fulfil electricity demand. Cycling may induce efficiency penalties in fossil power plants providing balancing reserves (Gross et al., 2007; Pehnt et al., 2008) (Figure 3). These penalties may result in higher greenhouse gas (GHG) emissions due to the greater fuel volumes being used; additionally, air pollution control systems that mitigate other emissions, such as NOx, may not operate optimally when the generator power level is changed quickly, thus increasing emissions even further (Katzenstein and Apt, 2009). These operational aspects are usually accounted for when looking at past scenarios – since actual power plant data are typically used – but they are often neglected when modelling future scenarios, because the time resolution is not accurate enough or technical power plant constraints are not included in the energy modelling process. Emissions from power plant cycling have been quantified only recently (Katzenstein and Apt 2009; Lew et al., 2012; NREL 2010, 2013) and included in few LCA studies (Valentino et al., 2012).
Figure 3. Power output from dispatchable generators as a function of load (CCGT: Combined Cycle Gas Turbine; OCGT: Open Cycle Gas Turbine) (Turconi et al., III).
3 “Dispatchability” is the ability of a generating unit to increase or decrease power generation, or to be brought on line or shut down at the request of a utility’s system operator (http://www.iepa.com/ Glossary.asp)
1000 20 40 60 80
Load [%]
Effic
iency [%
]
60
50
40
30
20
10
Gas New CCGT
Gas CCGT
Gas OCGT
Gas Condensing
Peat
Coal
Distillate oil

13
3.2 Selection of Impact Categories Impact categories to be included in the LCA study should be selected during Goal and Scope definition. ISO (2006a) defines an impact category as a “class representing environmental issues of concern to which LCI analysis results may be assigned.” Thus, impact categories are used during LCIA to translate emissions into environmental impacts. Due to the pressing issue of global warming, LCA studies often consider only GHG emissions, in which case environmental impacts other than global warming are not considered; in Turconi et al. (I) it was found that out of 167 studies marked as ‘LCA’, only 101 (60%) covered emissions other than GHGs. This should be avoided, because one of the objectives of an LCA is the avoidance of problem shifting between environmental impacts (Finnveden et al., 2009); consequently, an LCA should ideally consider all attributes or aspects of the natural environment, human health and resources (ISO, 2006a). While most studies report on air pollutants, evidence is scarce for land use, emissions into water and health impacts other than those linked to air pollution (Edenhofer et al., 2011). Current guidelines (ISO 2006a) do not specify a minimum number of impact categories to be included or a preferred methodology; rather, they suggest ‘typical’ impact categories (ISO 2006c). In general, the choice of impact categories to be included in an LCA is based on the scope of the study, intended application of the results and data availability (EC-JRC, 2010).
Impact categories should not be confused with lifecycle energy indicators such as Cumulative Energy Demand (CED, normally expressed as energy input per unit of product, i.e. kWh electricity), which is often used with power generation technologies to assess their performance. Performance indicators, which are currently inconsistent and require standardization (Modahl et al., 2013), are beyond the scope of this thesis and are therefore discussed elsewhere (Arvidsson et al., 2012; Davidsson et al., 2012). Today, a range of impact categories exists, and different methodologies can be applied to the same impact category. Using different methodologies prevents comparability between studies. The Joint Research Centre of the European Commission reviewed the main methodologies available for each of the most common impact categories, and then provided recommended methods for each impact category (EC-JRC, 2011).
14
3.3 Technological, Geographical and Temporal Scope
The subject of an LCA is always a specific product – in this case an electricity technology or a (national) power system. This specificity is necessary, in order to identify the correct flows within the system and thus to generate consistent results. If two LCAs do not have similar system boundaries (or system boundaries are not documented transparently), the studies are not comparable. This is particularly true for power plants, whose environmental impacts depend on the technological, geographical and temporal scope of the study (Singh et al., 2013). Masanet et al. (2012) identified seven discriminating factors: technology vintage, capacity factors, conversion efficiencies, material constituents, input fuel types, operations and maintenance and decommissioning practices. The U.S. National Renewable Energy Laboratory went a step forward with the “Life Cycle Assessment Harmonization” project (NREL 2009), in which, after a thorough literature review of electricity generation from wind, solar photovoltaic, concentrating solar power, nuclear and coal, specific characteristics for each technology were identified. The selected characteristics were then ‘adjusted’ to typical U.S. values, thereby reducing the variability of GHG emissions for such technologies. This allowed defining average values for each technology, which can be used as a benchmark for other technologies. On the other hand, Turconi et al. (I) focused on the relationship between technological characteristics and GHG, NOx and SO2 emissions from a selection of power plants: this is useful for LCA practitioners who wish to identify a specific technology when working on a case study, thus ensuring consistency in terms of technological, geographical and temporal scope.
3.4 Attributional vs. Consequential LCA Two types of LCA are commonly recognized in the literature, depending on whether the purpose of the study is to assess the environmental burden of a product, assuming a status quo situation (attributional approach), or to assess the environmental consequences of a change in demand (consequential approach) (Curran et al., 2005; EC-JRC, 2010; Finnveden et al., 2009; Guinée, 2002). Attributional LCA “describes the pollution and resource flows within a chosen system attributed to the delivery of a specified amount of the functional unit,” while consequential LCA “estimates how pollution and resource flows within a system change in response to a change in output of the functional unit”

15
(Thomassen et al., 2008). A detailed description of the two approaches can be found in the literature (e.g. Edenhofer et al., 2011; Ekvall and Weidema, 2004; Finnveden et al., 2009; Thomassen et al., 2008). During this PhD both methodologies were used, depending on the purpose of the study: the status quo position of the Danish electricity distribution system in 2010, and that of the Irish electricity system in 2025, were assessed in Turconi et al. (II and III, respectively), thus attributional approach was chosen; conversely, Turconi et al. (IV) evaluated the environmental consequences of shifting the Danish electricity system from being fossil- to renewables-based, therefore consequential approach was used.
LCI databases should be developed in such a way that they support both attributional and consequential modelling (Curran et al., 2005). This is ensured by providing transparent and documented data which are not aggregated over technologies or markets. The LCI data developed in Turconi et al. (I-IV) followed this principle. As previously mentioned, providing reliable LCI data for electricity production is particularly valuable, because electricity use features very prominently in the total LCA results for a majority of product lifecycles (Curran et al., 2005).
3.5 Data Sources Two main approaches are used for data collection in LCA: process chain analysis (PCA) and input-output analysis (IOA) (Turconi et al., I). PCA is a bottom-up approach using engineering data and process-specific information, while IOA is a top-down approach based on monetary data for individual economic sectors, thus considering aggregated flows between sectors. PCA is a time-consuming procedure, but it generally produces more precise results (Finnveden et al., 2009). Data collection in PCA is often simplified by applying cut-off criteria to exclude less relevant processes from the system (see Section 3.6.2). Generally, IOA estimates larger impacts than PCA, because system boundaries are extended and no process cut-offs are applied (Hendrickson et al., 1998; Meier et al., 2005). In fact, the more complex the process, the greater the difference between the results from PCA- and IOA-based LCA studies; due to its complexity, nuclear power is the technology most influenced by the choice of data source among those considered in Turconi et al. (I). Turconi et al. (II-IV) used the PCA approach in view of the high predominance of this type of data in the literature (Turconi et al., I).

16
3.6 System Boundaries ISO (2006a) defines system boundary as a “set of criteria specifying which unit processes are part of a product system.” The selection of the system boundary is often the subjective decision of the practitioner carrying out the LCA (Suh et al., 2004), and it should be described and reported thoroughly, in order to allow comparability between studies (ISO, 2006a). Process cut-offs and multifunctionality are issues common to every LCA, while within electricity LCAs two additional important factors to consider are whether to include transmission and distribution (within both electricity generation and electricity system LCAs) and how to consider the import and export of electricity (for electricity systems).
3.6.1 Process Description
To ensure transparency, inventory data should always be described and reported in a systematic way. Figure 4 shows the approach suggested in this thesis regarding power generation technologies, based on Curran et al. (2005), Edenhofer et al. (2011) and Turconi et al. (I and III). The approach is explained in detail in the remainder of this section.
Figure 4. Generalized lifecycle phases for an energy technology.
Fuel provision
Extraction
Processing
Transport
Infrastructure
Commissioning
Decommissioning
Maintenance
Solid residues
Plant operation
Direct emissions
Maxefficiency
Part load Start up

17
To enhance transparency, Turconi et al. (I) suggest identifying three phases in the power supply chain:
(i) Fuel provision: from the extraction of fuel to the gate of the plant
(ii) Plant operation: operation and maintenance, including residue disposal
(iii) Infrastructure: including commissioning and decommissioning of the power plant.
The three-phase approach presented above enables LCA practitioners to identify whether an existing process is compatible with the rest of their modelling in terms of system boundaries and study scope. If data and impacts are reported transparently and divided by lifecycle phases, practitioners can also build their own process, by appropriately combining different data from the existing literature. This simplified approach could be used when electricity is expected to provide a small contribution to the overall impacts of the product/service being assessed, or during the first iterations of an LCA.
Turconi et al. (III) introduced a further division within the direct emissions of dispatchable power plants, to capture the influence that the other generators within the power system – in particular variable renewables – have on different power plants. Three values were calculated for each power plant for every hour:
(i) Max_efficiency: considers power plant emissions, assuming steady-state operation at the optimal generation level, when efficiency is at its maximum; this value is relevant because it is usually reported in power generation technology LCAs.
(ii) Part-load: the difference between emissions calculated at Max_efficiency and actual emissions at the power plant caused by cycling (i.e. producing electricity at partial load and consequently with sub-optimal efficiency).
(iii) Start-up: includes emissions caused by fuel combustion during start-up, but without generating electricity (additional emissions of NOx and SO2, due to sub-optimal flue gas cleaning at low temperatures during start-up, may arise).

18
3.6.2 Process Cut-off
Curran et al. (2005) and Edenhofer et al. (2011) define which processes should be included in LCIs of power generation technologies: the extraction, processing and transport of the fuel should be included, as well as power plant commissioning/decommissioning, direct emissions (if any, i.e. from combustion), operation and maintenance and other material inputs and outputs (i.e. chemicals for flue gas cleaning and solid residues). Transmission and distribution should be included if a power plant requires specific transmission adjustments (see Section 3.6.4).
Within fuel provision, identifying the origin of biomass fuel deserves special attention (Turconi et al., I and IV) when performing a consequential LCA. Depending on the type of biomass, different cut-off rules apply. Three main cases can be identified:
(i) When residual biomass is used as fuel, and no alternative use for it can be identified, it is possible to apply the “zero burden approach” (Gentil et al., 2009) commonly used within waste management LCAs. In this case no impacts related to fuel provision are considered (except for fuel transportation, if any). This is the case, for example, for wood residues from the timber industry.
(ii) When biomass residues have an alternative function, the consequence of not fulfilling the alternative function should be considered. This happens when using straw as bedding/fodder or for energy production as opposed to leaving it in the fields, which is customary in Denmark to improve yield by providing structure and nutrients for future crops (Danish Ministry of the Environment, 2004). As a consequence of straw removal, the decreased quality of the soil and the need for additional fertilizers (and related emissions) should be included in the assessment (Cherubini and Strømman, 2011; Cherubini and Ulgiati, 2010), as well as premature/delayed CO2 emissions (Schmidt and Brandao 2013). Still, being a residue, the “zero burden approach” applies, and no upstream impacts are considered.
(iii) When biomass from energy crops is considered, upstream impacts associated with cultivation must be included. The most critical of these is the quantification of land use changes (LUC, i.e. conversion of the use or management of land and/or its cover, which changes its function as a carbon pool (IPCC, 2000)), both direct and indirect (through

19
market effects). The fundamental assumption here is that using land for energy crops typically implies that this land is not used for the cultivation of other agricultural commodities (e.g. food). When fuel biomass is produced on existing agricultural land, the demand for food and feed crops remains, and it may lead to the production of more food and feed somewhere else (European Commission, 2012). This leads to, for example, CO2 emissions owing to variations in above- and below- ground carbon stocks between the new crop system and the original one (Warner et al., 2013). LUC is not discussed further here, given the extensive literature available on the subject (e.g. Cherubini and Strømman, 2011; Hamelin et al., 2014; Hiederer et al., 2010; Marelli et al., 2011; Schmidt et al., 2012; Searchinger et al., 2008; Tonini et al., 2012; Warner et al., 2013).
3.6.3 Process Multifunctionality
It is very common for processes to have multiple outputs or inputs. Within electricity generation the most common example is co-production of electricity and heat in a combined heat and power (CHP) plant (Turconi et al., IV). CHP allows for producing heat and power at higher efficiencies than dedicated heat and power plants, thereby reducing costs, fuel consumption and emissions; thus, it is expected to grow in the future, i.e. by doubling current capacity in the EU by 2030 (IEA, 2008). All elementary exchanges are shared between the two co-products, heat and electricity, and a way to ‘assign’ shares between the two products needs to be found. It is common practice to use allocation for this problem, namely by “partitioning the input or output flows of a process or a product system between the product system under study and one or more other product systems” (ISO, 2006b).
LCA guidelines (ISO, 2006a, 2006c) suggest avoiding allocation (if possible) by using system expansion, in the case of CHP by including the effects of reductions in heat generated from the marginal heat source. Nevertheless, system expansion is often not applicable to CHP, because:
(i) It is a local issue – the marginal source of heat in the local district heating network should be identified (Fruergaard, Ekvall and Astrup, 2009). This is possible if assessing a specific CHP plant, but impossible if evaluating, for example, an entire power system (Turconi et al., IV).

20
(ii) The marginal technology might be a CHP plant. This is likely the case in Denmark, where these facilities provide 76% of district heating (Energistyrelsen 2010). In this case, allocation would have to be performed on the marginal technology, so the issue of allocation remains nonetheless.
When system expansion is not applicable, allocation can be performed. However, it should be noted that allocation is subjective, since ISO simply suggests possible approaches, e.g. using the physical properties or monetary values of co-products (ISO, 2006b). The approach chosen for allocation strongly influences the environmental impact of electricity from a CHP plant, and therefore it may be very important in an electricity system LCA. This issue is particularly relevant for Denmark, where CHP accounted for more than 60% of thermal electricity generated in 2010 (Energistyrelsen, 2010). The most traditional approach is to base the allocation on the energy content of electricity and heat, as we see in the following: Energy content
Share to heat (H):
Share to electricity (E):
This approach does not consider that electricity is a higher quality of energy than heat. In fact, for the same amount of energy, electricity allows doing more work than heat: this concept is known as exergy. Allocation based on exergy is therefore a suitable alternative to energy. The exergy content of electricity and heat is characterized by the Carnot factor (η), where η is 1 for electricity but for heat depends on the temperature of the delivered heat and the temperature of the surroundings, and will typically be around 0.15 for district heating (Fruergaard et al., 2009). Therefore: Exergy content
Share to heat (H): 0.15 ∙0.15 ∙
Share to electricity (E): 0.15 ∙

21
Alternatively, the EU uses a practical formula to apply taxation to CHP plants (European Commission 2004), here referred to as the ‘125% rule’, which is often used by industry for LCAs (Energinet.dk, 2012). In this case: 125% rule (Fin=Fuel input)
Share to heat (H): ∙ 1.25
Share to electricity (E): 1 All in all, given the relevance and the complexity of the issue, a simple solution should be agreed upon. In fact, since electricity consumption plays a key role in the LCA of many products (Curran et al., 2005), it is important that studies are based on the same approach, to ensure comparability and transparency. This issue is discussed further in section 4.1.1.
3.6.4 Transmission and Distribution
Electricity transmission and distribution (T&D) are often overlooked in electricity LCAs. Few studies include entire transmission networks (Harrison et al., 2010; Itten et al., 2013; Jorge and Hertwich 2013), while there are none on electricity distribution. Today, T&D-related environmental impacts can have relevant influence in electricity system LCAs, especially due to power losses (Turconi et al., II). In the future, owing to the use of smart grids and renewables, T&D impacts are likely to increase, and impacts from infrastructure may become significant compared to electricity generation itself. Regarding electricity generation, it should be considered that new technologies might need additional transmission (e.g. wind power in remote areas) or less transmission (e.g. distributed PV generation, connected directly to low voltage lines), which is usually not accounted for in electricity generation LCAs.
3.6.5 Electricity Import/Export
Within electricity system LCA, it should be specified whether the import/export of electricity is included – and how. Ecoinvent (Dones et al., 2007) defines two different mixes for each country included in their LCI: production mix and supply mix.
Production mix considers domestic electricity production only, and it is mostly useful within a national electricity sector, for example to identify environmental

22
hotspots in the power plant fleet. Conversely, electricity supply mix represents the actual electricity mix provided to customers from the grid; this mix is used, for example, in product LCAs to account for electricity consumed throughout the lifecycle. It includes domestic production and electricity import, which should be modelled consistently (i.e. in terms of temporal scope), and it can be calculated in different ways. Among those presented by Dones et al. (2007) and Itten et al. (2013), two possible approaches are suggested, depending on data availability (Turconi et al., IV):
(i) Domestic production + imports = supply mix This mix includes electricity imports in addition to domestic electricity production. There is no difference between electricity supplied to the domestic market and exported. If detailed information on the import/export is not available, this approach allows calculating a balanced and reliable estimation of the impacts from the electricity supply mix (Itten et al., 2013).
(ii) Domestic production + net imports/exports = supply mix This mix is based on the assumption that simultaneous (intra-hour) imports and exports are the result of transit trade. This approach requires large amounts of data, i.e. hourly values for import and export, but it does provide the greatest improvements over the previous method for countries largely involved in transit trade, such as Denmark, which represents a connection between central Europe and Nordic countries.

23
4. Results and Discussion In this chapter the major outcomes of the studies performed during the PhD are reported and discussed on a topic-by-topic basis. Section 4.1 includes findings on LCA of electricity generation technologies (from Turconi et al., I, III and IV); section 4.2 provides an LCI for electricity distribution and an LCA of T&D in Denmark (Turconi et al., II) and section 4.3 includes LCAs of low-carbon future scenarios for the Irish and Danish electricity systems (from Turconi et al., III and IV, respectively).
4.1 Electricity Generation Given the abundance of LCA studies on electricity generation technologies (sometimes with different underlying assumptions and LCA methodological approaches), and due to the importance of electricity in product LCAs, electricity generation datasets should be examined critically before using them or comparing to one another. In Turconi et al. (I), a critical review of 167 case studies involving the LCA of electricity generation based on hard coal, lignite, natural gas, oil, nuclear, biomass, hydroelectric, solar photovoltaic (PV) and wind was carried out to identify emission data ranges for GHG, NOx and SO2 related to individual technologies (Table 2 and Figure 5). It was found that direct Table 2. Lifecycle emission factors for electricity generation from selected technologies. Factors at the top of the table refer to electricity output [kg/MWhout], while values at the bottom of the table refer to fuel input [kg/GJin] (Turconi et al., I).
Energy source CO2-eq NOx SO2
Ele
ctri
city
ou
tpu
t
[kg
/MW
ho
ut]
Hard Coal 660-1050 0.3-3.9 0.03-6.7
Lignite 800-1300 0.2-1.7 0.6-7
Natural Gas 380-1000 0.2-3.8 0.01-0.32
Oil 530-900 0.5-1.5 0.85-8
Nuclear power 3-35 0.01-0.04 0.003-0.038
Biomass 8.5-130 0.08-1.7 0.03-0.94
Hydropower 2-20 0.004-0.06 0.001-0.03
Solar energy 13-190 0.15-0.40 0.12-0.29
Wind 3-41 0.02-0.11 0.02-0.09
Fu
el i
np
ut
[kg
/GJ i
n]
Hard Coal 46-125 0.028-0.352 0.003-0.596
Lignite 91-141 0.025-0.161 0.047-0.753
Natural Gas 57-85 0.037-0.277 0.0002-0.044
Oil 75-94 0.081-0.298 0.112-0.698
Biomass 0.1-10 0.007-0.128 0.004-0.094
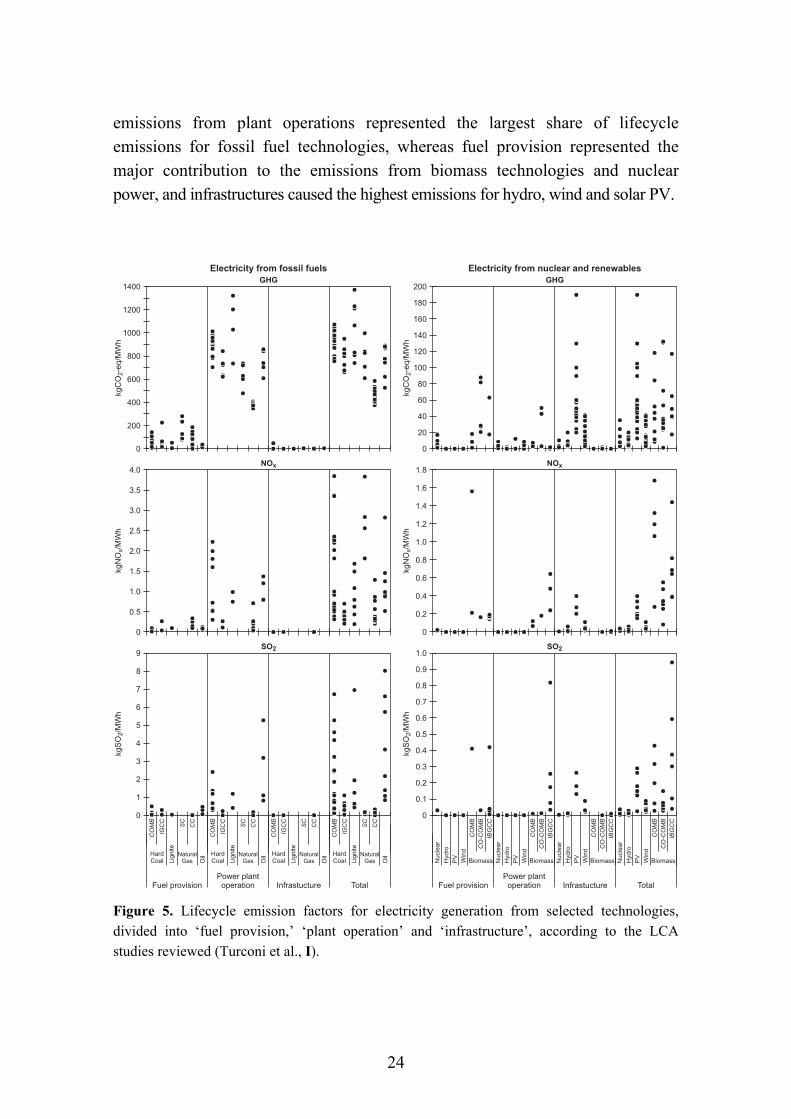
24
emissions from plant operations represented the largest share of lifecycle emissions for fossil fuel technologies, whereas fuel provision represented the major contribution to the emissions from biomass technologies and nuclear power, and infrastructures caused the highest emissions for hydro, wind and solar PV.
Figure 5. Lifecycle emission factors for electricity generation from selected technologies, divided into ‘fuel provision,’ ‘plant operation’ and ‘infrastructure’, according to the LCA studies reviewed (Turconi et al., I).
kg
SO
/MW
h2
kg
SO
/MW
h2
kg
NO
/MW
hx
kg
NO
/MW
hx
kg
CO
-eq
/MW
h2
kg
CO
-eq
/MW
h2
Electricity from nuclear and renewablesElectricity from fossil fuels
Fuel provisionFuel provisionPower plantoperation
Power plantoperation InfrastuctureInfrastucture TotalTotal
Nucle
ar
Nucle
ar
Nucle
ar
Nucle
ar
BiomassBiomass BiomassBiomassHardCoal
HardCoal
HardCoal
HardCoal
CO
MB
CO
MB
CO
MB
CO
MB
CO
MB
CO
MB
CO
MB
CO
MB
SC
SC
SC
SC
Hydro
Hydro
Hydro
Hydro
Lig
nite
Lig
nite
Lig
nite
Lig
nite
PV
PV
PV
PVNatural
GasNatural
GasNatural
GasNatural
Gas Win
d
Win
d
Win
d
Win
d
Oil
Oil
Oil
Oil
SO2
NOx
SO2
NOx
GHG GHG1400
1200
1000
800
600
400
200
0
4.0
3.5
3.0
2.5
2.0
1.5
1.0
0.5
0
9
8
7
6
5
4
3
2
1
0
1.8
1.6
1.4
1.2
1.0
0.8
0.6
0.4
0.2
0
200
180
160
140
120
100
80
60
40
20
0
1.0
0.9
0.8
0.7
0.6
0.5
0.4
0.3
0.2
0.1
0
CO
-CO
MB
CO
-CO
MB
CO
-CO
MB
CO
-CO
MB
IBG
CC
IBG
CC
IBG
CC
IBG
CC
IGC
C
IGC
C
IGC
C
IGC
C
CC
CC
CC
CC

25
Figure 6. Lifecycle GHG emission factors for electricity generation from selected technologies in Denmark in 2010 (per GJ fuel input). Data from Turconi et al., IV. ‘Wood Pellets’ refers to wood pellets from intensive forestry (including LUC); see section 4.1.2.
Figure 6 shows lifecycle GHG emission factors for Denmark in 2010 as calculated in Turconi et al. (IV). These results are within the ranges identified in Turconi et al. (I), except for straw and wood pellets, as those are commonly considered residues, and thus no impacts are associated with their provision. A further discussion on the topic can be found in section 4.1.2.
The high variability of data collected was caused not only by the various technological features of the power plants investigated, but also by geographical and temporal scope and the methodological choices of the underlying LCA studies. Table 3 lists the main technological and LCA methodological factors influencing the results for each type of technology considered. Table 3. Main technological and LCA methodological factors influencing the results for each type of technology considered in Turconi et al. (I).
Technology Technological factors Methodological factors
Fossil fuels Efficiency, FGC (NOx and SO2), Fuel quality (SO2)
-
Nuclear Electricity mix, fuel enrichment
IOA vs. PCA data
Hydro, Wind, Solar PV
Electricity mix, reference year
IOA vs. PCA data
Biomass Type, quality, origin of the feedstock
Multi input/output system, land use, constrained resource
28.2
112.0
86.3
58.9
91.4
24.843.0
1.4 27.7
0
20
40
60
80
100
120
Biogas Coal Gas oil Naturalgas
Residualoil
Straw Waste ResidualWood
WoodPellets
Global Warming
kg
CO
-eq
/GJ
2

26
Given the variety of emission factors found, the selection of inappropriate datasets not sufficiently reflecting the system in focus may clearly result in a significant under- or overestimation of emissions. This might be the case when, for example, selecting a specific coal power plant as representing ‘marginal electricity technology’ in an LCA. In order to obtain a realistic GHG emission factor, efficiency is the main driver, so the efficiency of the marginal electricity technology should be identified and the emission factor for a similar power plant should be used. To help an LCA practitioner following this approach, it is recommended to include clear statements on data applicability and methodological limitations in future research involving the LCA modelling of electricity generation, thereby enhancing transparency and the usability of results obtained from the LCA.
Figure 7 shows the GHG emissions of different fossil fuel-based power plants as a function of electricity generation efficiency. The linear correlation found suggests that the same values would be obtained using an emission factor per unit of fuel input; thus, this approach should be preferred to having different emission factors per unit of electricity generated, depending on the efficiency. Conversely, local conditions and geographical, temporal and technological data quality influence the results for nuclear and renewable electricity systems; consequently, the reference year and geographical origin of the materials and energy used for the infrastructure should be identified carefully. For the same technologies the
Figure 7. Relationship between plant efficiency and GHG direct emissions for hard coal, lignite, natural gas and oil (Turconi et al., I).
655035 60453020 554025
Efficiency [%]
1400
1200
1000
800
600
400
200
0
kgC
O-e
q/M
Wh
2
Lignite
Hard Coal
Oil
Natural Gas
Linear (Lignite)
Linear (Hard Coal)
Linear (Oil)
Linear (Natural Gas)

27
choice of using IOA or PCA data is of particular relevance, as previously shown in the literature (Dones et al., 2005; Sovacool, 2008; Weidema et al., 2009). Biomass represents a unique case, whereby several factors influence the outcome, mainly related to feedstock: its type and quality, origin (i.e. residual vs. energy crops), the inclusion of LUC and whether it is considered a constrained resource (see Section 4.1.2).
LCA studies on individual power generation technologies refer to their optimal working conditions, thereby disregarding emissions from cycling, but the environmental impact of a power plant depends also on its mode of operation (Denny and O’Malley, 2005). Databases such as Ecoinvent (Dones et al., 2007) report average emissions from years of operation, and therefore they include part load operations, albeit referring to past years. In such databases, power plant emissions are specific to the power system, and they do not reflect what might happen to the same power plant in a different power system, when subject to different operating regimes.
Turconi et al. (III) modelled different power plant portfolios for Ireland in 2025, with wind penetration between 29% and 41%. The objective of the study was to evaluate part-load and start-up emissions of GHG, NOx and SO2 from power plants, and their relationship with wind penetration. It was found that part-load operations considerably affect the average power plant efficiency, with all units seeing an average yearly efficiency remarkably less than optimal. In particular, peak-load power plants such as gas OCGTs and distillate oil power plants were most affected, generating electricity with respectively 3-7% and 7-11% less efficiency than optimal. Efficiency of mid-merit power plants, such as gas condensing and CCGT, was 1-3% lower compared to their optimal generation level. Lastly, base-load power plants, such as coal and peat, are required less cycling, thus their efficiency was only 0.6-1% below optimal over one year.
Given that production technologies are typically modelled as part of LCA of electricity generation assuming steady-state operation at full load, the efficiency reduction would result in a large underestimation of emissions, e.g. up to 65% for an oil power plant (Table 4). It was also found that start-ups caused very limited contribution to the overall emissions. Again, this suggests that using emission factors per unit of fuel input reduces the error compared to emission factors per unit of electricity generated. Based on the findings of Turconi et al. (III), cycling emissions are accounted for in Turconi et al. (IV) by using emission factors per unit of fuel input.

28
Table 4. Comparison between optimal and actual efficiency and CO2-NOx-SO2 emissions at the power plants considered (CCGT: Combined Cycle Gas Turbine; OCGT: Open Cycle Gas Turbine) (Turconi et al., III).
Values obtained with max_efficiency
approach Range identified within
Turconi et al. (III)
Gas CCGT Efficiency [%] 55.0 53.1 - 51.7
CO2 [kg/MWh] 368 383 - 395
NOx [g/MWh] 324 337 - 347
Gas New CCGT Efficiency [%] 57.9 56.7 - 54.2
CO2 [kg/MWh] 349 356 - 375
NOx [g/MWh] 307 313 - 330
Coal Efficiency [%] 35.3 34.6 - 34.2
CO2 [kg/MWh] 965 985 - 997
NOx [g/MWh] 3,737 3,815 - 3,861
SO2 [g/MWh] 4,703 4,802 - 4,860
Distillate Oil Efficiency [%] 31.9 24.6 - 18.8
CO2 [kg/MWh] 839 1,119 - 1,475
NOx [g/MWh] 1,800 2,400 - 3,164
SO2 [g/MWh] 5,401 7,203 - 9,495
Gas Condensing Efficiency [%] 57.2 56.2 - 54.1
CO2 [kg/MWh] 355 367 - 392
NOx [g/MWh] 312 323 - 345
Gas OCGT Efficiency [%] 45.0 42.3 - 37.7
CO2 [kg/MWh] 450 477 - 536
NOx [g/MWh] 396 420 - 472
Peat Efficiency [%] 38.1 37.5 - 37.2
CO2 [kg/MWh] 1,002 1,018 - 1,027
NOx [g/MWh] 1,089 1,106 - 1,116
SO2 [g/MWh] 941 956 - 965
In summary, current LCA methodology may underestimate power plant emissions, because power plant emissions depend on the role that individual power plants play in the power system. In future systems, where variable renewables such as wind and solar power will likely increase, cycling will become more and more important. Clarifying a power plant’s role would ensure that comparisons between technologies belonging to different categories are interpreted carefully, since two units providing different services (i.e. peak- and base-load) are not interchangeable and therefore are not fully comparable. To restore comparability between power generation technology LCAs, it is suggested that future studies: (i) identify the typical role of the power plant (base-load, mid-merit or peak-load) and, if possible, (ii) provide realistic emission

29
factors accounting for the expected operation of such a power plant, i.e. estimating ‘average efficiency during operation’ rather than using optimal efficiency. Alternatively, providing emission factors per unit of fuel input, together with the efficiency as a function of the load (as shown in Figure 3), would enable modelling each unit consistently with their role in the power system.
4.1.1 Case Study: Combined Heat and Power Plants
Combined heat and power generation is the most common multiple output process within the electricity sector. In Denmark alone, for instance, more than 600 CHP plants exist (Ens.dk, 2010). Table 5 shows the efficiencies and GHG emission factors of the power plants that consumed the highest amount of coal for energy production in Denmark in 2010 (Turconi et al., IV). Each power plant selected used at least 90% coal as fuel, and all of them are CHP. An IPCC default GHG emission factor of 95 g CO2-eq/MJcoal is used (IPCC 2006).
Table 5. Efficiency and GHG emissions from the top 10 coal CHP plants in Denmark in 2010.
Power plant name (ID)
Efficiency (avg. 2010)
GHG emission factor [g CO2-eq/kWh]
Electr. Heat 125%-rule Energy Exergy
Nordjyllandsværket (NVV3) 40% 21% 716 563 798
Enstedværket (ENV3) 39% 3% 861 813 873
Fynsværket (FVO7) 36% 33% 706 498 843
Studstrupværket (SSV3) 34% 36% 730 495 880
Asnæsværket (ASV5) 36% 5% 898 819 917
Amagerværket (AMV3) 35% 28% 755 540 870
Esbjergværket (ESV3) 38% 22% 736 567 822
Avedøreværket (AVV1) 36% 25% 761 562 861
Studstrupværket (SSV4) 33% 41% 705 465 881
Asnæsværket (ASV2) 23% 29% 1,128 654 1,238
GHG emissions per kWh electricity generated vary considerably, depending on the allocation methodology used. For example, exergy allocation provided GHG emissions 7-89% higher than energy allocation and 1-25% higher than the 125%-rule. The difference in the resulting environmental profile among the three methodologies is greater the more heat is produced. This highlights the importance of a common agreement on an allocation methodology.

30
The exergy approach seems to be the most appropriate for allocation in CHP plants, because as an LCA is related to a functional unit (including usability and quantified performance), the quality level of the energy output (its exergy) is of interest (Fischer et al., 2008). In other words, the functional unit identifies a service provided, which is the ability of the energy carrier to be converted into work; thereby, exergy is the best metric. In the literature the value of exergy is recognized within industrial ecology as an indicator for the optimal use of resources (Dincer, 2002; Rosen et al., 2008; Dewulf et al., 2008; Wall, 2004), and in process optimization in the energy sector (Doldersum, 1998; Gao et al., 2004; Sengupta et al., 2007). In particular, Rosen (2006) provides a thorough explanation of the advantages of using exergy allocation in carbon accounting for CHP plants.
4.1.2 Case Study: Source of Biomass
In Turconi et al. (IV), different types of biomass-to-energy technologies were included in the modelling. Waste and residual wood are by-products of other activities, therefore no impact was associated with their provision, following common LCA modelling (‘zero burden approach’ (Gentil et al., 2009)). Conversely, impacts from the provision of wood from energy crops, and the consequences of using straw for power production, should be accounted for (as explained in Section 3.6.2). In this section the impacts of biomass provision in Denmark are estimated based on the principles outlined by Schmidt and Brandao (2013). Results for straw represent the current situation, while those for wood refer to imported wood in a future scenario (2030), given the large amounts of biomass expected to be imported into Europe in the future (Heinimö and Junginger, 2009; IEA Bioenergy, 2011; IEA, 2012b; Junginger et al., 2014; Lamers et al., 2012; Panoutsou et al., 2009).
Straw
Based on Sander (1997), the contents of C, N, P and K in Danish straw were 409, 6.0, 0.7, 8.6 kg/Mgstraw, respectively, with a moisture content of 14% and a lower heating value of 14.9 MJ/kgstraw. It was assumed that an increased use of straw for energy would lead to a corresponding increased removal of straw from the field (i.e. the straw would be plowed back into the soil otherwise) (Schmidt and Brandao 2013).

31
The environmental consequences of this course of action were quantified as:
(i) decreased carbon sequestration, causing an emission of 145 kg CO2/Mgstraw (Petersen et al., 2013);
(ii) increased fertilizers use: 2.4 kg N/Mgstraw (i.e. 40% of N in the straw was assumed available for the plants, conforming with the Danish regulations for agricultural residue application (Danish Ministry of Food Agriculture and Fisheries, 2008)), 0.7 kg P/Mgstraw and 8.6 kg K/Mgstraw (i.e. 100% of P and K in the straw was assumed available for the plants (Hansen et al., 2006; Tonini and Astrup, 2012));
(iii) decreased N2O emissions (-0.09 kg N2O/Mgstraw) owing to reduced organic-N in the straw and related mineralization processes, following the approach of Cherubini and Ulgiati (2010) and Tonini and Astrup (2012).
Different processes contributed to the impacts of the straw-to-energy chain, depending on the impact category (Figure 8). Results are reported for a selection of ILCD-recommended (EC-JRC 2011) impact categories, and are relative to large power plants burning straw in Denmark in 2010 (Turconi et al., IV). Most GHG emissions are due to decreased carbon sequestration; terrestrial acidification and marine eutrophication are caused mainly by emissions at the power plant; while ecotoxicity and fossil resource depletion are due largely to the production of fertilizers needed as a consequence of straw removal from the fields.
Figure 8. Distribution of impact sources for the straw-to-energy chain in Denmark as calculated in Turconi et al. (IV).
0% 20% 40% 60% 80% 100%
Global Warming
Terrestrial Acidification
Marine Eutrophication
Ecotoxicity
Fossil Resources Depletion
Infrastructure Fertilizers Decresed C sequestration
Combustion emissions Disposal residues

32
Imported wood
Based on Böttcher et al. (2012), wood imported into the European Union in 2030 will likely come from a mix of the following: North America and Canada (62%), Brazil (20%), Russia (10%) and Africa (8%). The modelling of the imported wood included three phases:
(i) LUC associated with the requirement of wood from intensive forestry: 17 g CO2/MJwood, if displacing land not suitable for crops (Schmidt and Brandao, 2013), and 72 g CO2/MJwood, if displacing arable land (Tonini and Astrup, 2012).
(ii) Wood pellet preparation (i.e. chipping, pelletizing) and road transport in trucks, based on Jungbluth et al. (2007).
(iii) Transport overseas to Denmark, with an average distance of 6,400 km. The inventory data used was taken from the Ecoinvent process “transport, transoceanic freight ship” (Ecoinvent, 2010) based on Spielmann et al. (2007).
Figure 9 shows the sources of impact for a selection of ILCD-recommended (EC-JRC, 2011) impact categories relative to large power plants burning imported wood in Denmark in 2030 (Turconi et al., IV). The LUC is responsible for approximately 60% of GHG emissions. It should be noted that this value was obtained assuming displacement of land not suitable for crops (LUC=17 g CO2/MJwood, total=28 g CO2/MJwood); if arable land were displaced, GHG emissions would reach 83 g CO2/MJwood. The latter value is within typical ranges for fossil fuels such as coal (46-125 g CO2-eq/MJ) and natural gas (57-85 g CO2-eq/MJ) (Turconi et al., I).
For all other impact categories considered, overseas transport caused the majority of the impacts. This highlights the relevance of long-distance shipping as a significant source of emissions: to reduce most environmental impacts from imported wood it is in fact necessary either to find more local resources or to decrease emissions from overseas transportation (e.g. by shifting to a cleaner fuel than heavy oil or improving flue gas cleaning on transoceanic ships).

33
Figure 9. Distribution of impact sources for energy production from imported wood in Denmark (2030 EU wood import mix), as calculated in Turconi et al. (IV).
All in all, four out of five of the impact categories considered herein were dominated by straw provision, i.e. decreased C sequestration and fertilizer production. The same was valid for all impact categories with regards to imported wood, the main significant upstream processes being LUC and overseas transportation. Thus, the modelling of upstream processes for biomass should be included in the assessment and reported transparently.
4.2 Electricity Transmission and Distribution Besides impacts from electricity generation (Section 4.1), impacts from transmission and distribution of the generated electricity contribute to the environmental impacts of electricity delivered to end-users. T&D cause impacts due to both infrastructure and electricity losses, though environmental assessments of electricity generation often fail to include both types of impacts, thereby potentially leading to incorrect results.
While data on transmission are already available (Harrison et al., 2010; Jorge and Hertwich, 2013), Turconi et al. (II) provide the necessary information (LCI and LCIA) for electricity distribution networks: cable and transformer materials and manufacturing processes, housing (i.e. transformer stations), use and disposal are included. Other auxiliary equipment (i.e. circuit breakers and switchgears) is not included, but SF6 emissions from circuit breakers are accounted for (40 kg/y, 0.1% of the amount used in the entire network in Denmark). This information
0% 20% 40% 60% 80% 100%
Global Warming
Terrestrial Acidification
Marine Eutrophication
Ecotoxicity
Fossil Resources Depletion
Infrastructure Pellets preparation and local transport
Transport LUC
Combustion emissions Disposal residues

34
can be used to calculate LCIs for electricity distribution networks in countries with technological conditions similar to Denmark.
The 2010 Danish electricity distribution network was modelled, including power lines (50, 10, 0.4 kV), transformers (50/10 and 10/0.4 kV) and relevant auxiliary infrastructure (e.g. cable ditches, poles and substations). Two types of 50 kV power lines (underground and overhead) and 0.4 kV (copper and aluminum) were modelled. The lifetime of all components was assumed to be 40 years, except for transformers (30 years). Impacts from electricity distribution in Denmark were compared with those related to electricity transmission and generation, and the differences were then discussed. No data including an entire electricity distribution network were available prior to Turconi et al. (II).
4.2.1 Distribution Network Components
The environmental impacts of the abovementioned electricity distribution network components were calculated. A selection of impact categories from the ReCiPe methodology (Goedkoop et al., 2013) was used: Climate Change, Human Toxicity, Freshwater Eutrophication, Photochemical Oxidant Formation, Terrestrial Acidification, Terrestrial Ecotoxicity, Fossil Depletion and Metal Depletion.
Cable manufacturing was found to be the most significant process in regard to most impact categories, owing to the provision of raw materials, mainly copper and aluminum (Turconi et al., II). It was possible to compare two types of installations (underground and overhead) and conductor materials (copper and aluminum). Overhead lines provided lower impacts, owing to less aluminum in the cable and less concrete for the installation, as seen in Bumby et al. (2010), while aluminum cables caused lower environmental impacts than their copper counterparts for most impact categories (owing to the high energy intensity of aluminum production, this was, however, only valid with high recycling rates). With regards to transformer stations, it was found that the structure of the substation contributed more than 50% of the total impact for climate change and terrestrial ecotoxicity, owing to the production of cement.
4.2.2 Life Cycle Assessment for Denmark
When evaluated as part of the entire electricity system, used to deliver electricity to end-users in 2010 (including the generation, transmission and distribution of electricity), electricity distribution contributed less than 10% of impacts in all

35
categories (Turconi et al., II). The impacts from distribution were generally double those related to transmission.
Power losses and infrastructure caused impacts of various magnitudes in the individual impact categories, while impacts related to climate change, terrestrial acidification, terrestrial ecotoxicity, photochemical oxidant formation, human toxicity and fossil depletion were caused mainly by electricity generation. Therefore, losses constituted the main cause of impacts from electricity distribution (>90%) (Figure 10).
Figure 10. Environmental impacts from the transmission (T) and distribution (D) of 1 kWh of electricity in Denmark. From Turconi et al. (II).
Denmark generated 34 TWh of electricity in 2009, resulting in the emission of 22×106 Mg CO2-eq (Energinet.dk, 2010a), including approximately 1×10⁶ Mg CO2-eq from distribution (i.e. 65,000 Mg CO2-eq from infrastructure and 910,000 Mg CO2-eq from power losses). Failing to include electricity distribution in LCA studies involving electricity generation or consumption may correspond to about 4 to 6% of overall impacts, depending on the impact category. While most impacts related to electricity distribution were associated with power losses, the infrastructure itself contributed significantly to some impact categories (i.e. metal depletion and, to a minor extent, freshwater

36
eutrophication). This highlights the importance of including impacts from both power losses and infrastructure, in order to avoid problem shifting.
GHG emissions from infrastructure in distribution networks (2 g CO2-eq/kWh) are already within the same order of magnitude as the lowest end of the ranges reported for electricity generation (Turconi et al., I). When comparing electricity generation technologies, it should be accounted for that different technologies have different requirements in terms of T&D. For example: centralized plants feed electricity into the network at high voltage levels (making both transmission and distribution relevant); decentralized plants (e.g. rooftop PV) produce electricity at lower voltages (making only part of the distribution network relevant); and remote sources (e.g. offshore wind farms) require additional transmission lines. Impacts from transmission and distribution should be included in the assessment accordingly. So far, this has rarely been done within LCA, but it is recommended that these aspects are indeed included in future studies.
In the future, the environmental impact of distribution networks is likely to change, as smart grids will include, for example, information and communication technologies, thus leading to higher impacts from infrastructure. Owing to decentralized electricity generation and two-way electricity flows (customers being both consumers and producers of electricity, e.g. through rooftop PV or energy storage), loads and consequent losses might grow; conversely, the impacts from losses will decrease, because of larger shares of renewables. All things considered, impacts from infrastructure will likely increase, and they may become comparable to impacts associated with electricity generation itself.
4.3 Electricity Systems Previous LCAs have been performed mostly on existing power systems (Dones et al., 2007; Hondo, 2005; Mallia and Lewis, 2012): having emissions data from measurements at power plants allowed accurate LCI – and therefore reliable LCA results. When looking at possible future scenarios, though, the type and quality of power system modelling (i.e. time horizon, time step, level of detail and power plant characteristics included) will play a key role in determining the LCI. So far, few studies have attempted to combine power system modelling and LCA, as they have focused mostly on increased emissions as a result of the variability of wind on other power plants and often limited the assessment to GHG emissions (Pehnt et al., 2008; Valentino et al., 2012). The objective of

37
section 4.3.1 is to demonstrate the synergy between LCA and power system modelling by identifying the advantages of performing UC-ED modelling to define scenarios for an LCA; Ireland4 2025 is used as an example. These findings are then applied to the Danish electricity system (4.3.2), which is highly complex due to significant interactions with the heat sector and international markets (i.e. regarding electricity trading and biomass provision).
4.3.1 Case Study: Ireland
Turconi et al. (III) used LCA to assess the environmental impacts of an electricity system with a high penetration of variable renewables, in this case wind power. Ireland was used as a case study, and five possible portfolio scenarios for 2025 were modelled (Table 6).
Table 6. Ireland 2025, scenarios 1 – 5. Power plant capacity in MW (CCGT: Combined Cycle Gas Turbine; OCGT: Open Cycle Gas Turbine). Bold values indicate changes from the base scenario (Turconi et al., III).
Capacity [MW] Scenario 1
(Base) Scenario 2 (Low Wind)
Scenario 3 (High Wind)
Scenario 4 (No Coal)
Scenario 5 (Storage)
Wind 6000 4500 7500 6000 6000
Gas CCGT 3053 3053 3053 3053 3053
Gas New CCGT 1335 1335 1335 2235 1335
Coal 855 855 855 0 855
Distillate Oil 577 577 577 577 577
Gas Condensing 419 419 419 419 419
Gas OCGT 349 349 349 349 349
Peat 346 346 346 346 346
Embedded Generation* 294 294 294 294 294
Pumped Storage 292 292 292 292 292
Hydro 216 216 216 216 216
Waste 77 77 77 77 77
New Flexible Storage 0 0 0 0 100
*Embedded generation includes non-dispatchable plants in Ireland: CHP, biomass/landfill gas and small-scale hydro.
The functional unit of the study was ‘fulfilling the electricity demand in Ireland in 2025’, corresponding to 41 TWh. Hourly energy modelling with PLEXOS (Energy Exemplar Pty Ltd, 2010) was used to quantify the operational consequences of having a high share of renewable sources in the power system, providing electricity generation as shown in Figure 11 (different total generation
4 Throughout this thesis ’Ireland’ refers to the island of Ireland.

38
levels are due to import/export with Great Britain). Three emissions were included in the study – CO2, NOx and SO2 – representing the main energy sector contributors to global warming, acidification and eutrophication (Turconi et al., I).
Figure 11. Ireland 2025, scenarios 1 – 5. Power generation (CCGT: Combined Cycle Gas Turbine; OCGT: Open 495 Cycle Gas Turbine) (Turconi et al., III).
Lifecycle emissions of CO2, NOx and SO2 during one year of operation in Ireland in 2025 are shown in Figure 12. It is evident that CO2, NOx and SO2 followed the same trend, and the ranking of alternative scenarios is consistent across the three emissions.
3-H. Wind 4-NoCoal 5-Storage2-L. Wind1-Base
En
erg
y d
eliv
ere
d [
TW
h]
45
40
35
30
25
20
15
10
5
0
aaaaaaaaaaaaaaaaaaaaaa
aaaaaaaaaaaaaaaaaaaaaa
aaaaaaaaaaaaaaaaaaaaaa
aaaaaaaaaaaaaaaaaaaaaa
aaaaaaaaaaaaaaaaaaaaaa
aaaaaaaaaaaaaaaaaaaaaaaaaaaaaaaaaaaaaaaaaaaaaaaaaaaaaaaaaaaaaaaaaaaaaaaaaaaaaaaaaaaaaaaaaaaaaaaaaaaaaaaaaaaaaaaaaaaaaaaaaaaaaaaaaaaaaaaaaaaaaaaaaaaaaaaaaaaaaaaaaaaaaaaaaaaaaaaaaaaa
aaaaaaaaaaaaaaaaaaaaaaaaaaaaaaaaaaaaaaaaaaaaaaaaaaaaaaaaaaaaaaaaaaaaaaaaaaaaaaaaaaaaaaaaaaaaaaaaaaaaaaaaaaaaaaaaaaaaaaaaaaaaaaaaaaaaaaaaaaaaaaaa
aaaaaaaaaaaaaaaaaaaaaaaaaaaaaaaaaaaaaaaaaaaaaaaaaaaaaaaaaaaaaaaaaaaaaaaaaaaaaaaaaaaaaaaaaaaaaaaaaaaaaaaaaaaaaaaaaaaaaaaaaaaaaaaaaaaaaaaaaaaaaaaaaaaaaaaaaaaaaaaaaaaaaaaaaaaaaaaaaaaaaaaaaaaaaaaaaaaaaaaaaaaaaaaaaaaaaaaa
aaaaaaaaaaaaaaaaaaaaaaaaaaaaaaaaaaaaaaaaaaaaaaaaaaaaaaaaaaaaaaaaaaaaaaaaaaaaaaaaaaaaaaaaaaaaaaaaaaaaaaaaaaaaaaaaaaaaaaaaaaaaaaaaaaaaaaaaaaaaaaaaaaaaaaaaaaaaaaaaaaaaaaaaaaaaaaaaaaaa
aaaaaaaaaaaaaaaaaaaaaaaaaaaaaaaaaaaaaaaaaaaaaaaaaaaaaaaaaaaaaaaaaaaaaaaaaaaaaaaaaaaaaaaaaaaaaaaaaaaaaaaaaaaaaaaaaaaaaaaaaaaaaaaaaaaaaaaaaaaaaaaaaaaaaaaaaaaaaaaaaaaaaaaaaaaaaaaaaaaaaaaaaaaaa
aaaaaaaaaaaaaaa
Wind
Hydro
Distillate Oil
Gas - OCGT
Gas - New CCGT
Gas - CCGT
aaaaaaaaaaaaaaaaaa
Gas - Condensing
Coal
Peat
Embedded generation
Waste

39
Figure 12. Lifecycle emissions of CO2, NOx and SO2 during one year of operation in Ireland in 2025 (Turconi et al., III).
3-H.Wind 4-NoCoal 5-Storage2-L.Wind1-Base
SO
[Gg
/y]
2C
O[1
0G
g/y
]2
3N
O[G
g/y
]x
30
25
20
15
10
5
0
-5
30
25
20
15
10
5
0
-5
16
14
12
10
8
6
4
2
0
-2
CO2
SO2
NOx
Must-run
Infrastructure
Fuel provison
Net import
Start-up
Part load
Max_efficiency

40
Scenario 4, where coal is phased out completely and substituted with natural gas (CCGT), presented the lowest emissions (240 g CO2/kWh, 23% reduction compared to the scenario 1; 223 g NOx/kWh, -57%; and 38 g SO2/kWh, -91%), outperforming all other scenarios. Scenarios 2 and 3 presented a carbon intensity of 334 and 274 g CO2/kWh, respectively, showing that for each MW of wind capacity installed between 35 and 50% of total capacity, this system responds with a reduction of approximately 3 g CO2, owing to the increased wind power produced and the consequent lower utilization of fossil-based power generators. In scenario 5, with additional storage capacity, power plants were requested to cycle less frequently – which lowered emissions – but, on the other hand, load was shifted from natural gas (in particular CCGT, mid-merit) to coal (base-load) (Figure 11), ultimately increasing emissions. Overall, these two effects compensated for each other, resulting in similar emissions in scenario 1 and 5. These results identified phasing out coal as the main priority for decreasing CO2, NOx and SO2 emissions from the power sector in Ireland, rather than investing in new storage capacity to increase wind penetration and reduce cycling.
Emissions from cycling (total of part-load operation and start-up) accounted for 2.7-5.0% of lifecycle CO2 emissions, 2.9-6.4% for NOx and 2.2-3.6% for SO2 in the five scenarios considered. Cycling emissions could only be quantified because UC-ED was used; therefore, it is recommended to use this type of energy system modelling rather than more aggregated approaches (i.e. not accounting for system dynamics such as power plant ramping rates), as found in the literature (Astrup et al., 2011; Mathiesen et al., 2009). Emissions due to part-load operations were two to six times higher than those at start-up. In the current study, not accounting for cycling emissions would not have changed the ranking of the alternative scenarios. On the other hand, neglecting these emissions would have resulted in a significant underestimation of emissions, corresponding to 330-510 Gg CO2 yearly. It was found that cycling emissions increased in line with an increase in wind power. Introducing new storage capacity limited cycling issues, which is clearly important in terms of operational and maintenance costs for thermal plants and also in terms of operating costs for the system; however, achievable emission reductions are dependent on the plant portfolio, particularly base-load plants, which typically see an increase in capacity factors upon the introduction of bulk storage.

41
4.3.2 Case Study: Denmark
An LCA of the Danish electricity mix is much needed: Ecoinvent, the most widely used commercial LCA database, states that “due to lack of country-specific statistical data, combined heat production in CHP plants could not be taken into account” (Dones et al., 2007). In other words, all impacts from CHP are allocated to electricity. This is an acceptable simplification for most countries, but not for Denmark, where 670 CHP plants are installed, producing 63% of the total amount of thermal electricity in 2010 (Energistyrelsen 2010). Turconi et al. (IV) aimed at: (i) providing LCI data for electricity supply in Denmark in 2010 and 2030; (ii) assessing the environmental consequences of a low-carbon electricity scenario for Denmark; and (iii) discussing the influence of modelling electricity imports, biomass provision and CHP for a future Danish low-carbon electricity system. The functional unit of the study was ‘1 kWh of electricity to be consumed in Denmark,’ including both domestic production and import. The ILCD-recommended methodology was used for impact assessment (EC-JRC 2011), while EASETECH Energy was used for modelling.
Data on electricity generation, consumption and trade with neighboring countries for Denmark in 2010 were provided by the Danish Transmission System Operator Energinet.dk (2010a, 2010b). The two 2030 scenarios, low-carbon (2030-Green) and business-as-usual (2030-BaU), are based on UC-ED modelling by Energinet.dk using SIVAEL (Energinet.dk 2010c). Figure 13 and Table 7 report the main data for the three scenarios. Scenario 2010 presents a significant amount of wind power, and the thermal fleet relies heavily on coal; the 2030-BaU scenario presents an increase in wind power and biomass-based electricity (from domestic straw) and a decrease in coal-based electricity
Figure 13. Thermal electricity generation in Denmark for selected scenarios (Turconi et al., IV).
Gasoil
Naturalgas
Refinerygas
Refineryoil
Straw Waste WoodDK
WoodIMPORT
CoalBiogas
Th
erm
al e
lectr
icity g
en
era
tio
n [
TW
h]
14
12
10
8
6
4
2
0
2010
2030-BaU
2030-Green

42
Table 7. Electricity generation, consumption and import/export in Denmark for the selected scenarios (Turconi et al., IV).
Electricity Balance [GWh] 2010 2030-BaU 2030-Green
Traditional Consumption 35,513 37,960 38,923
Electric Vehicles 0 750 3,506
Heat pumps 0 3,690 3,789
Total Consumption 35,513 42,400 46,217
Wind (offshore) 2,686 14,800 29,897
Wind (onshore) 5,122 9,790 8,790
Hydro 30 30 30
Thermal power plants 28,811 26,784 25,324
Total Production 36,648 51,404 64,011
Wind share 21% 48% 60%
Export 11,765 33,161 39,991
Import 10,630 24,169 22,239
Net Export 1,135 8,991 17,752
compared to 2010; and 2030-Green presents a further increase in wind power and biomass (from imported wood) and a decrease in coal compared to 2030-BaU. Electricity consumption increases in both 2030 scenarios due to the electrification of the heat and transport sectors. Imports and exports of electricity increase as wind power penetration grows.
The purpose of shifting to a power system with a high share of renewable energy sources is the reduction of GHG emissions and dependency on fossil fuels (Edenhofer et al., 2011). The results show that this objective could be achieved (Figure 14): 2030-Green presented a reduction for the Global Warming and Fossil Resource Consumption categories when compared with both the current and the alternative 2030 scenario. This is due to increased wind energy penetration and the substitution of fossil fuel (coal and natural gas in particular) with biomass resources.
This trend was not consistent for all impact categories. Ozone Depletion, Photochemical Oxidant Formation, Particulate Matter, Terrestrial Acidification and Marine Eutrophication impacts showed a significant reduction from 2010, but presented similar values for the two 2030 scenarios. The impact reduction obtained in 2030-Green by using less fossil fuels in power plants was compensated for, compared with 2030-BaU, by the impacts of biomass transoceanic shipping and, to a minor extent, direct emissions from biomass

43
combustion at power plants. The same trend was found for toxic impacts, where emission reduction from coal-based electricity was compensated for by increased emissions in wind turbine manufacturing. It should be noted that toxicity impacts present a higher degree of uncertainty due to both methodology (EC-JRC 2011) and LCI data (steel manufacturing, the main source of impacts for 2030 scenarios, might not represent steel manufacturing practices in the period 2010-2030, as it refers to data from 1999-2002 (Burger and Bauer, 2007; Classen et al., 2009; Ecoinvent 2010)). Lastly, and not surprisingly, an increase in wind power and a decrease in fossil fuel-based electricity caused an increase in abiotic resource depletion (due to metals in wind turbines) and a decrease in fossil resources depleted.
Figure 14. Environmental impacts of the scenarios considered (per kWh electricity delivered). (Turconi et al., IV).
The main conclusion from this assessment was that low carbon electricity systems do reduce lifecycle GHG emissions and fossil resources, but they might increase environmental loads in other categories. Additionally, the biomass-to-energy chain should be investigated carefully. Assuming, for example, imported wood derived from intensive forestry on arable land, rather than on land not
0 00.20.1 0.40.3 0.5 0.6 0.00080.00060.00040.0002
0 0.00060.00040.0002
0.55
0.29
0.17
0.00070
0.00046
0.00045
0.00060
0.00036
0.00037
0.021
0.014
0.015
8.1
3.9
2.1 1.0 10.
-7
8.3 10.
-8
6.6 10.
-8
kg CO -eq/kWh2 kg NO -eq/kWhx
kg Sb-eq/kWh
kg SO -eq/kWh2 CTU/kWh
MJ/kWh
2030Green
2030Green
2030Green
2030Green
2030Green
2030Green
2030BaU
2030BaU
2030BaU
2030BaU
2030BaU
2030BaU
2010 2010
2010 2010
2010 2010
Global Warming (100 years) Marine Eutrophication
Terrestrial Acidification EcoToxicity
0
0
0.005
2
0.015
6
0.010
4
0.020 0.025
8 1.2 10.
-71.0 10.
-78 10.
-86 10.
-84 10.
-82 10.
-80
Fossil Resource Depletion Abiotic Resource Depletion
Biogas
Refinery gas
Coal
Residual oil
Gas oil
Straw
Import-DE
Waste
Import-NL
Wind
Import-NO
Wood DK
Import-SE
Wood IMPORT
Natural gas

44
suitable for crops, increased LUC from 17 g CO2/MJwood (Schmidt and Brandao 2013) to 72 g CO2/MJwood (Tonini and Astrup 2012). This would cause a 20% increase in GHG emissions per kWh delivered by the entire electricity system, from 168 g CO2-eq/kWh to 202 g CO2-eq/kWh.
The influence of the allocation methodology in CHP plants was evaluated for the 2030-Green scenario. When allocating impacts using energy and the 125% rule methodology (as opposed to exergy), the share of impacts allocated to electricity decreased, depending on the impact category, by 3-39% and 1-16%, respectively (Turconi et al., IV). This highlights the need for standardizing the allocation procedure for CHP plants, which is currently lacking. As previously mentioned, it is suggested to use exergy allocation for this purpose, as it is the most consistent approach with the LCA principles (4.1.1). Alternatively, in order to avoid having to perform an allocation, it is suggested that electricity and heating sectors should be assessed together.
Different methodologies exist for accounting for imports and exports of electricity in the electricity supply mix. Given the high amount of electricity traded in electricity systems with high shares of variable renewables, this has the potential to influence significantly the results of an LCA. The two approaches presented in section 3.6.4, a yearly balance and an hourly balance, were tested on 2030-Green (Table 8).
Table 8. Electricity imports in Denmark in the 2030-Green scenario.
Import [GWh] With yearly
balance With hourly
balance
Norway 4,968 979
Sweden 7,526 1,349
Germany 8,019 1,087
The Netherlands 1,726 292
TOTAL 22,239 3,706
Electricity imports caused 15-30% of the environmental impacts for most impact categories in the 2030-Green scenario (using a yearly balance). When an hourly balance was used, the results varied, depending on the impact category considered, between a 20% increase (Freshwater Eutrophication) and a 36% decrease (Ozone Depletion) (Turconi et al., IV). This shows the importance of the methodological approach used in accounting for importing electricity. As different possibilities are available, an agreement is necessary, which is currently

45
missing in LCA guidelines (ISO 2006a; Sinden et al., 2008). Since the modelling of imports and exports depends on available data (i.e. yearly or hourly values), it is suggested to provide yearly data for comparability with other studies, even when hourly information is available. Given the relevance of imported electricity impacts, it is important to model electricity imports with LCI data which are consistent with the rest of the modelling (i.e. temporal and technological scope).

46

47
5. Conclusions and Recommendations The goal of this PhD was to provide a systematic framework for the environmental assessment of electricity systems. The main findings of the research are summarized in this section, following the subdivision used in section 4.
Electricity generation
Great variability was found in the methodologies and assumptions used in different LCA studies on electricity generation technologies available in the literature. This prevents comparability between studies, and it may actually hinder their usability if transparency is absent. Data for electricity generation particularly need to be transparent, as they are used within a multitude of product LCAs. Emission factors based on unit of energy input at power plants should be preferred to those per unit of electricity generated, not depending on the efficiency of the power plant, the amount of cycling to which the power plant is subject and methodological choices in the case of CHP plants.
In particular, the approach used to assess the environmental impacts of power produced at CHP plants and from biomass feedstock was found to have a significant influence on the results. With regards to the cogeneration of heat and power, different approaches are available. When possible, assessment boundaries should be extended to include the heat sector, in order to avoid performing an allocation altogether; consequently, it is the recommended approach. Alternatively, exergy allocation should be used, as it is consistent with the concept of functional unit, which is the basis for every LCA, i.e. evaluating different types of energy on their ability to be converted into work. Relative to biomass feedstock, it was found that including LUC may increase the GHG emissions of electricity from energy crops to levels comparable to those of fossil fuels. Using biomass for electricity production may not provide the expected environmental benefits, so an assessment over the entire lifecycle, including LUC effects, should be common practice. Conversely, residual biomass was found to be a viable mean of producing electricity with reduced environmental impacts.
A critical aspect that so far has only been qualitatively discussed within the LCA community is that the role of a power plant within the power system should be considered when performing LCA of electricity generation technologies. For example, providing base-load electricity as opposed to being a variable source is

48
a change in the functional unit under consideration, because the service provided to the power system is different. Only power plants with the same role – and therefore the same functional unit – should be compared directly. This is an area where further research is clearly needed.
Electricity transmission and distribution
A new LCI dataset for electricity distribution was developed during this PhD; no data were found in the previous literature including an entire electricity distribution network. Denmark was used as a case study, but the data could be used to model networks in other regions with similar economic and technological conditions.
The LCA results for the Danish T&D showed that electricity distribution causes impacts mainly through power losses, but infrastructure also provide significant impacts to eutrophication and metal depletion. In general, electricity distribution causes greater impacts than transmission, because of higher losses and the greater consumption of materials. Thus the distribution of electricity should be accounted for when performing an electricity system LCA. Furthermore, when comparing electricity generation technologies which feed electricity at different voltages (i.e. centralized versus decentralized electricity sources), the different T&D infrastructures involved should be accounted for: it was found that impacts from T&D might influence the outcome of such a comparison.
Lastly, electricity distribution is changing rapidly owing to the implementation of smart grids. In future electricity systems the impacts of distribution network equipment are expected to increase, and as renewable sources will provide lower impacts, those caused by infrastructure may become comparable to those associated with electricity generation itself. Further research is therefore needed in this field.
Electricity systems
Two LCA studies on power systems were carried out during this PhD, with a particular focus on future power systems with high wind power penetration. It was found that a large amount of wind power causes increased emissions in other power plants in the power system due to cycling; nevertheless, these impacts are lower than the benefits of increasing wind in the system. The storage of electricity has the potential to limit cycling, but the environmental benefits correlate strictly with the base-load fleet of the system. If the base-load runs on

49
fossil fuels, electricity storage may become a disadvantage from an environmental standpoint, increasing overall emissions. These aspects could only be seen because UC-ED was used, so it is recommended to use this type of energy system modelling for future studies.
When performing an electricity system LCA, especially in low-carbon future scenarios, setting appropriate system boundaries is crucial to the results, which in fact depend on interactions with other sectors (i.e. heat) and different markets (i.e. the global biomass market and electricity trading with neighboring countries). If possible, the heat sector should be included in the assessment or, alternatively, it is suggested to allocate these impacts using exergy allocation. Impacts on the biomass market should also be included in the assessment, at least through the estimation of LUC effects. Lastly, the methodology for accounting for electricity trading strictly depends on available data (hourly or yearly). Since hourly modelling is often unavailable, it is suggested to provide yearly data for comparability with other studies, even when hourly information is available. Once again, it is important for transparency and data usability that the approach used is explained clearly. The import mix should be modelled consistently with the rest of the LCA (i.e. technological and temporal scope).
Possible future scenarios for the Danish electricity system were modelled using EASETECH Energy. It was found that GHG emissions and fossil fuel consumption can be reduced by increasing wind penetration and substituting some coal and gas with residual biomass. Using biomass from energy crops might induce LUC effects, so it should be considered carefully.

50

51
6. Future Research The findings of this PhD provide the basis for further investigations into the following topics.
Electricity generation
The functional unit commonly used for LCA of power generation technologies is the unit of electricity output, regardless of the role the power plant plays in the electricity system (i.e. base-load, load following, peak-load or variable source). As previously explained, this means that the actual service the power plant provides to the electricity system is not identified clearly. With electricity systems shifting towards low-carbon, increasing the amount of variable renewables, the role of a power plant will become more and more important. In other words, a peak-load power plant has the ability to increase the amount of wind power that a system can integrate safely, by adjusting its power output and ensuring that demand is fulfilled at any time; base-load power plants cannot provide this service, potentially leading to wind curtailment and unfulfilled demand. A quantification of this type of ancillary service should be included in the functional unit. Potential solutions to this issue could be the integration of LCA with power system modelling or with economic modelling (i.e. by using the different prices paid by transmission system operators for base-load and peak-load electricity).
EASETECH Energy was developed during this PhD thesis, and it was found to be an appropriate tool for LCAs of power generation technologies. Nevertheless, data currently available in the model are limited, and the energy conversion processes need further development. Research should therefore focus, for example, on combustion modelling and pollutant formation and abatement, as well as on modelling energy conversion processes other than direct combustion.
Electricity transmission and distribution
The environmental impacts of future electricity distribution networks (smart grids) is uncertain. New components will be implemented, for example, to enable two-way power flow and communications. As the environmental impact of power losses will eventually decrease (owing to larger shares of renewables), infrastructure contributions are expected to gain importance. LCIs for smart grid components are not available yet; therefore, further research should focus on

52
developing these datasets to allow smart grids to be included in any future power system LCAs.
Electricity systems
From the LCA of possible 2030 Danish power systems, it is clear that the links between the electricity sector and other sectors such as heat and transport are increasing to the point that a combined assessment would be preferable. Future work should focus in this direction, in order to identify the environmental benefits of energy system integration. Such assessments exist in the literature, but they are usually performed with aggregated tools and do not account for short-term system dynamics, potentially providing imprecise results.
Given the urgency of reducing GHG emissions to limit global warming, the transition period before implementing low-carbon energy systems is of interest. Rather than assessing the reduction in emissions between two scenarios 20 years apart, the development of the system could be focused on, which would help in understanding the prioritizations needed to reduce overall emissions in the coming years.

53
7. References Arvidsson, Rickard, Kristin Fransson, Morgan Fröling, Magdalena Svanström, and Sverker
Molander. 2012. “Energy Use Indicators in Energy and Life Cycle Assessments of Biofuels: Review and Recommendations.” Journal of Cleaner Production 31:54–61.
Astrup, Thomas, Davide Tonini, Lorie Hamelin, and Henrik Wenzel. 2011. Environmental Assessment of Renewable Energy Scenarios towards 2050. Last accessed November 20, 2013 (http://www.ceesa.plan.aau.dk/Publi cations).
Böttcher, Hannes, Stefan Frank, and Petr Havlik. 2012. “Biomass Futures: Biomass Availability & Supply Analysis.” Last accessed February 18, 2014 (http://www.biomassfutures.eu/ public_docs/final_deliverables/WP3).
Bumby, Sarah, Ekaterina Druzhinina, Rebe Feraldi, Danae Werthmann, Roland Geyer, and Jack Sahl. 2010. “Life Cycle Assessment of Overhead and Underground Primary Power Distribution.” Environmental science & technology 44(14):5587–93.
Burger, Bastian, and Christian Bauer. 2007. Ecoinvent Report No. 6-XIII - Windkraft. Last accessed February 18, 2014 (http://www.ecoinvent.ch/)
Cherubini, Francesco, and Anders Hammer Strømman. 2011. “Life Cycle Assessment of Bioenergy Systems: State of the Art and Future Challenges.” Bioresource technology 102(2):437–51.
Cherubini, Francesco, and Sergio Ulgiati. 2010. “Crop Residues as Raw Materials for Biorefinery Systems – A LCA Case Study.” Applied Energy 87(1):47–57.
Classen, Mischa, Hans-Jörg Althaus, Silvio Blaser, Wolfram Scharnhorst, Matthias Tuchschmid, Niels Jungbluth, and Mireille Faist Emmenegge. 2009. Ecoinvent Report No. 10 - Life Cycle Inventories of Metals. Last accessed February 18, 2014 (http://www.ecoinvent.ch/).
Clavreul, Julie, Hubert Baumeister, Thomas H. Christensen, and Anders Damgaard. 2013. “EASETECH – an Environmental Assessment System for Envirommental TECHnologies.” Submitted to Environmental Modelling Software.
Curran, Mary Ann, Margaret Mann, and Gregory Norris. 2005. “The International Workshop on Electricity Data for Life Cycle Inventories.” Journal of Cleaner Production 13(8):853–62.
Danish Government. 2011. Our Future Energy. Last accessed February 18, 2014 (http://www.cphcleantech.com/media/1465822/our_future_energy.pdf).
Danish Ministry of Food Agriculture and Fisheries. 2008. Plantedirektoratets Bekendtgoerelse
Nr. 786 Af 22. Juli 2008 Om Jordbrugets Anvendelse Af Goedning Og Om Plantedaekke I Planteperiode 2008/2009. Last accessed February 18, 2014 (https://www.retsinformation. dk/Forms/R0710.aspx?id= 116486).
Danish Ministry of the Environment. 2004. The Forest Act. Act Nr 453 of 9 June 2004. Last accessed February 18, 2014 (http://www.mim.dk/NR/rdonlyres/ 42BD2033-067E-48DF-A43D-63BBC782BBC6/8282/Forestact.pdf ).

54
Davidsson, Simon, Mikael Höök, and Göran Wall. 2012. “A Review of Life Cycle Assessments on Wind Energy Systems.” The International Journal of Life Cycle Assessment 17(6):729–42.
Denny, Eleanor, and Mark O’Malley. 2005. “Wind Generation, Power System Operation and Emissions Reduction.” IEEE Transactions on Power Systems (2):1–8.
Denny, Eleanor, and Mark O’Malley. 2007. “Quantifying the Total Net Benefits of Grid Integrated Wind.” IEEE Transactions on Power Systems 22(2):605–15.
Dewulf, Jo, Herman Van Langenhove, Bart Muys, Stijn Bruers, Bhavik R. Bakshi, Geoffrey F. Grubb, D. M. Paulus and Enrico Sciubba. 2008. “Exergy: Its Potential and Limitations in Environmental Science and Technology.” Environmental Science and Technology 42(7):2221–32.
Dincer, Ibrahim 2002. “The Role of Exergy in Energy Policy Making.” Energy Policy 30(2):137–49.
Doldersum, A. 1998. “Exergy Analysis Proves Viability of Process Modifications.” Energy Conversion and Management 39(16-18):1781–89.
Dones, Roberto, Thomas Heck, Christian Bauer and Stefan Hirschberg, Peter Bickel, and Philipp Preiss. 2005. ExternE Externalities of Energy: Extension of Accounting Framework and Policy Applications New Energy Technologies.
Dones, Roberto, Christian Bauer, Rita Bolliger, Bastian Burger, Thomas Heck, Alexander Röder, Mireille Faist Emmenegger, Rolf Frischknecht, Niels Jungbluth, and Matthias Tuchschmid. 2007. “Life Cycle Inventories of Energy Systems: Results for Current Systems in Switzerland and Other UCTE Countries.” Ecoinvent report 5(5). Last accessed February 18, 2014 (http://www.ecoinvent.ch/).
EASEWASTE. 2013. “EASEWASTE Website - Publications.” Last accessed July 29, 2013 (http://www.easewaste.dk).
EC-JRC. 2010. ILCD Handbook - General Guide on LCA - Detailed Guidance. Last accessed February 18, 2014 (http://www.jrc.europa.eu/).
EC-JRC. 2011. ILCD Handbook - Recommendations for Life Cycle Impact Assessment in the European Context. Last accessed February 18, 2014 (http://www.jrc.europa.eu/).
ECN. 2014. “Phyllis 2 Database.” Energy research Centre of the Netherlands. Last accessed January 29, 2014 (https://www.ecn.nl/phyllis2).
Ecoinvent. 2010. Ecoinvent Data v.2.2. Last accessed February 18, 2014 (http://www.ecoinvent.ch/).
Edenhofer, Ottmar, Ramón Pichs Madruga, Youba Sokona, Kristin Seyboth, Patrick Eickemeier, Patrick Matschoss, Gerrit Hansen, Susanne Kadner, Steffen Schlömer, Timm Zwickel, and Christoph von Stechow. 2011. IPCC Special Report on Renewable Energy Sources and Climate Change Mitigation. Last accessed February 18, 2014 (http://srren.ipcc-wg3.de/ report).
Ekvall, Tomas, and Bo Weidema. 2004. “System Boundaries and Input Data in Consequential Life Cycle Inventory Analysis.” The International Journal of Life Cycle Assessment 9(3):161–71.

55
Energinet.dk. 2010a. Environmental Report 2010. Last accessed February 18, 2014 (http://www.energinet.dk/DA/KLIMA-OG-MILJOE/Miljoerapportering/Sider/default.as px).
Energinet.dk. 2010b. “Miljørapport 2010 - Baggrundsrapport.” Last accessed February 18, 2014 (http://www.energinet.dk/DA/KLIMA-OG-MILJOE/Miljoerapportering/Sider/default.as px).
Energinet.dk. 2010c. “SIVAEL.” Last accessed October 23, 2013 (http://energinet.dk/ DA/El/Udvikling-af-elsystemet/Analysemodeller/Sider/Sivael.aspx).
Energinet.dk. 2012. “Metode- Og Datagrundlag Til Miljørapport.” Last accessed February 18, 2014 (http://www.energinet.dk/DA/KLIMA-OG-MILJOE/Miljoerapportering/Sider/ default. aspx).
Energinet.dk, and Energi Styrelsen. 2012. Technology Data for Energy Plants. Last accessed February 18, 2014 (http://www.energinet.dk/SiteCollection Documents/Danske%20doku menter/Forskning/Technology_data_for_energy_plants.pdf).
Energistyrelsen. 2010. “Danish Key Figures.” Last accessed January 23, 2014 (http://www.ens.dk/node/2239).
Energy Exemplar Pty Ltd. 2010. “PLEXOS for Power Systems.” Last accessed January 29, 2014 (http://www.energyexemplar.com).
Ens.dk. 2010. “Large and Small Scale District Heating Plants.” Last accessed February 18, 2014 (http://www.ens.dk/en/supply/heat-supply-denmark/large-small-scale-district-heating-plants).
European Commission. 2004. “Directive 2004/8/EC.” 50–60. Last accessed February 18, 2014 (http://eur-lex.europa.eu/).
European Commission. 2012. Indirect Land Use Change (ILUC). Last accessed February 18, 2014 (http://europa.eu/rapid/press-release_MEMO-12-787_en).
Finnveden, Göran Michael Z. Hauschild, Tomas Ekvall, Jeroen Guinee, Reinout Heijungs, Stefanie Hellweg, Annette Koehler, David Pennington, and Sangwon Suh. 2009. “Recent Developments in Life Cycle Assessment.” Journal of environmental management 91(1):1–21.
Fischer, Matthias, Oliver Schuller, Stefan Albrecht, and Michael Faltenbacher. 2008. “Exergy-Efficiency as Enhancement of Energy-Efficiency – an LCA Perspective.” in LCA8, Seattle.
Fruergaard, Thilde, Thomas Ekvall, and Tomas Astrup. 2009. “Energy Use and Recovery in Waste Management and Implications for Accounting of Greenhouse Gases and Global Warming Contributions.” Waste management & research 27(8):724–37.
Gao, Lin, Hongguang Jin, Zelong Liu, and Danxing Zheng. 2004. “Exergy Analysis of Coal-Based Polygeneration System for Power and Chemical Production.” Energy 29(12-15):2359–71.
Gentil, Emmanuel, Thomas H. Christensen, and Emmanuelle Aoustin. 2009. “Greenhouse Gas Accounting and Waste Management.” Waste Management & Research 27(8):696–706.

56
Goedkoop, Mark, Reinout Heijungs, Mark Huijbregts, An De Schryver, Jaap Struijs, and Rosalie van Zelm. 2013. ReCiPe 2008. Last accessed January 23, 2014 (http://www.lcia-recipe. net/).
Gross, Robert, Philip Heptonstall, Matthew Leach, Dennis Anderson, Tim Green, and Jim Skea. 2007. “Renewables and the Grid: Understanding Intermittency.” Proceedings of the Institution of Civil Engineers - Energy.
Guinée, Jeroen. 2002. Handbook on Life Cycle Assessment. Operational Guide to the ISO Standards. Kluwer Academic Publishers.
Hamelin, Lorie, Irina Naroznova, and Henrik Wenzel. 2014. “Environmental Consequences of Different Carbon Alternatives for Increased Manure-Based Biogas.” Applied Energy 114:774–82.
Hansen, Trine L., Gurbakhash S. Bhander, Thomas H. Christensen, Sander Bruun, and Lars S. Jensen. 2006. “Life Cycle Modelling of Environmental Impacts of Application of Processed Organic Municipal Solid Waste on Agricultural Land (Easewaste).” Waste Management & Research 24(2):153–66.
Harrison, Gareth P., Edward (Ned). J. Maclean, Serafeim Karamanlis, and Luis F. Ochoa. 2010. “Life Cycle Assessment of the Transmission Network in Great Britain.” Energy Policy 38(7):3622–31.
Heinimö, Jussi, and Martin Junginger. 2009. “Production and Trading of Biomass for Energy – An Overview of the Global Status.” Biomass and Bioenergy 33(9):1310–20.
Hendrickson, Chris, Arpad Horvath, Satish Joshi, and Lester Lave. 1998. “Economic Input-Output Models for Environmental Life-Cycle Assessment.” Environmental Science & Technology 32(7):184.
Hiederer, Roland, Fabien Ramos, Claudia Capitani, Renate Koeble, Oscar Gomez, Declan Mulligan, and Luisa Marelli. 2010. “Biofuels : A New Methodology to Estimate GHG Emissions from Global Land Use Change.” Last accessed February 18, 2014 (http://www.jrc.ec.europa.eu/).
Hondo, Hiroki. 2005. “Life Cycle GHG Emission Analysis of Power Generation Systems: Japanese Case.” Energy 30(11-12):2042–56.
IEA. 2008. Combined Heat and Power: Evaluating the Benefits of Greater Global Investment. Last accessed February 18, 2014 (http://www.iea.org/media/files/chp/chp_report.pdf).
IEA. 2012a. Energy Technology Perspectives 2012. Last accessed February 18, 2014 (http://www.iea.org/etp/).
IEA. 2012b. Technology Roadmap Bioenergy for Heat and Power. Last accessed February 18, 2014 (https://www.iea.org/roadmaps/).
IEA Bioenergy. 2011. Global Wood Pellet Industry: Market and Trade Study. Last accessed October 14, 2013 (http://www.bioenergytrade.org/downloads/t40-global-wood-pellet-market-study_final.pdf).
IPCC. 2000. IPCC Special Report: Land Use, Land-Use Change, and Forestry. Last accessed February 18, 2014 (http://www.ipcc.ch/pdf/special-reports/ spm/srl-en.pdf).

57
IPCC. 2006. IPCC Guidelines for National Greenhouse Gas Inventories - Chapter 2: Stationary Combustion. Last accessed February 18, 2014 (http://www.ipcc-nggip.iges.or.jp/public/ 2006gl/pdf/2_Volume2/V2_2_Ch2_Stationary_Combustion.pdf).
ISO. 2006a. EN ISO 14040 Environmental Management – Life Cycle Assessment – Principles and Framework. Last accessed February 18, 2014 (http://www.iso.org/iso/catalogue_ detail?csnumber=37456).
ISO. 2006b. EN ISO 14044 Environmental Management – Life Cycle Assessment – Requirements and Guidelines. Last accessed February 18, 2014 (http://www.iso.org/iso/ catalogue_ detail?csnumber=38498).
ISO. 2006c. EN ISO 14047 Environmental Management – Life Cycle Assessment – Examples of Application of ISO 14042. Last accessed February 18, 2014 (http://www.iso.org/iso/home/ store/catalogue_ics/catalogue_detail_ics.htm?csnumber=57109).
Itten, René, Rolf Frischknecht, and Matthias Stucki. 2013. Life Cycle Inventories of Electricity Mixes and Grid. Last accessed February 18, 2014 (http://www.esu-services.ch/fileadmin/ download/publicLCI/itten-2012-electricity-mix).
Jorge, Raquel Santos, and Edgar G. Hertwich. 2013. “Environmental Evaluation of Power Transmission in Norway.” Applied Energy 101:513–20.
Jungbluth, Niels, Mireille Faist Emmenegger, Fredy Dinkel, Cornelia Stettler, Gabor Doka, Mike Chudacoff, Arnaud Dauriat, Edgard Gnansounou, Michael Spielmann, Jürgen Sutter, Natascha Kljun, Mario Keller, and Konrad Schleiss. 2007. Ecoinvent Report No. 17 - Life Cycle Inventories of Bioenergy. Last accessed February 18, 2014 (http://www.ecoinvent.ch/).
Junginger, Martin, Chun Sheng Goh, and André Faaij. 2014. International Bioenergy Trade:
History, Status & Outlook on Securing Sustainable Bioenergy Supply, Demand and Markets. Last accessed February 18, 2014 (http://link.springer.com/10.1007/978-94-007-6982-3).
Katzenstein, Warren, and Jay Apt. 2009. “Air Emissions due to Wind and Solar Power.” Environmental science & technology 43(2):253–58.
Kirkeby, Janus, Harpa Birgisdottir, Trine L. Hansen, Thomas H. Christensen, Gurbakhash S. Bhander, and Michael Hauschild. 2006. “Environmental Assessment of Solid Waste Systems and Technologies: EASEWASTE.” Waste Management and Research.
Kristoffersen, Trine Krogh, and Peter Meibom. 2013. Mathematical Programming Models for Energy System Analysis: An Introduction. Lecture notes, Technical University of Denmark.
Lamers, Patrick, Martin Junginger, Carlo Hamelinck, and André Faaij. 2012. “Developments in International Solid Biofuel trade—An Analysis of Volumes, Policies, and Market Factors.” Renewable and Sustainable Energy Reviews 16(5):3176–99.
Lew, Debra, Greg Brinkman, Nikhil Kumar, Philip Besuner, Dwight Agan, and Steve Lefton. 2012. “Impacts of Wind and Solar on Emissions and Wear and Tear of Fossil-Fueled Generators.” 2012 IEEE Power and Energy Society General Meeting 1–8.

58
Mallia, Eric, and Geoffrey Lewis. 2012. “Life Cycle Greenhouse Gas Emissions of Electricity Generation in the Province of Ontario, Canada.” The International Journal of Life Cycle Assessment 18(2):377–91.
Marelli, Luisa, F. Ramos, R. Hiederer, and R. Koeble. 2011. Estimate of GHG Emissions from Global Land Use Change Scenarios. Last accessed February 18, 2014 (http://re.jrc. ec.europa.eu).
Masanet, Eric, Yuan Chang, Anand R. Gopal, Peter Larsen, William R. Morrow III, Roger Sathre, Arman Shehabi, and Pei Zhai. 2012. “Life-Cycle Assessment of Electric Power Systems.” Annual Review of Environment and Resources 38(1):107-136.
Mathiesen, Brian Vad, Henrik Lund, and Kenneth Karlsson. 2009. The IDA Climate Plan 2050. Last accessed February 18, 2014 (http://energy.plan.aau.dk/IDAClimatePlan-files/ Summary_BV_Mathiesen_UK_IDAs_ Climate_Plan_2050_Background_Report.pdf)
Meier, Paul, Paul P.H. Wilson, Gerald L. Kulcinski, and Paul L. Denholm. 2005. “US Electric Industry Response to Carbon Constraint: A Life-Cycle Assessment of Supply Side Alternatives.” Energy Policy 33(9):1099–1108.
Modahl, Ingunn Saur, Hanne Lerche Raadal, Luc Gagnon, and Tor Haakon Bakken. 2013. “How Methodological Issues Affect the Energy Indicator Results for Different Electricity Generation Technologies.” Energy Policy 63:283–99.
Münster, Marie, and Peter Meibom. 2011. “Optimization of use of waste in the future energy system.” Energy 36:1612-1622.
NERI. 2010. Danish Emission Inventories for Stationary Combustion Plants - Inventories until 2008. Last accessed February 18, 2014 (http://www2.dmu.dk/Pub/FR795.pdf).
NREL. 2009. Life Cycle Assessment Harmonization Project. Last accessed February 18, 2014 (http://www.nrel.gov/analysis/sustain_lcah.html).
NREL. 2010. Western Wind and Solar Integration Study. Last accessed February 18, 2014 (http://www.nrel.gov/electricity/transmission/western_wind.html).
NREL. 2013. The Western Wind and Solar Integration Study Phase 2. Last accessed February 18, 2014 (http://www.nrel.gov/electricity/transmission/ western_wind.html).
Panoutsou, Calliope, John Eleftheriadis, and Anastasia Nikolaou. 2009. “Biomass Supply in EU27 from 2010 to 2030.” Energy Policy 37(12):5675–86.
PE International. 2010. GaBi 4.4. Last accessed February 18, 2014 (http://www.gabi-software.com/solutions/life-cycle-assessment/).
Pehnt, Martin, Michael Oeser, and Derk Swider. 2008. “Consequential Environmental System Analysis of Expected Offshore Wind Electricity Production in Germany.” Energy 33(5):747–59.
Petersen, Bjørn Molt, Marie Trydeman Knudsen, John Erik Hermansen, and Niels Halberg. 2013. “An Approach to Include Soil Carbon Changes in Life Cycle Assessments.” Journal of Cleaner Production 52:217–24.
Pré Consultants. 2010. SimaPro 7. Last accessed February 18, 2014 (http://www.pre-sustainability.com/simapro-lca-software).
59
Riber, Christian, Claus Petersen, and Thomas H. Christensen. 2009. “Chemical Composition of Material Fractions in Danish Household Waste.” Waste management 29(4):1251–57.
Rosen, Marc A. 2006. An Exergy-Based Method for Allocating Carbon Dioxide Emissions from Cogeneration Systems - Part II: Justification for Exergy Basis. Last accessed February 18, 2014 (http://ieeexplore.ieee.org/xpls/ abs_all.jsp?arnumber=4057370).
Rosen, Marc A., Ibrahim Dincer, and Mehmet Kanoglu. 2008. “Role of Exergy in Increasing Efficiency and Sustainability and Reducing Environmental Impact.” Energy Policy 36(1):128–37.
Sander, Bo. 1997. “Properties of Danish Biofuels and the Requirements for Power Production.” Biomass and Bioenergy 12(3):177–83.
Schmidt, Jannick H., and Miguel Brandao. 2013. LCA Screening of Biofuels - iLUC, Biomass Manipulation and Soil Carbon. Last accessed February 18, 2014 (http://concito.dk/files/ dokumenter/artikler/biomasse_bilag1_lcascreen ing.pdf).
Schmidt, Jannick H., Jürgen Reinhard, and Bo P. Weidema. 2012. A Model of Indirect Land Use Change. Last accessed February 18, 2014 (http://www.lca-net.com/projects/ iluc_model/).
Searchinger, Timothy, Ralph Heimlich, R. A. Houghton, Fengxia Dong, Amani Elobeid, Jacinto Fabiosa, Simla Tokgoz, Dermot Hayes, and Tun-Hsiang Yu. 2008. “Use of U.S. Croplands for Biofuels Increases Greenhouse Gases through Emissions from Land-Use Change.” Science 319(5867):1238–40.
Sengupta, S., A. Datta, and S. Duttagupta. 2007. “Exergy Analysis of a Coal-Based 210 MW Thermal Power Plant.” International Journal of Energy Research 31(1):14-28.
Sinden, Graham, Jim Skea, Paul Jefferiss, Roland Clift, and Tim Jackson. 2008. PAS 2050:
2008, Specification for the Assessment of the Life Cycle Greenhouse Gas Emissions of Goods and Services. British Standards Institute. Last accessed February 18, 2014 (http://shop.bsigroup.com/Browse-By-Subject/Environmental-Management-and-Sustainability/PAS-2050/).
Singh, Anoop, Deepak Pant, Stig Irving Olsen. 2013. Life Cycle Assessment of Renewable Energy Sources. Springer.
Soder, Lennart. 1993. “Reserve Margin Planning in a Wind-Hydro-Thermal Power System.” IEEE Transactions on Power Systems 8(2):564–71.
Sovacool, Benjamin K. 2008. “Valuing the Greenhouse Gas Emissions from Nuclear Power: A Critical Survey.” Energy Policy 36(8):2950–63.
Spielmann, Michael, Christian Bauer, Roberto Dones, and Matthias Tuchschmid. 2007. Ecoinvent Report No. 14 - Transport Services. Last accessed February 18, 2014 (http://www.ecoinvent.ch/).
Suh, Sangwon, Manfred Lenzen, Graham J. Treloar, Hiroki Hondo, Arpad Horvath, Gjalt Huppes, Olivier Jolliet, Uwe Klann, Wolfram Krewitt, Yuichi Moriguchi, Jesper Munksgaard, and Gregory Norris. 2004. “System Boundary Selection in Life-Cycle Inventories Using Hybrid Approaches.” Environmental Science & Technology 38(3):657–64.
60
Thomassen, Marlies A., Randi Dalgaard, Reinout Heijungs, and Imke Boer. 2008. “Attributional and Consequential LCA of Milk Production.” The International Journal of Life Cycle Assessment 13(4):339–49.
Tonini, Davide, and Thomas Astrup. 2012. “LCA of Biomass-Based Energy Systems: A Case Study for Denmark.” Applied Energy 99:234–46.
Tonini, Davide, Lorie Hamelin, Henrik Wenzel, and Thomas Astrup. 2012. “Bioenergy Production from Perennial Energy Crops: A Consequential LCA of 12 Bioenergy Scenarios Including Land Use Changes.” Environmental science & technology 46(24):13521–30.
Valentino, Lauren, Viviana Valenzuela, Audun Botterud, Zhi Zhou, and Guenter Conzelmann. 2012. “System-Wide Emissions Implications of Increased Wind Power Penetration.” Environmental science & technology 46(7):4200–4206.
Wall, Goran. 2004. Exergy. Last accessed June 15, 2012 (http://www.exergy.se/goran/ scpapers).
Warner, Ethan, Yimin Zhang, Daniel Inman, Garvin Heath, and National Renewable. 2013. “Challenges in the Estimation of Greenhouse Gas Emissions from Biofuel-Induced Global Land-Use Change.” Biofuels, Bioproducts and Biorefining 8(1):114-125.
Weidema, Bo, Tomas Ekvall, and Reinout Heijungs. 2009. Guidelines for Application of Deepened and Broadened LCA. Last accessed February 18, 2014 (http://www.leidenuniv.nl/cml/ssp/publications/calcas_report_d18.pdf).
World Economic Forum. 2012. The Global Energy Architecture Performance Index Report 2013. Last accessed February 18, 2014 (http://www.weforum.org/reports/global-energy-architecture-performance-index-report-2013).

61
8. Publications
I. Turconi R, Boldrin A, Astrup TF. (2013) Life cycle assessment (LCA) of electricity generation technologies – overview, comparability and limitations. Renewable and Sustainable Energy Reviews. DOI: 10.1016/j.rser.2013.08.013.
II. Turconi R, Simonsen CG, Byriel IP, Astrup TF. (2014) Life cycle assessment of the Danish electricity distribution network. The International Journal of Life Cycle Assessment. DOI: 10.1007/ s11367-013-0632-y.
III. Turconi R, O’Dwyer C, Flynn D, Astrup TF. - Emissions from cycling of thermal power plant in electricity systems with high penetration of wind power: life cycle assessment for Ireland. Submitted to Applied Energy.
IV. Turconi R, Tonini D, Nielsen CFB, Simonsen CG, Astrup TF. - Environmental Impacts of Future Low-Carbon Electricity Systems: Detailed life cycle assessment of a Danish case study. Submitted to Applied Energy.
In this online version of the thesis, the articles are not included but can be obtained from electronic article databases e.g. via www.orbit.dtu.dk or on request from.
DTU Environment Technical University of Denmark Miljøvej, Building 113 2800 Kgs. Lyngby Denmark [email protected]


Technical University of Denmark
DTU Environment
Department of Environmental Engineering
Miljoevej, building 113
2800 Kgs. Lyngby
Denmark
Phone: +45 4525 1600
Fax: +45 4593 2850
e-mail: [email protected]
www.env.dtu.dk
The Department of Environmental Engineering (DTU Environment) conducts
science-based engineering research within four sections:
Water Resources Engineering, Urban Water Engineering,
Residual Resource Engineering and Environmental Chemistry & Microbiology.
The department dates back to 1865, when Ludvig August Colding, the
founder of the , gave the first lecture on sanitary engineering as
response to the cholera epidemics in Copenhagen in the late 1800s.
department