life cycle assessment and cost analysis of bioenergy...
TRANSCRIPT
2010Maria Stenull Tomsk Polytechnic University 1
Life Cycle Assessment and CostAnalysis of Bioenergy Systems
Maria StenullInstitut für Energiewirtschaft und Rationelle Energieanwendung
Uni Stuttgart
22-26.11.2010Tomsk Polytechnic University

2010Maria Stenull Tomsk Polytechnic University 2
• Life Cycle Assessment (LCA) of Bioenergy Process Chains – General Overview
• LCA of Energy Crop and Wood Cultivation
• LCA of Electricity Generation from Biogas
• Cost Analysis
• CO2-Abatement Costs
• Conclusions
Agenda

2010Maria Stenull Tomsk Polytechnic University
Burning / combustion
Pyrolysis-oil
Synthesis-gas
BiodieselRME
Plant-oilFAME Ethanol BiogasChar-
coal
physic.-chem.conversion
pressing/extractionesterification
biochemical conversion
Anaerob.degradat.
Alcohol-ferment.
Aeroberdegradat.
Conversion with heat
Carboni-sation
Liquifi-cation
Gasifi-cation
Biomass (Residues, Energie Crops, Side Products, Waste)
Heat / SteamCold Electricity
Synthetic (BTL) / Liquid Fuels
Mobility
Compost
DirectCombustion
Raw material use
Many Technologies, Process Chains and Products!

2010 4Maria Stenull Tomsk Polytechnic University
Life cycle assessement of bioenergy process chains
Machine DieselMachine DieselFertilizer
Machine DieselPesticides
Process energyCorn Machine Diesel
MachineBuilding Materials
Process energy
Global Warming Potential, Ozone Depletion Potential, Acidification, Eutrophication, Cumulative Energy
Demand, etc.
Life
Cyc
leIn
vent
ory
Ana
lysi
sIm
pact
Ass
essm
ent
Raw material ProductionProduction and Use Recycling
Storage and Pre-
processingTransport

2010Maria Stenull Tomsk Polytechnic University 5
• Life Cycle Assessment (LCA) of Bioenergy Process Chains –General Overview
• LCA of Energy Crop and Wood Cultivation
• LCA of Electricity Generation from Biogas
• Cost Analysis
• CO2-Abatement Costs
• Conclusions
Agenda

2010 6Maria Stenull Tomsk Polytechnic University
Fertilizer Machine Pesticides Process energy
Cuttings
Building Materials
recultivationtransport 2 storage –end user
storagetransport 1field –
storage
HarvestOptional
Fertilizing
main-tenance
plantingfield preparation
Diesel Machine Diesel
Machine Pesticides
Diesel Machine Diesel
Machine Diesel
Machine Diesel
Life cycle assessment of bioenergy process chains-cultivation of short rotation coppice (SRC)
2010Maria Stenull Tomsk Polytechnic University
185214
312
73101
36
1717
24
1512
10
0
50
100
150
200
250
300
350
400
Silomais WW GPS Grasschnit t Stroh Pappeln WRH CM
L200
1 - T
reib
haus
pote
ntia
l (G
WP
100
Jahr
e)
[kg
CO
2-Ä
qv./t
TM
]
Max. Transportw egeAnbau, Ernte und Lagerung
7
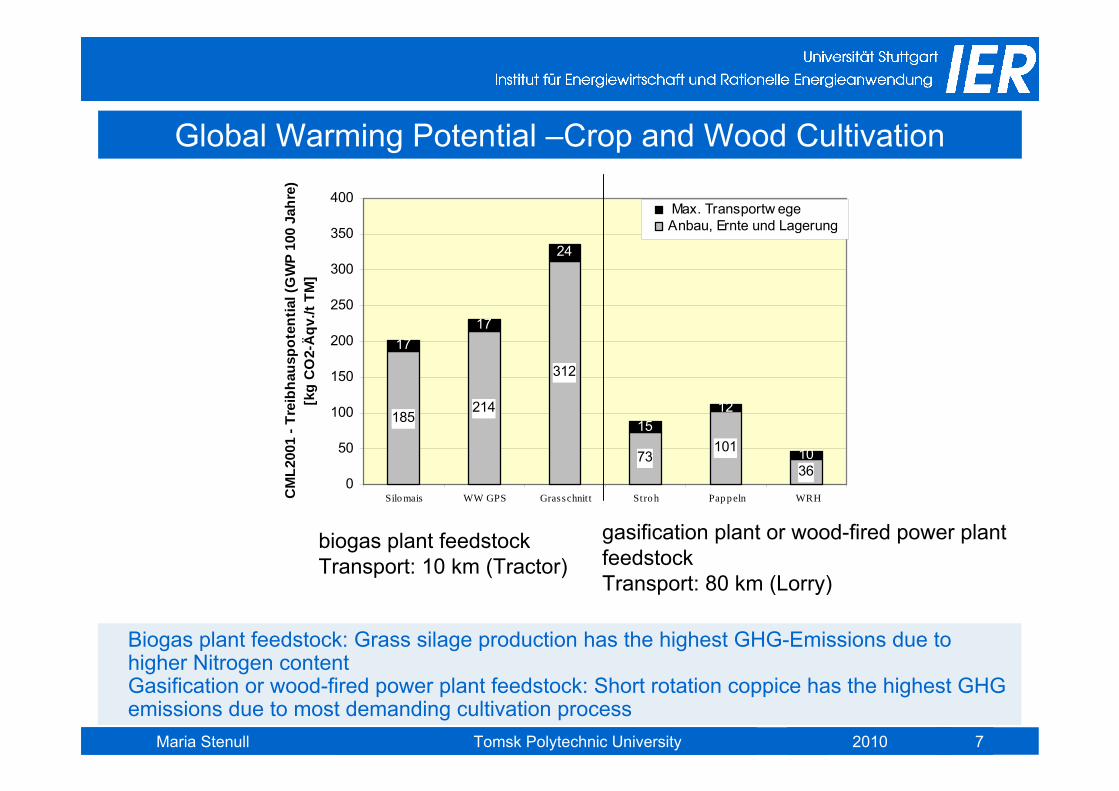
Global Warming Potential –Crop and Wood Cultivation
Biogas plant feedstock: Grass silage production has the highest GHG-Emissions due to higher Nitrogen content Gasification or wood-fired power plant feedstock: Short rotation coppice has the highest GHG emissions due to most demanding cultivation process
biogas plant feedstockTransport: 10 km (Tractor)
gasification plant or wood-fired power plant feedstockTransport: 80 km (Lorry)

2010Maria Stenull Tomsk Polytechnic University 8
Primary Energy Demand –Crop and Wood Cultivation
Primary Energy Demand shows similar characteristics as GHG-Emissions
1789 1955
3100
817 1032557
275259
373
202158
131
0
500
1000
1500
2000
2500
3000
3500
4000
Silo mais WW GPS Grasschnit t Stroh Pappeln WRH Prim
ären
ergi
ebed
arf a
us R
esso
urce
n (u
nter
er
Hei
zwer
t) [M
J/ t
TM]
Max. Transportw egeAnbau, Ernte und Lagerung
biogas plant feedstockTransport: 10 km Traktor
gasification plant or wood-fired power plant feedstockTransport: 80 km Lorry

2010Maria Stenull Tomsk Polytechnic University 9
• Life Cycle Assessment (LCA) of Bioenergy Process Chains –General Overview
• LCA of Energy Crop and Wood Cultivation
• LCA of Electricity Generation from Biogas
• Cost Analysis
• CO2-Abatement Costs
• Conclusions
Agenda

2010Maria Stenull Tomsk Polytechnic University 10
Biogas Plant Facility - general operating scheme
Source: http://www.ppm-biodiesel.com
ResidueEnergy crops
1. Stable2. Liquid manure storage3. Collecting basin/
Storage area4. Anaerobic digester5. Gas accumulator6. CHP Unit7. Storage tank8. Agricultural crop land
Electricity
Heat
Digestedresidues
2010Maria Stenull Tomsk Polytechnic University
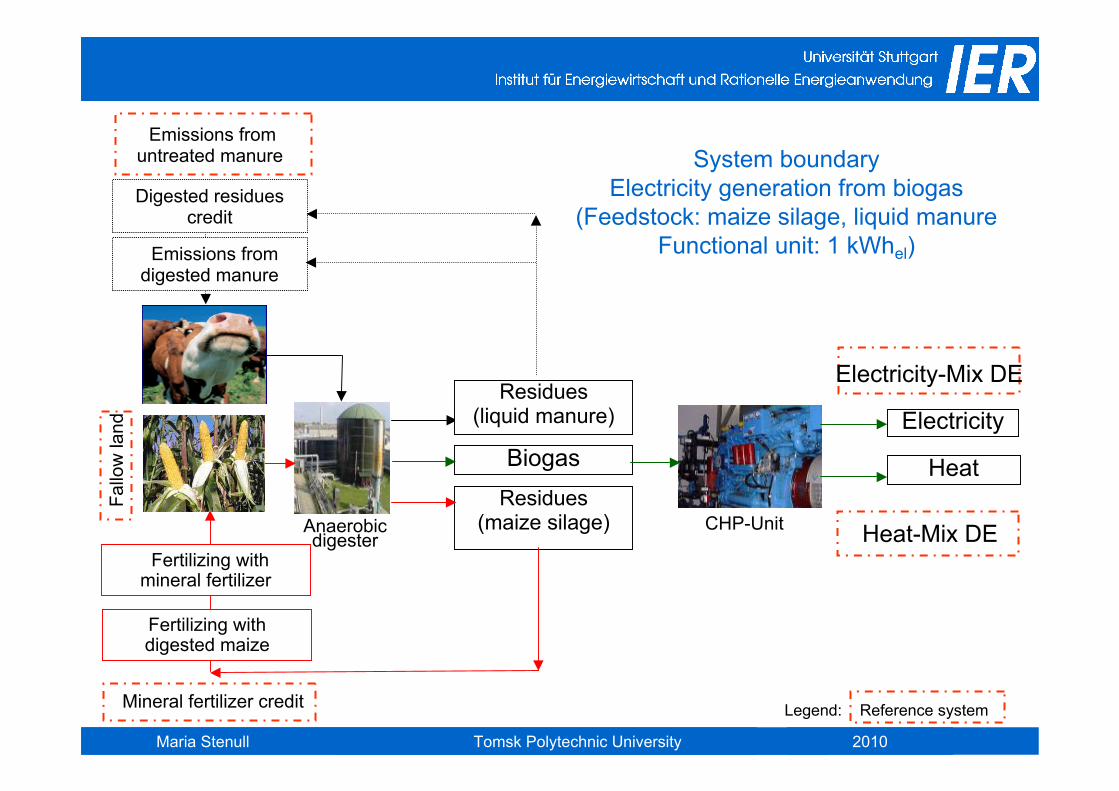
System boundary Electricity generation from biogas
(Feedstock: maize silage, liquid manureFunctional unit: 1 kWhel)
Residues(maize silage) CHP-Unit
BiogasElectricity
Heat
Anaerobic digester
Emissions from untreated manure
Anbau
Mineral fertilizer credit
Fertilizing with mineral fertilizer
Fertilizing with digested maize
Electricity-Mix DE
Heat-Mix DE
Legend: Reference system
Emissions from digested manure
Digested residues credit
Residues (liquid manure)
Fallo
w la
nd

2010Maria Stenull Tomsk Polytechnic University
47%
42%
22%
15%
30%
8%
6%
4%
5%
5%
24%
34%
50%
53%
43%
5%
3%
6%
7%
5%
11%
12%
13%
13%
12%
4%
2%
4%
5%
4%
0% 20% 40% 60% 80% 100%
≤150 kW
151 - 325 kW
326 - 500 kW
≥501 kW
Gesamtpo
wer
cap
acity
[kW
]
feedstock [% moist mass]
liquid manure solid manure maize silagewhole crop silage corn meadow grass silageanimal feed sorghum others
12
The more corn and whole crop silage is introduced, the larger the plant is.
The smaller the plant is, the greater is the amount of manure used in the facility
Average feedstock composition (in % moist mass) of biogas facilities in Baden-Wuerttemberg for 2009 by plant capacity
others: chicken manure, Sudan grass, fodder beet, rye, “corn-cob-mix”, feed rest, others
2010Maria Stenull Tomsk Polytechnic University 13
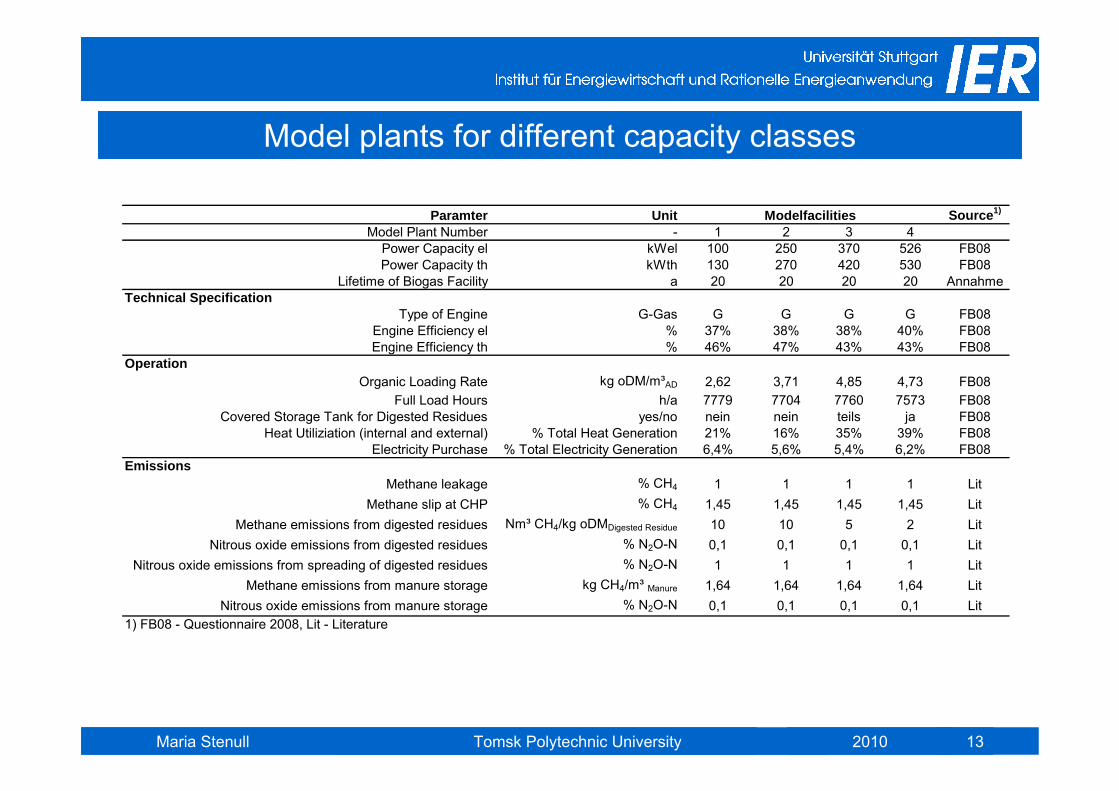
Typische Anlage in der untersuchten LeistungsgrößeModel plants for different capacity classes
Paramter Unit Source1)
Model Plant Number - 1 2 3 4Power Capacity el kWel 100 250 370 526 FB08Power Capacity th kWth 130 270 420 530 FB08
Lifetime of Biogas Facility a 20 20 20 20 AnnahmeTechnical Specification
Type of Engine G-Gas G G G G FB08Engine Efficiency el % 37% 38% 38% 40% FB08Engine Efficiency th % 46% 47% 43% 43% FB08
OperationOrganic Loading Rate kg oDM/m³AD 2,62 3,71 4,85 4,73 FB08
Full Load Hours h/a 7779 7704 7760 7573 FB08Covered Storage Tank for Digested Residues yes/no nein nein teils ja FB08
Heat Utiliziation (internal and external) % Total Heat Generation 21% 16% 35% 39% FB08Electricity Purchase % Total Electricity Generation 6,4% 5,6% 5,4% 6,2% FB08
EmissionsMethane leakage % CH4 1 1 1 1 Lit
Methane slip at CHP % CH4 1,45 1,45 1,45 1,45 LitMethane emissions from digested residues Nm³ CH4/kg oDMDigested Residue 10 10 5 2 Lit
Nitrous oxide emissions from digested residues % N2O-N 0,1 0,1 0,1 0,1 LitNitrous oxide emissions from spreading of digested residues % N2O-N 1 1 1 1 Lit
Methane emissions from manure storage kg CH4/m³ Manure 1,64 1,64 1,64 1,64 LitNitrous oxide emissions from manure storage % N2O-N 0,1 0,1 0,1 0,1 Lit
1) FB08 - Questionnaire 2008, Lit - Literature
Modelfacilities
2010Maria Stenull Tomsk Polytechnic University 14
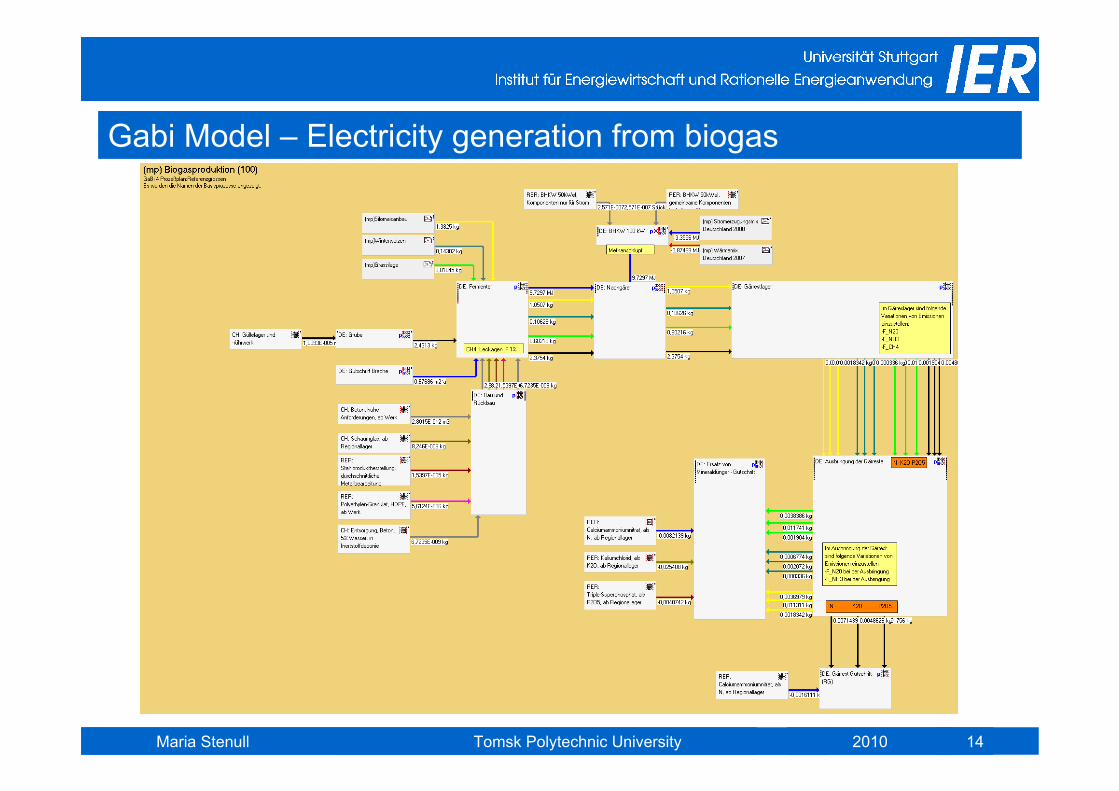
Gabi Model – Electricity generation from biogas
2010Maria Stenull Tomsk Polytechnic University 1515
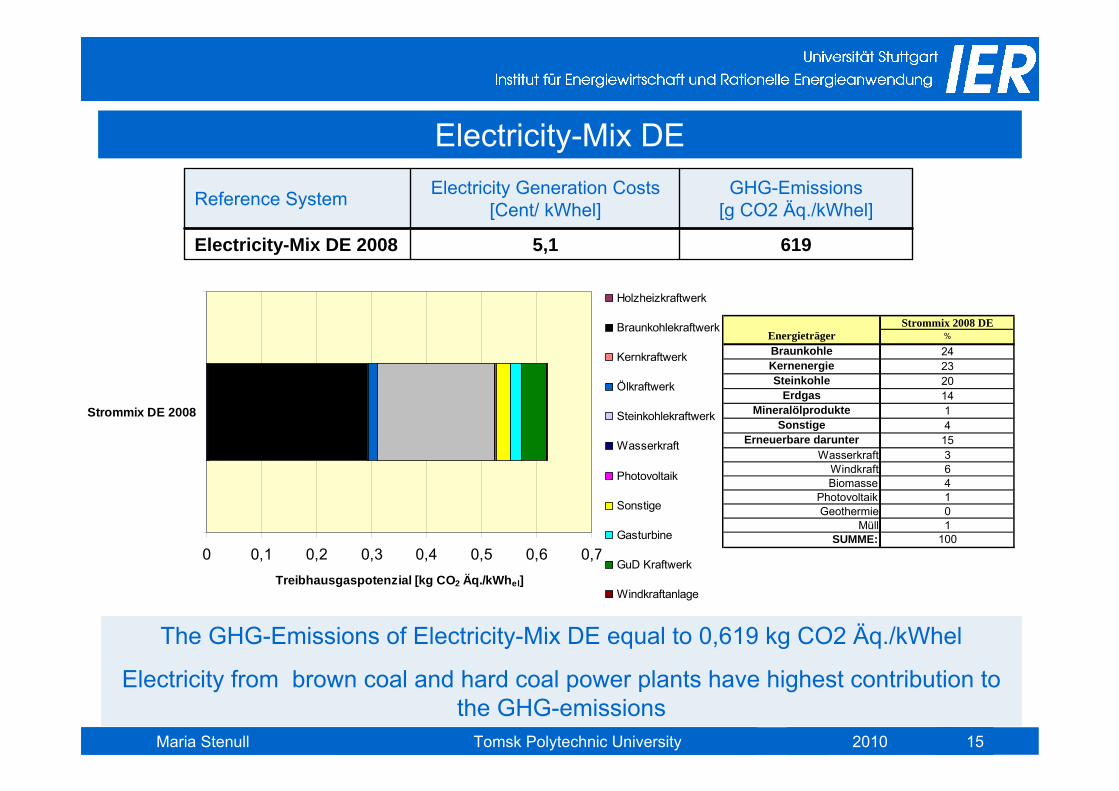
Electricity-Mix DE
Strommix 2008 DEEnergieträger %
Braunkohle 24Kernenergie 23Steinkohle 20
Erdgas 14Mineralölprodukte 1
Sonstige 4Erneuerbare darunter 15
Wasserkraft 3Windkraft 6Biomasse 4
Photovoltaik 1Geothermie 0
Müll 1SUMME: 100
The GHG-Emissions of Electricity-Mix DE equal to 0,619 kg CO2 Äq./kWhel
Electricity from brown coal and hard coal power plants have highest contribution to the GHG-emissions
0 0,1 0,2 0,3 0,4 0,5 0,6 0,7
Strommix DE 2008
Treibhausgaspotenzial [kg CO2 Äq./kWhel]
Holzheizkraftwerk
Braunkohlekraftwerk
Kernkraftwerk
Ölkraftwerk
Steinkohlekraftwerk
Wasserkraft
Photovoltaik
Sonstige
Gasturbine
GuD Kraftwerk
Windkraftanlage
6195,1Electricity-Mix DE 2008
GHG-Emissions[g CO2 Äq./kWhel]
Electricity Generation Costs[Cent/ kWhel]Reference System

2010Maria Stenull Tomsk Polytechnic University 1616
GHG-Reduction (Reference System Electricity-Mix DE)
Gesamteinsparung
-0,503
-0,455
-0,502
-0,495
-1,0 -0,8 -0,6 -0,4 -0,2 0,0 0,2 0,4 0,6
100 kW
250 kW
370 kW
526 kW
Anla
geng
röße
[kW
el]
THG-Emissionen [kg CO2 Äq./kWhel]

2010Maria Stenull Tomsk Polytechnic University
-0,503
-0,455
-0,502
-0,495
-1,0 -0,8 -0,6 -0,4 -0,2 0,0 0,2 0,4 0,6
100 kW
250 kW
370 kW
526 kW
Anla
geng
röße
[kW
el]
THG-Emissionen [kg CO2 Äq./kWhel]
THG-Reduction
Electricity-Mix Credit
Heat-Mix Credit
Crop Cultivation
Construction and Recycling
Anaerobic Digester
CHP-Unit
Storage Tank
Spreading of Digestate
Digestate-Credit
Fallow Credit
Mineral Fertilizer Credit
17
GHG-Reduction (Reference System Electricity-Mix DE) [kg CO2 Äq./kWhel]
The GHG-Reduction for all plant capacities is in the similar range.
CO2-GenerationCO2-Credits

2010Maria Stenull Tomsk Polytechnic University
Which measures can improve the operation of biogas plant in terms of GHG-Emissions?
18
GHG-Emissions 250 kW [kg CO2 eq./kWhel]
0,165
0,159
0,116
0,126
-0,045
0,038
-0,5 -0,4 -0,3 -0,2 -0,1 0,0 0,1 0,2 0,3 0,4 0,5
Gesamt Basis
Volllastanteil (8000 Vh)
Methanschlupf (verringerte CH4-Emissionen)
Geschl. Gärrestlager (verringerte CH4-Emissionen)
Wärme (70% Gesamtw ärme)
Max
THG-Emissionen [kg CO2 Äq./kWhel]
Anlagengröße
Gesamtemissionen
Prozessstrombedarf
Wärmemix Gutschrift
Anbau
Bau und Entsorgung
Fermenter
BHKW
Gärrestlager
Ausbringung der Gärreste
Gärrestgutschrift
Gutschrift Brache
Mineraldüngerersatzgutschrift
AufwendungenGutschriften
Sensitivity Analysis: Biogas Plant 250 kW
BaseIncrease in full load hous Methane sleep 0,45% Covered storage tanksHeat utlization 70%Max
2010Maria Stenull Tomsk Polytechnic University 19
• Life Cycle Assessment (LCA) of Bioenergy Process Chains –General Overview
• LCA of Energy Crop and Wood Cultivation
• LCA of Electricity Generation from Biogas
• Cost Analysis • CO2-Abatement Costs
• Conclusions
Agenda

2010Maria Stenull Tomsk Polytechnic University
9 9 15 15 5
3214 17 1423
32 3541
24
2941
6871
69
24
36 10
6
87
7
7
7
6
1211
13
9
10
151143
117
78
160
90
0
20
40
60
80
100
120
140
160
180
200
Silomais WW GPS Grasschnitt Stroh Pappeln WRH
Brennstoff bzw. Substrat
Ber
eits
tellu
ngsk
oste
n fr
ei A
nlag
e [€
/tTM
] Lagerung Transport Schlepper 5kmTransport Feld-Zwischenlager 2kmAnbau und Ernte: Variable KostenAnbau und Ernte: Fixe KostenAnbau und Ernte: PachtAnbau und Ernte: Personalkosten
20
Cost Analysis – Biomass generation system
Biogas feedstock:•Variable Costs (Fertilizers, Diesel, Corn) have highest contribution to the total biomass generation costs
•Storage and transportation costs are in the similar range and independent of production process
Wood-fired power plant feedstock: •Fix costs of wood residues have highest contribution to the total biomass generation costs
WW GPS - Winterweizen GanzpflanzensilageWRH - Waldrestholz

2010Maria Stenull Tomsk Polytechnic University
0
5
10
15
20
25
30
35
40
45
50
Silomais WW GP Grünschnitt Stroh Pappeln WRH
Tran
spor
tkos
ten
frei
Anl
age
[€/t
TM]
1 km Entfernung Schlepper2 km Entfernung Schlepper5 km Entfernung Schlepper10 km Entfernung Schlepper20 km Entfernung LKW80 km Entfernung LKW
21
Cost Analysis –Transport distances
• Biogas plant feedstock: Transportation costs do not depend on feedstock type
• Wood-fired power plant feedstock: Transportation costs do not depend on feedstock type at distances of 5km. Straw has highest costs for transportation distances of 20km and 80 km to the facility
0
5
10
15
20
25
30
35
40
45
50
Silomais WW GPS Grasschnitt Stroh Pappeln WRH
Tran
spor
tkos
ten
Lage
rung
sort-
Anl
age
[€/t
TM]
1 km Entfernung Schlepper2 km Entfernung Schlepper5 km Entfernung Schlepper10 km Entfernung Schlepper20 km Entfernung LKW80 km Entfernung LKW

2010Maria Stenull Tomsk Polytechnic University 22
Electricity Generation Costs – Biogas model plant [Cent/kWhel]
Electricity generation costs ranges between 16 and 18 cent/kWhel
Plant capacities 250 kW and 370 kW have lowest generation costs angelehnt an Vidjen 2010
* Mit anteiliger Wärmenutzung in der Größenklasse
15,916,6526 kW
15,516,0370 kW
16,016,1250 kW
18,618,7100 kW
Basis* mit Wärmeerlösohne Wärmenutzung
Stromgestehungskosten [Cent/kWhel]
Stromgestehungskosten
Modellanlage
2010Maria Stenull Tomsk Polytechnic University 23
• Life Cycle Assessment (LCA) of Bioenergy Process Chains –General Overview
• LCA of Energy Crop and Wood Cultivation
• LCA of Electricity Generation from Biogas
• Cost Analysis
• CO2-Abatement Costs• Conclusions
Agenda
2010Maria Stenull Tomsk Polytechnic University 24
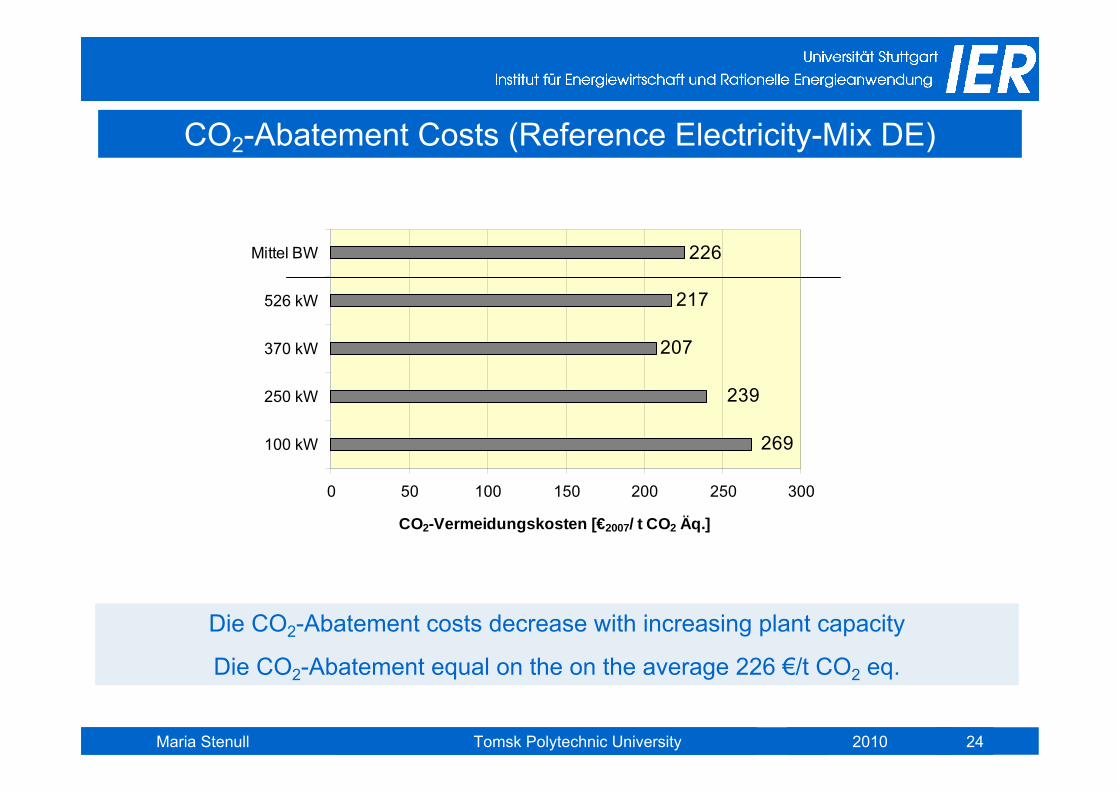
CO2-Abatement Costs (Reference Electricity-Mix DE)
Die CO2-Abatement costs decrease with increasing plant capacity
Die CO2-Abatement equal on the on the average 226 €/t CO2 eq.
226
269
239
207
217
0 50 100 150 200 250 300
100 kW
250 kW
370 kW
526 kW
Mittel BW
CO2-Vermeidungskosten [€2007/ t CO2 Äq.]

2010Maria Stenull Tomsk Polytechnic University 25
CO2-Abatement Costs - Sensitivity
Die CO2-Abatement costs can decrease depending on the measures
226206 206
219
154127
0
50
100
150
200
250
Base Increase infull load hous
Methanesleep 0,45%
Coveredstorage tanks
Heat utlization70%
MaxCO
2-A
bate
men
t Cos
ts [€
/t C
O2
eq.]
• Full load hours: 8000 h/a
• Covered storage tanks
• Methane slip 0,45%
• 70% of total heatutilization

2010Maria Stenull Tomsk Polytechnic University 26
Potential GHG-Reduction through biogas plants in BW
• According to given assumptions approx. 611 1000 t CO2 eq./a were reduced (Reference System: Electricity-Mix DE)
• The potential for GHG-Reduction is still not exhausted
0
50
100
150
200
250
500 550 600 650 700 750 800 850 900Vermiedene Emissionen der Stromerzeugung
aus Biogas in B-W [1000 t CO2 Äq./a]
CO
2-Ver
mei
dung
skos
ten
[€/t
CO
2 Ä
q.]
Base
Increasein full load
Covered storage tanksDecreased methane slip
70% of heat utlization
Max

2010Maria Stenull Tomsk Polytechnic University 27
• Life Cycle Assessment (LCA) of Bioenergy Process Chains –General Overview
• LCA of Energy Crop and Wood Cultivation
• LCA of Electricity Generation from Biogas
• Cost Analysis
• CO2-Abatement Costs
• Conclusions
Agenda
2010Maria Stenull Tomsk Polytechnic University 28
• The GHG-Emissions for energy crop and wood cultivation are higher for energy crops mainly due to emission-intensive mineral fertilization.
• The GHG-Emissions for biogas plants of different capacities are in the similar range.
Small facilities use lots of manure and utilize small amounts of heat. Bigger facilities use in comparison to small facilities less manure but utilize much more heat.
• The GHG Emissions can be reduced by:new concepts for heat utilization
covering of storage tanks for digested residues and reduction of methane slip and leakage
increase in the full load hours.
Conclusions – German Examples

2010Maria Stenull Tomsk Polytechnic University 29
• With LCA and Cost Analysis different options of
- production,
- processing and
- utilization of energy crops and wood
can be compared and assessed from comprehensive approach
• LCA and Cost Analysis can be filled with regional databases and thus allows for specific (region-oriented) comparative assessment
Conclusions – Overall Implementation

2010Maria Stenull Tomsk Polytechnic University 30
Thank you for your AttentionAny Questions?
Das Projekt wurde gefördert durch das Ministerium für Ländlichen Raum, Ernährung und Verbraucherschutz mit Mitteln der Landesstiftung Baden-
Württemberg
Maria Stenull
Kontakt: Institut für Energiewirtschaft und Rationelle Energieanwendung, IER - Universität Stuttgart Heßbrühlstr. 49; D - 70565 Stuttgart; www.ier.uni-stuttgart.de , Tel.+49-(0)711-685 87870,