lidar quality assurance (qa) report san francisco bay …€¦ · · 2016-03-29the breaklines...
TRANSCRIPT

LiDAR Quality Assurance (QA) Report San Francisco Bay LiDAR Project
NOAA Coastal Services Center April 21, 2011
Submitted to: NOAA Coastal Services Center
Prepared by:

Table of contents 1 Executive Summary ........................................................................................................... 3
1.1 Deliverables Summary for Fugro EarthData ................................................................. 4 1.2 Report Approval ............................................................................................................ 5
2 Overview ............................................................................................................................ 5 3 LiDAR Analysis ................................................................................................................. 5
3.1 LiDAR Quantitative Review........................................................................................... 5 3.2 LiDAR Completeness Review ....................................................................................... 7
3.2.1 Data Not to Extent of Project Boundary - ADDRESSED ................................... 15 3.2.2 Missing Water Points - ADDRESSED ............................................................... 15 3.2.3 Voids in the Data - ADDRESSED ..................................................................... 15
3.3 LiDAR Qualitative Review ........................................................................................... 18 3.3.1 Aggressive Classification - ADDRESSED ......................................................... 20 3.3.2 Artifacts - ADDRESSED ................................................................................... 21 3.3.3 Flight Line Ridges - ADDRESSED .................................................................... 22 3.3.4 Inconsistent Editing - ADDRESSED ................................................................. 24 3.3.5 Misclassification - ADDRESSED ...................................................................... 25 3.3.6 Sensor Anomaly - ADDRESSED ...................................................................... 27
3.4 LiDAR Recommendation ............................................................................................ 28 4 Breakline Analysis ........................................................................................................... 28
4.1 Breakline Data Overview .......................................................................................... 29 4.2 Breakline Completeness ........................................................................................... 29 4.3 Breakline Qualitative Review ...................................................................................... 30
4.3.1 Water in LAS tiles without breaklines - ADDRESSED ....................................... 30 4.3.2 Adjust Breaklines – ADDRESSED .................................................................... 30 4.3.3 Missing Features - ADDRESSED ..................................................................... 33 4.3.4 Inconsistent Island Collection - ADDRESSED .................................................. 34
4.4 Breakline Quantitative Review .................................................................................. 36 4.5 Topology .................................................................................................................... 37 4.6 Breakline Recommendation ........................................................................................ 38
5 Hydro-enforced Digital Elevation Model Analysis ......................................................... 38 5.1 Qualitative Review ...................................................................................................... 38 5.2 DEM Recommendation ............................................................................................... 39
6 Metadata ........................................................................................................................... 39 7 Other Comments ............................................................................................................. 39 8 Recommendation Summary .......................................................................................... 40
8.1 Issues requiring modifications by Fugro Earth Data Inc. ......................................... 40 8.2 Issues requiring input from NOAA .............................................................................. 40

LiDAR QA Report, SF Bay
3
1 Executive Summary
The following LiDAR quality assurance report documents Dewberry’s 3rd review of LiDAR data and derived products for the San Francisco Bay LiDAR Project. The data was flown by Fugro EarthData, Inc (FEDI) for the NOAA Coastal Services Center. The delivery of the data includes portions of seven California counties: Alameda, Contra Costa, Marin, Napa, San Francisco, Solano, and Sonoma. The data consists of approximately 460 square miles that amount to 649 LAS tiles (1500 m x 1500 m). Each tile contains LAS point cloud data classified according to the ASPRS classification scheme. The final deliverables also include an ESRI Geodatabase containing breaklines and hydro-enforced digital elevation models (DEMs) in ESRI GRID format. Project Summary The LiDAR data for the San Francisco Project were thoroughly examined by Dewberry for completeness and conformity to project specifications. Survey checkpoints located within the area were used to calculate vertical accuracy and associated statistics for the entire delivery area. The data meets vertical accuracy project specifications. In the 3rd delivery, Dewberry reviewed the data to ensure that all calls/issues raised in the 1st and 2nd QA/QC were addressed. After thorough review, Dewberry concludes that all issues called in the 1st and 2nd review are addressed and no further classification issues are identified. Dewberry recommends accepting this dataset. The breaklines were thoroughly examined and in the 3rd delivery, all issues called in the 1st and 2nd delivery are addressed and no further issues are identified. Dewberry recommends accepting this dataset. The hydro-enforced DEMs delivered by FEDI were visually examined to see if they meet project specifications. In the 3rd delivery no issues were identified. Dewberry recommends accepting this dataset. Metadata was delivered and accepted in the 1st delivery. Dewberry recommends accepting the metadata.
Contract: San Francisco Bay
LiDAR Project
Production Contractor:
Date Prepared:
Delivery #:
Dewberry Recommendation:
Fugro Earth Data
4/21/2011 4 Accept
Data History: Pilot 1 8/16/2010 Complete Delivery 11/2010 2nd Delivery 02/2011 3rd Delivery 04/2011
LiDAR QA Report, SF Bay
4
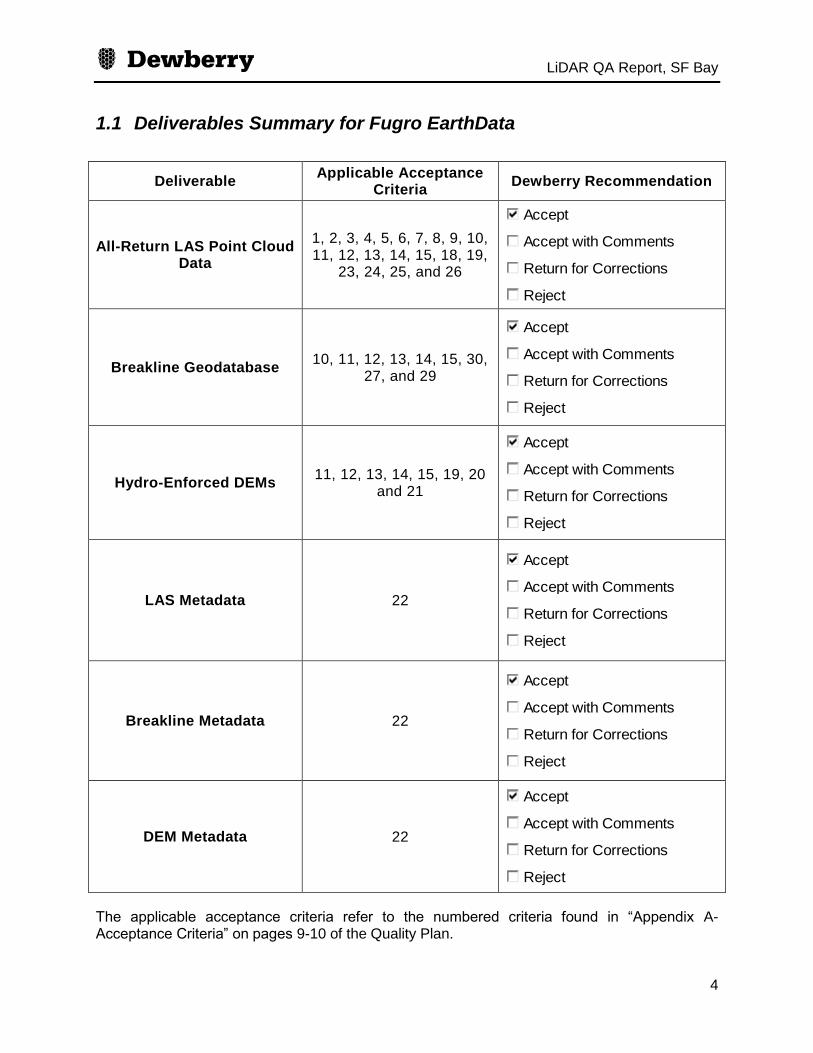
1.1 Deliverables Summary for Fugro EarthData
Deliverable Applicable Acceptance
Criteria Dewberry Recommendation
All-Return LAS Point Cloud Data
1, 2, 3, 4, 5, 6, 7, 8, 9, 10, 11, 12, 13, 14, 15, 18, 19,
23, 24, 25, and 26
Accept
Accept with Comments
Return for Corrections
Reject
Breakline Geodatabase 10, 11, 12, 13, 14, 15, 30,
27, and 29
Accept
Accept with Comments
Return for Corrections
Reject
Hydro-Enforced DEMs 11, 12, 13, 14, 15, 19, 20
and 21
Accept
Accept with Comments
Return for Corrections
Reject
LAS Metadata 22
Accept
Accept with Comments
Return for Corrections
Reject
Breakline Metadata 22
Accept
Accept with Comments
Return for Corrections
Reject
DEM Metadata 22
Accept
Accept with Comments
Return for Corrections
Reject
The applicable acceptance criteria refer to the numbered criteria found in “Appendix A-Acceptance Criteria” on pages 9-10 of the Quality Plan.
LiDAR QA Report, SF Bay
5
1.2 Report Approval
Approved by: Date: 4/21/2011 (sign & stamp)
2 Overview
The goal of the NOAA Coastal Services Center LiDAR Task Order is to provide high accuracy elevation datasets of multiple deliverable products including LiDAR, hydro-enforced digital elevation models (DEMs), and 3D breaklines for several counties around the San Francisco Bay. The project area spans 460 square miles. These data will be used to support the environmental, social, and economic well being of the coast by linking people, information, and technology. Data are intended for use in coastal management decision making, including applications such as sea level rise and coastal flood mapping. Dewberry’s role is to provide Quality Assurance (QA) of the LiDAR data and supplemental deliverables provided by Fugro EarthData, Inc (FEDI) that includes completeness checks, vertical accuracy testing, and a qualitative review of the bare earth surface. Each product is reviewed independently and against the other products to verify the degree to which the data meets expectations. This report documents the quality of all the deliverables. This report is organized into three sections: 1. LiDAR analysis, 2. Breakline analysis and 3. DEM analysis.
3 LiDAR Analysis
The LiDAR data are reviewed on project, tile, and per point levels to determine the relative accuracy, proper classification and conformity to project requirements. This review begins with a computational analysis of the points for completeness and to determine point data format, projection, classification scheme, number of returns per pulse, and intensity values of the points. All the data were delivered in the proper tile size with the proper point cloud format, multiple returns per pulse and an intensity value for each point.
3.1 LiDAR Quantitative Review
As this is the third delivery of this dataset, a full QA was not performed on the entire dataset. All automated checks, including statistical analysis and reading the LAS headers, are performed on all the delivered data to ensure versioning control. Edit calls placed in previous QA reviews are manually reviewed to ensure appropriate modifications have been performed on the dataset.
One of the first steps in assessing the quality of the LiDAR is a vertical accuracy analysis of the ground models in comparison to surveyed checkpoints. An independent survey was conducted by McGee Surveying Consulting. This survey yielded 60 checkpoints in three different land cover types: Open Terrain, Marsh, and Urban. These checkpoints are well

LiDAR QA Report, SF Bay
6
dispersed through the project area. Only two checkpoints (261 and 262) experienced changes in the second delivery and this slightly improved the RMSE. No changes were made to any of the checkpoint values in the third delivery.
Figure 1 – Survey Checkpoint map.
The vertical accuracy assessment compares the measured survey checkpoint elevations with those of the TIN as generated from the bare-earth LiDAR. The X/Y locations of the survey checkpoints are overlaid on the TIN and the interpolated Z values of the LiDAR are recorded. These interpolated Z values are then compared with the survey checkpoint Z values and this difference represents the amount of error between the measurements. Once all the Z values are recorded, the Root Mean Square Error (RMSE) is calculated and the vertical accuracy scores are interpolated from the RMSE value. The RMSE equals the square root of the average of the set of squared differences between the dataset coordinate values and the coordinate values from the survey checkpoints. The first method of evaluating vertical accuracy uses the FEMA specification which follows the methodology set forth by the National Standard for Spatial Data Accuracy. The accuracy is reported at the 95% confidence level using the Root Mean Square Error (RMSE) which is valid when errors follow a normal distribution. By this method, vertical accuracy at the 95% confidence level equals RMSEZ x 1.9600. The second method of testing vertical accuracy, endorsed by the National Digital Elevation Program (NDEP) and American Society for Photogrammetry and Remote Sensing (ASPRS) uses the same (RMSEz x 1.9600) method in open terrain only; an alternative method uses the 95th percentile to report vertical accuracy in each of the other land cover categories (defined as Supplemental Vertical Accuracy – SVA) and all land cover categories combined (defined as Consolidated Vertical Accuracy – CVA). The 95th percentile method is used when vertical errors may not follow a normal error distribution, as in vegetated terrain.

LiDAR QA Report, SF Bay
7
The Fundamental Vertical Accuracy (FVA) is calculated in the same way when implementing FEMA/NSSDA and NDEP/ASPRS methodologies; both methods utilize the 95% confidence level (RMSEz x 1.9600) in open terrain where there is no reason for LiDAR errors to depart from a normal error distribution. Table 1 outlines the calculated RMSEz and associated statistics while Table 2 outlines vertical accuracy and the statistics of the associated errors as computed by the different methods.
100 % of Totals
RMSEZ (m) Spec=0.09 m
Mean (m)
Median (m) Skew
Std Dev (m)
# of Points
Min (m)
Max (m)
Consolidated 0.047 0.000 -0.003 3.447 0.047 60 -0.061 0.260
Open Terrain 0.026 -0.013 -0.009 -0.207 0.023 20 -0.057 0.031
Marsh 0.072 0.025 0.004 2.485 0.070 20 -0.037 0.260
Urban 0.025 -0.010 -0.008 -0.556 0.023 20 -0.061 0.020
Table 1: The table shows the calculated RMSEz values for both CVA and FVA as well as associated statistics of the errors for the first delivery block.
Land Cover Category
# of Points
FVA ― Fundamental
Vertical Accuracy
(RMSEZ x 1.9600) Spec=0.18m
CVA ― Consolidated
Vertical Accuracy (95th
Percentile) Spec=0.18m
SVA ― Supplemental
Vertical Accuracy (95th Percentile)
Spec=0.18m
Consolidated 60 0.062
Open Terrain 20 0.051 0.053
Marsh 20 0.154
Urban 20 0.047
Table 2: The table shows the calculated Accuracyz of the FVA using FEMA/NSSDA guidelines (RMSEz x 1.9600) and the Accuracyz of the CVA using NDEP/ASPRS guidelines (95
th percentile) for the first
delivery block.
3.2 LiDAR Completeness Review
Dewberry received 649 LiDAR files for the entire project area. The LiDAR was delivered in LAS format 1.2 that adheres to the ASPRS LAS 1.2 specifications.
The only exception that does not follow the ASPRS LAS 1.2 specifications is that the GUID_data_1, GUID_data_2, and GUID_data_3 fields are not filled out for 18 tiles. The ASPRS 1.2 specifications state these fields are optional. The Point Data Format 1 is used, with intensity values present. The following figure illustrates the extent of LiDAR coverage.

LiDAR QA Report, SF Bay
8
Figure 2 – Project LAS Extent
Each LAS contains the following information:
Horizontal Datum: NAD83 (NSRS2007) Vertical Datum: NAVD88, processed with Geoid09 Projection: NAD83(NSRS2007)/UTM Zone 10N Horizontal and Vertical Units: Meters
Each record includes the following fields (among others):
X, Y, Z coordinates Flight line data Intensity value Return number Number of returns Scan direction Edge of flight line Scan angle Classification GPSI time
During the statistical review the following was noted:

LiDAR QA Report, SF Bay
9
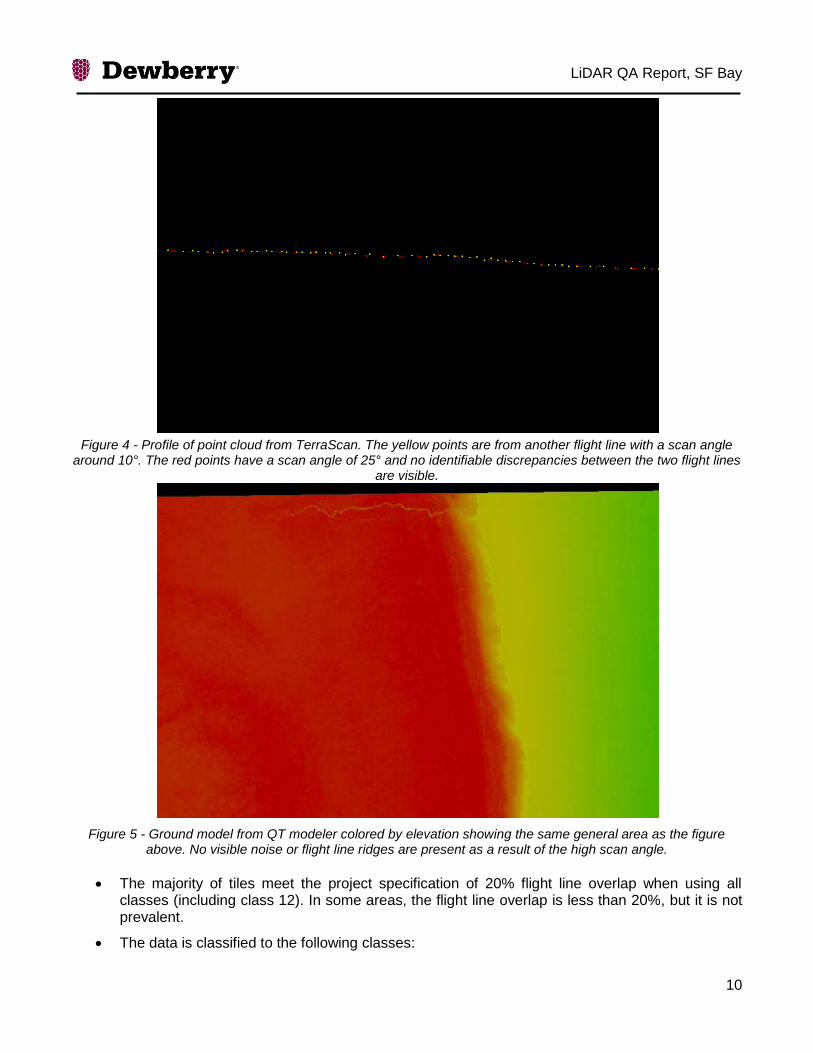
76 tiles have a scan angle from nadir greater than 20°. Tile C5445_42150 has the greatest scan angle at 29° and Dewberry loaded this tile to identify if this high scan angle adversely affected the quality of the LiDAR data. No visible flight line ridges or noise artifacts were visible in the data as a result of the high scan angle within this tile. Figure 3 to Figure 5 show the area in tile C5445_42150 that has the high scan angle and documents how this high scan angle does not have a noticeable effect on the ground model.
Figure 3 - Point cloud from TerraScan with points colored by scan angle. The red points are where the scan angle
is near or above 25° off from Nadir. The yellow and brown colors are scan angles under 20°.
LiDAR QA Report, SF Bay
10
Figure 4 - Profile of point cloud from TerraScan. The yellow points are from another flight line with a scan angle
around 10°. The red points have a scan angle of 25° and no identifiable discrepancies between the two flight lines are visible.
Figure 5 - Ground model from QT modeler colored by elevation showing the same general area as the figure above. No visible noise or flight line ridges are present as a result of the high scan angle.
The majority of tiles meet the project specification of 20% flight line overlap when using all classes (including class 12). In some areas, the flight line overlap is less than 20%, but it is not prevalent.
The data is classified to the following classes:

LiDAR QA Report, SF Bay
11
Class 1 (Unclassified) Class 2 (Bare Earth) Class 7 (Low point/Noise) Class 9 (Water) Class 12 (Overlap)
Class 10 (ignored ground points falling near hydro features) is defined in the scope of work, but is not present in any tiles. In their final report FEDI states, that points were taken out of the ground class if they were within 1*NPS of hydrologic breaklines. Point Count/Elevation Analysis To verify the content of the data and validate the data integrity, a statistical analysis was performed on each tile. This process allows Dewberry to review 100% of the data at a macro level to identify any gross outliers. The statistical analysis consists of first extracting the header information and then reading the actual records and computing the number of points, minimum, maximum, and mean elevation for each class. Minimum and maximum for other relevant variables are also evaluated.
Dewberry ran a proprietary quantitative analysis test to determine if 90% of the LiDAR data contains at least one 1st return LiDAR point within a 1m by 1m grid. The results indicate that the majority of the data meet or exceed the required distribution of LiDAR points. Figure 6 shows the results of the analysis. Red tiles do not meet the required 90% LiDAR point distribution and green tiles meet or exceed the specification.
Figure 6 - Results of point density analysis. Only 1st return points were used in the analysis.
LiDAR QA Report, SF Bay
12
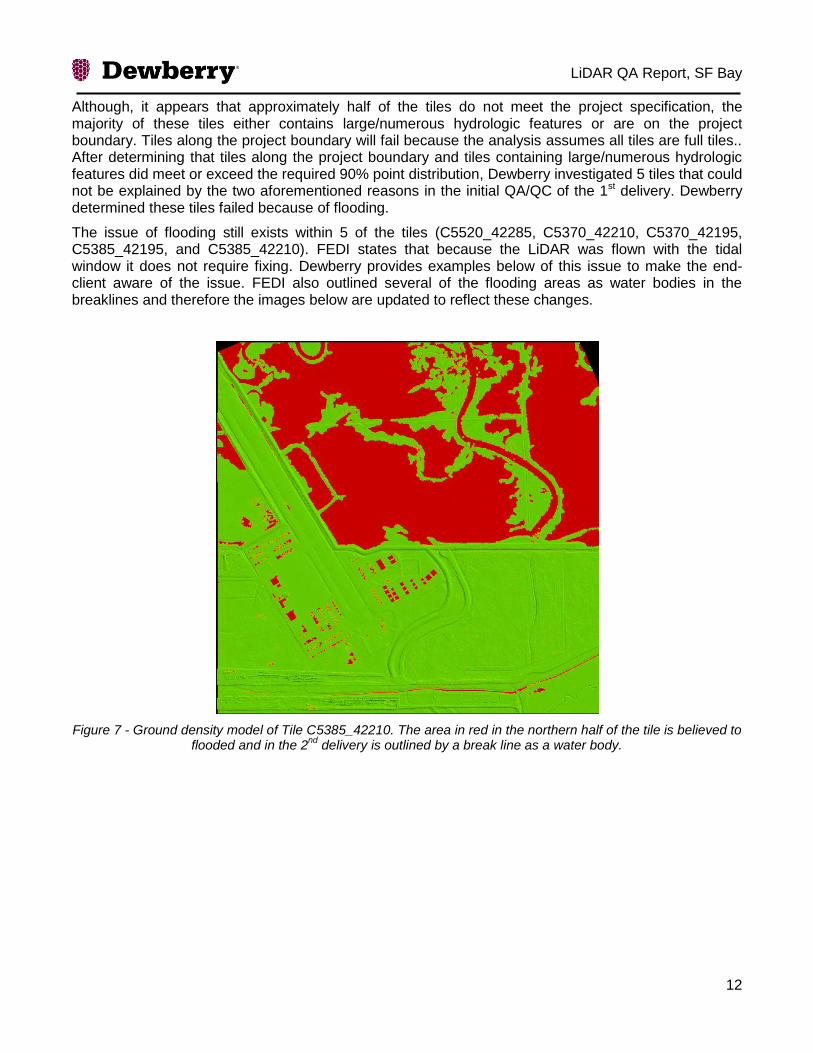
Although, it appears that approximately half of the tiles do not meet the project specification, the majority of these tiles either contains large/numerous hydrologic features or are on the project boundary. Tiles along the project boundary will fail because the analysis assumes all tiles are full tiles.. After determining that tiles along the project boundary and tiles containing large/numerous hydrologic features did meet or exceed the required 90% point distribution, Dewberry investigated 5 tiles that could not be explained by the two aforementioned reasons in the initial QA/QC of the 1st delivery. Dewberry determined these tiles failed because of flooding.
The issue of flooding still exists within 5 of the tiles (C5520_42285, C5370_42210, C5370_42195, C5385_42195, and C5385_42210). FEDI states that because the LiDAR was flown with the tidal window it does not require fixing. Dewberry provides examples below of this issue to make the end-client aware of the issue. FEDI also outlined several of the flooding areas as water bodies in the breaklines and therefore the images below are updated to reflect these changes.
Figure 7 - Ground density model of Tile C5385_42210. The area in red in the northern half of the tile is believed to flooded and in the 2
nd delivery is outlined by a break line as a water body.

LiDAR QA Report, SF Bay
13
Figure 8 - Full point cloud of tile C5385_42210 colored by elevation. Note the voids of data where the flooding exists.
Figure 9 - Aerial image from Google Earth covering the same areas as Tile C5385_42210. In this image there is no water present but the land cover suggests this area is prone or capable of flooding, leading to the assumption
that when the LiDAR was collected, this area was flooded.
LiDAR QA Report, SF Bay
14
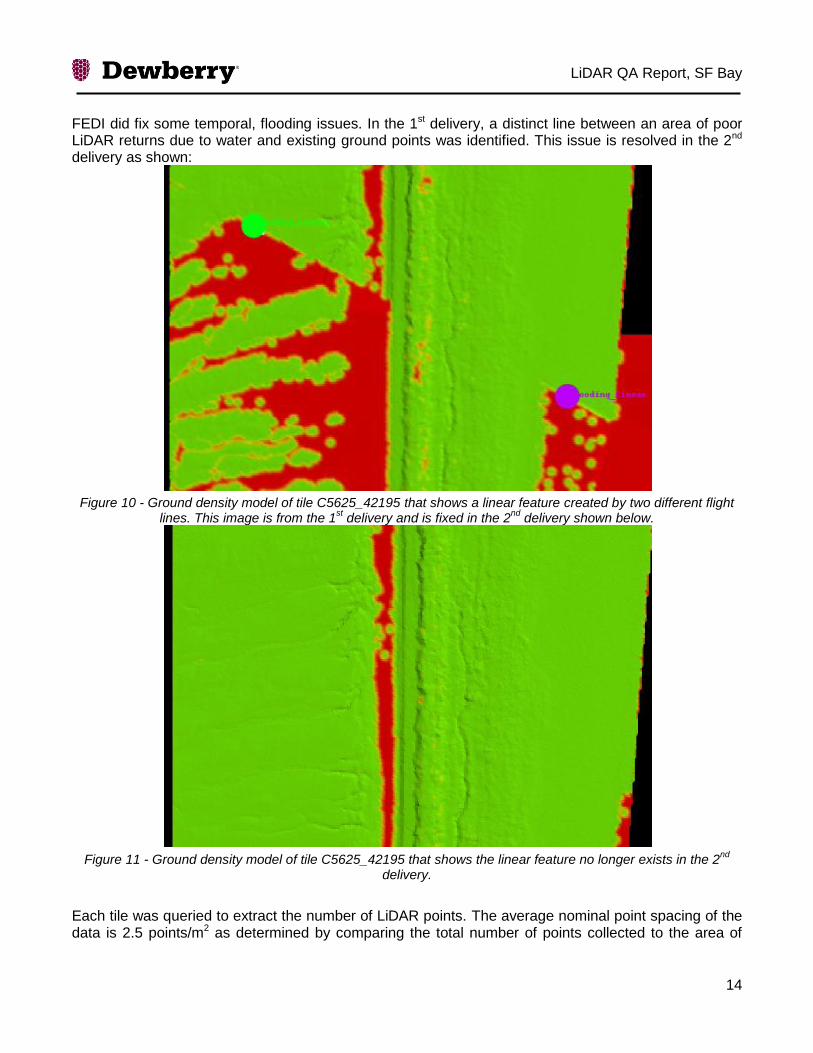
FEDI did fix some temporal, flooding issues. In the 1st delivery, a distinct line between an area of poor LiDAR returns due to water and existing ground points was identified. This issue is resolved in the 2nd delivery as shown:
Figure 10 - Ground density model of tile C5625_42195 that shows a linear feature created by two different flight
lines. This image is from the 1st delivery and is fixed in the 2
nd delivery shown below.
Figure 11 - Ground density model of tile C5625_42195 that shows the linear feature no longer exists in the 2
nd
delivery.
Each tile was queried to extract the number of LiDAR points. The average nominal point spacing of the data is 2.5 points/m2 as determined by comparing the total number of points collected to the area of
LiDAR QA Report, SF Bay
15
coverage. All tiles are within the anticipated size range except for those located on the coast or with large bodies of water, which are expected to have fewer points. The minimum and maximum elevations for class 2 were also evaluated and no major anomalies were identified. However, in tile C5715_42060, one point in class 12 has an elevation of 2,684,538.75 m. This is anomalous compared to other elevation values, but because it is in class 12 it has no effect on the quality of the ground model.
3.2.1 Data Not to Extent of Project Boundary - ADDRESSED In the initial delivery, Dewberry noted several locations were LiDAR data did not extend the project boundary. NOAA sent Dewberry an updated project boundary on March 4th, 2011. This project boundary addresses all issues listed in the 1st QA/QC document except for one. That issue is addressed in the third delivery. The issue is listed below in the Data Voids section (Section 3.2.3).
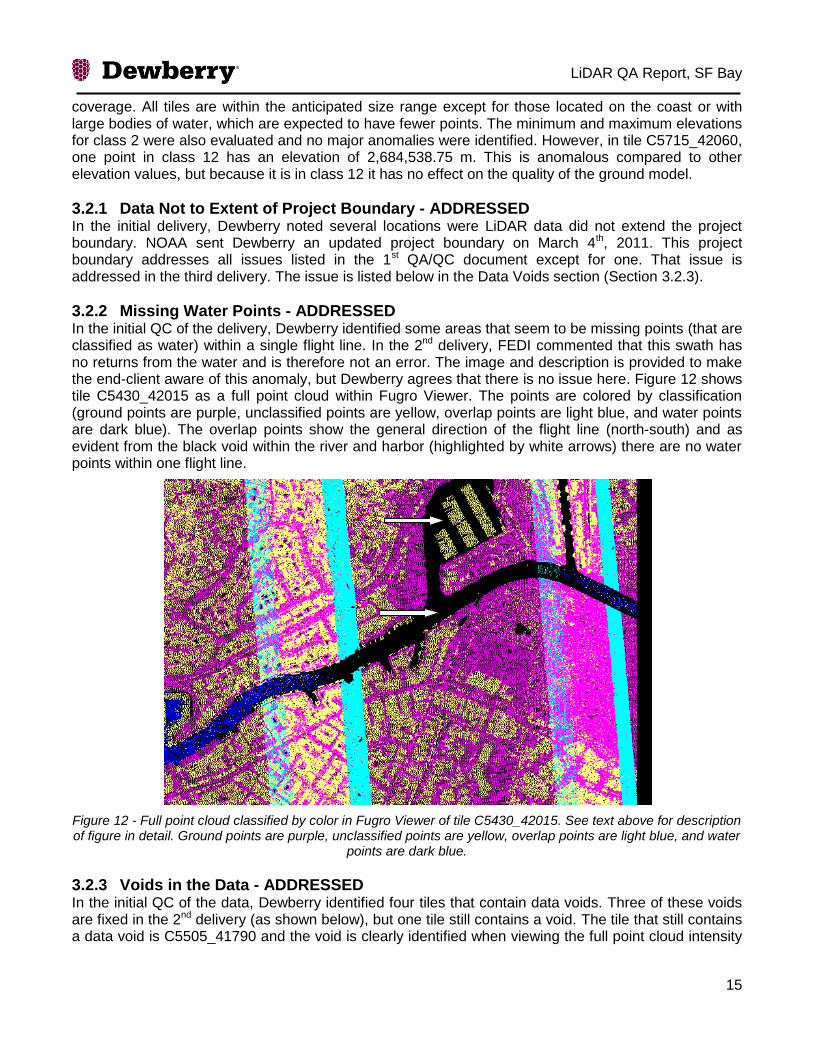
3.2.2 Missing Water Points - ADDRESSED In the initial QC of the delivery, Dewberry identified some areas that seem to be missing points (that are classified as water) within a single flight line. In the 2nd delivery, FEDI commented that this swath has no returns from the water and is therefore not an error. The image and description is provided to make the end-client aware of this anomaly, but Dewberry agrees that there is no issue here. Figure 12 shows tile C5430_42015 as a full point cloud within Fugro Viewer. The points are colored by classification (ground points are purple, unclassified points are yellow, overlap points are light blue, and water points are dark blue). The overlap points show the general direction of the flight line (north-south) and as evident from the black void within the river and harbor (highlighted by white arrows) there are no water points within one flight line.
Figure 12 - Full point cloud classified by color in Fugro Viewer of tile C5430_42015. See text above for description of figure in detail. Ground points are purple, unclassified points are yellow, overlap points are light blue, and water
points are dark blue.
3.2.3 Voids in the Data - ADDRESSED In the initial QC of the data, Dewberry identified four tiles that contain data voids. Three of these voids are fixed in the 2nd delivery (as shown below), but one tile still contains a void. The tile that still contains a data void is C5505_41790 and the void is clearly identified when viewing the full point cloud intensity

LiDAR QA Report, SF Bay
16
image (see Figure 13). This void still remained in the 2nd delivery. In the 3rd delivery, FEDI responded that they discussed this issue with NOAA and that “this area contains data from a cross-tie and [was not] QC’d as a production line. A data extents shapefile “SanFran_DataExtents_UTM10_NAD83_NSRS2007_m.shp” was provided with delivery identify the accurate coverage area. The intended project area has been covered and no loss of valuable data has occurred” (From San_Fran_Geodatabase Call_FEDI_REPLY_041411.doc, Dewberry assumes the delivery relates to a shapefile provided to NOAA). Based off this response, Dewberry no longer considers this to be an issue.
Figure 13 - Full point cloud intensity image of tile C5505_41790 that shows a data void. The red line is the project
boundary as provided by NOAA on March 4th, 2011.
Figure 14 – Map view of full point cloud from Fugro Viewer of tile C5505_41790 colored by classification. The
purple points are classified as ground (class 2), the yellow points are unclassified (class 1), and the white points are overlap (class 12).

LiDAR QA Report, SF Bay
17
In the 1st delivery, Dewberry noted three other tiles (C5430_42045, C5445_42045, and C5460_42045) that contain a thin strip where no ground/unclassified points exist. In the 2nd delivery, FEDI has fixed these tiles. Figure 15 to Figure 18 show examples of the corrections.
Figure 15 - Ground density model of tile C5460_42045 showing a linear feature were no ground points exist. This
has been fixed in the second delivery.
Figure 16 – Ground density model of tile C5460_42045 showing that the linear void in the image above has been
fixed in the 2nd
delivery.

LiDAR QA Report, SF Bay
18
Figure 17 - Ground density model of tile C5445_42045 from the 1
st delivery showing a linear feature were no
ground points exist. This has been fixed as shown below.
Figure 18 - Ground density model of tile C5445_42045 showing that in the 2
nd delivery the data void in the image
above is not present.
3.3 LiDAR Qualitative Review
The goal of Dewberry’s qualitative review is to assess the continuity and the level of cleanliness of the bare earth product. Each LiDAR tile is expected to meet the following acceptance criteria:
LiDAR QA Report, SF Bay
19
The point density is homogenous and sufficient to meet the user’s needs; The ground points have been correctly classified (no man-made structures or vegetation
remains, no gaps except over water bodies); The ground surface model exhibits a correct definition (no aggressive classification, no over-
smoothing, no inconsistency in the post-processing); No obvious anomalies due to sensor malfunction or systematic processing artifacts are
present (data voids, spikes, divots, ridges between flight lines or tiles, cornrows, etc); Residual artifacts <5%
As this is the third delivery of this dataset, Dewberry analysts performed a visual inspection of the bare earth tiles identified as containing issues during the initial QA or issues not addressed in the 2nd delivery. The DTMs are built by first creating a fishnet grid of the LiDAR masspoints with a grid distance of 1 meter. Then a triangulated irregular network is built based on this gridded DTM and displayed as a 3D surface. A shaded relief effect was applied which enhances 3D rendering. The software used for visualization allows the user to navigate, zoom and rotate models and to display elevation information with an adaptive color coding in order to better identify anomalies. All LiDAR classification issues called during the 1st and 2nd deliveries are addressed by FEDI. Dewberry identified no remaining issues with the LiDAR. Details of corrections are below in the following sections:
3.3.1 Aggressive Classification 3.3.2 Artifacts 3.3.3 Flight Line Ridges 3.3.4 Inconsistent Editing 3.3.5 Misclassification 3.3.6 Sensor Anomaly

LiDAR QA Report, SF Bay
20
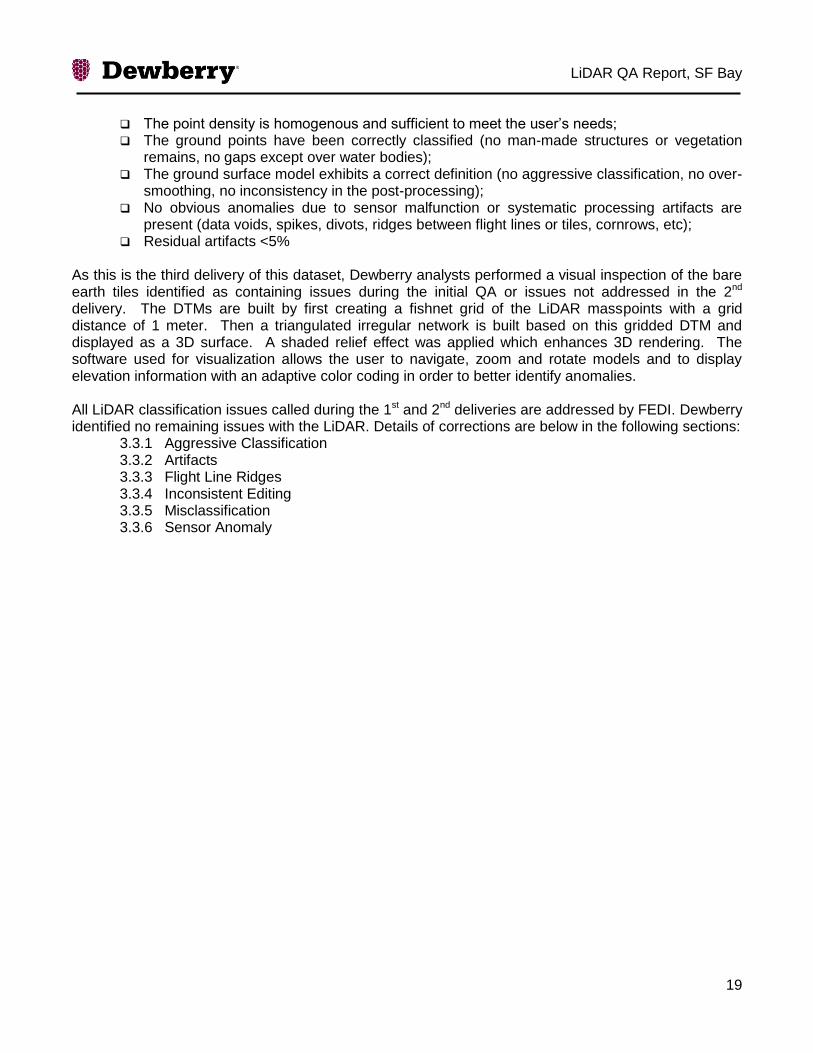
3.3.1 Aggressive Classification - ADDRESSED In the initial QC of the data, several areas were identified where ground points on the bank of a hydrographic feature or a road embankment had been aggressively classified. Aggressive classification happens when features that legitimately should be left in the ground are partially removed. FEDI addressed all calls in the 3rd delivery and no issues remain. Two examples of fixed aggressive classification calls are shown below in Figure 19 to Figure 22.
Figure 19 - Ground density model of tile c5535_42210 from the 1
st delivery showing ground that was aggressively
classified. This is fixed in the second delivery as shown below.
Figure 20 - - Ground density model of tile c5535_42210 showing that numerous legitimate ground points were put
into the ground model.
LiDAR QA Report, SF Bay
21
Figure 21 - Ground density model of tile C5610_41940 that shows an area with a city block that has been
aggressively classified.
Figure 22 – Ground density of tile C5610_41940 from 3
rd delivery showing all available ground points are added
and the aggressive classification has been addressed.
3.3.2 Artifacts - ADDRESSED These classification issues are caused by ground points that are left in the dataset that should be removed. In general these are buildings, bridges, vegetation, or docks/piers. FEDI addressed and corrected all artifact calls identified by Dewberry in the 3rd delivery. An example of a correction is provided below in Figure 23 and Figure 24.

LiDAR QA Report, SF Bay
22
Figure 23 - Ground density model of tile c5400_42135 showing a building artifact from the 1
st delivery.
Figure 24 - Ground density model of tile c5400_42135 showing that the building is removed in the 2
nd delivery.
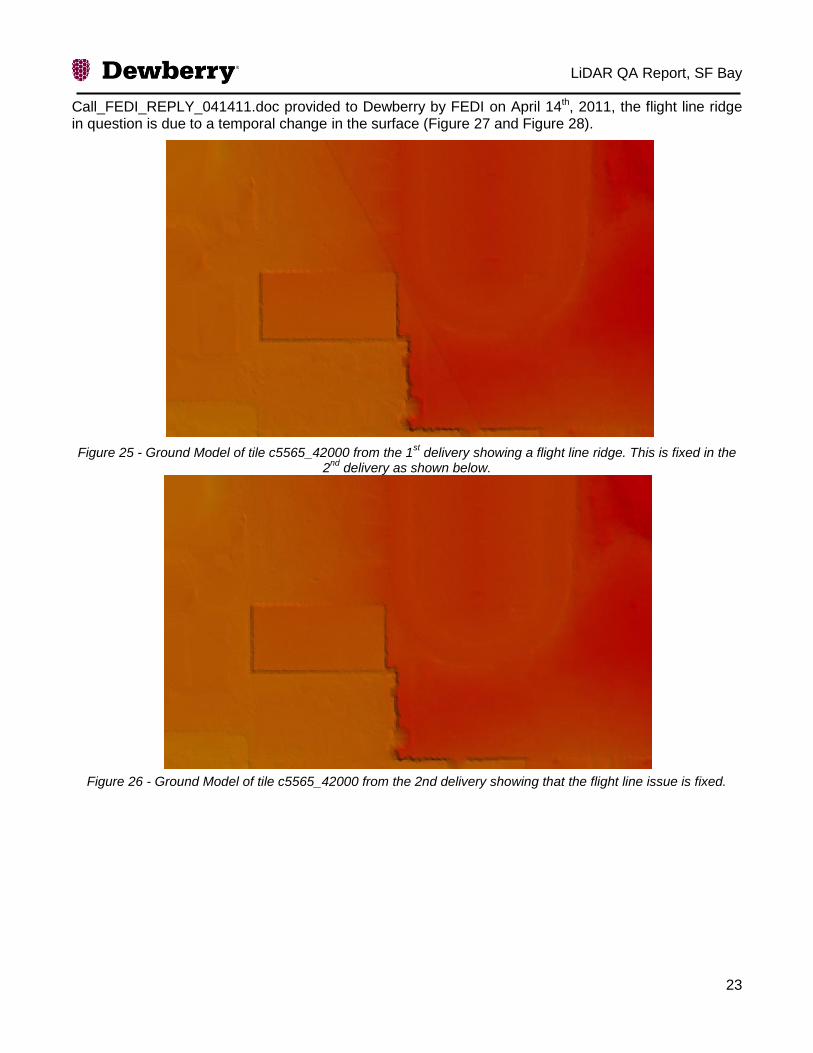
3.3.3 Flight Line Ridges - ADDRESSED FEDI addressed all flight line ridges calls. Numerous flight line ridges were corrected by adjusting trajectory files. Two images are provided below to show the results of FEDI fixing a flight line ridge (Figure 25 and Figure 26). Several flight line ridges are temporal and therefore still remain in the dataset. Dewberry confirmed that no flight line offset occurs on buildings/roads and therefore the ridge is temporal. FEDI states that one flight line ridge is due to surface subtraction and a temporal difference of flight line acquisition. Dewberry agrees that according to the San_Fran_Geodatabase
LiDAR QA Report, SF Bay
23
Call_FEDI_REPLY_041411.doc provided to Dewberry by FEDI on April 14th, 2011, the flight line ridge in question is due to a temporal change in the surface (Figure 27 and Figure 28).
Figure 25 - Ground Model of tile c5565_42000 from the 1st delivery showing a flight line ridge. This is fixed in the
2nd
delivery as shown below.
Figure 26 - Ground Model of tile c5565_42000 from the 2nd delivery showing that the flight line issue is fixed.
LiDAR QA Report, SF Bay
24
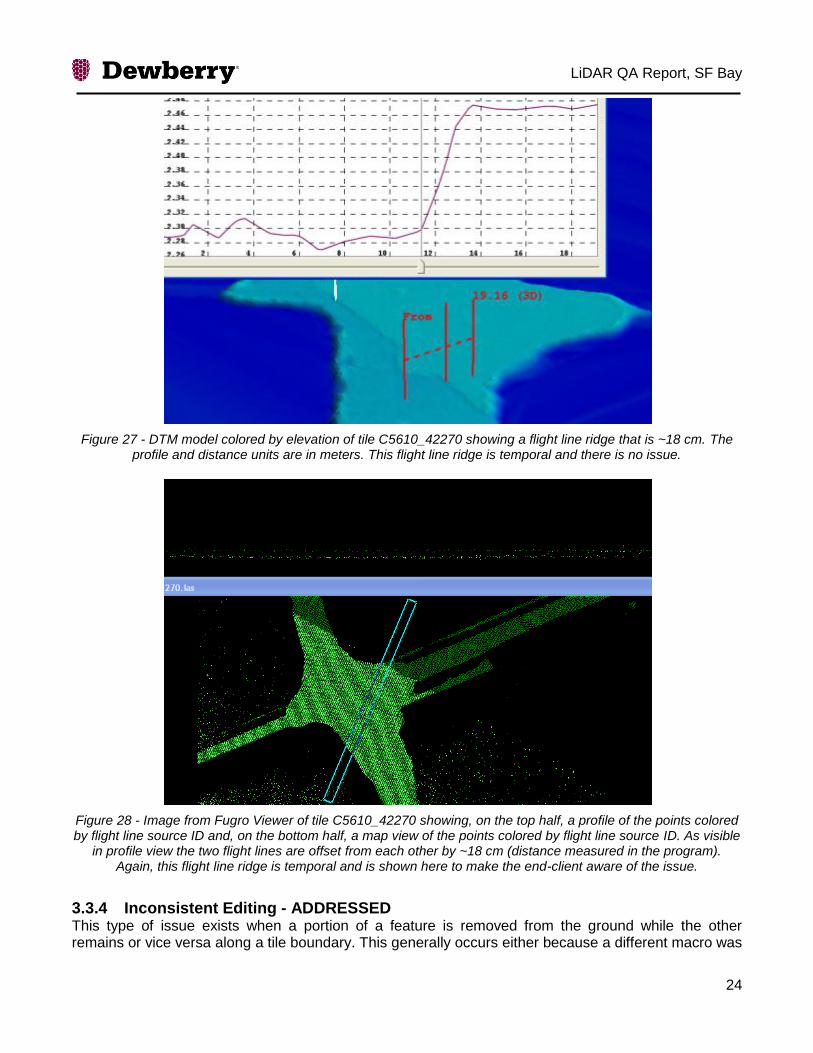
Figure 27 - DTM model colored by elevation of tile C5610_42270 showing a flight line ridge that is ~18 cm. The profile and distance units are in meters. This flight line ridge is temporal and there is no issue.
Figure 28 - Image from Fugro Viewer of tile C5610_42270 showing, on the top half, a profile of the points colored by flight line source ID and, on the bottom half, a map view of the points colored by flight line source ID. As visible
in profile view the two flight lines are offset from each other by ~18 cm (distance measured in the program). Again, this flight line ridge is temporal and is shown here to make the end-client aware of the issue.
3.3.4 Inconsistent Editing - ADDRESSED This type of issue exists when a portion of a feature is removed from the ground while the other remains or vice versa along a tile boundary. This generally occurs either because a different macro was
LiDAR QA Report, SF Bay
25
used to automatically classify the data or a different technician manually edited each tile and used different criteria for what was ground/vegetation. All issues with inconsistent editing were addressed by FEDI in the second delivery.
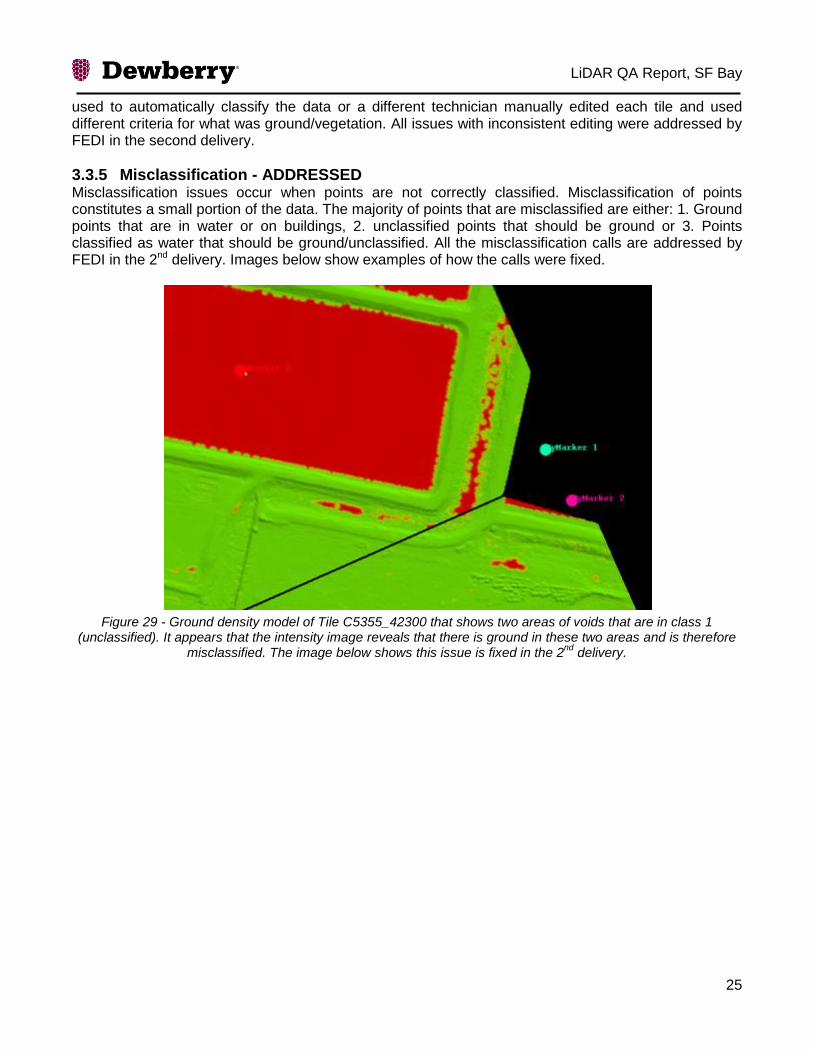
3.3.5 Misclassification - ADDRESSED Misclassification issues occur when points are not correctly classified. Misclassification of points constitutes a small portion of the data. The majority of points that are misclassified are either: 1. Ground points that are in water or on buildings, 2. unclassified points that should be ground or 3. Points classified as water that should be ground/unclassified. All the misclassification calls are addressed by FEDI in the 2nd delivery. Images below show examples of how the calls were fixed.
Figure 29 - Ground density model of Tile C5355_42300 that shows two areas of voids that are in class 1
(unclassified). It appears that the intensity image reveals that there is ground in these two areas and is therefore misclassified. The image below shows this issue is fixed in the 2
nd delivery.
LiDAR QA Report, SF Bay
26
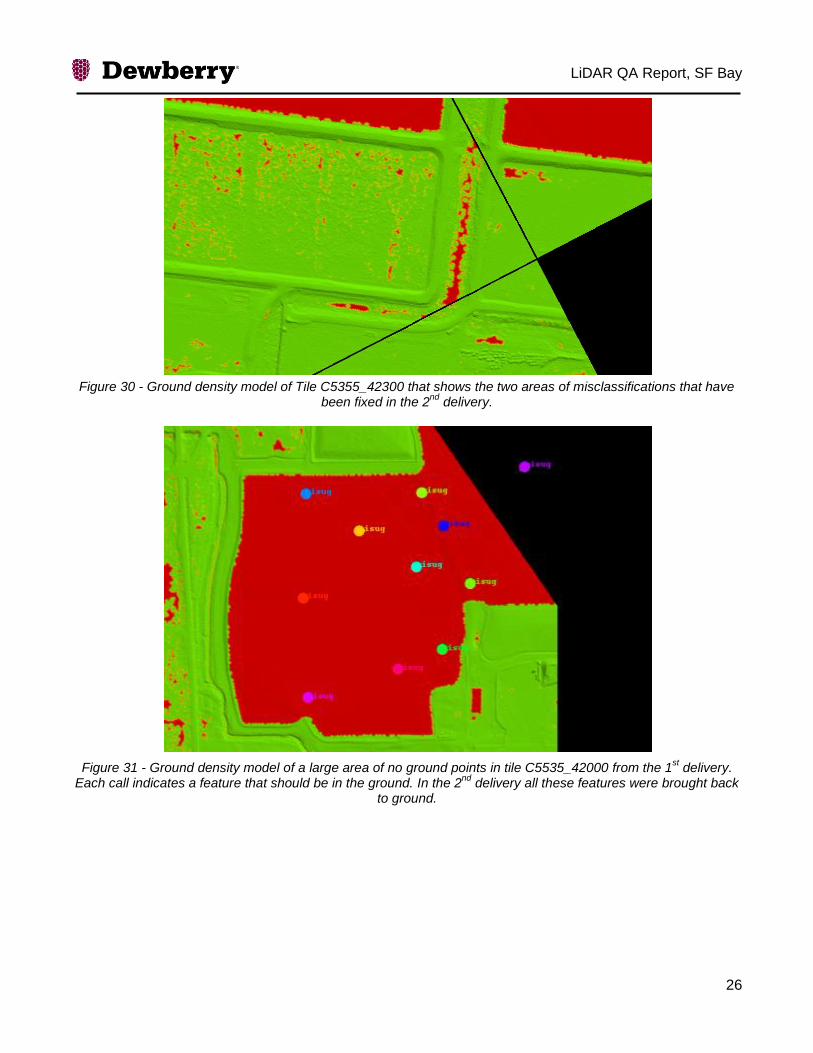
Figure 30 - Ground density model of Tile C5355_42300 that shows the two areas of misclassifications that have
been fixed in the 2nd
delivery.
Figure 31 - Ground density model of a large area of no ground points in tile C5535_42000 from the 1st delivery.
Each call indicates a feature that should be in the ground. In the 2nd
delivery all these features were brought back to ground.
LiDAR QA Report, SF Bay
27
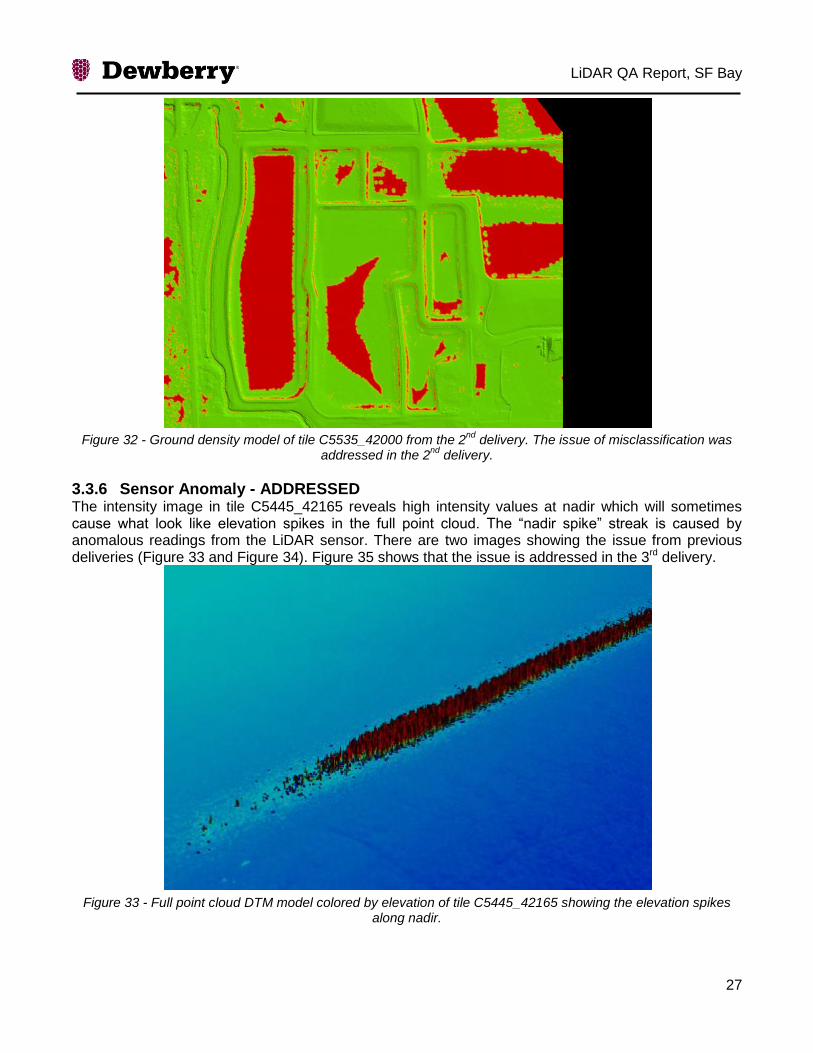
Figure 32 - Ground density model of tile C5535_42000 from the 2
nd delivery. The issue of misclassification was
addressed in the 2nd
delivery.
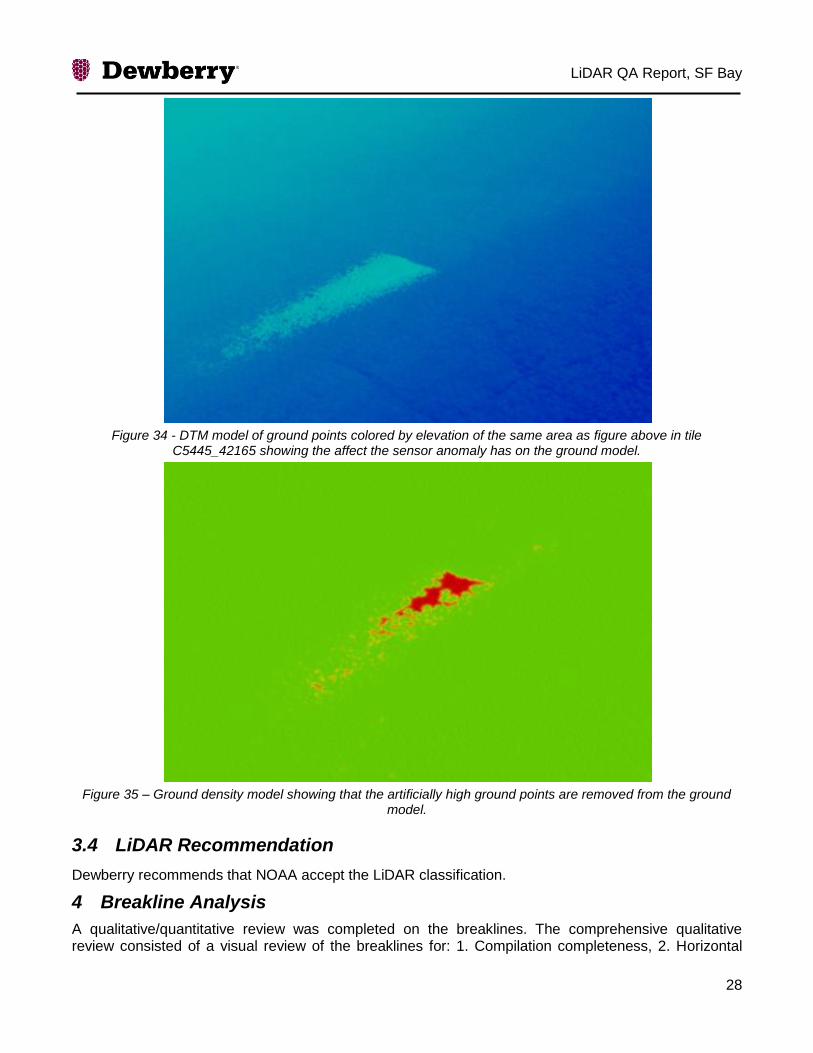
3.3.6 Sensor Anomaly - ADDRESSED The intensity image in tile C5445_42165 reveals high intensity values at nadir which will sometimes cause what look like elevation spikes in the full point cloud. The “nadir spike” streak is caused by anomalous readings from the LiDAR sensor. There are two images showing the issue from previous deliveries (Figure 33 and Figure 34). Figure 35 shows that the issue is addressed in the 3rd delivery.
Figure 33 - Full point cloud DTM model colored by elevation of tile C5445_42165 showing the elevation spikes
along nadir.
LiDAR QA Report, SF Bay
28
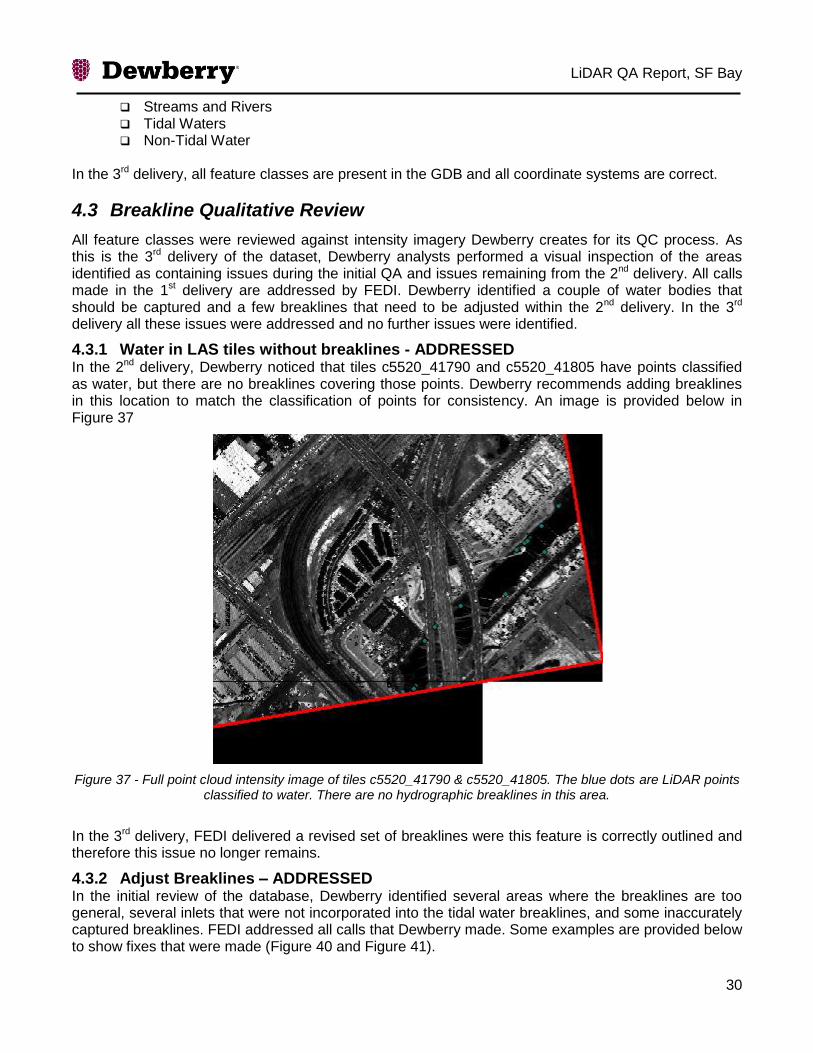
Figure 34 - DTM model of ground points colored by elevation of the same area as figure above in tile
C5445_42165 showing the affect the sensor anomaly has on the ground model.
Figure 35 – Ground density model showing that the artificially high ground points are removed from the ground model.
3.4 LiDAR Recommendation
Dewberry recommends that NOAA accept the LiDAR classification.
4 Breakline Analysis
A qualitative/quantitative review was completed on the breaklines. The comprehensive qualitative review consisted of a visual review of the breaklines for: 1. Compilation completeness, 2. Horizontal

LiDAR QA Report, SF Bay
29
placement accuracy, and 3. Proper feature coding. This visual analysis was followed by several automated tests for hydro-enforcement and topology using ESRI PLTS tools and proprietary tools developed by Dewberry.
4.1 Breakline Data Overview
The GDB is reviewed in ArcCatalog for correct spatial projections, data organization, and to ensure all necessary feature classes are present. FEDI breakline data has the following spatial projection (Figure 36):
Horizontal Datum: NAD83 (NSRS2007) Vertical Datum: NAVD88 Geoid09 Projection: UTM zone 10N Horizontal and Vertical Units: Meters
The feature classes are organized within an ESRI 9.3 Geodatabase. All feature classes were verified to contain z-elevation values as specified by the project data dictionary.
Figure 36 – Geographic coordinate system for FEDI Breaklines GDB.
4.2 Breakline Completeness
The breakline completeness review includes ensuring all feature classes defined in the scope of work are present and have the correct extents. The San Francisco breaklines GDB includes the following feature classes:
Ponds and Lakes
LiDAR QA Report, SF Bay
30
Streams and Rivers Tidal Waters Non-Tidal Water
In the 3rd delivery, all feature classes are present in the GDB and all coordinate systems are correct.
4.3 Breakline Qualitative Review
All feature classes were reviewed against intensity imagery Dewberry creates for its QC process. As this is the 3rd delivery of the dataset, Dewberry analysts performed a visual inspection of the areas identified as containing issues during the initial QA and issues remaining from the 2nd delivery. All calls made in the 1st delivery are addressed by FEDI. Dewberry identified a couple of water bodies that should be captured and a few breaklines that need to be adjusted within the 2nd delivery. In the 3rd delivery all these issues were addressed and no further issues were identified.
4.3.1 Water in LAS tiles without breaklines - ADDRESSED In the 2nd delivery, Dewberry noticed that tiles c5520_41790 and c5520_41805 have points classified as water, but there are no breaklines covering those points. Dewberry recommends adding breaklines in this location to match the classification of points for consistency. An image is provided below in Figure 37
Figure 37 - Full point cloud intensity image of tiles c5520_41790 & c5520_41805. The blue dots are LiDAR points classified to water. There are no hydrographic breaklines in this area.
In the 3rd delivery, FEDI delivered a revised set of breaklines were this feature is correctly outlined and therefore this issue no longer remains.
4.3.2 Adjust Breaklines – ADDRESSED In the initial review of the database, Dewberry identified several areas where the breaklines are too general, several inlets that were not incorporated into the tidal water breaklines, and some inaccurately captured breaklines. FEDI addressed all calls that Dewberry made. Some examples are provided below to show fixes that were made (Figure 40 and Figure 41).

LiDAR QA Report, SF Bay
31
In addition, during the initial QA, Dewberry identified numerous piers around San Francisco Bay that were not removed from the ground model. Dewberry suggested these be removed from the ground model as it could reasonably be determined where the edge of the water most probably falls beneath the piers. These piers are now removed from the dataset in the 3rd delivery and the breaklines and LAS classification are adjusted appropriately.
Figure 38 - Full point intensity image of tile C5520_41835 showing that piers are not removed by the tidal waters breakline (the blue line). These features should be removed because it can reasonably be determined where the
edge of the water most probably falls beneath the piers.
LiDAR QA Report, SF Bay
32
Figure 39 - Full point cloud intensity of tile C5520_41835 from 3
rd delivery. The breaklines are adjusted and the
piers removed from the ground model.
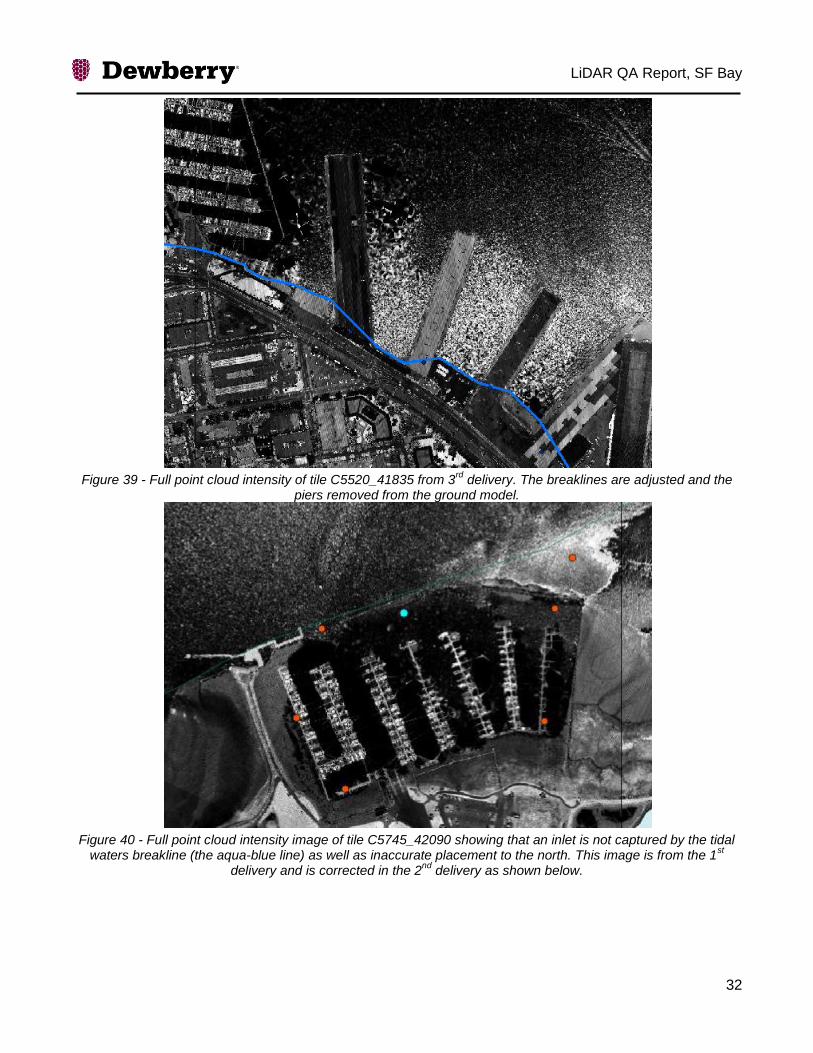
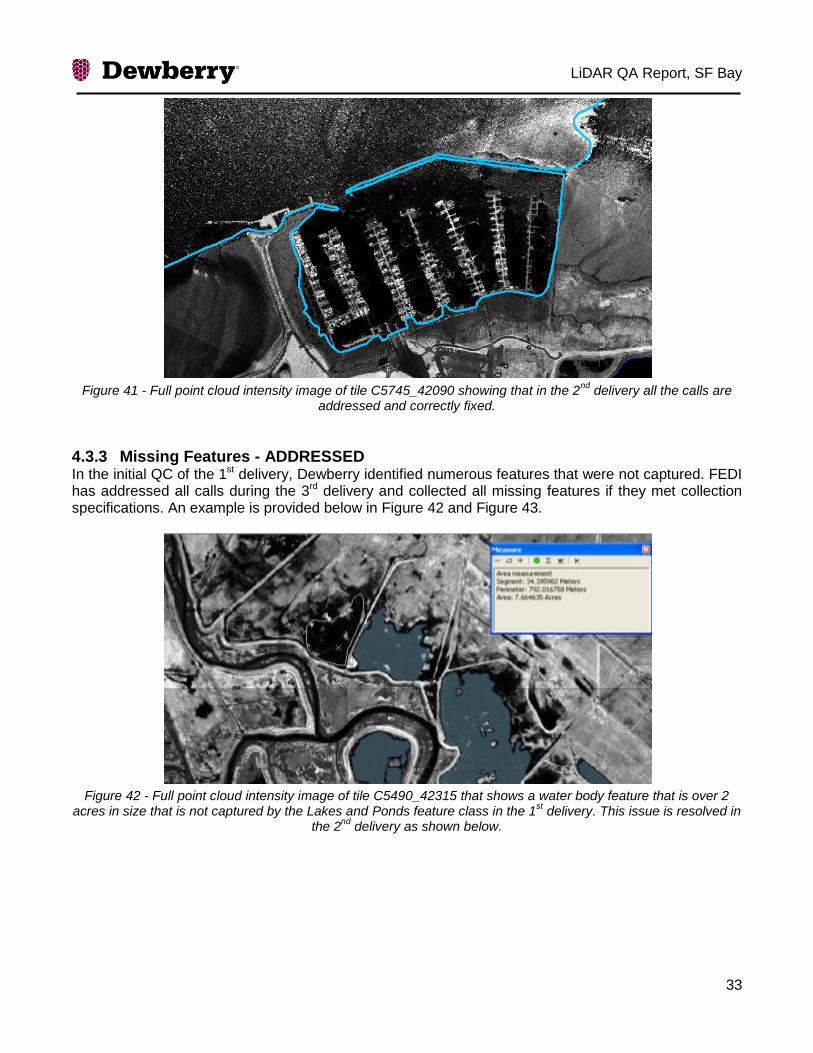
Figure 40 - Full point cloud intensity image of tile C5745_42090 showing that an inlet is not captured by the tidal
waters breakline (the aqua-blue line) as well as inaccurate placement to the north. This image is from the 1st
delivery and is corrected in the 2nd
delivery as shown below.
LiDAR QA Report, SF Bay
33
Figure 41 - Full point cloud intensity image of tile C5745_42090 showing that in the 2
nd delivery all the calls are
addressed and correctly fixed.
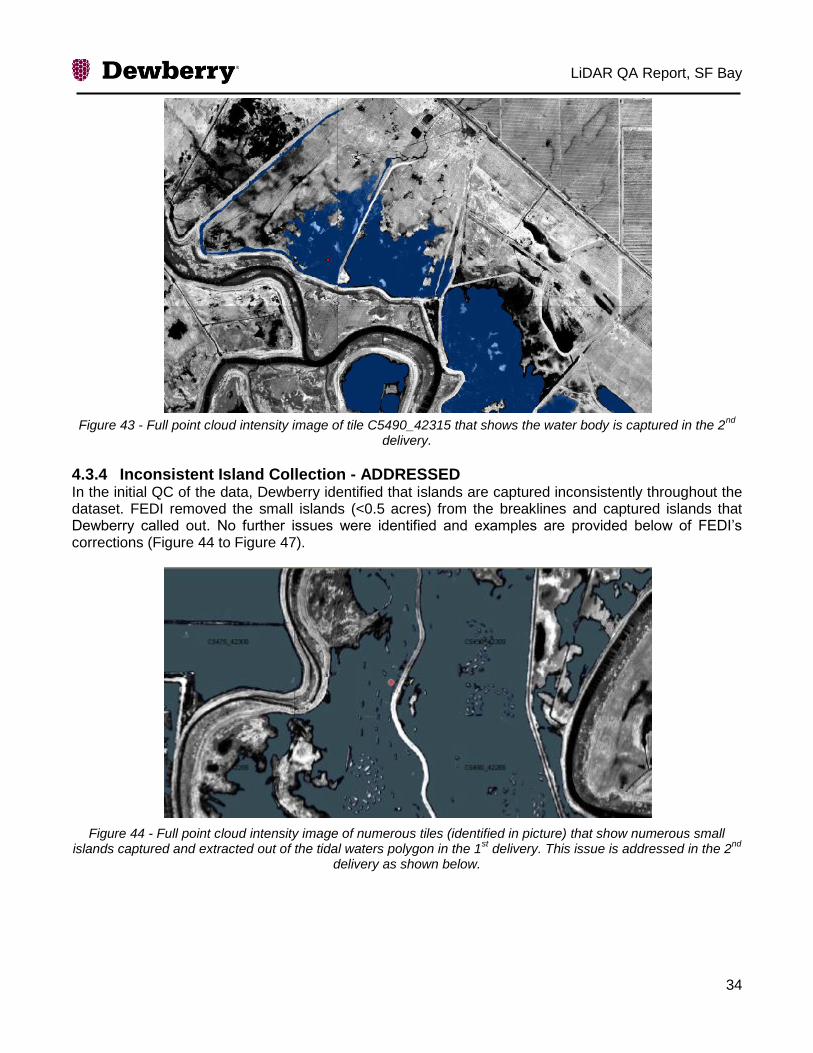
4.3.3 Missing Features - ADDRESSED In the initial QC of the 1st delivery, Dewberry identified numerous features that were not captured. FEDI has addressed all calls during the 3rd delivery and collected all missing features if they met collection specifications. An example is provided below in Figure 42 and Figure 43.
Figure 42 - Full point cloud intensity image of tile C5490_42315 that shows a water body feature that is over 2
acres in size that is not captured by the Lakes and Ponds feature class in the 1st delivery. This issue is resolved in
the 2nd
delivery as shown below.
LiDAR QA Report, SF Bay
34
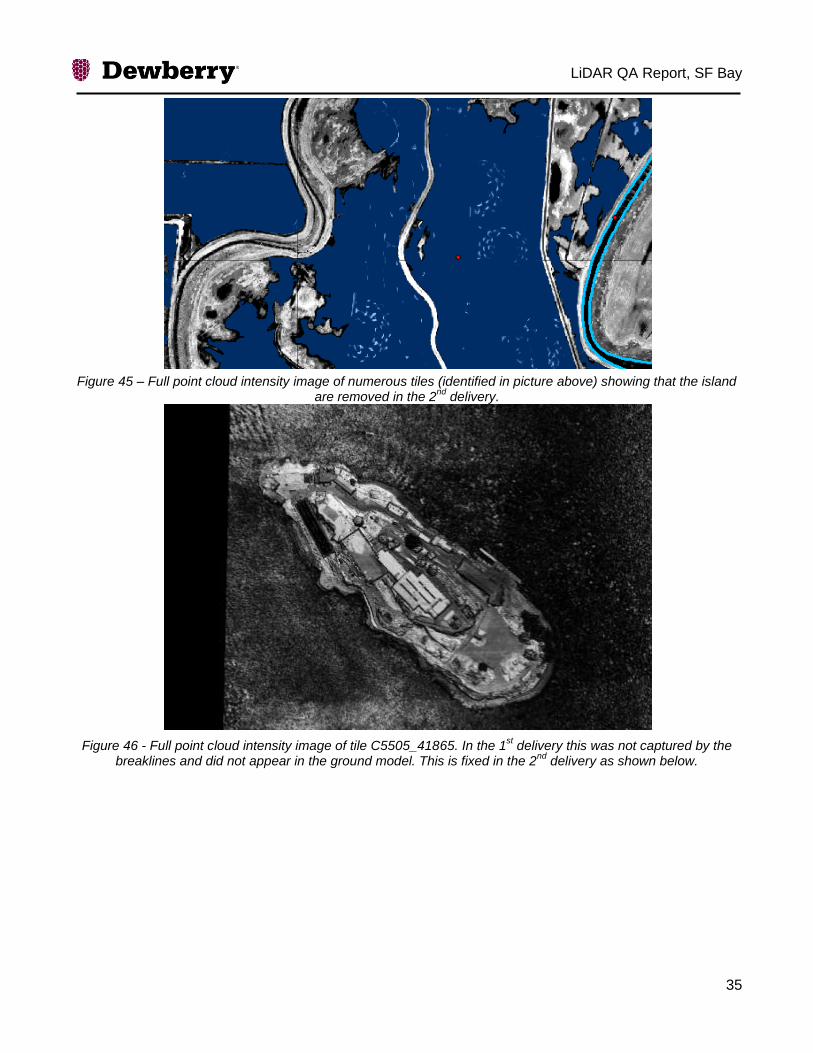
Figure 43 - Full point cloud intensity image of tile C5490_42315 that shows the water body is captured in the 2
nd
delivery.
4.3.4 Inconsistent Island Collection - ADDRESSED In the initial QC of the data, Dewberry identified that islands are captured inconsistently throughout the dataset. FEDI removed the small islands (<0.5 acres) from the breaklines and captured islands that Dewberry called out. No further issues were identified and examples are provided below of FEDI’s corrections (Figure 44 to Figure 47).
Figure 44 - Full point cloud intensity image of numerous tiles (identified in picture) that show numerous small islands captured and extracted out of the tidal waters polygon in the 1
st delivery. This issue is addressed in the 2
nd
delivery as shown below.
LiDAR QA Report, SF Bay
35
Figure 45 – Full point cloud intensity image of numerous tiles (identified in picture above) showing that the island
are removed in the 2nd
delivery.
Figure 46 - Full point cloud intensity image of tile C5505_41865. In the 1st delivery this was not captured by the
breaklines and did not appear in the ground model. This is fixed in the 2nd
delivery as shown below.
LiDAR QA Report, SF Bay
36
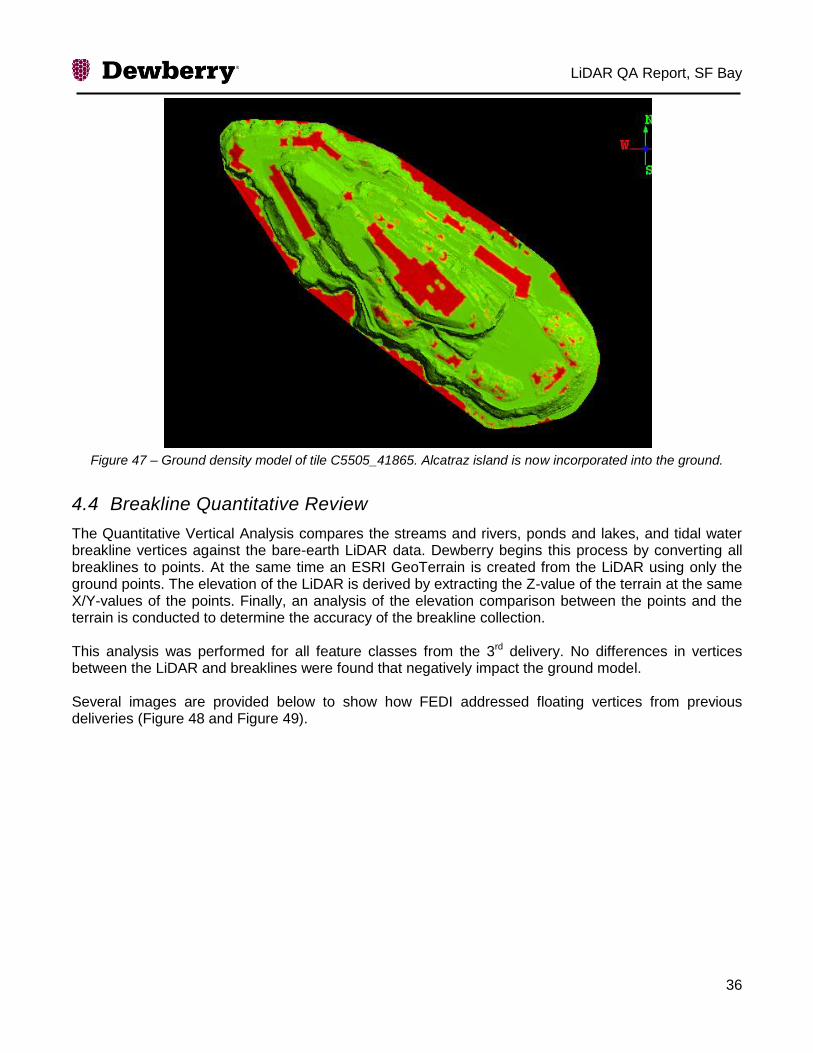
Figure 47 – Ground density model of tile C5505_41865. Alcatraz island is now incorporated into the ground.
4.4 Breakline Quantitative Review
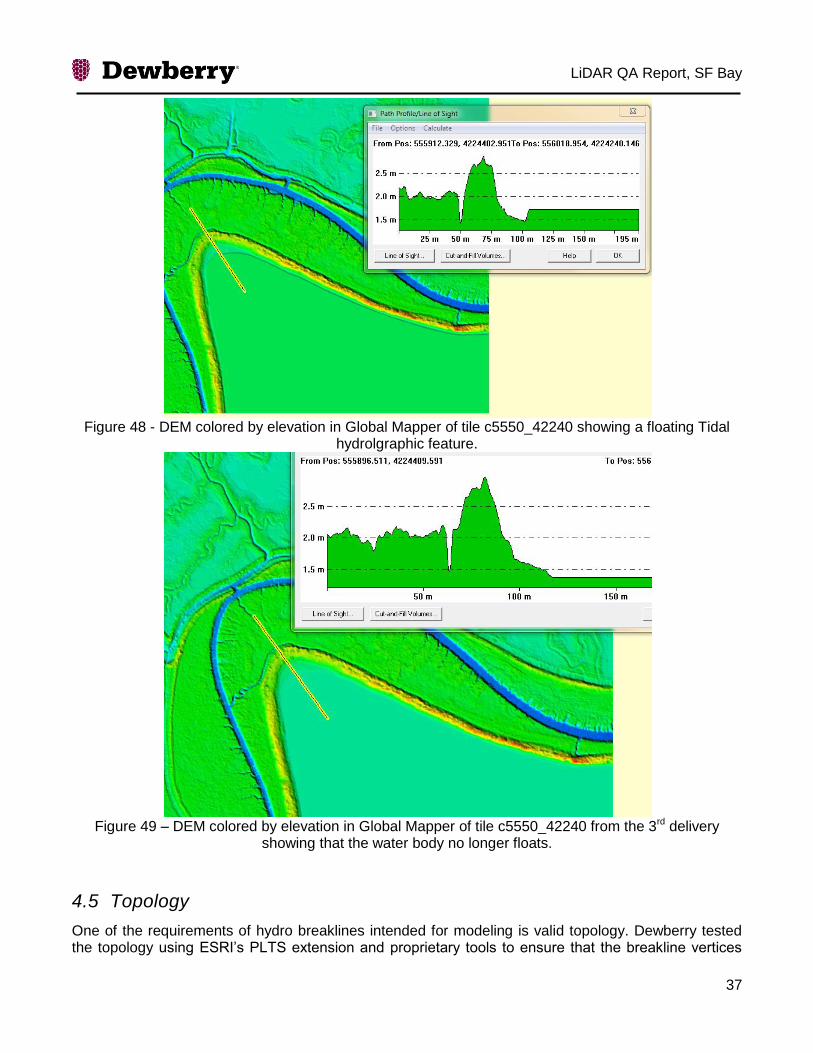
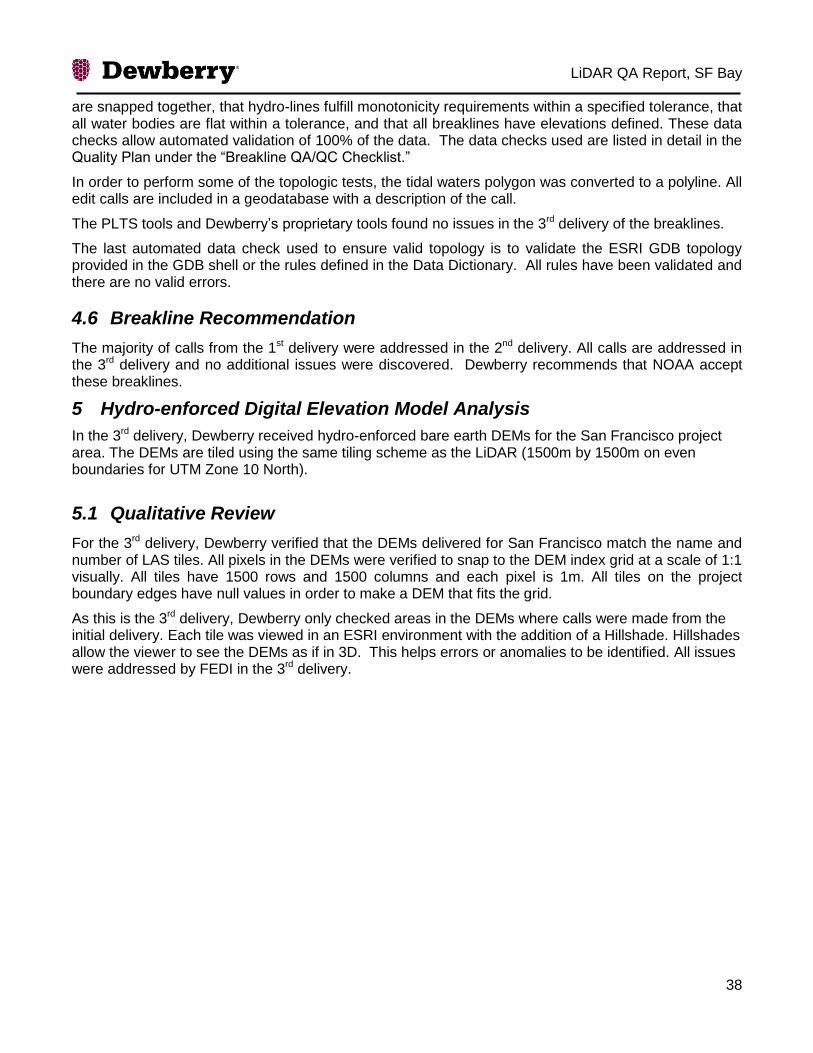
The Quantitative Vertical Analysis compares the streams and rivers, ponds and lakes, and tidal water breakline vertices against the bare-earth LiDAR data. Dewberry begins this process by converting all breaklines to points. At the same time an ESRI GeoTerrain is created from the LiDAR using only the ground points. The elevation of the LiDAR is derived by extracting the Z-value of the terrain at the same X/Y-values of the points. Finally, an analysis of the elevation comparison between the points and the terrain is conducted to determine the accuracy of the breakline collection. This analysis was performed for all feature classes from the 3rd delivery. No differences in vertices between the LiDAR and breaklines were found that negatively impact the ground model. Several images are provided below to show how FEDI addressed floating vertices from previous deliveries (Figure 48 and Figure 49).
LiDAR QA Report, SF Bay
37
Figure 48 - DEM colored by elevation in Global Mapper of tile c5550_42240 showing a floating Tidal
hydrolgraphic feature.
Figure 49 – DEM colored by elevation in Global Mapper of tile c5550_42240 from the 3rd delivery
showing that the water body no longer floats.
4.5 Topology
One of the requirements of hydro breaklines intended for modeling is valid topology. Dewberry tested the topology using ESRI’s PLTS extension and proprietary tools to ensure that the breakline vertices
LiDAR QA Report, SF Bay
38
are snapped together, that hydro-lines fulfill monotonicity requirements within a specified tolerance, that all water bodies are flat within a tolerance, and that all breaklines have elevations defined. These data checks allow automated validation of 100% of the data. The data checks used are listed in detail in the Quality Plan under the “Breakline QA/QC Checklist.”
In order to perform some of the topologic tests, the tidal waters polygon was converted to a polyline. All edit calls are included in a geodatabase with a description of the call.
The PLTS tools and Dewberry’s proprietary tools found no issues in the 3rd delivery of the breaklines.
The last automated data check used to ensure valid topology is to validate the ESRI GDB topology provided in the GDB shell or the rules defined in the Data Dictionary. All rules have been validated and there are no valid errors.
4.6 Breakline Recommendation
The majority of calls from the 1st delivery were addressed in the 2nd delivery. All calls are addressed in the 3rd delivery and no additional issues were discovered. Dewberry recommends that NOAA accept these breaklines.
5 Hydro-enforced Digital Elevation Model Analysis
In the 3rd delivery, Dewberry received hydro-enforced bare earth DEMs for the San Francisco project area. The DEMs are tiled using the same tiling scheme as the LiDAR (1500m by 1500m on even boundaries for UTM Zone 10 North).
5.1 Qualitative Review
For the 3rd delivery, Dewberry verified that the DEMs delivered for San Francisco match the name and number of LAS tiles. All pixels in the DEMs were verified to snap to the DEM index grid at a scale of 1:1 visually. All tiles have 1500 rows and 1500 columns and each pixel is 1m. All tiles on the project boundary edges have null values in order to make a DEM that fits the grid.
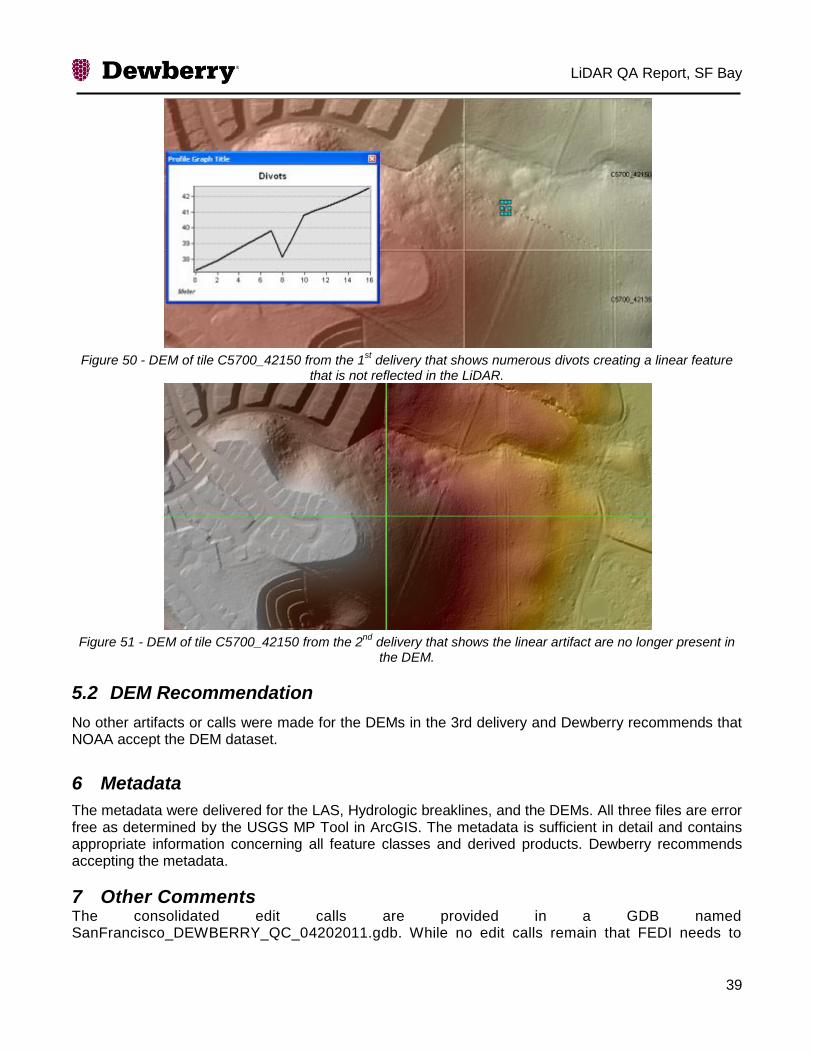
As this is the 3rd delivery, Dewberry only checked areas in the DEMs where calls were made from the initial delivery. Each tile was viewed in an ESRI environment with the addition of a Hillshade. Hillshades allow the viewer to see the DEMs as if in 3D. This helps errors or anomalies to be identified. All issues were addressed by FEDI in the 3rd delivery.
LiDAR QA Report, SF Bay
39
Figure 50 - DEM of tile C5700_42150 from the 1
st delivery that shows numerous divots creating a linear feature
that is not reflected in the LiDAR.
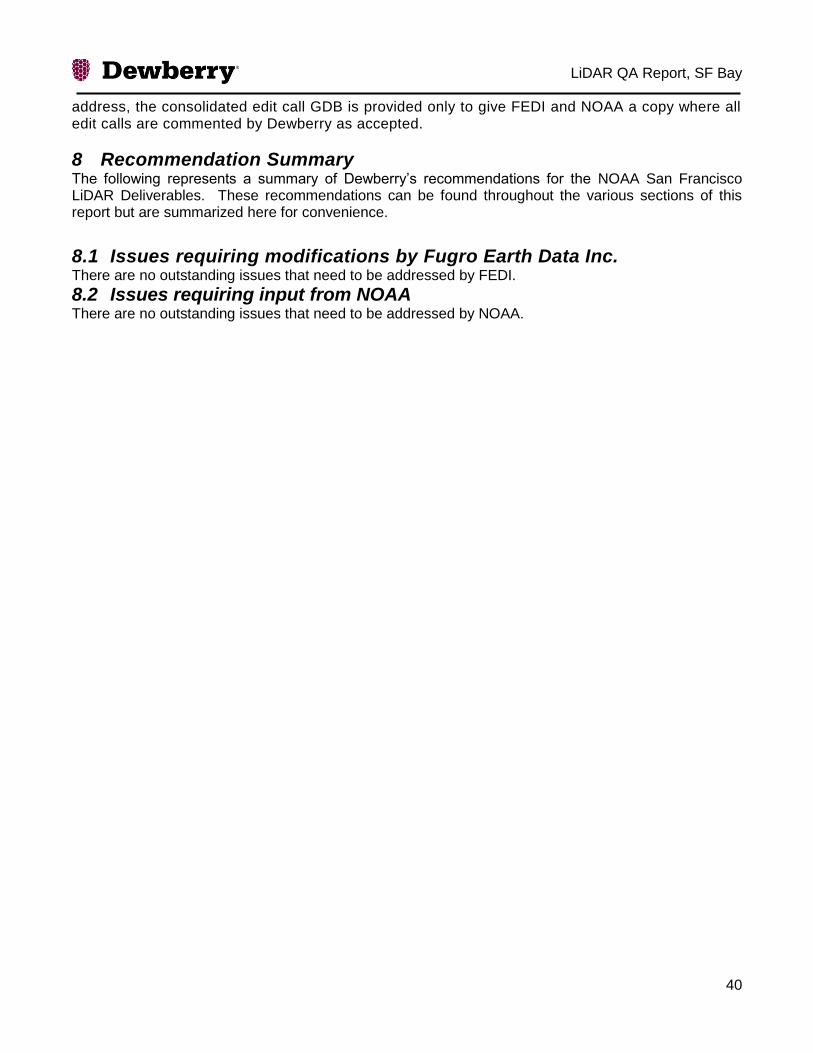
Figure 51 - DEM of tile C5700_42150 from the 2
nd delivery that shows the linear artifact are no longer present in the DEM.
5.2 DEM Recommendation
No other artifacts or calls were made for the DEMs in the 3rd delivery and Dewberry recommends that NOAA accept the DEM dataset.
6 Metadata
The metadata were delivered for the LAS, Hydrologic breaklines, and the DEMs. All three files are error free as determined by the USGS MP Tool in ArcGIS. The metadata is sufficient in detail and contains appropriate information concerning all feature classes and derived products. Dewberry recommends accepting the metadata.
7 Other Comments The consolidated edit calls are provided in a GDB named SanFrancisco_DEWBERRY_QC_04202011.gdb. While no edit calls remain that FEDI needs to
LiDAR QA Report, SF Bay
40
address, the consolidated edit call GDB is provided only to give FEDI and NOAA a copy where all edit calls are commented by Dewberry as accepted.
8 Recommendation Summary The following represents a summary of Dewberry’s recommendations for the NOAA San Francisco LiDAR Deliverables. These recommendations can be found throughout the various sections of this report but are summarized here for convenience.
8.1 Issues requiring modifications by Fugro Earth Data Inc. There are no outstanding issues that need to be addressed by FEDI.
8.2 Issues requiring input from NOAA There are no outstanding issues that need to be addressed by NOAA.