lidar and ground penetrating radar data in … · correctness of the execution of works. ... the...
TRANSCRIPT

Technical Sciences, 2017, 20(2), 111–129
LIDAR AND GROUND PENETRATING RADAR DATAIN DETERMINING ROAD SURFACE CONDITIONS
AND GEOLOGICAL CHARACTERISTICSOF UNSTABLE SOILS
Artur Plichta1, Adam Piasecki2
1 Department of Surveying,Poznan University of Technology
2 Apex Geoservices Ltd.,Gorey, Republic of Ireland
Received 31 March 2016, accepted 23 February 2017, available online 27 February 2017
Key wo rds: road investment, laser scanning, geophysics, ground penetrating radar.
Abs t r act
Within the road investments the very important element determining repeatedly the success ofthe whole project is an adequate information about the characteristics of the site, its load capacity,stability and the possible impact of geological characteristics that may interfere with subsequentservice life, not only for the road surface itself, but also for the surrounded objects. The surface isincessantly influenced by geological characteristics, determining its durability and functional useful-ness. The main aim of this paper is to answer the question how by the usage of modern technics forobtaining data it is possible to find a link confirming the characteristics of land on which the specificroad projects are supposed to be carried out, or where these projects have already been accomplished,concerning their requirements with high accuracy of location and also the stability and durability ofthe ground. This article makes also an attempt to answer not only the question how to identify theconstruction of road surface, but also how to locate underground cavities, created or influenced by theflow of water, or due to geological structures characterized as an inconsistent ground. The resultswere supported with geophysical researches using GPR method, and also data collected with laserscanners.
Correspondence: Artur Plichta, Zakład Geodezji, Instytut Inżynierii Lądowej, Wydział Budownictwai Inżynierii Środowiska, Politechnika Poznańska, Piotrowo 5, 60-965 Poznań, phone: 61 6652419,e-mail: [email protected]

Introduction
Due to rapid development of remote methods of obtaining data for certainareas and the imagery from the aerial and satellite altitude, and also furtherdevelopment of digital technologies of their processing, integration and visual-ization, the possibilities of generating the various sets of results are stillgrowing. Every day they are becoming more useful for creation of variousdatabases and information systems, thereby causing a steady growth of rangeof their users. A completely new situation arose upon the occurrence ofairborne laser scanning methods with very high resolution. In terms of basicperformance parameters, these methods slowly but steadily and quite effec-tively find the right place in market applications (KURCZYŃSKI, WOLNIEWICZ
2002, 2005, KURCZYŃSKI 2005, Spaceimaging.com.). LIDAR data, obtained onthe basis of the results of the scan area provide rich and real information aboutthe interested areas, and it may be also a valuable component of informationsystems, and due to their combination of geophysical methods can create aninterdisciplinary space for their adoption (HOWARD 2009, SANDERS 2000). Anexample of such use is the collection of data about the terrain model, which,together with geophysical data, provide information and evidence of existenceof variety of geological structures, and thus the heterogeneous characteristicsof the land. These techniques also give an opportunity to achieve informationabout changes and defects in the structural layers. In addition, the efficiencyand quality of such kind of data made them one of the basic methods ofassessing the structural condition of road surface, together with providing dataabout the terrain profiles and their physico-chemical composition. This in turngives an opportunity to create geo-referenced GIS databases that allow toconduct multivariate and multi-criteria statistical and space analysis.
Aim of the study
The lack of adequate investment for safety in area of geological protectionquite often results with the inappropriate quality parameters of the implemen-ted project, both during construction stage and during its operating time. Theoverall aim of strengthening the subsoil is adjusting its parameters to theoperational requirements of installed facilities. Before we determine thenecessity of strengthening the ground we should acquire an adequate engin-eering-geological conditions introduced by the study of the inconsistent groundpresented i.e. in the form of geological and engineering documentation of theinterested area. As the contrast to typical practice, the range of researchshould also include investigation of layers properties usually and generally
Artur Plichta, Adam Piasecki112
Technical Sciences 20(2) 2017

referred as unstable – these effectively always should be strengthened. Theirphysical and mechanical properties (before and after amplification) are, after all,not only the basis for the design or a choice of how to strengthen the ground, butalso the choice of how to implement the entire project and its cost calculation(JERMOŁOWICZ 2013). Some of the European legislation in terms of designingroutes imposes very specific conditions. If it is possible, it should be avoided toproject driving routes through the areas of peat bogs, silt and other highlyirrigated unstable soils. These are constantly wet, hard and poorly penetrablesurfaces, covered with marsh and marshy-meadow plant communities, extreme-ly valuable in terms of natural heritage. Apart from aspects of nature, theconstruction of roads through the area of wetlands always brings increased costsbecause of the use of very expensive engineering solutions. The costs ofmaintaining such a route are usually much higher than the route carried out innormal water and groundwater circumstances. The unstable grounds are notsuitable for direct foundation of engineering structures. Road embankments, inturn, set on weak soil grounds may be affected by the significant deformationsdue to its compressibility and plastic deformations. Methods of road designingon unstable soils are extremely invasive and can be used only on land of lowthickness and playing no significant role from the point of view of naturalheritage. Setting roads over peat bogs and other wetlands or high ground waterlevel should be preceded by a thorough examination of geological and geophysi-cal terms (SISKOM, http://www.siskom.waw.pl).
Second approach taken in this article, is the quality checking of thecorrectness and “honesty” of the execution of the road surface, which mustdeal not only with the requirements of quality, but also must contain a cross-section of all (required by the regulations) layers of road, in addition withcomplying the project thicknesses. It is, or rather should be, in a way a controlparameter, not only during the construction phase of the road, but also asa part of control measurements, giving a rise to the approval by the client thecorrectness of the execution of works. Lack of adequate quality information,both in respect of the surface layers and the land can seriously interfere withthe subsequent service life of not only for the same road, but also for theobjects within its course. The paper presents a case study how by the usage ofmodern techniques for obtaining data is it possible to find a link confirming thecharacteristics of land on which the specific road projects are supposed to becarried out or were already carried out, concerning their requirements in highaccuracy in regards of location and also the stability and durability of theground and secondly correctly identify the structure of the road surface. Bothfactors play a significant role in determining a possible opportunity to perform(in a given place) the planned investment or later to affect its durability.Complementing the LIDAR – detailed information together with the Ground
Lidar and Ground Penetrating Radar Data... 113
Technical Sciences 20(2) 2017

Penetrating Radar (GPR) technique data, we are able to get a reliable image ofthe geological structures and road layers running through the site, whichallows, for example to choose correct location of future roads, or to indicateincorrect location of future structure.
Methods
Point cloud gathered with LiDAR gives information about the topographyof the terrain, what is also the most common reason to use scanning technol-ogy. Analysis of LIDAR signal, reflecting from various surfaces, allows us to domore. Special raw data processing algorithms are able to determine thephysical properties of these surfaces or their movement. When the surface iscovered with objects partially transparent for the laser beam (eg. vegetation orsnow) it can also gather information about their structure. The signal emittedduring the measurement is partially disturbed by the atmosphere – in connec-tion with the LIDAR data it also gives information on its characteristics.LIDAR has already found its place in optimizing the use of wind energy withfor example control system (built by engineers from Stuttgart) that measureswind speed and direction before it reaches the turbine blades (Optic.org. Thebusiness of photonics. http://optics.org/news/3/6/16).
The base for correct interpretation of the obtained measurement data is theclarity of the resulting material. The raw data without proper processingcannot meet its role, if chosen (depending on the usage) accuracy is poor – theobtained image clarity is also not satisfying. It is necessary to consider eachpoint obtained with LIDAR technology, so the capacity of data requiredequipment with high computing power. For example, in an area of about 100hectares are collected more than 4 million laser points (in *.xyz format), ofwhich nearly 2,5 million are points containing valuable information. Selectionof the suitable GRID resolution is also very important in the process ofinterpretation. Figure 1 shows one of developed mosaic of established GRIDwith resolution of 0.5 × 0.5 m with usage of the “Surfer” software. It enables todistinguish changes in topography, providing the potential risks of instabilityand incoherence of the ground (Fig. 2). “Surfer” allows to create grids of valuesused to produce maps of land surface, three-dimensional representation oftriplets (XYZ) type of data, which can be exported to several different formats(*.dxf, *.kmz, *.kml etc). It allows both creating simple maps of the baseline, aswell as more complex spatial maps of the surface, also vector maps, reliefshaded maps, map of single points, overlaid maps and others. The program hasa rich computing capabilities, enabling an automatic calculation of surfaceprojected data using XY plane, the curve surface, volumes and distance
Artur Plichta, Adam Piasecki114
Technical Sciences 20(2) 2017
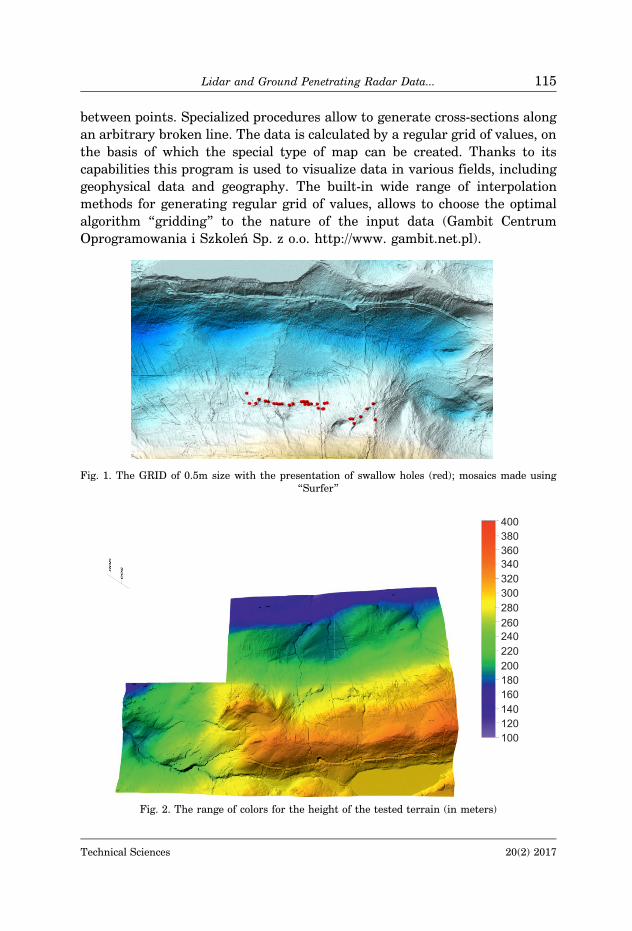
between points. Specialized procedures allow to generate cross-sections alongan arbitrary broken line. The data is calculated by a regular grid of values, onthe basis of which the special type of map can be created. Thanks to itscapabilities this program is used to visualize data in various fields, includinggeophysical data and geography. The built-in wide range of interpolationmethods for generating regular grid of values, allows to choose the optimalalgorithm “gridding” to the nature of the input data (Gambit CentrumOprogramowania i Szkoleń Sp. z o.o. http://www. gambit.net.pl).
Fig. 1. The GRID of 0.5m size with the presentation of swallow holes (red); mosaics made using“Surfer”
Fig. 2. The range of colors for the height of the tested terrain (in meters)
Lidar and Ground Penetrating Radar Data... 115
Technical Sciences 20(2) 2017

Visible to the naked eye, regular depressions in the ground can foretell thelocation of underground space, created or by the flow of water, or due togeological structures characterizing the ground as inconsistent. The confirma-tion of the assumptions can be supported by geophysical investigation of landusing three methods:
– Electrical Resistivity Tomography – ERT,– GPR method,– Seismic method.Based on data obtained from laser scanning, some methods of land survey
were selected to confirm suspicions of the content and carrying capacity of landfor road construction. Finding the most appropriate methodology is the basisfor all research, primarily to determine exactly what type of investigationsshould be taken into account for economic reasons, as well as external factors(accuracy, size of objects etc.). After an appropriate analysis, some of themethods can be eliminated in order to provide very accurate results withoutunexpected time investments.
During determining geotechnical conditions of foundations of linear objectssuch as roads and railways it is imperative to reach a compromise between theamount of field research and the accuracy of geophysical investigation. GPRtechnique is used for instance in continuous monitoring of the road surfacecondition or railway subgrade (Geopartner. http://www.geopartner.pl). Animportant advantage of geophysical survey is non-invasive cappability ofdetermining structures invisible to the eye, sometimes assisted with geologicalsurveys (i.e. trial pits, borehole drilling) confirming data obtained from fieldmeasurements. In case of linear objects related to public transport on-goingwork do not cause any disruption to traffic.
Data obtained with GPR give the ability to identify sub-surface structures,providing information about the uniformity of the structural layers andgeology. Proper identification of the layer types ensures quality of the assess-ment of objects being under investigation and underlain soils. GPR providescontinuous information about the type of surface structure, thicknesses oflayers, homogeneous sections and existing changes and anomalies (MASER,SCULLION 1991).
The principle of GPR is based on the generation of electromagnetic waveand sending it into tested ground, rock or material. This is accomplished bytransmitting antenna (Tx) that generates a signal at a given frequency(<20 ns). The wave passes through objects, where is refracted and reflected ofthe surface, but encountering objects, infrastructure or other heterogeneitiesthe wave is being diffused. Some of the energy carried by these waves istransmitted to greater and greater depths, while some of the energy is reflectedback towards the surface receiver (Rx) whenever a contrast in dielectric
Artur Plichta, Adam Piasecki116
Technical Sciences 20(2) 2017

properties is encountered. Both antennas are connected to the central unit,which manages the generation of wave and recording its reflected digitalsignal. The penetration depth achievable depends on the nature of material(especially its electrical conductivity), the location of the water table and on thefrequency of transmitted wave. Researches at Lund University in Sweden byULRIKSEN (1980, 1982, 1983), BJELM, ULRIKSEN (1980) and BJELM (1980)investigated such factors as the effect of frequency of the transmitted wave, thetransmission velocity and the technique used for moving the antenna over theground on the measured results. This work also showed that, not only thematerial layer thickness could be estimated accurately but also some informa-tion about the material situated beneath can be obtained. The receivermeasures the variation in the strength of the reflected signals with time(Figs. 3, 4). The resulting profile is called a “scan” and is a one-dimensionalrepresentation of the subsurface beneath the antenna. The example is visibleon Figures 5 and 6 (RSK Geophysics Mapping the unscene. http://www.envi-ronmental-geophysics.co.uk).
Fig. 3. GPR PrinciplesSource: RSK Geophysics Mapping the unscene. http://www.environmental-geophysics.co.uk.
Fig. 4. An example of high frequency (1.5 GHz) radar data collected over a concrete slabSource: RSK Geophysics Mapping the unscene. http://www.environmental-geophysics.co.uk.
Lidar and Ground Penetrating Radar Data... 117
Technical Sciences 20(2) 2017
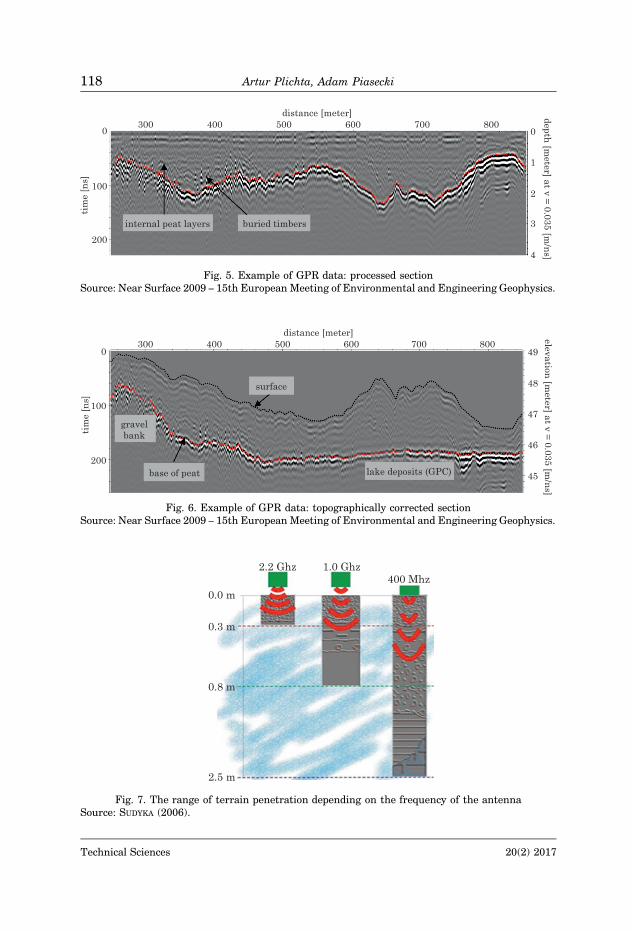
Fig. 5. Example of GPR data: processed sectionSource: Near Surface 2009 – 15th European Meeting of Environmental and Engineering Geophysics.
Fig. 6. Example of GPR data: topographically corrected sectionSource: Near Surface 2009 – 15th European Meeting of Environmental and Engineering Geophysics.
Fig. 7. The range of terrain penetration depending on the frequency of the antennaSource: SUDYKA (2006).
Artur Plichta, Adam Piasecki118
Technical Sciences 20(2) 2017

The accuracy and range of a GPR method depends primarily on thefrequency of the emitted electromagnetic signal that ranges from 10 MHz toseveral GHz. This frequency range causes that the GPR method is providedfrom a few centimeters to tens of meters (Fig. 7). While the resolution, whichmeans the expected vertical accuracy tests varies from a few millimeters toa few meters. Resolution and coverage dependency is inversely proportional,which means that the higher the frequency of the generated wave is the betterresolution is expected, but the range is decreasing (GeoSpectrum. Nowoczesnetechniki badawcze. http://www.geospectrum.pl/).
Tests
As part of the research the chosen section of road with a length of 3600 m,running along the geologically diverse area, located on the borders of NorthernIreland was analyzed (Fig. 8).
Fig. 8. Analyzed section of the road, cut out from a point cloud using Surfer application
Driving and utility parameters of described road section have significantlydegraded. Clearly visible are the structural damages in the form of sinks andsurface subsidence, as well as the linear and transverse cracking. In thepresented case the proposal provides analysis of the road subsurface intendedfor modernization, as well as areas in its surroundings, where variety ofstructures could be built in the future. An investigation has been undertakento explain the current situation, with the assumption that responsible for the
Lidar and Ground Penetrating Radar Data... 119
Technical Sciences 20(2) 2017

road surface damage are geological structures running under the road, as wellas inadequate technical parameters of the road layers, including their layoutand thickness. The study was based on data obtained from laser scanning,supplemented by a GPR survey of the investigated road section.
As the first stage of work LIDAR data was used in order to createthree-dimensional terrain model, which allowed the insight into the shape ofthe surface of the considered section. At a later stage LIDAR data wasprocessed using the “Surfer” software. LIDAR data was used to assign analtitude for each one of thousands of the analyzed with GPR method points.Prior to survey appropriate density of readings should be chosen as well as theinterval between signals sent by the antenna into analyzed area. It was agreedthat for analyzed section the required resolution should be equal to 10 mm,what meant that study of the considered area in a straight line would beinvestigated at that given density. Antenna was placed under the vehicle(Toyota HiLux 4×4) and set up for simultaneous transmission and collection ofreflected signal. The vehicle has been appropriately modified so that at a speedof (not exceeding) 30 km/h the analysis could be carried out smoothly, withoutrequirement for stopping on the road and blocking any of ongoing traffic. Eachof the antennas used for the survey was part of Swedish MAL3 X3MTM
SYSTEM, which connected with the rear wheel of the vehicle, after propercalibration, allowed to run a survey with a given density (Figs. 9, 10). The X3Mis an integrated radar control unit, fitted directly on a shielded antenna andpowered externally. No antenna cable was required since the control unit was
Fig. 9. 400 MHz MAL3 X3MTM SYSTEM antenna used during the measurement
Artur Plichta, Adam Piasecki120
Technical Sciences 20(2) 2017

Fig. 10. Custom modified vehicle allowing GPR measurements without stopping road traffic atanalyzed road sections
mounted directly on top of the MAL3 shielded antenna (in our research up to1.5 GHz). It communicated directly with the XV11 GPR Monitor that wasrunning GroundVision2 acquisitioning software (Fig. 11). MAL3 allows togather information from a range of depths (base and sub-base thicknesses) forthe entire road construction, for example pavement, supportive layers andbase layers, including also evaluations of the asphalt thickness (MAL3. WorldLeading Ground Radar Solutions. http://www.malagpr.com.au).
Fig. 11. XV11 GPR Monitor with results of the measurement
Lidar and Ground Penetrating Radar Data... 121
Technical Sciences 20(2) 2017
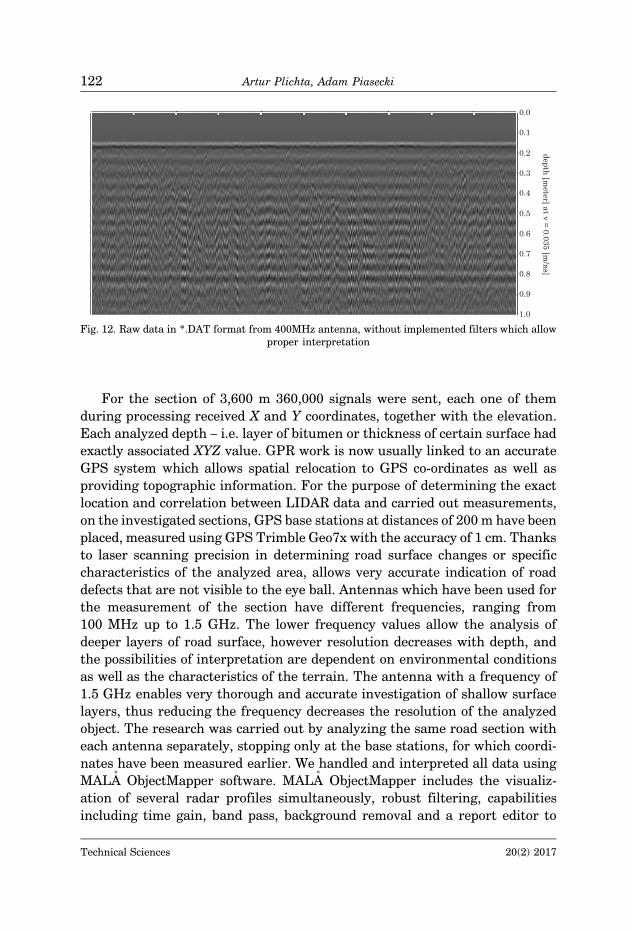
Fig. 12. Raw data in *.DAT format from 400MHz antenna, without implemented filters which allowproper interpretation
For the section of 3,600 m 360,000 signals were sent, each one of themduring processing received X and Y coordinates, together with the elevation.Each analyzed depth – i.e. layer of bitumen or thickness of certain surface hadexactly associated XYZ value. GPR work is now usually linked to an accurateGPS system which allows spatial relocation to GPS co-ordinates as well asproviding topographic information. For the purpose of determining the exactlocation and correlation between LIDAR data and carried out measurements,on the investigated sections, GPS base stations at distances of 200 m have beenplaced, measured using GPS Trimble Geo7x with the accuracy of 1 cm. Thanksto laser scanning precision in determining road surface changes or specificcharacteristics of the analyzed area, allows very accurate indication of roaddefects that are not visible to the eye ball. Antennas which have been used forthe measurement of the section have different frequencies, ranging from100 MHz up to 1.5 GHz. The lower frequency values allow the analysis ofdeeper layers of road surface, however resolution decreases with depth, andthe possibilities of interpretation are dependent on environmental conditionsas well as the characteristics of the terrain. The antenna with a frequency of1.5 GHz enables very thorough and accurate investigation of shallow surfacelayers, thus reducing the frequency decreases the resolution of the analyzedobject. The research was carried out by analyzing the same road section witheach antenna separately, stopping only at the base stations, for which coordi-nates have been measured earlier. We handled and interpreted all data usingMALA ObjectMapper software. MALA ObjectMapper includes the visualiz-ation of several radar profiles simultaneously, robust filtering, capabilitiesincluding time gain, band pass, background removal and a report editor to
Artur Plichta, Adam Piasecki122
Technical Sciences 20(2) 2017

mark and visualize objects on a map. Several different types of markers can bedefined to illustrate the position of pipes, single objects etc. Built in datacollection management in the MALA XV11 GPR Monitor that was used in theexperiment allowed to select the base stations, which were presented in theform of white squares on the upper part of Figure 7, that represented the rawdata from survey with 400 MHz antenna. Afterwards (in ObjectMappersoftware) it was automatically adjusted to the baseline and thus aligned forprofile to profile target picking.
Results
Before undertaking the process of interpretation the appropriate filtersshould be applied, which affect the “readability” of data obtained from the fieldof measurements (IBDiM 2010). A significant factor is the experience of personresponsible for work with the data, lack of knowledge of the rules related toreflecting and refraction of waves could have a negative impact on theinterpretation results. It is worth remembering that the value of the analyzeddata becomes increasingly important in places where the location due toconstruction defects, or a complicated order of geological layers is an extremelyimportant factor in determining the further decision-making processes. Theinterpretation process was extremely time-consuming, any breakdown in theimage of such high detailed data is linked with the existing situation in thefield. The interpretation process is unfortunately not automated – all kinds ofchanges in the road surface are “outlined” by the interpreter using the mouse.Of course, each of the layers is peeled and marked individually, colors areassigned for easier interpretation of the results, thanks to the perfect matchingfilters the image becomes clear (Fig. 13).
Interpreted data have been converted to graphs created in spreadsheetsusing written macros, appropriately modified in a way that fully illustrates thedeveloped interpretation. The determining factor in this case was the appropri-ate collection and tabulation alignment of measurement figures, so that theresult of study is clear, and the interpreter has the ability to see requested data(Fig. 14). It has become apparent that a great deal of information on thesub-peat soils can be determined from the GPR data. It is possible to determinethe type of sub-peat deposit and depositional history of an area from theassessment of the GPR response. Different reflection characteristics fromwithin the peat layers can also provide information on the origin and composi-tion of the peat layers.
Lidar and Ground Penetrating Radar Data... 123
Technical Sciences 20(2) 2017

Fig. 13. Data from 400 MHz antenna presenting a 80 m section of road, after applying filters andprocesses of relocation, with sketched interpretation of Peat Thickness
Artur Plichta, Adam Piasecki124
Technical Sciences 20(2) 2017

Sam
ple
pave
men
tco
nst
ruct
ion
sum
mar
yta
ble
Ch
ain
ager
Coo
rdin
ates
Bit
umin
ous
mat
eria
lSu
bbas
em
ater
ial
Pea
tsu
bgra
deSe
ctio
n
min
.m
axav
g.m
in.
max
avg.
min
.m
axav
g.St
art
(m)
end
(m)
east
ing
nor
thin
gde
pth
dept
hde
pth
dept
hde
pth
dept
hth
ickn
ess
thic
knes
sth
ickn
ess
[m]
[m]
[m]
[m]
[m]
[m]
[m]
[m]
[m]
012
512
3456
3708
100.
107
0.22
40.
167
0.39
80.
998
0.68
90.
162.
061.
27Se
ctio
nA
125
217.
512
3457
3708
110.
111
0.22
60.
198
0.31
30.
521
0.40
1S
ecti
onB
217.
528
112
3458
3708
120.
084
0.17
10.
133
0.31
30.
474
0.39
5–
––
Sect
ion
B
281
467
1234
5937
0813
0.05
60.
137
0.09
50.
276
0.49
90.
387
Sec
tion
B
467
600
1234
6037
0814
0.05
80.
165
0.08
40.
272
0.55
40.
346
Sec
tion
B
600
644.
512
3461
3708
150.
061
0.27
70.
177
0.36
31.
718
0.59
4S
ecti
onC
644.
587
512
3462
3708
160.
039
0.18
40.
096
0.32
80.
633
0.50
50
0.74
0.4
Sec
tion
C
875
1024
.512
3463
3708
170.
108
9.19
70.
141
0.42
50.
722
0.56
90.
130.
830.
42Se
ctio
nD
1024
.511
0012
3464
3708
180.
098
0.19
20.
131
0.52
20.
831
0.67
70.
311.
721.
02Se
ctio
nE
Fig
.14
.Sp
read
shee
tvi
eww
ith
evol
vin
gda
ta
Lidar and Ground Penetrating Radar Data... 125
Technical Sciences 20(2) 2017

Fig
.15
.G
raph
crea
ted
wit
hex
cel
mac
ros
base
don
data
obta
ined
from
the
mea
sure
men
tan
din
terp
reta
tion
proc
ess
for
con
side
red
sect
ion
Artur Plichta, Adam Piasecki126
Technical Sciences 20(2) 2017

Above listed part of final report of surveyed section presenting part of roadwith selected layers of bitumen (Fig. 15) is also enclosed the aerial view of roadwhere investigated was peat thickness with cross-section for the same area(Figs. 16, 17) – elevation data taken form LIDAR.
Fig. 16. Aerial imagery with overlaid layer of Peat Thickness created in “Surfer” based on GPRInvestigation data
Fig. 17. Cross-section of considered area
Lidar and Ground Penetrating Radar Data... 127
Technical Sciences 20(2) 2017

Conclusion
Radar technology presented and demonstrated in this article, mainlybecause of its effectiveness and quality of obtained data, makes it one of themain methods of assessing the structural condition of road surfaces now and intime of near future – especially as currently the determinant of use of specifictechnologies is the cost factor. Thus, searching for cost-effective and efficienttechnologies for renovation of the existing road surface by GPR methods seemsto be indispensable. The results of research and analysis are based onachievable results, enabling a thorough and honest assessment not only ofstructural, but also geological layers. GPR measurements should be widelyused not only as a complementary element of developed projects, but most ofall from the point of i.e. confirmation of structure of newly made roads prior totheir release to public. An important advantage of radar systems is theireffectiveness, performance and relatively low cost of the research. No interfer-ence with the road surface and speed of the measurements cause that radartechniques to be used in a number of so-called measuring circuits, allowingaccurate identification of the surface structure also in cross-sections. Inaddition to the standard information about layer thicknesses it is also possibleto assess other parameters of construction such as i.e. layers connection statusand their homogeneity. Main factor influencing negatively in the consideredsolution is the fact that despite of the advanced technology and high quality ofthe data, problem of automatic processing and interpretation of received datais not yet fully solved. Still, the vast majority of processing and interpretationof the data must be controlled by an experienced engineer. Nevertheless, it ishoped that this new technology will gain a proper place in the area ofengineering applications.
References
BJELM L. 1980. Geological interpretation with subsurface interface radar in peat lands. 6th Interna-tional Congress, Duluth, Minnesota.
BJELM L., ULRIKSEN P. 1980. System for peatland survey by radar. Final Stage. Faculty of Engineering,Engineering Geology, p. 104
Council Directive 92/43/EEC on the conservation of natural habitats and of wild fauna and flora, 21May 1992.
DANIELS D.J. 2004. Ground-Penetrating Radar. The Institute of Electrical Engineers London.EN 1997-1: 2004. European standard “Eurocode 7 – Geotechnical design”.Gambit Centrum Oprogramowania i Szkoleń Sp. z o.o. http://www. gambit.net.pl.Geopartner. http://www.geopartner.pl/.GeoSpectrum. Nowoczesne techniki badawcze. http://www.geospectrum.pl/.HOWARD B., PARKER CH. 2009. LiDAR – So Much More Than A Pretty Picture. An Introduction to the
Analytical Capabilities of Topographic and Hydrographic LiDAR Survey Data. Sarasota.
Artur Plichta, Adam Piasecki128
Technical Sciences 20(2) 2017

JERMOŁOWICZ P. 2013. Wykonywanie robót ziemnych na gruntach słabych i wysadzinowych. Materiałyszkoleniowe. Pokrzywna.
MALA. World Leading Ground Radar Solutions. http://www.malagpr.com.au/.MASER K., SCULLION T. 1991. Automated detection of pavement layer thicknesses and subsurface
moisture using ground penetrating radar. Transport Research Board.Ocena geotechniczna podłoża gruntowego techniką radarową ze szczególnym uwzględnieniem stanu
hydrologicznego podłoża gruntowego. 2010. Instytut Badawczy Dróg i Mostów, Zakład Diagnos-tyki Nawierzchni, Warszawa.
Optic.org. The business of photonics. http://optics.org/news/3/6/16.PN-EN 1997-1:2008. Building ground – Direct foundation structures – Static calculations and design.PNS-02205: 1998. Road car – Earthworks – Requirements and test methods.Regulation of the Minister of Transport and Maritime Economy on the determination of the
geotechnical conditions of foundation of buildings, 25 April 2012, Journal of Laws 2012.463.RockWare. Earth Science and GIS Software. http://www.rockware.com.RSK Geophysics Mapping the unscene. http://www.environmental-geophysics.co.uk/.SANDERS J.A., WILKERSON T.D., SCHWEMMER G.K., MILLER D.O., GUERRA D., MOODY S.E. 2000.
Comparison of Two Lidar Methods of Wind Measurement by Cloud Tracking. http://digitalcom-mons.usu.edu/cgi/viewcontent.cgi?article=1277&context=spacegrant.
SEREN S., HINTERLEITNER A., LOCKER K., MELICHAR P., NEUBAUER W. 2009. High Definition GPRSurveys at the Roman Town Flavia Solva. European Association of Geoscientists and Engineers,Near Surface 2009 – 15th European Meeting of Environmental and Engineering Geophysics.Dublin, Ireland.
SISKOM. Stowarzyszenie Integracji Stołecznej Komunikacji. http://www.siskom.waw.pl/Spaceimaging.com. Directiv Authorized Dealer. http://www.spaceimaging.com/SUDYKA J. 2006. Technika radarowa w drogownictwie – nowa jakość w ocenie konstrukcji nawierzchni.
Polski Kongres Drogowy.ULRIKSEN P 1980. Investigation of peat thickness with Radar. 6th International Peat Congress,
Professional Paper of the Lund Institute of Technology, Department of Engineering Geology,Lund, Sweden.
ULRIKSEN P. 1982. Application of impulse radar to civil engineering. PhD Thesis, Lund University ofTechnology.
ULRIKSEN P. 1983. Some applications of impulse radar. Geoexploration, 21: 289–289.
Lidar and Ground Penetrating Radar Data... 129
Technical Sciences 20(2) 2017