libraries respond to mobile ubiquity: open web and ebsco discovery service usage trends 2012-2013
TRANSCRIPT
Libraries Respond to Mobile Ubiquity:
Open Web and EBSCO Discovery Service Mobile Usage Trends
Megan Hurst
Sr. Product Manager
EBSCO Discovery Service
Charleston Conference, November 2013
Mobile ubiquity
How many devices
do you have with you
right now?
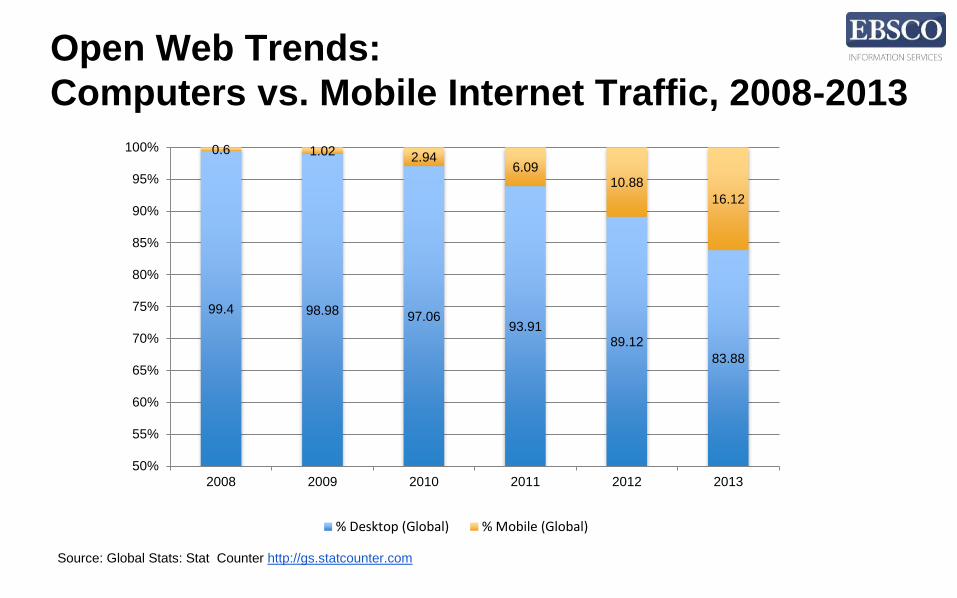
Open Web Trends:
Computers vs. Mobile Internet Traffic, 2008-2013
Source: Global Stats: Stat Counter http://gs.statcounter.com
99.4 98.98 97.0693.91
89.12
83.88
0.6 1.02 2.946.09
10.88
16.12
50%
55%
60%
65%
70%
75%
80%
85%
90%
95%
100%
2008 2009 2010 2011 2012 2013
% Desktop (Global) % Mobile (Global)
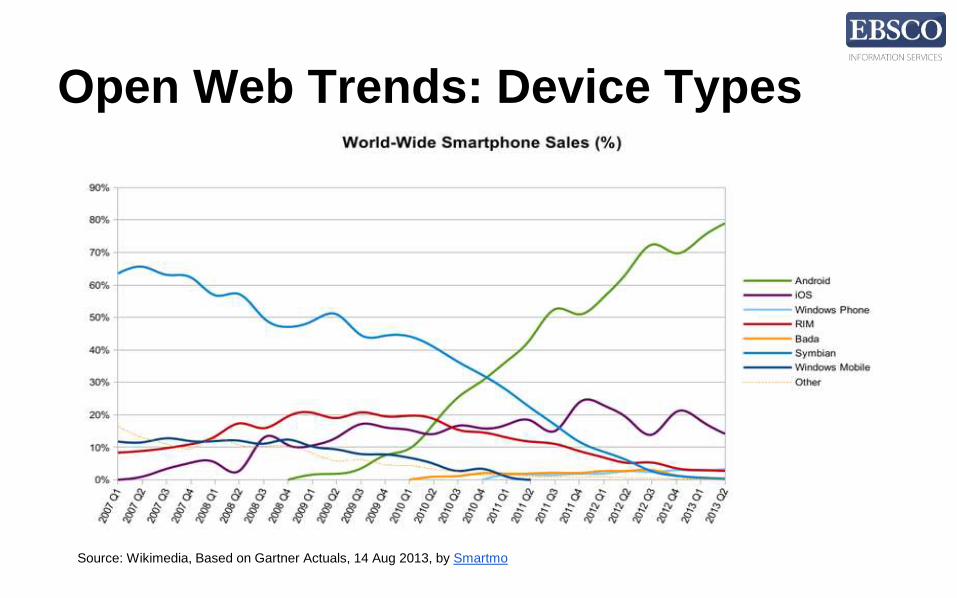
Open Web Trends: Device Types
Source: Wikimedia, Based on Gartner Actuals, 14 Aug 2013, by Smartmo
Open Web Trends: Device Types
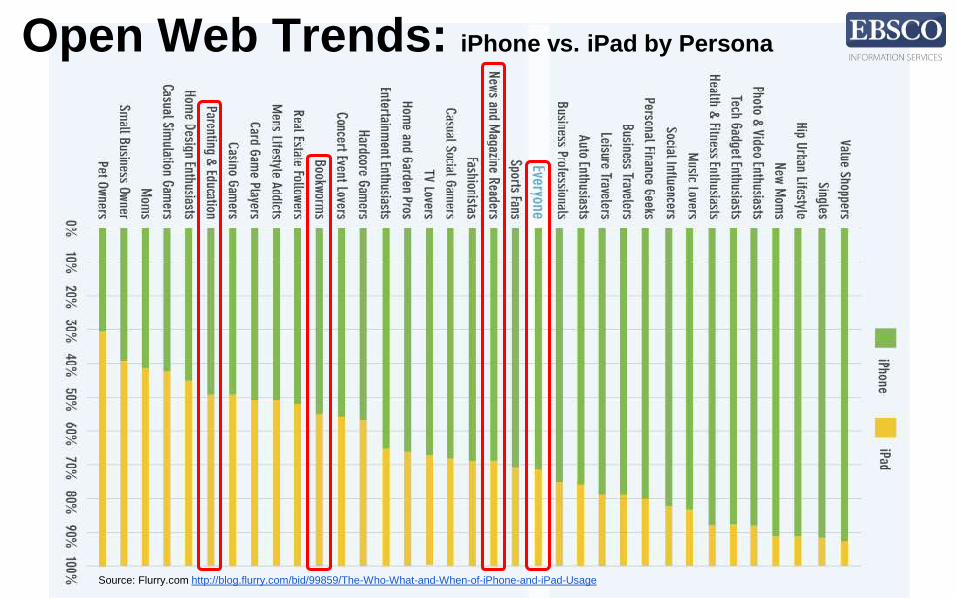
Source: Flurry.com http://blog.flurry.com/bid/99859/The-Who-What-and-When-of-iPhone-and-iPad-Usage
Open Web Trends: iPhone vs. iPad by Persona
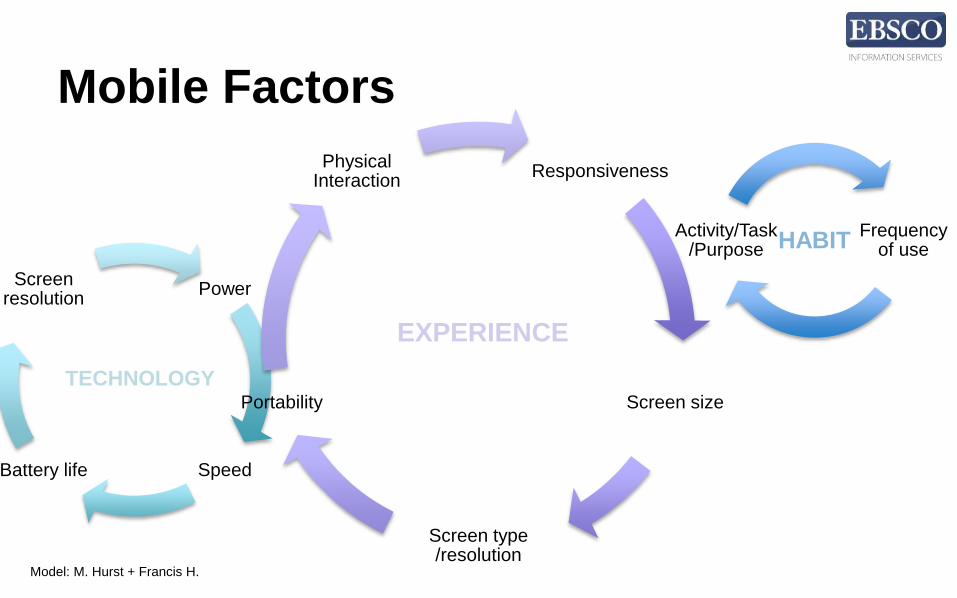
Mobile Factors
Power
SpeedBattery life
Screen resolution
Frequency of use
Activity/Task/Purpose
Responsiveness
Screen size
Screen type /resolution
Portability
Physical Interaction
HABIT
EXPERIENCE
TECHNOLOGY
Model: M. Hurst + Francis H.
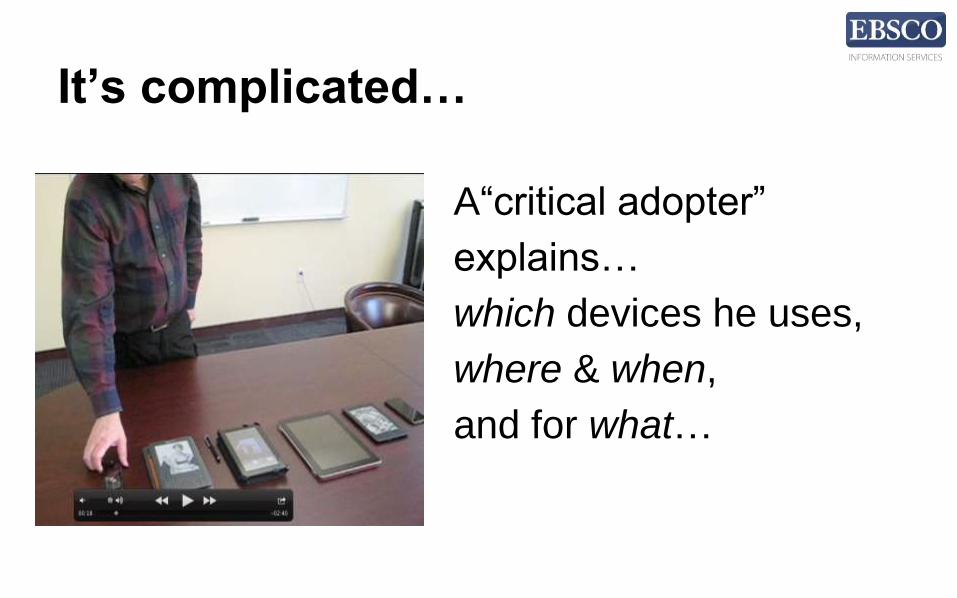
It’s complicated…
A“critical adopter”
explains…
which devices he uses,
where & when,
and for what…
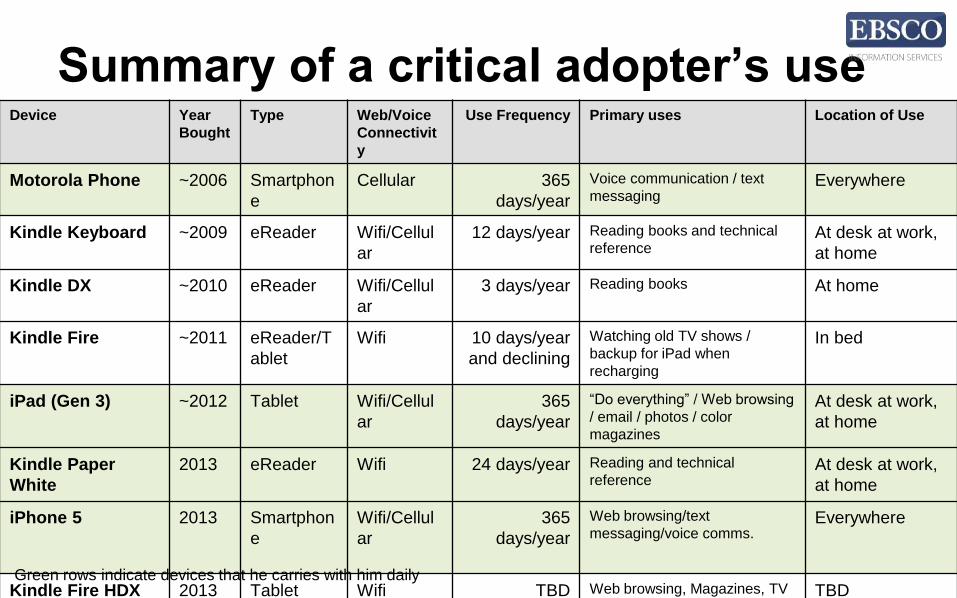
Summary of a critical adopter’s useDevice Year
Bought
Type Web/Voice
Connectivit
y
Use Frequency Primary uses Location of Use
Motorola Phone ~2006 Smartphon
e
Cellular 365
days/year
Voice communication / text
messagingEverywhere
Kindle Keyboard ~2009 eReader Wifi/Cellul
ar
12 days/year Reading books and technical
referenceAt desk at work,
at home
Kindle DX ~2010 eReader Wifi/Cellul
ar
3 days/year Reading books At home
Kindle Fire ~2011 eReader/T
ablet
Wifi 10 days/year
and declining
Watching old TV shows /
backup for iPad when
recharging
In bed
iPad (Gen 3) ~2012 Tablet Wifi/Cellul
ar
365
days/year
“Do everything” / Web browsing
/ email / photos / color
magazines
At desk at work,
at home
Kindle Paper
White
2013 eReader Wifi 24 days/year Reading and technical
referenceAt desk at work,
at home
iPhone 5 2013 Smartphon
e
Wifi/Cellul
ar
365
days/year
Web browsing/text
messaging/voice comms.Everywhere
Kindle Fire HDX 2013 Tablet Wifi TBD Web browsing, Magazines, TV
Shows, TBDTBD
Green rows indicate devices that he carries with him daily

What does all this mean
for libraries?
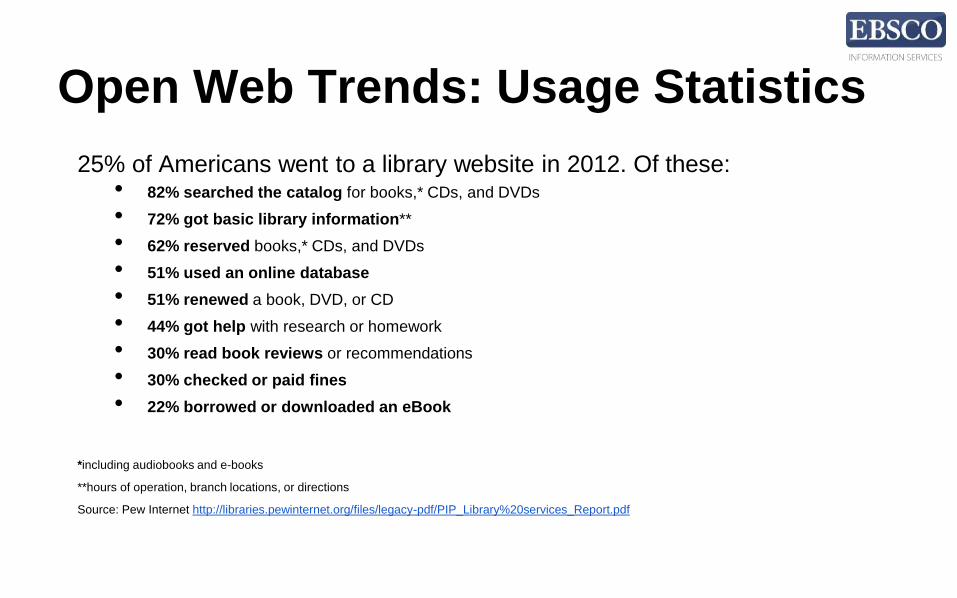
Open Web Trends: Usage Statistics
25% of Americans went to a library website in 2012. Of these:• 82% searched the catalog for books,* CDs, and DVDs
• 72% got basic library information**
• 62% reserved books,* CDs, and DVDs
• 51% used an online database
• 51% renewed a book, DVD, or CD
• 44% got help with research or homework
• 30% read book reviews or recommendations
• 30% checked or paid fines
• 22% borrowed or downloaded an eBook
*including audiobooks and e-books
**hours of operation, branch locations, or directions
Source: Pew Internet http://libraries.pewinternet.org/files/legacy-pdf/PIP_Library%20services_Report.pdf
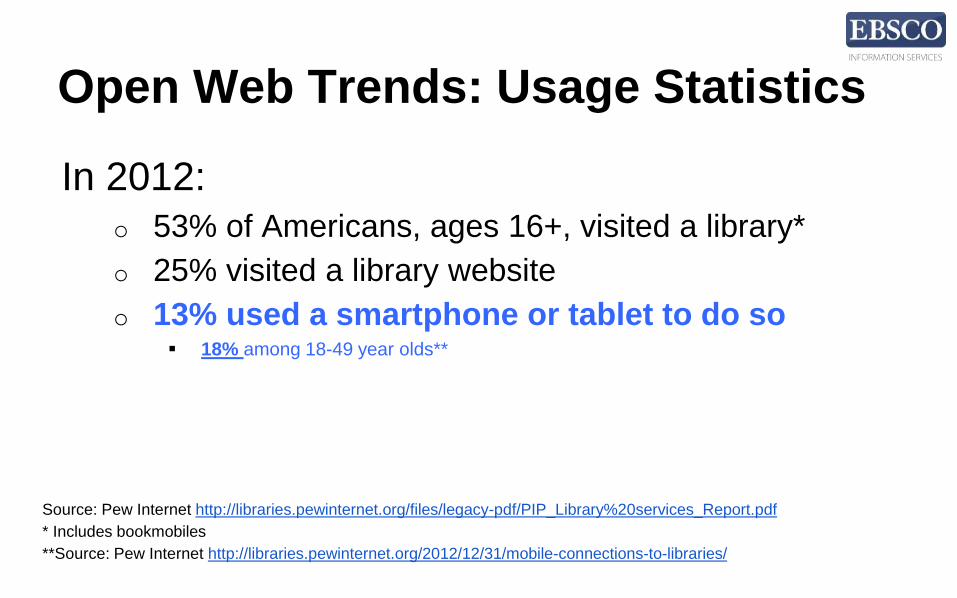
Open Web Trends: Usage Statistics
In 2012:o 53% of Americans, ages 16+, visited a library*
o 25% visited a library website
o 13% used a smartphone or tablet to do so 18% among 18-49 year olds**
Source: Pew Internet http://libraries.pewinternet.org/files/legacy-pdf/PIP_Library%20services_Report.pdf
* Includes bookmobiles
**Source: Pew Internet http://libraries.pewinternet.org/2012/12/31/mobile-connections-to-libraries/
EBSCO Discovery Service
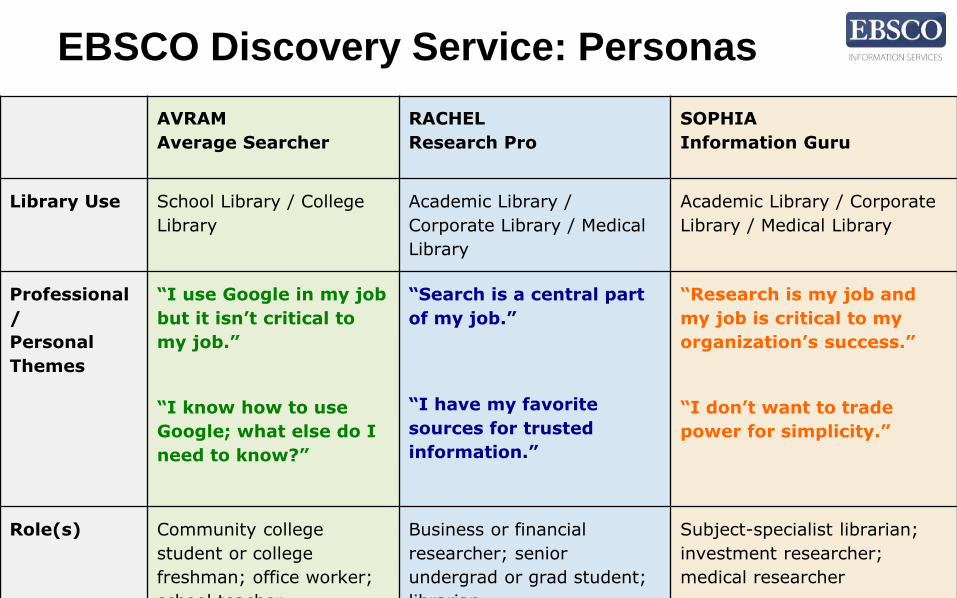
EBSCO Discovery Service: Personas
AVRAM
Average Searcher
RACHEL
Research Pro
SOPHIA
Information Guru
Library Use School Library / College
Library
Academic Library /
Corporate Library / Medical
Library
Academic Library / Corporate
Library / Medical Library
Professional
/
Personal
Themes
“I use Google in my job
but it isn’t critical to
my job.”
“I know how to use
Google; what else do I
need to know?”
“Search is a central part
of my job.”
“I have my favorite
sources for trusted
information.”
“Research is my job and
my job is critical to my
organization’s success.”
“I don’t want to trade
power for simplicity.”
Role(s) Community college
student or college
freshman; office worker;
school teacher
Business or financial
researcher; senior
undergrad or grad student;
librarian
Subject-specialist librarian;
investment researcher;
medical researcher
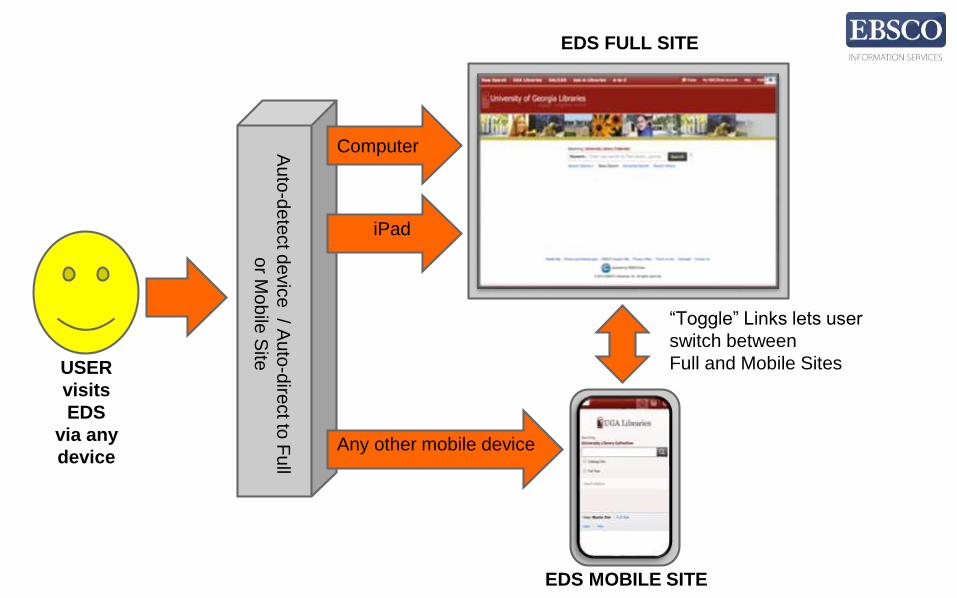
Computer
EBSCO Discovery
Service (EDS)
FULL SITE
EDS MOBILE SITE
iPad
Any other mobile device
Au
to-d
ete
ct d
evic
e / A
uto
-dire
ctto
Fu
ll
or M
ob
ile S
ite
“Toggle” Links lets user
switch between
Full and Mobile Sites
EDS FULL SITE
USER
visits
EDS
via any
device
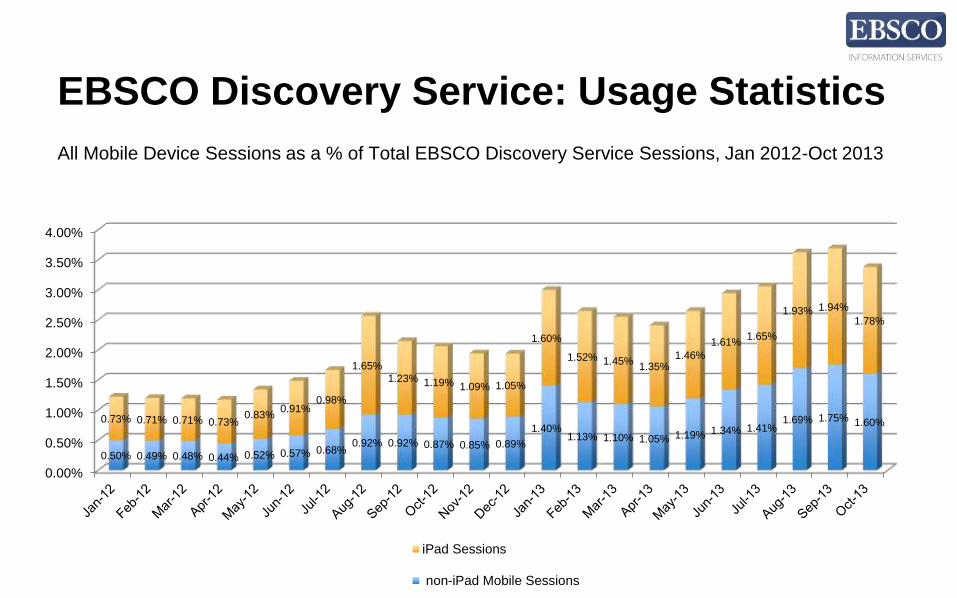
EBSCO Discovery Service: Usage Statistics
All Mobile Device Sessions as a % of Total EBSCO Discovery Service Sessions, Jan 2012-Oct 2013
0.00%
0.50%
1.00%
1.50%
2.00%
2.50%
3.00%
3.50%
4.00%
0.50% 0.49% 0.48% 0.44% 0.52% 0.57% 0.68%0.92% 0.92% 0.87% 0.85% 0.89%
1.40%1.13% 1.10% 1.05% 1.19% 1.34% 1.41%
1.69% 1.75% 1.60%0.73% 0.71% 0.71% 0.73%0.83%
0.91%0.98%
1.65%
1.23% 1.19% 1.09% 1.05%
1.60%
1.52% 1.45%1.35%
1.46%
1.61%1.65%
1.93% 1.94%
1.78%
iPad Sessions
non-iPad Mobile Sessions
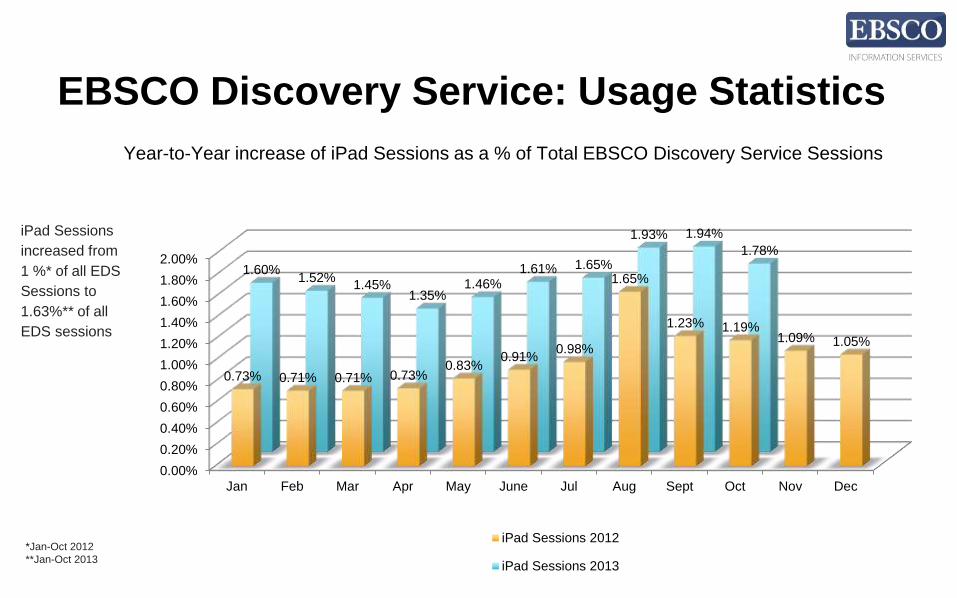
EBSCO Discovery Service: Usage Statistics
iPad Sessions
increased from
1 %* of all EDS
Sessions to
1.63%** of all
EDS sessions
0.00%
0.20%
0.40%
0.60%
0.80%
1.00%
1.20%
1.40%
1.60%
1.80%
2.00%
Jan Feb Mar Apr May June Jul Aug Sept Oct Nov Dec
0.73% 0.71% 0.71% 0.73%0.83%
0.91%0.98%
1.65%
1.23% 1.19%1.09% 1.05%
1.60%1.52%
1.45%1.35%
1.46%1.61% 1.65%
1.93% 1.94%
1.78%
iPad Sessions 2012
iPad Sessions 2013
Year-to-Year increase of iPad Sessions as a % of Total EBSCO Discovery Service Sessions
*Jan-Oct 2012
**Jan-Oct 2013
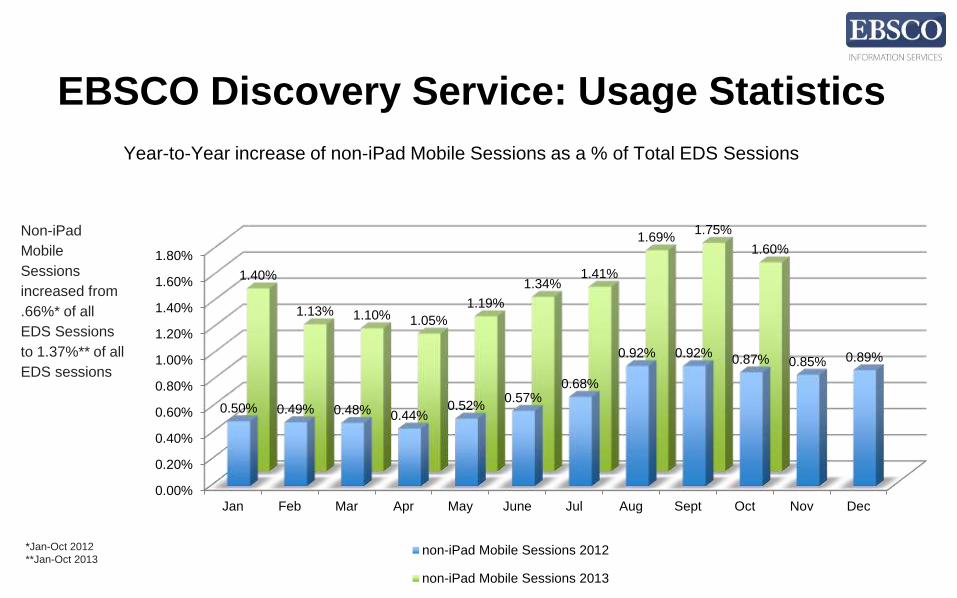
EBSCO Discovery Service: Usage Statistics
Non-iPad
Mobile
Sessions
increased from
.66%* of all
EDS Sessions
to 1.37%** of all
EDS sessions
Year-to-Year increase of non-iPad Mobile Sessions as a % of Total EDS Sessions
*Jan-Oct 2012
**Jan-Oct 2013
0.00%
0.20%
0.40%
0.60%
0.80%
1.00%
1.20%
1.40%
1.60%
1.80%
Jan Feb Mar Apr May June Jul Aug Sept Oct Nov Dec
0.50% 0.49% 0.48% 0.44%0.52%
0.57%0.68%
0.92% 0.92%0.87% 0.85% 0.89%
1.40%
1.13% 1.10% 1.05%
1.19%
1.34%1.41%
1.69%1.75%
1.60%
non-iPad Mobile Sessions 2012
non-iPad Mobile Sessions 2013
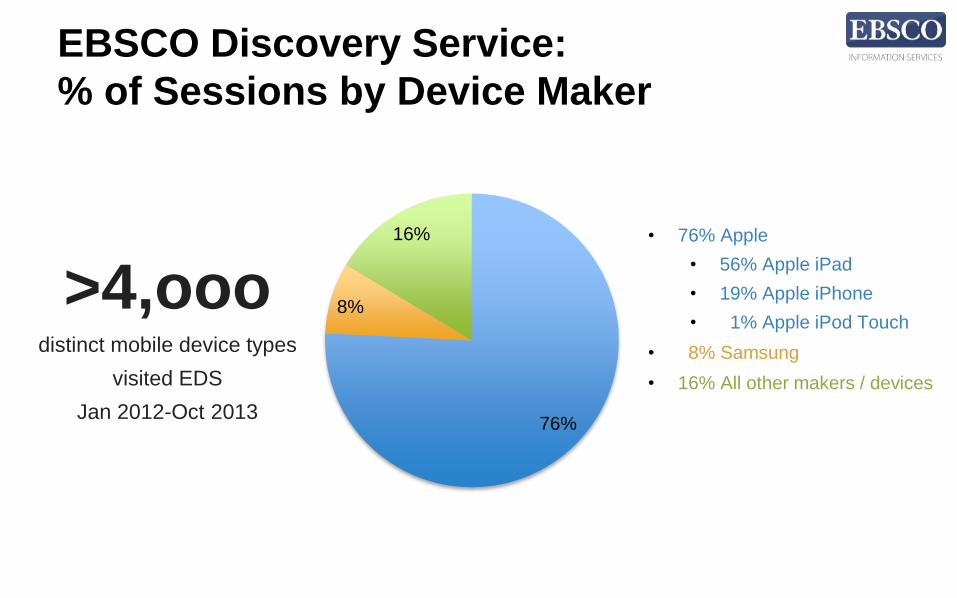
EBSCO Discovery Service:
% of Sessions by Device Maker
>4,ooodistinct mobile device types
visited EDS
Jan 2012-Oct 2013
• 76% Apple
• 56% Apple iPad
• 19% Apple iPhone
• 1% Apple iPod Touch
• 8% Samsung
• 16% All other makers / devices
76%
8%
16%
Questions?
Discussion!
Megan Hurst
Sr. Product Manager, EBSCO Discovery Service
EBSCO Information Services
@MHzUX