libby, libby and short - sunar budi · 4. explain how an activity-based costing system works for...
TRANSCRIPT

4 -1
Activity-Based
Costing
CHAPTER

4 -2
1. Discuss the importance of unit costs.
2. Describe functional-based costing
approaches.
3. Explain why functional-based costing
approaches may produce distorted costs.
4. Explain how an activity-based costing system
works for product costing.
Objectives
After studying this
chapter, you should
be able to:
continued
4 -3
5. Provide a detailed description of how
activities can be grouped into homogeneous
sets to reduce the number of activity rates.
6. Describe activity-based customer and
supplier costing.
Objectives

4 -4
Unit cost is the total cost
associated with the units
produced divided by the
number of units produced.
Inventory valuation
Income determination
Providing input to a
variety of decisions
such as pricing, make or
buy, and accept or reject
special orders
Unit cost is used for--
4 -5
Product cost is often defined as the
sum of direct materials, direct labor,
and manufacturing overhead. This
definition is required for external
financial reporting.
4 -6
Cost measurement consists of
determining the dollar amounts of
direct materials, direct labor, and
overhead used in production.

4 -7
The process of associating
the costs, once measured,
with the units produced is
called cost assignment.
4 -8
Two possible measurement systems are
actual costing and normal costing.
Measurement Systems
Actual costing assigns the actual costs
of direct materials, direct labor, and
overhead to products.
Normal costing assigns the actual
costs of direct materials and direct
labor to products; however, overhead
cots are assigned to products using
predetermined rates.

4 -9
Measurement Systems
A predetermined
overhead rate is a rate
based on estimated data.
Budgeted (estimated) cost
Estimated activity usage

4 -10
Examples of Unit-Level Drivers
Units produced
Direct labor hours
Direct labor dollars
Machine-hours
Direct material dollars

4 -11
Units
(of
driver)
Time
Theoretical
Practical
Normal
Expected actual

4 -12
Functional-Based Costing: Plantwide Rate
Overhead Costs
Assign Costs
Plantwide Pool
Assign Costs
Products
Direct Tracing
Stage One: Pool Formation
Unit-Level Driver
Stage Two: Costs Assigned

4 -13
Belring, Inc.
Belring, Inc. produces two telephones: a cordless and a regular model. The company has the following actual and budgeted data:
.
Budgeted overhead $360,000
Expected activity (DLH) 100,000
Actual activity (DLH) 100,000
Actual overhead $380,000

4 -14
Predetermined Overhead Rate =
Belring, Inc.
Budgeted (estimated) cost
Estimated activity usage
Predetermined Overhead Rate =
$360,000
100,000 DLH
Predetermined Overhead Rate = $3.60 per DLH

4 -15
The total overhead assigned
to actual production is
called applied overhead.
Applied
overhead=
Overhead rate
x
Actual activity
output

4 -16
Belring, Inc.
Applied
overhead= Overhead rate x Actual activity output
= $3.60 x 100,000 DLH
= $360,000

4 -17
Cordless Regular
Prime costs $ 78,000 $ 738,000
Overhead costs:
$3.60 x 10,000 36,000 ---
$3.60 x 90,000 --- 324,000
Total manufacturing costs $114,000 $1,062,000
Units produced 10,000 100,000
Unit cost $ 11.40 $ 10.62
Belring, Inc.
Per-Unit Cost
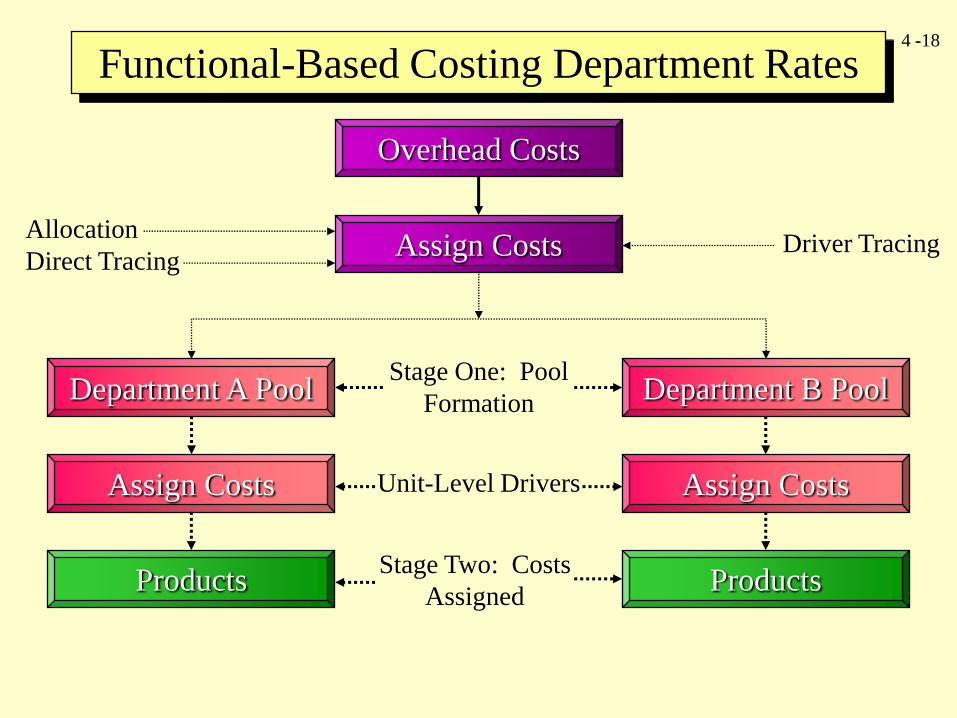
4 -18
Overhead Costs
Assign Costs
Assign Costs Assign Costs
Products Products
Stage One: Pool
Formation
Unit-Level Drivers
Stage Two: Costs
Assigned
Functional-Based Costing Department Rates
Department A Pool Department B Pool
Allocation
Direct TracingDriver Tracing

4 -19
Budgeted overhead $252,000 $108,000
Departmental Data
Belring, Inc.
Fabrication Assembly
Expected and actual usage (dlh):
Cordless 7,000 3,000
Regular 13,000 77,000
20,000 80,000
Expected and actual usage (mh.):
Cordless 4,000 1,000
Regular 36,000 9,000
40,000 10,000

4 -20
Belring, Inc.
Applied
overhead= ($6.30 x actual mh) + ($1.35 x actual dlh)
= ($6.30 x 40,000) + ($1.35 x 80,000)
= $360,000
= $252,000 + $108,000

4 -21
Belring, Inc.
Per-Unit Cost: Departmental Rates
Cordless Regular
Prime costs $ 78,000 $ 738,000
Overhead costs:
($6.30 x 4,000) + ($1.35 x 3,000) 29,250 ---
($6.30 x 36,000) + (1.35 x 77,000) --- 330,750
Total manufacturing costs $107,250 $1,068,750
Units produced 10,000 100,000
Unit cost $ 10.73 $ 10.69

4 -22
Symptoms of an Outdated
Functional Cost System
1. The outcome of bids is difficult to explain.
2. Competitors’ prices appear unrealistically low.
3. Products that are difficult to produce show high
profits.
4. Operational managers want to drop products that
appear profitable.
5. Profit margins are difficult to explain.
Continued

4 -23
Symptoms of an Outdated
Functional Cost System
6. The company has a highly profitable niche all to
itself.
7. Customers do not complain about price increases.
8. The accounting department spends a lot of time
supplying cost data for special projects.
9. Some departments are using their own accounting
system.
10. Product costs change because of changes in
financial reporting regulations.

4 -24
Non-unit activity drivers are
factors that measure the
consumption of non-unit
activities by products and other
cost objects.

4 -25
Product diversity means that the
products consume overhead activities
in systematically different proportions.

4 -26
Units produced per year 10,000 100,000 110,000
Prime costs $78,000 $738,000 $816,000
Direct labor hours 10,000 90,000 100,000
Machine hours 5,000 45,000 50,000
Production runs 20 10 30
Number of moves 60 30 90
Belring, Inc.
Activity Usage
Measures
Product-Costing Data
Cordless Regular Total

4 -27
Activity Activity Cost
Belring, Inc.
Setups $120,000
Material handling 60,000
Machining 100,000
Testing 80,000
Total $360,000
Overhead Activities
Product-Costing Data

4 -28
Belring, Inc.
Product Diversity: Consumption Ratios
Setups 0.67 0.33 Production runs
Material
handling 0.67 0.33 Number of moves
Machining 0.10 0.90 Machine hours
Testing 0.10 0.90 Direct labor hours
Overhead Cordless Regular Activity
Activity Phone Phone Drivera a
b b
c c
d d
20/30 (cordless) and 10/30 (regular)a

4 -29
Belring, Inc.
Product Diversity: Consumption Ratios
Setups 0.67 0.33 Production runs
Material
handling 0.67 0.33 Number of moves
Machining 0.10 0.90 Machine hours
Testing 0.10 0.90 Direct labor hours
Overhead Cordless Regular Activity
Activity Phone Phone Drivera a
b b
c c
d d
60/90 (cordless) and 30/90 (regular)b

4 -30
Belring, Inc.
Product Diversity: Consumption Ratios
Setups 0.67 0.33 Production runs
Material
handling 0.67 0.33 Number of moves
Machining 0.10 0.90 Machine hours
Testing 0.10 0.90 Direct labor hours
Overhead Cordless Regular Activity
Activity Phone Phone Drivera a
b b
c c
d d
5,000/50,000 (cordless) and 45,000/50,000 (regular)c

4 -31
Belring, Inc.
Product Diversity: Consumption Ratios
Setups 0.67 0.33 Production runs
Material
handling 0.67 0.33 Number of moves
Machining 0.10 0.90 Machine hours
Testing 0.10 0.90 Direct labor hours
Overhead Cordless Regular Activity
Activity Phone Phone Drivera a
b b
c c
d d
10,000/100,000 (cordless) and 90,000/100,000 (regular)d

4 -32
Setup rate: $120,000/30 =$4,000 per run
Material-handling
rate: $60,000/90 = $666.67 per move
Machining rate: $100,000/50,000 = $2 per MH
Testing rate: $80,000/100,000 = $0.80 per DLH
Belring, Inc.
Activity Rates

4 -33
Cordless Regular
Prime costs $ 78,000 $ 738,000
Overhead costs:
Setups 80,000 40,000
Material handling 40,000 20,000
Machining 10,000 90,000
Testing 8,000 72,000
Total manufacturing costs $216,000 $ 960,000
Units produced 10,000 100,000
Unit cost (total costs/units) $ 21.60 $ 9.60
Belring, Inc.
Activity Rates
$4,000
x
20
$4,000
x
10$667
x
60
$667
x
30$2
x
5,000
$2
x
45,000$0.80
x
10,000
$0.80
x
90,000

4 -34
Plantwide rate $11.40 $10.62
Departmental rate 10.73 10.69
Activity rate 21.60 9.60
Comparison of Unit Costs
Cordless Regular
Belring, Inc.

4 -35
ABC: Two-Stage Assignment
Cost of Resources
Assign Costs
Activities
Assign Costs
Products
Driver
Tracing
Driver
Tracing
Driver
Tracing

4 -36
A primary activity is one
that is consumed by a
product or customer.
A secondary activity is
one that is consumed by
other primary and
secondary activities.

4 -37
Resource drivers are
factors that measure the
consumption of
resources by activities.

4 -38
Unit-level activities are those that are performed each
time a unit is produced.
Examples: Power and machine hours are used
each time a unit is produced. Direct
materials and direct labor activities are
also unit-level activities, even though
they are not overhead costs.
Classification of Activities

4 -39
Batch-level activities are those that are performed
each time a batch of products is produced.
Examples: Setups, inspections, production
scheduling, and material handling.
Classification of Activities

4 -40
Product-level (sustaining) activities are those that are
performed as needed to support the various products
produced by a company. These activities consume inputs that
develop products or allow products to be produced and sold.
Examples: Engineering changes, process engineering, and
expediting.
Classification of Activities

4 -41
Facility-level activities are those that sustain a
factory's general manufacturing processes.
Examples: Plant management, landscaping,
maintenance, security, property
taxes, and plant depreciation.
Classification of Activities

4 -42
Driver
Filter
Driver
Filter
Driver
Filter
Unit Level Batch Level Product Level Facility Level
A1 A A A A2 3 4 5
Set 1 Set 2 Set 3 Set 4 Set 5 Set 6 Set 7
Activit
y Level
Filter

4 -43
Customer
Costing versus
Product Costing

4 -44
Large Customer Ten Smaller Customers (50% of sales) (50% of sales)
Units purchased 500,000 500,000
Orders placed 2 200
Number of sales calls 10 210
Manufacturing cost $3,000,000 $3,000,000
Order-filling costs
allocated $202,000 $202,000
Sales-force costs
allocated $110,000 $110,000
Example

4 -45
The purchasing manager uses two suppliers,
Murray Inc. and Plata Associates, as the source of
two machine parts: Part A1 and Part B2.
Example
Activity Costs
Repairing products $800,000
Expending products 200,000

4 -46
Example
Murray Inc. Plata Associates
Part A 1 Part B2 Part A 1 Part B2
Unit purchase price $20 $52 $24 $56
Units purchased 80,000 40,000 10,000 10,000
Failed units 1,600 380 10 10
Late shipments 60 40 0 0
Repair rate = $800,000 ÷ 2,000 = $400 per failed part
Expediting rate = $200,000 ÷ 100 = $2,000 per late
delivery
60 + 40
(1,600 + 380 + 10 + 10)
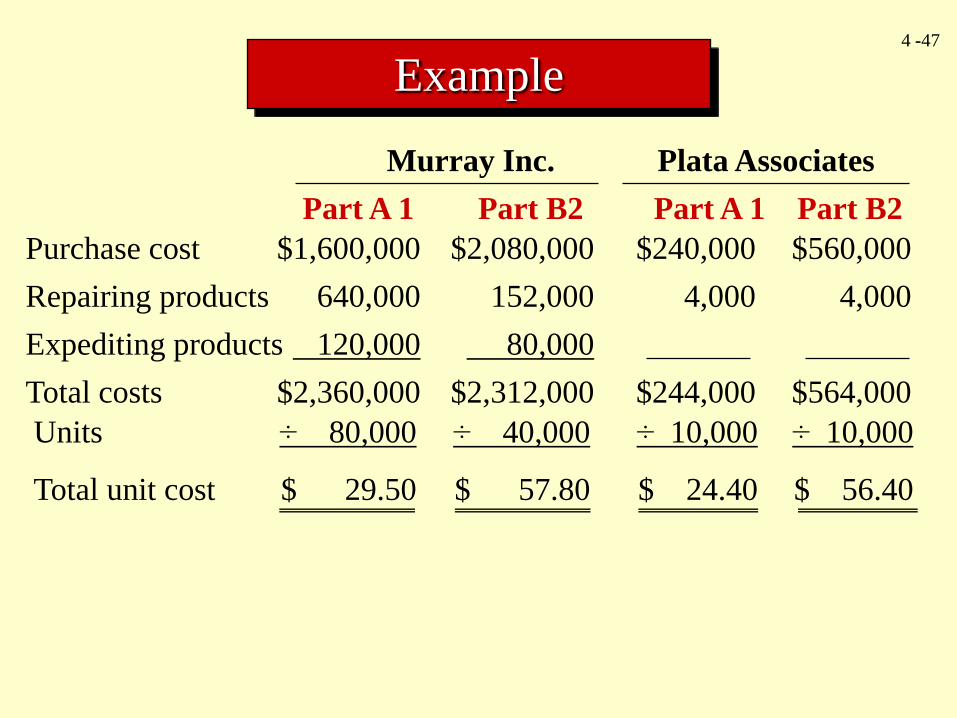
4 -47
Example
Murray Inc. Plata Associates
Part A 1 Part B2 Part A 1 Part B2
Purchase cost $1,600,000 $2,080,000 $240,000 $560,000
Repairing products 640,000 152,000 4,000 4,000
Expediting products 120,000 80,000
Total costs $2,360,000 $2,312,000 $244,000 $564,000
Units ÷ 80,000 ÷ 40,000 ÷ 10,000 ÷ 10,000
Total unit cost $ 29.50 $ 57.80 $ 24.40 $ 56.40

4 -48
The End
Chapter Four

4 -49