liam twigger, pcf capital group - asian capital and australian iron ore projects, strategic...
TRANSCRIPT
Asia Pacific Iron Ore Conference Liam Twigger – Managing Director
March 2014
Australian Iron Ore Market Prices, Investment, Project Multiples and Funding
2 PCF
Disclaimer
This presentation has been prepared by PCF Capital Group Pty Ltd ("PCF“). The information contained in this presentation is confidential to PCF and is provided for information purposes only. Accordingly, it is provided on the basis of no liability whatsoever to PCF, or the directors, officers and employees of PCF who will not be responsible for any damages arising from any use made of the information herein. While all care has been taken in its preparation, this information has not been independently audited and PCF, or the directors, officers and employees of PCF make no representation and give no warranty or undertaking, express or implied, nor assume any responsibility for the authenticity, origin, validity, accuracy or completeness, or for any errors or omissions contained in the information. The assumptions that were made in its preparation were based on either publicly available information or information which has not been verified by PCF, or formally audited. The presentation is published for information purposes and is not intended to solicit an offer to buy or sell securities mentioned in the report. This presentation should not be construed as personal financial product advice for the purposes of section 766B of the Corporations Act 2001 (Cth) (Act). To the extent any recommendations or statements of opinion or fact made by PCF constitutes financial product advice, they constitute general advice and not personal financial advice in any form. As such, any recommendations or statements do not take into account the financial circumstances, investment objectives, tax implications, or any specific requirements of the recipient. Recipients should not act on any recommendation issued by PCF without first consulting their investment advisor in order to ascertain whether the recommendation (if any) is appropriate, having regard to their investment objectives, financial situation and particular needs. The opinions expressed are subject to change without notice and will not be updated by PCF. Please visit our website <www.pcfcapital.com.au/disclaimer> for a full copy of our General Disclosure and Disclaimer. This presentation cannot be reproduced, copied or provided to a third party without the prior written consent of PCF.
2
Disclaimer
3
Iron Ore Market View:
• Australian Resources Sector Indices and Value Proposition
• Price Outlook (Wall of Supply)
• Project acquisition and trading multiples
• Iron Ore Funding Sources
• Magnetite
4
Investment Interest
5
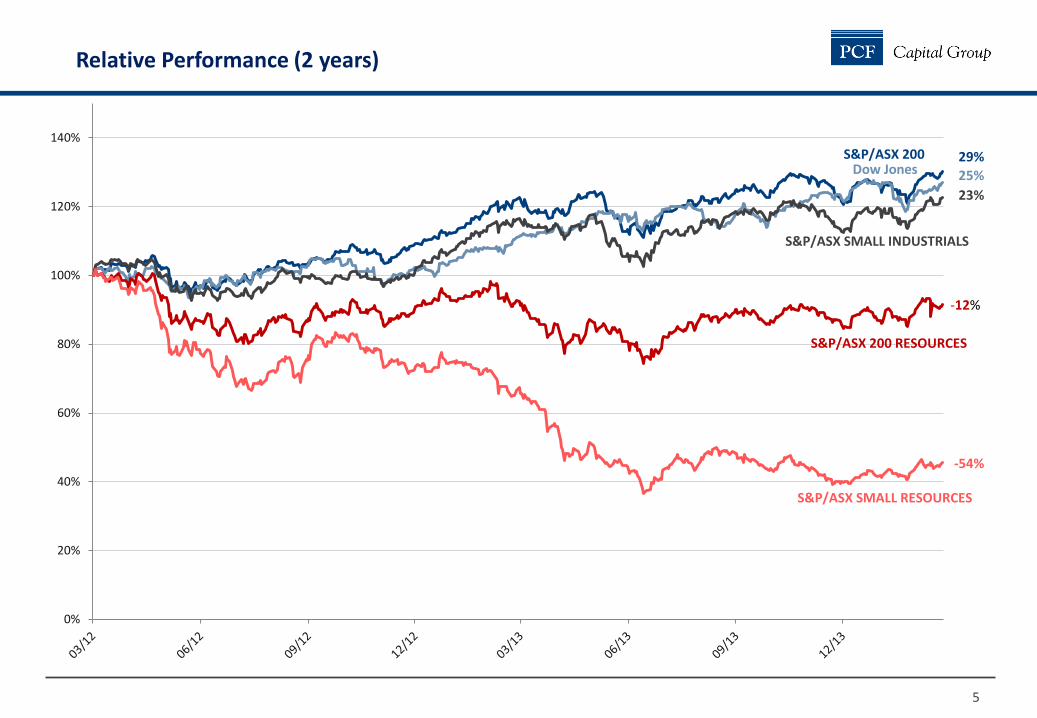
Relative Performance (2 years)
0%
20%
40%
60%
80%
100%
120%
140%
29%
25%
23%
-12%
-54%
S&P/ASX 200 RESOURCES
S&P/ASX SMALL RESOURCES
S&P/ASX 200
S&P/ASX SMALL INDUSTRIALS
Dow Jones
6
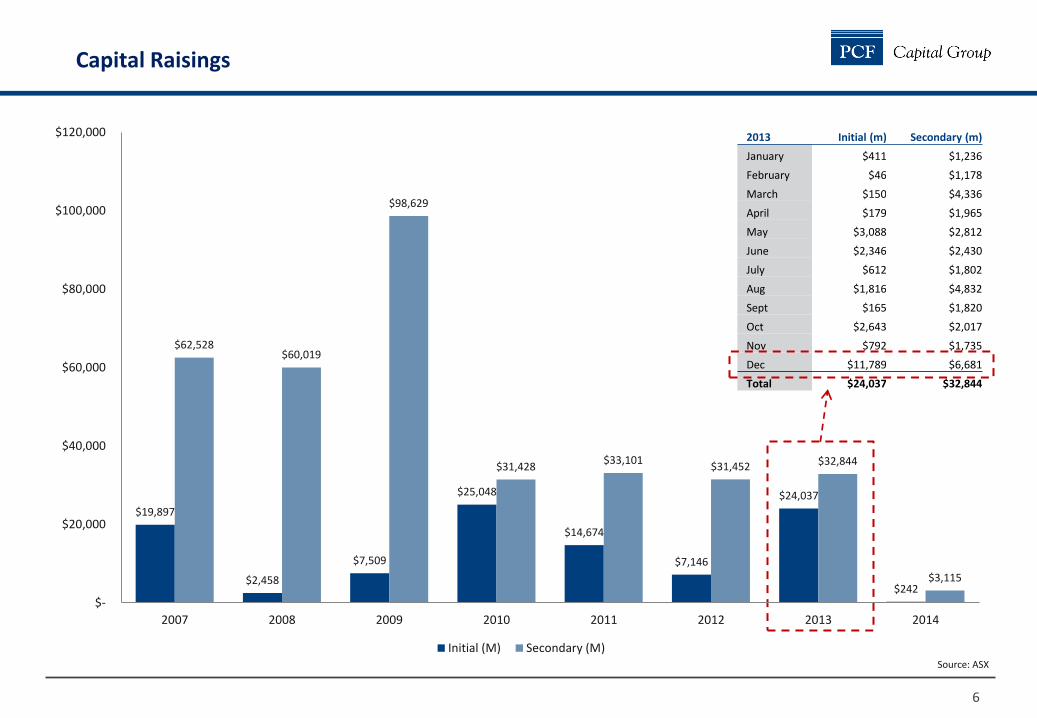
Capital Raisings
2013 Initial (m) Secondary (m)
January $411 $1,236
February $46 $1,178
March $150 $4,336
April $179 $1,965
May $3,088 $2,812
June $2,346 $2,430
July $612 $1,802
Aug $1,816 $4,832
Sept $165 $1,820
Oct $2,643 $2,017
Nov $792 $1,735
Dec $11,789 $6,681
Total $24,037 $32,844
Source: ASX
$19,897
$2,458
$7,509
$25,048
$14,674
$7,146
$24,037
$242
$62,528 $60,019
$98,629
$31,428 $33,101
$31,452 $32,844
$3,115
$-
$20,000
$40,000
$60,000
$80,000
$100,000
$120,000
2007 2008 2009 2010 2011 2012 2013 2014
Initial (M) Secondary (M)
7
Where’s the value?
8
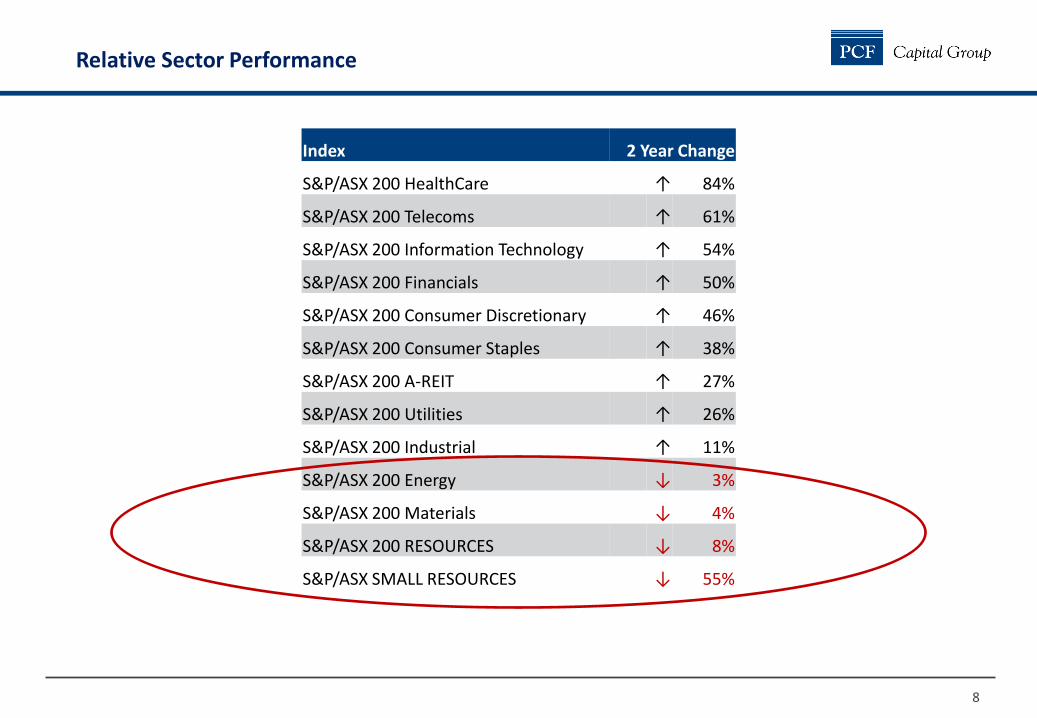
Relative Sector Performance
Index 2 Year Change
S&P/ASX 200 HealthCare ↑ 84%
S&P/ASX 200 Telecoms ↑ 61%
S&P/ASX 200 Information Technology ↑ 54%
S&P/ASX 200 Financials ↑ 50%
S&P/ASX 200 Consumer Discretionary ↑ 46%
S&P/ASX 200 Consumer Staples ↑ 38%
S&P/ASX 200 A-REIT ↑ 27%
S&P/ASX 200 Utilities ↑ 26%
S&P/ASX 200 Industrial ↑ 11%
S&P/ASX 200 Energy ↓ 3%
S&P/ASX 200 Materials ↓ 4%
S&P/ASX 200 RESOURCES ↓ 8%
S&P/ASX SMALL RESOURCES ↓ 55%
9
Price Outlook
10
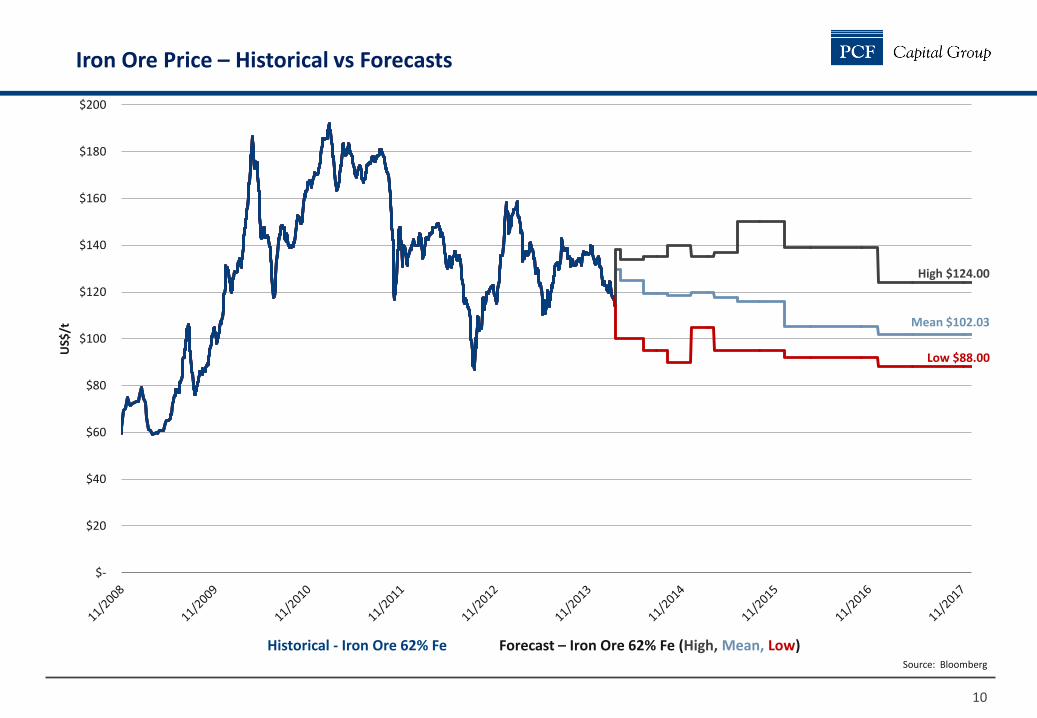
Iron Ore Price – Historical vs Forecasts
Historical - Iron Ore 62% Fe Forecast – Iron Ore 62% Fe (High, Mean, Low) Source: Bloomberg
Mean $102.03
High $124.00
Low $88.00
$-
$20
$40
$60
$80
$100
$120
$140
$160
$180
$200
US$
/t
11
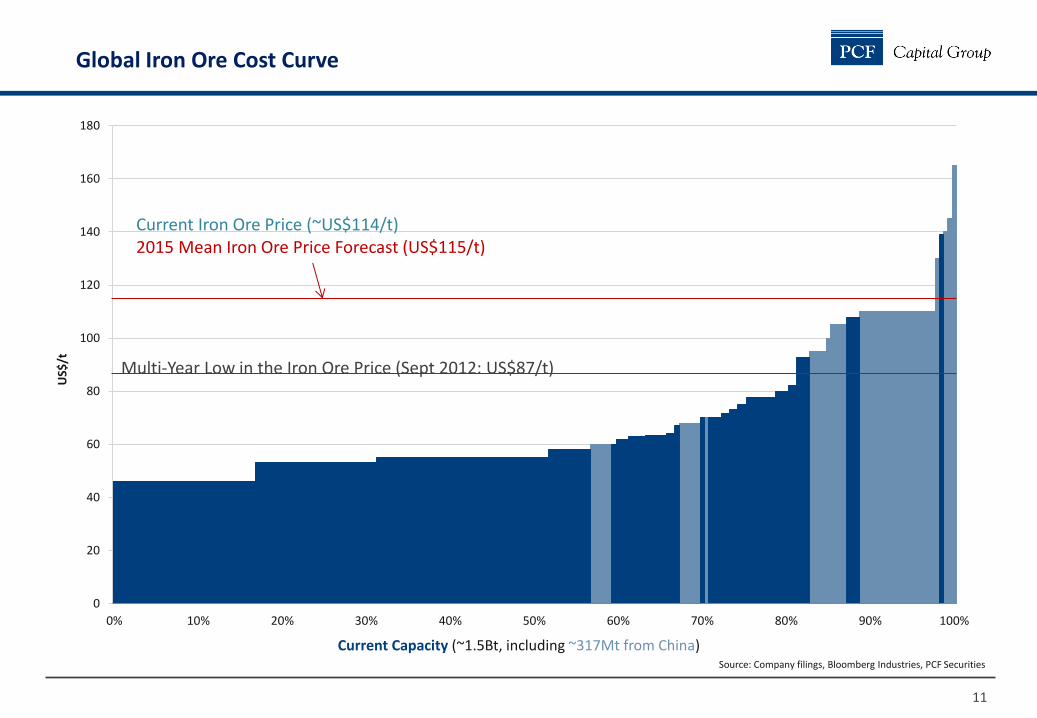
Global Iron Ore Cost Curve
0
20
40
60
80
100
120
140
160
180
0% 10% 20% 30% 40% 50% 60% 70% 80% 90% 100%
US$
/t
Multi-Year Low in the Iron Ore Price (Sept 2012: US$87/t)
Current Capacity (~1.5Bt, including ~317Mt from China)
Current Iron Ore Price (~US$114/t) 2015 Mean Iron Ore Price Forecast (US$115/t)
Source: Company filings, Bloomberg Industries, PCF Securities
12
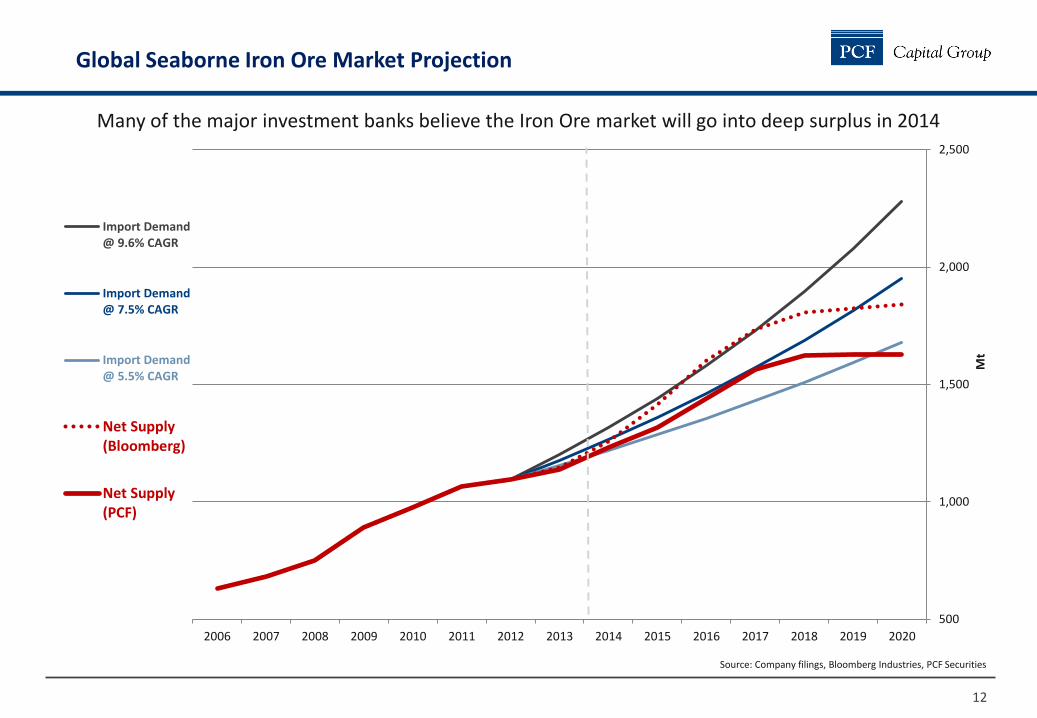
Global Seaborne Iron Ore Market Projection
Source: Company filings, Bloomberg Industries, PCF Securities
Many of the major investment banks believe the Iron Ore market will go into deep surplus in 2014
500
1,000
1,500
2,000
2,500
202020192018201720162015201420132012201120102009200820072006
Mt
Import Demand@ 9.6% CAGR
Import Demand@ 7.5% CAGR
Import Demand@ 5.5% CAGR
Net Supply(Bloomberg)
Net Supply(PCF)
13
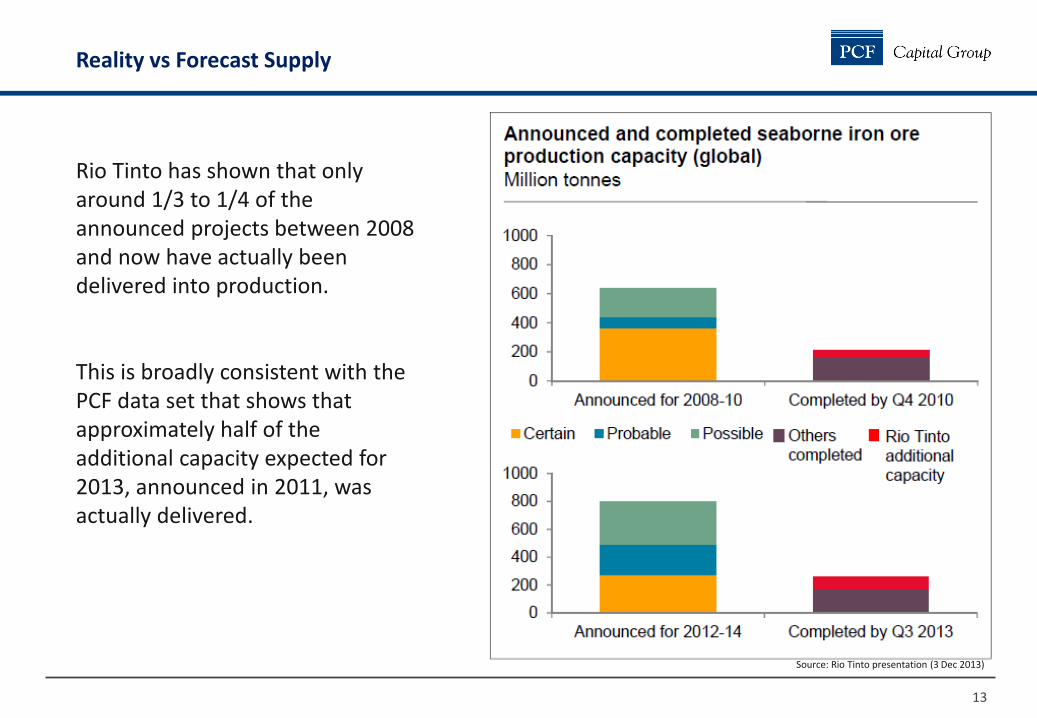
Reality vs Forecast Supply
Rio Tinto has shown that only around 1/3 to 1/4 of the announced projects between 2008 and now have actually been delivered into production. This is broadly consistent with the PCF data set that shows that approximately half of the additional capacity expected for 2013, announced in 2011, was actually delivered.
Source: Rio Tinto presentation (3 Dec 2013)
14
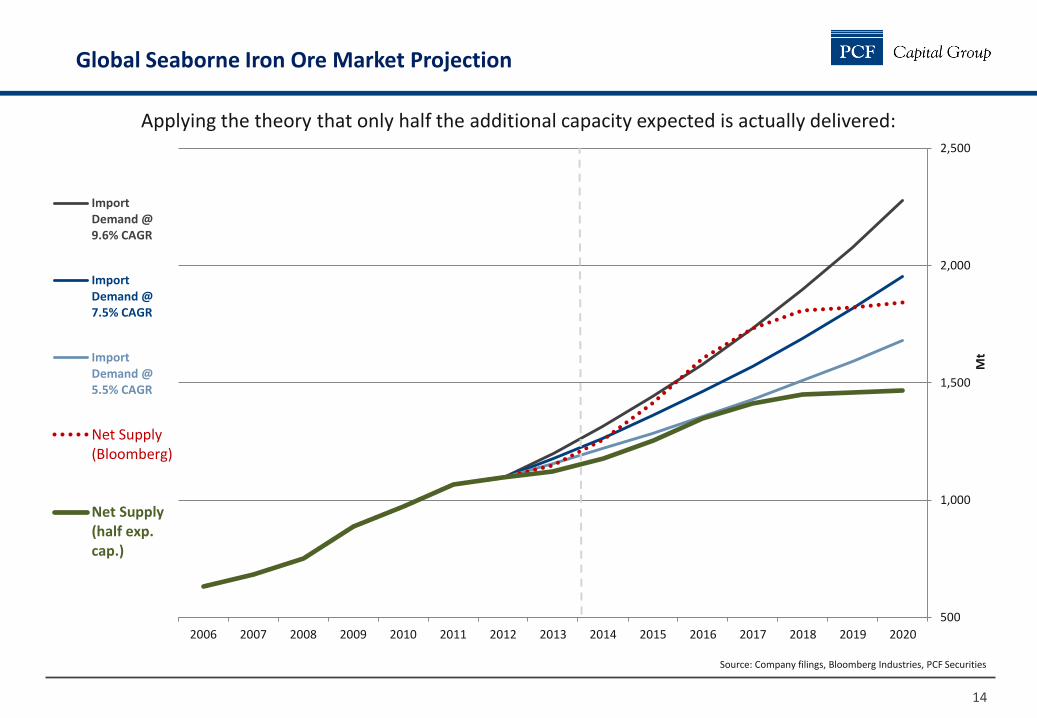
Global Seaborne Iron Ore Market Projection
Source: Company filings, Bloomberg Industries, PCF Securities
Applying the theory that only half the additional capacity expected is actually delivered:
500
1,000
1,500
2,000
2,500
202020192018201720162015201420132012201120102009200820072006
Mt
ImportDemand @9.6% CAGR
ImportDemand @7.5% CAGR
ImportDemand @5.5% CAGR
Net Supply(Bloomberg)
Net Supply(half exp.cap.)
15
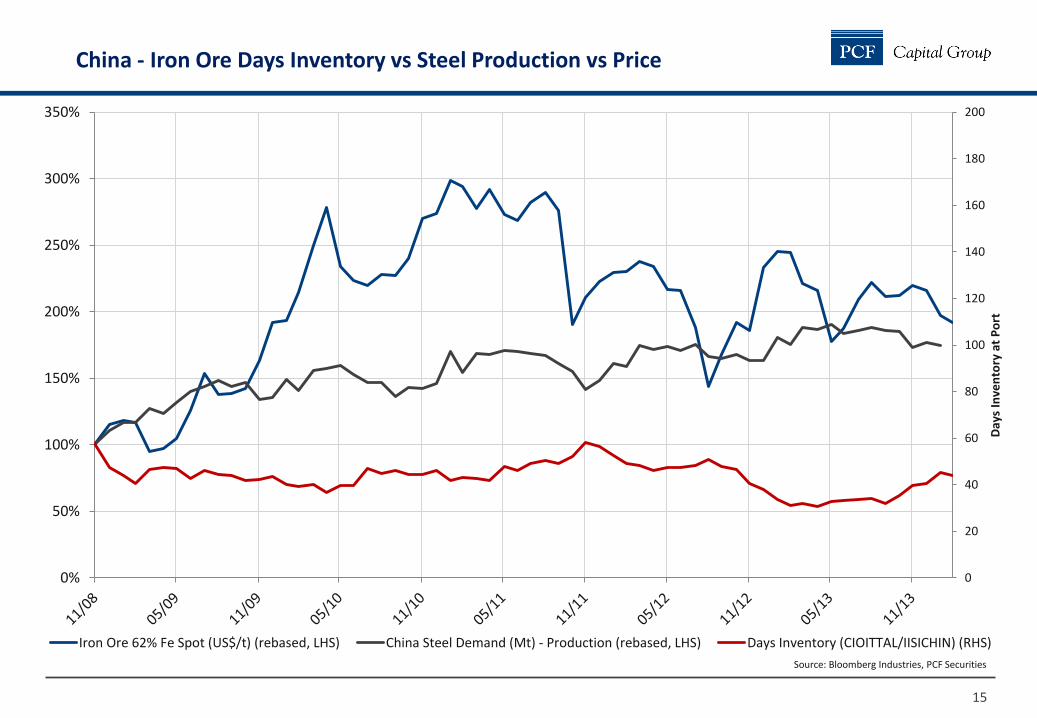
China - Iron Ore Days Inventory vs Steel Production vs Price
Source: Bloomberg Industries, PCF Securities
0
20
40
60
80
100
120
140
160
180
200
0%
50%
100%
150%
200%
250%
300%
350%
Day
s In
ven
tory
at
Po
rt
Iron Ore 62% Fe Spot (US$/t) (rebased, LHS) China Steel Demand (Mt) - Production (rebased, LHS) Days Inventory (CIOITTAL/IISICHIN) (RHS)
16
Performance: The Majors vs The Mid-tier Producers
17
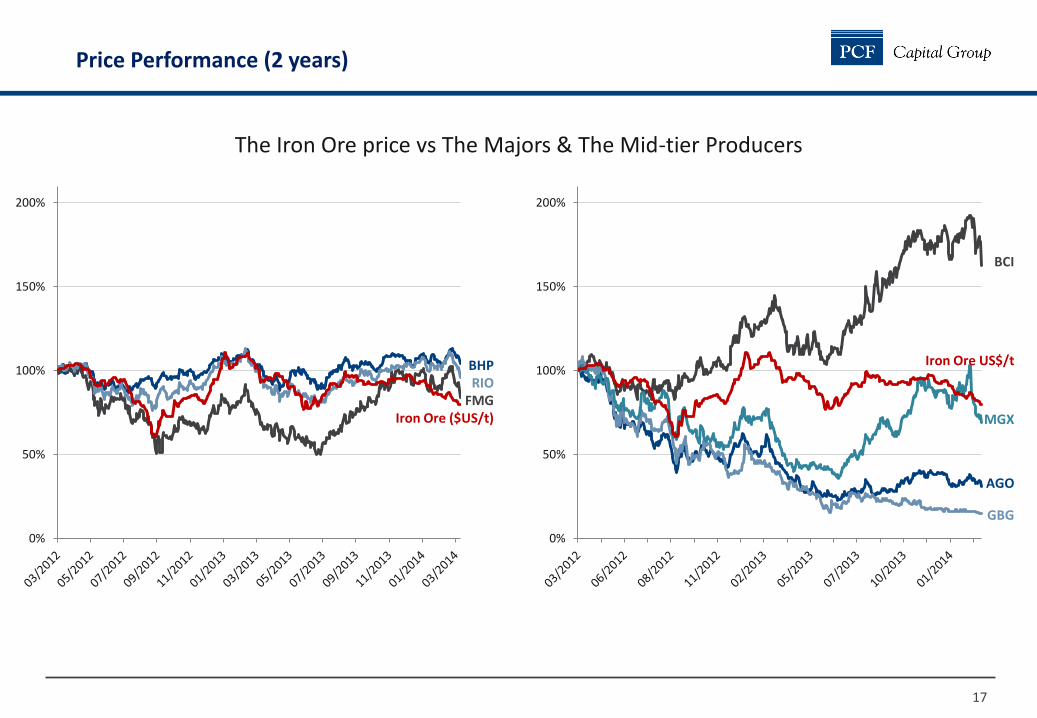
Price Performance (2 years)
The Iron Ore price vs The Majors & The Mid-tier Producers
0%
50%
100%
150%
200%
AGO
Iron Ore US$/t
GBG
BCI
MGX
0%
50%
100%
150%
200%
BHP RIO
FMG Iron Ore ($US/t)
18
Project acquisition appetite and strategic positioning in Pilbara
19
Date Project Price A$ Resource Tonnes
Grade A$ per Fe Tonne
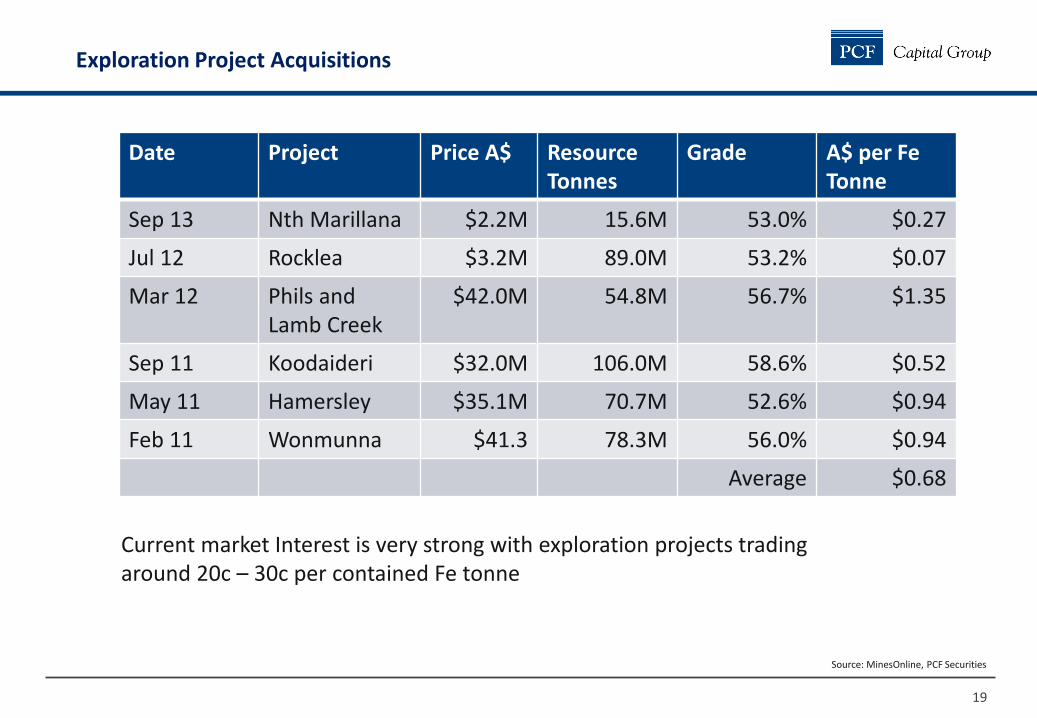
Sep 13 Nth Marillana $2.2M 15.6M 53.0% $0.27
Jul 12 Rocklea $3.2M 89.0M 53.2% $0.07
Mar 12 Phils and Lamb Creek
$42.0M 54.8M 56.7% $1.35
Sep 11 Koodaideri $32.0M 106.0M 58.6% $0.52
May 11 Hamersley $35.1M 70.7M 52.6% $0.94
Feb 11 Wonmunna $41.3 78.3M 56.0% $0.94
Average $0.68
Exploration Project Acquisitions
Current market Interest is very strong with exploration projects trading around 20c – 30c per contained Fe tonne
Source: MinesOnline, PCF Securities
20
Date Project Price A$ Resource Tonnes
Grade A$ per Fe Tonne
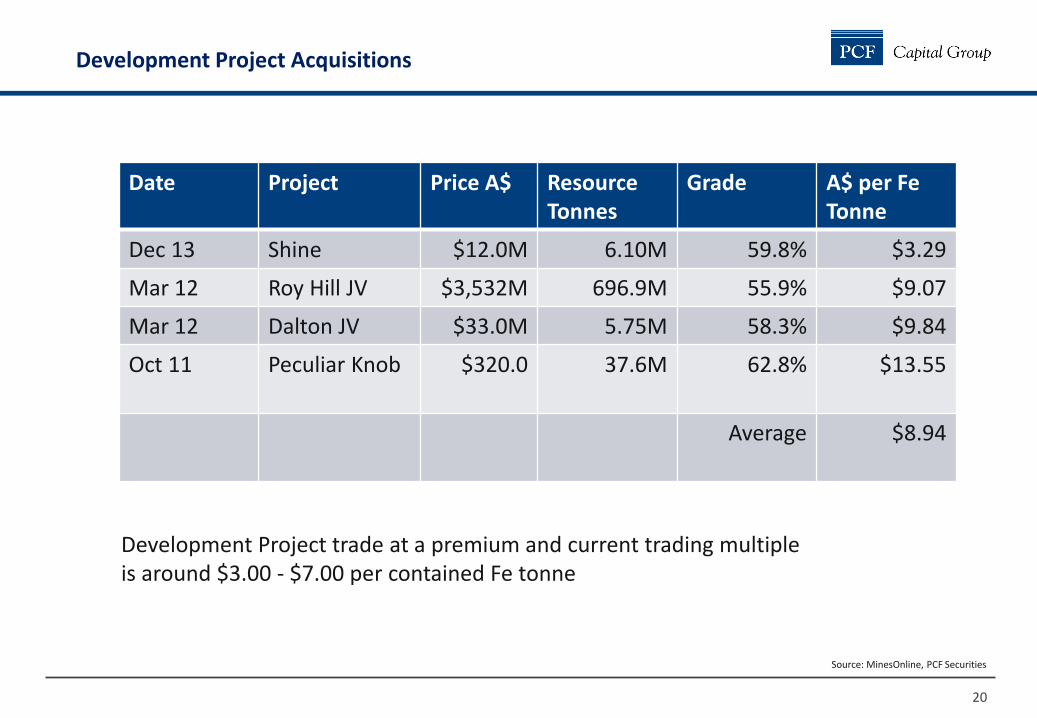
Dec 13 Shine $12.0M 6.10M 59.8% $3.29
Mar 12 Roy Hill JV $3,532M 696.9M 55.9% $9.07
Mar 12 Dalton JV $33.0M 5.75M 58.3% $9.84
Oct 11 Peculiar Knob $320.0 37.6M 62.8% $13.55
Average $8.94
Development Project Acquisitions
Development Project trade at a premium and current trading multiple is around $3.00 - $7.00 per contained Fe tonne
Source: MinesOnline, PCF Securities
21
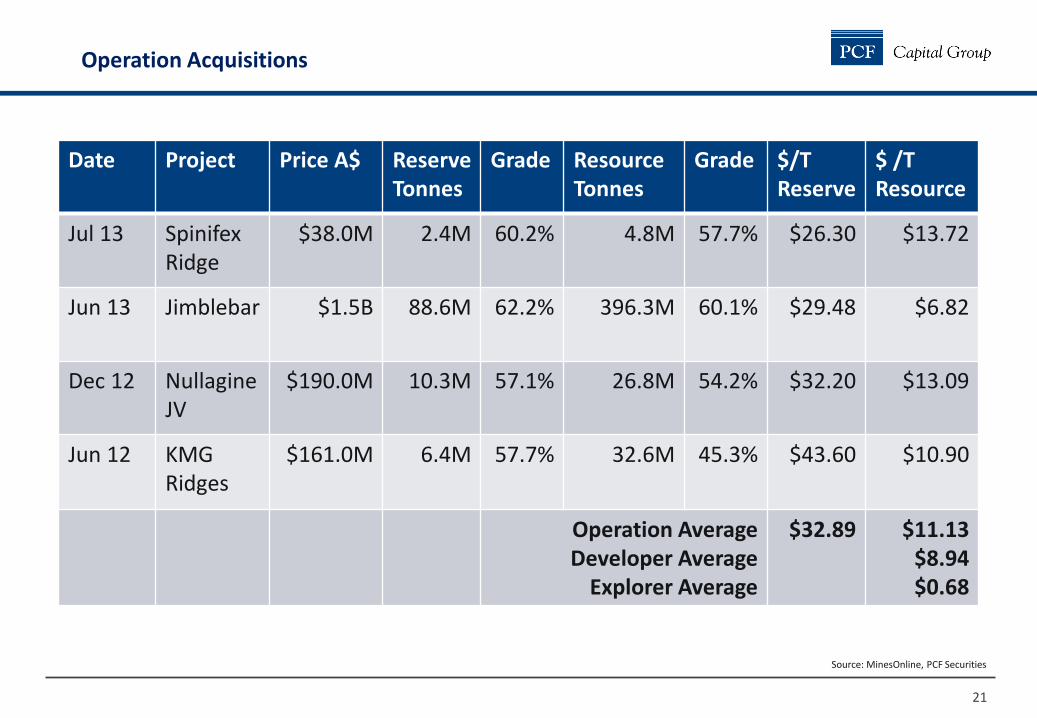
Date Project Price A$ Reserve Tonnes
Grade Resource Tonnes
Grade $/T Reserve
$ /T Resource
Jul 13 Spinifex Ridge
$38.0M 2.4M 60.2% 4.8M 57.7% $26.30 $13.72
Jun 13 Jimblebar $1.5B 88.6M 62.2% 396.3M 60.1% $29.48 $6.82
Dec 12 Nullagine JV
$190.0M 10.3M 57.1% 26.8M 54.2% $32.20 $13.09
Jun 12 KMG Ridges
$161.0M 6.4M 57.7% 32.6M 45.3% $43.60 $10.90
Operation Average Developer Average
Explorer Average
$32.89 $11.13 $8.94 $0.68
Operation Acquisitions
Source: MinesOnline, PCF Securities
22
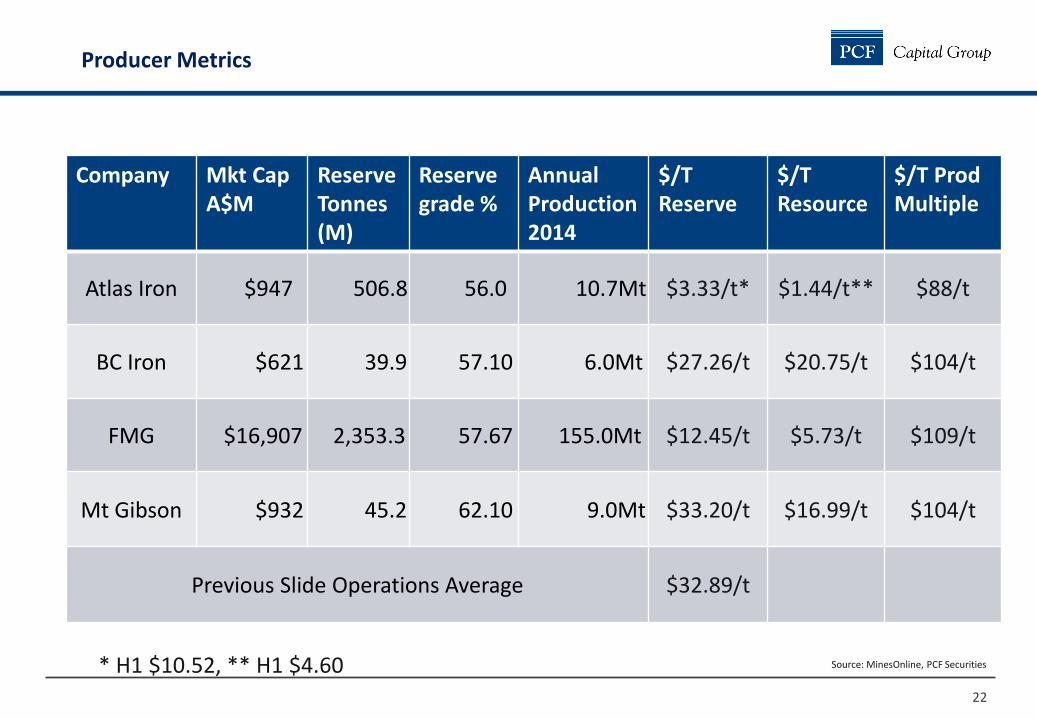
Company Mkt Cap A$M
Reserve Tonnes (M)
Reserve grade %
Annual Production 2014
$/T Reserve
$/T Resource
$/T Prod Multiple
Atlas Iron $947 506.8 56.0 10.7Mt $3.33/t* $1.44/t** $88/t
BC Iron $621 39.9 57.10 6.0Mt $27.26/t $20.75/t $104/t
FMG $16,907 2,353.3 57.67 155.0Mt $12.45/t $5.73/t $109/t
Mt Gibson $932 45.2 62.10 9.0Mt $33.20/t $16.99/t $104/t
Previous Slide Operations Average $32.89/t
Producer Metrics
* H1 $10.52, ** H1 $4.60 Source: MinesOnline, PCF Securities
23
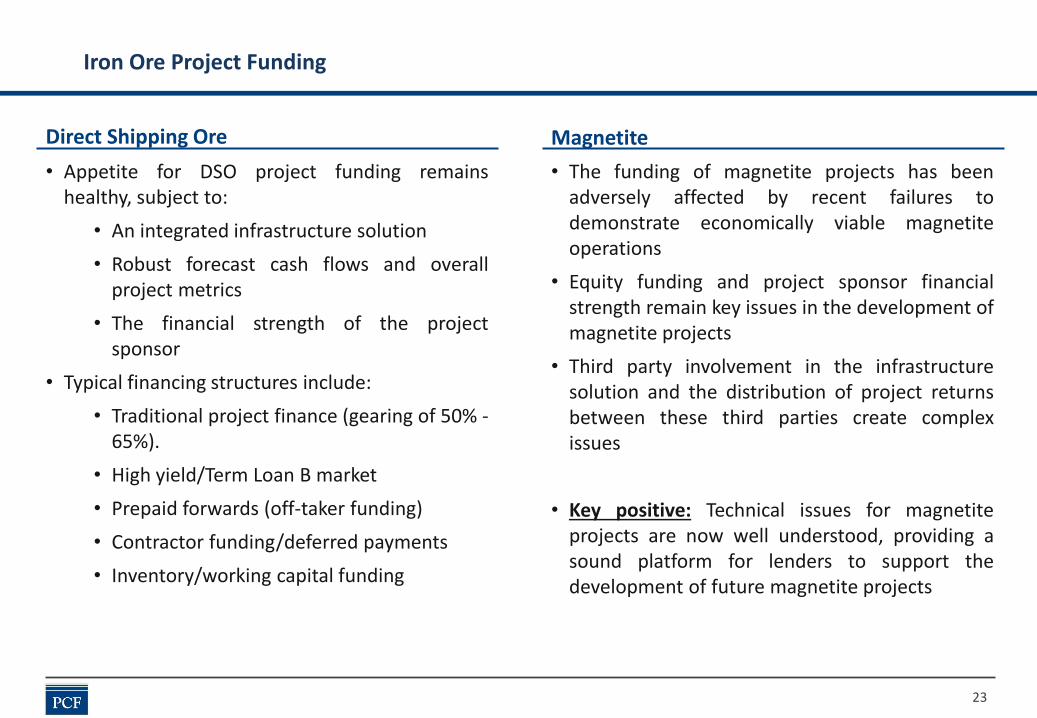
Iron Ore Project Funding
• Appetite for DSO project funding remains healthy, subject to:
• An integrated infrastructure solution
• Robust forecast cash flows and overall project metrics
• The financial strength of the project sponsor
• Typical financing structures include:
• Traditional project finance (gearing of 50% -65%).
• High yield/Term Loan B market
• Prepaid forwards (off-taker funding)
• Contractor funding/deferred payments
• Inventory/working capital funding
Direct Shipping Ore Magnetite
• The funding of magnetite projects has been adversely affected by recent failures to demonstrate economically viable magnetite operations
• Equity funding and project sponsor financial strength remain key issues in the development of magnetite projects
• Third party involvement in the infrastructure solution and the distribution of project returns between these third parties create complex issues
• Key positive: Technical issues for magnetite projects are now well understood, providing a sound platform for lenders to support the development of future magnetite projects
24
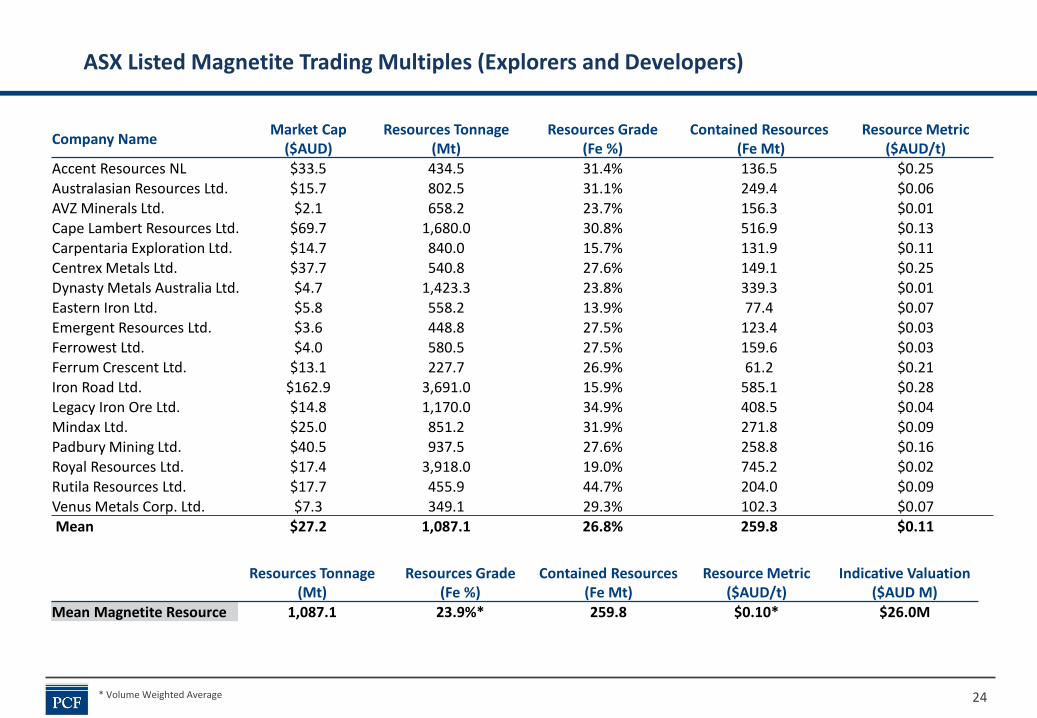
ASX Listed Magnetite Trading Multiples (Explorers and Developers)
Resources Tonnage (Mt)
Resources Grade (Fe %)
Contained Resources (Fe Mt)
Resource Metric ($AUD/t)
Indicative Valuation ($AUD M)
Mean Magnetite Resource 1,087.1 23.9%* 259.8 $0.10* $26.0M
* Volume Weighted Average
Company Name Market Cap
($AUD) Resources Tonnage
(Mt) Resources Grade
(Fe %) Contained Resources
(Fe Mt) Resource Metric
($AUD/t) Accent Resources NL $33.5 434.5 31.4% 136.5 $0.25 Australasian Resources Ltd. $15.7 802.5 31.1% 249.4 $0.06 AVZ Minerals Ltd. $2.1 658.2 23.7% 156.3 $0.01 Cape Lambert Resources Ltd. $69.7 1,680.0 30.8% 516.9 $0.13 Carpentaria Exploration Ltd. $14.7 840.0 15.7% 131.9 $0.11 Centrex Metals Ltd. $37.7 540.8 27.6% 149.1 $0.25 Dynasty Metals Australia Ltd. $4.7 1,423.3 23.8% 339.3 $0.01 Eastern Iron Ltd. $5.8 558.2 13.9% 77.4 $0.07 Emergent Resources Ltd. $3.6 448.8 27.5% 123.4 $0.03 Ferrowest Ltd. $4.0 580.5 27.5% 159.6 $0.03 Ferrum Crescent Ltd. $13.1 227.7 26.9% 61.2 $0.21 Iron Road Ltd. $162.9 3,691.0 15.9% 585.1 $0.28 Legacy Iron Ore Ltd. $14.8 1,170.0 34.9% 408.5 $0.04 Mindax Ltd. $25.0 851.2 31.9% 271.8 $0.09 Padbury Mining Ltd. $40.5 937.5 27.6% 258.8 $0.16 Royal Resources Ltd. $17.4 3,918.0 19.0% 745.2 $0.02 Rutila Resources Ltd. $17.7 455.9 44.7% 204.0 $0.09 Venus Metals Corp. Ltd. $7.3 349.1 29.3% 102.3 $0.07 Mean $27.2 1,087.1 26.8% 259.8 $0.11
25
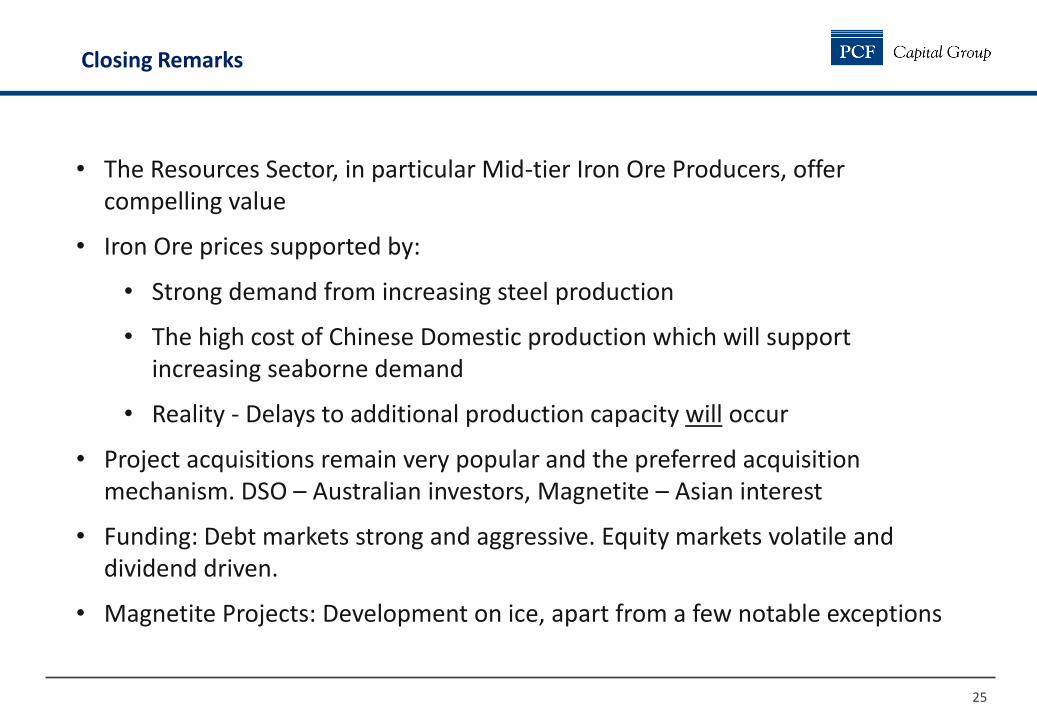
• The Resources Sector, in particular Mid-tier Iron Ore Producers, offer compelling value
• Iron Ore prices supported by:
• Strong demand from increasing steel production
• The high cost of Chinese Domestic production which will support increasing seaborne demand
• Reality - Delays to additional production capacity will occur
• Project acquisitions remain very popular and the preferred acquisition mechanism. DSO – Australian investors, Magnetite – Asian interest
• Funding: Debt markets strong and aggressive. Equity markets volatile and dividend driven.
• Magnetite Projects: Development on ice, apart from a few notable exceptions
Closing Remarks
www.pcfcapital.com.au
Level 3, 8 Colin Street, West Perth Western Australia, Australia, 6005 Tel +61 8 9486 7111 Fax +61 8 9486 7011 Email [email protected]
Level 3, 8 Colin Street, West Perth Western Australia, Australia, 6005 Tel +61 8 9486 7111 Fax +61 8 9486 7011 Email [email protected]