liability structure in small-scale finance: evidence from
TRANSCRIPT

Liability Structure in Small-Scale Finance:Evidence from a Natural Experiment
The Harvard community has made thisarticle openly available. Please share howthis access benefits you. Your story matters
Citation Carpena, Fenella, Shawn Cole, Jeremy Shapiro, and Bilal Zia."Liability Structure in Small-Scale Finance: Evidence from a NaturalExperiment." World Bank Economic Review 27, no. 3 (2013): 437–469. (Was Harvard Business School Working Paper, No. 13-018,August 2012.)
Published Version https://doi.org/10.1093/wber/lhs031
Citable link http://nrs.harvard.edu/urn-3:HUL.InstRepos:9502858
Terms of Use This article was downloaded from Harvard University’s DASHrepository, and is made available under the terms and conditionsapplicable to Open Access Policy Articles, as set forth at http://nrs.harvard.edu/urn-3:HUL.InstRepos:dash.current.terms-of-use#OAP

Copyright © 2012 by Fenella Carpena, Shawn Cole, Jeremy Shapiro, and Bilal Zia
Working papers are in draft form. This working paper is distributed for purposes of comment and discussion only. It may not be reproduced without permission of the copyright holder. Copies of working papers are available from the author.
Liability Structure in Small-Scale Finance: Evidence from a Natural Experiment Fenella Carpena Shawn Cole Jeremy Shapiro Bilal Zia
Working Paper
13-018 August 15, 2012

Liability Structure in Small-Scale Finance: Evidencefrom a Natural Experiment
Fenella Carpena, Shawn Cole, Jeremy Shapiro, and Bilal Zia∗
Abstract
Microfinance, the provision of small individual and business loans, has witnesseddramatic growth, reaching over 150 million borrowers worldwide. Much of its successhas been attributed to overcoming the challenges of information asymmetries in uncol-lateralized lending. Yet, very little is known about the optimal contract structure ofsuch loans—there is substantial variation across lenders, even within a particular set-ting. This paper exploits a plausibly exogenous change in the liability structure offeredby a microfinance program in India, which shifted from individual to group liabilitylending. We find evidence that the lending model matters: for the same borrower,required monthly loan installments are 11 percent less likely to be missed under thegroup liability setting, relative to individual liability. In addition, compulsory savingsdeposits are 20 percent less likely to be missed under group liability contracts.
Word Count: 10,615
∗UC Berkeley ([email protected]), Harvard Business School ([email protected]), Yale Univer-sity ([email protected]), and World Bank ([email protected]), respectively.

1 Introduction
Theory and evidence highlight financial market imperfections as a central cause of poverty
and a key impediment to growth (Banerjee and Newman, 1993; Rajan and Zingales, 1998).
In theories of capital accumulation for example, financial market imperfections influence the
ability of the poor to borrow for investments in education and physical capital. Addition-
ally, in models explaining entrepreneurship, information asymmetries and transaction costs
prevent profitable entrepreneurial activities of the poor, who often have no collateral. Lack
of access to financial services may thus play a crucial role in leaving many productive op-
portunities for the poor untapped, as well as in generating persistent income inequality and
lower growth (Beck et al., 2007).1
Microfinance, the provision of credit, savings and other financial services to low-income
households and entrepreneurs, has exploded in popularity and coverage in recent years,
particularly in meeting the large unmet demand for finance (Morduch, 1999; Armendariz de
Aghion and Morduch, 2010). Emerging markets and developed economies alike, including
the United States, now provide microfinance services through a variety of public and private
channels. The growth of microfinance has been unprecedented: between 2004 and 2008, the
sector’s average annual asset growth rate was 39%, reaching US$60 billion in total assets
by the end of 2008 (Chen et al., 2010). A careful evaluation of microfinance in Banerjee
et al. (2009) also reveals that microcredit has important effects on business outcomes and
the composition of household expenditure. The rapid growth of microfinance, along with
its potential for promoting development, has attracted the interest not only of governments,
donors, and socially oriented investors, but of mainstream commercial banks as well.
Perhaps the most celebrated feature of microfinance is the group liability contract, a
lending methodology pioneered by the Grameen Bank in Bangladesh. Under this contract,
loans without collateral are extended to a group of borrowers whose members are jointly liable
for each other’s repayment. Since groups form voluntarily and group members are responsible
1See World Bank (2008) for a literature summary.
1

for paying off each other’s debts, borrowers have the incentive to screen risky clients, monitor
their peers, and enforce repayment. The success of this model with the Grameen Bank led to
its replication in many countries around the world, with over 150 million individuals reached
at the end of 2007 (Daley-Harris, 2009). This model is particularly important since small
firms suffer most from institutional weakness (Beck et al., 2005), and because the structure
of the banking sector can have important distributional impacts on growth (Cetorelli and
Gambera, 2001).
While most microfinance organizations use group liability, not all do so. On the one
hand, group liability may solve information asymmetry problems by leveraging social ties
and the borrower’s knowledge about the community, and may reduce monitoring costs to the
lender by motivating borrowers to monitor each other. On the other hand, social sanctions
may be limited, bad clients may free-ride on good clients, and borrower groups may collude
against the lender. In addition to group liability lending, many microfinance programs
also employ a variety of approaches to maintain high repayment rates. For example, some
programs implement frequent repayment schedules, progressive lending, or require collateral
substitutes. And yet, very little is known about the efficiency of such designs in ensuring
repayment.
Indeed, the question of an optimal loan contract structure remains largely unanswered in
both the theoretical and empirical microfinance literature. Theoretical studies have mainly
focused on explaining how and why group liability mechanisms work, offering competing
predictions on its benefits, while the empirical literature lags behind the theory. Two impor-
tant exceptions are Gine and Karlan (2009) and Attanasio et al. (2011). Gine and Karlan
(2009) reports on a field experiment in the Philippines to test the effect of individual versus
group liability lending. Their analysis focuses on the importance of peer monitoring, and
finds no significant difference in default among individual and group borrowers. While Gine
and Karlan identify the effects of peer monitoring, they do not focus on the effects of joint
liability. In contrast, our paper examines the effect of contract structure on the group of
2

borrowers who are willing to borrow with either individual or group liability. Attanasio et al.
(2011), on the other hand, conduct a field experiment in Mongolia in which villages were
randomly assigned to obtain access to group loans, individual loans, or no loans. The main
objective of Attanasio et al. (2011) is to measure the impact of both types of microcredit
on different poverty measures. The authors find a positive impact of group liability loans
on food consumption and entrepreneurship, with no difference in repayment rates between
individual and group liability.
Identifying the impact of group liability on outcomes such as default rate is complicated
by the standard problems of selection and omitted variables bias. Individuals with different
financial habits might choose to take one form of contract but not the other. Alternatively,
lenders with different levels of sophistication may attract different client mixes, and offer
different contracts. One cannot simply compare clients across lending contracts, since self-
selection or other aspects of the program may be the root cause of any observed differences.
In this paper, we use a natural experiment to compare loan repayment and savings
discipline between individual and group lending models.2 In this setting, group lending
differs from individual lending in both the liability structure, and the repayment practices.
In group lending, borrowers are liable for the scheduled payments of the group members,
and the loan officer interacts primarily with the group leader, who collects payments from
other group members, whereas under individual lending, borrowers are personally liable and
interact directly with the loan officer. Our empirical strategy takes advantage of a change
in lending policies of Saath, a non-government organization providing microfinance services
in India. Saath switched from individual to group lending. This transition was governed by
a strict policy rule: after a particular date, all borrowers completing an individual liability
cycle were subsequently offered a group liability loan in their next loan cycle. Individual
liability loan completion dates were distributed relatively uniformly throughout the year,
offering a natural variation in the timing of loan contract transitions. Thus, in July for
2Throughout this paper, we use the terms “group liability” and “joint liability” interchangeably.
3

example, individual liability borrowers finishing a loan cycle would switch to group liability
in the following loan, while those whose loan cycle ended after July would remain under an
individual contract setting until the end of their cycle. This plausibly exogenous change,
phased in over time, generates natural control groups, and allows us to credibly identify
the causal impact of group liability structure, in what amounts to a repeated difference-in-
difference framework. At any particular point in time, our “treatment” group then consists
of clients who have fully repaid their individual liability loan and currently have a group
liability loan, while our “control” group consists of individual liability loan clients who will
eventually convert to a group liability loan.
Our main analysis focuses on loan performance and estimates the effect of group liability
on such outcomes. We find that group liability structure significantly improves repayment
rates. In particular, clients are about 11% less likely to miss a monthly repayment in the
group liability setting relative to individual liability; this effect holds even with individual
fixed effects. We also find that there is greater discipline in monthly compulsory savings
deposits when clients have a group liability loan. Specifically, compulsory deposits are about
20% less likely to be missed in the group liability setting. Our results provide the first
credible evidence that group liability contracts improve upon individual liability, particularly
in ensuring repayment and increasing savings discipline among clients.
These results, however, are also subject to some important caveats. First, the transition
to group liability lending was accompanied by other changes to the lending structure, partic-
ularly an increase in loan size, which may have raised the continuation value of borrowing.
Nevertheless, we argue that our estimates of the impact of the change in lending model may
be lower bounds. Second, since our empirical strategy focuses on clients who chose to borrow
under both individual and group liability settings, the external validity of our results may
be limited. Third, limitations in data availability preclude us from examining loan outcomes
such as delinquency or prepayments. Finally, our empirical strategy does not allow us to
test for the specific mechanisms by which group lending improves repayment. Based on
4
our discussions with Saath, interviews of field officers, and our reading of the evidence, we
speculate that “peer pressure” was the mechanism at work. We discuss these caveats further
in Section 5.2.
From a practical and policy perspective, our results are quite timely. Microlenders world-
wide are increasingly weakening joint liability in their lending approaches (Armendariz de
Aghion and Morduch, 2010). BancoSol in Bolivia has shifted significant proportions of its
lending portfolio from group to individual lending, and even the Grameen Bank has moder-
ated its joint liability clause, allowing defaulters to get back on track without invoking group
pressure. Our results therefore suggest a cautionary tale for microfinance. Many MFIs are
now moving away from joint to individual liability, but even so, this transition is not sup-
ported by strong empirical evidence. This finding is important, since to our knowledge, only
two other papers examine the relative merits of joint and individual liability contracts; our
paper underscores the fact that more research is required to provide better policy guidance
for MFI practitioners worldwide.
The rest of this paper is organized as follows. Section 2 reviews the existing literature
on liability structure in microfinance. Section 3 provides a background on the microfinance
program we study, as well as the change in liability structure of its loan products. In Section
4, we provide a description of the data and summary statistics. We discuss our empirical
strategy and results in Section 5. Finally, Section 6 concludes.
2 Predictions of Group Liability
A wealth of theoretical literature in microfinance explores the mechanisms behind group lia-
bility contracts, particularly on mitigating information asymmetries and enforcement prob-
lems. Stiglitz (1990) shows that the group liability structure overcomes ex ante moral hazard,
since it creates incentives for group members to monitor each other’s loans. Similarly, Baner-
jee et al. (1994) study credit cooperatives and underscore the role of peer monitoring. They
5

describe a model where higher monitoring results in higher borrower effort, and hence, a
higher probability of project success.
Even if a project succeeds, however, borrowers may refuse to repay or may claim that
the project failed to avoid repayment. Such strategic default is also captured in several
theoretical studies on group liability. For example, Besley and Coate (1995) provide a
model demonstrating that joint liability may harness social capital to increase a borrower’s
willingness to repay. Armendariz de Aghion (1999) likewise demonstrates that joint liability
agreements may reduce the incidence of strategic default since borrowers may impose social
sanctions on the defaulter.
In addition to examining moral hazard, the theoretical literature investigates how joint
liability mitigates adverse selection. Ghatak (2000) describes a model under a scenario
where borrowers have ex-ante information about the riskiness of other borrower’s invest-
ment projects, while lenders do not. Joint liability then acts as a screening device inducing
“assortative matching.” Specifically, borrowers with safe investments will partner with other
safe borrowers, leaving risky borrowers to form groups with themselves.
These theoretical models, among others, have shown that group liability may improve
repayment rates by alleviating imperfections in the credit market. However, whether group
liability outperforms other contract structures remains an open question in the microfinance
literature. For example, Besley and Coate (1995) point out in their model that if borrowers
cannot repay as a group, then some group members will not find it worthwhile to contribute
their share of repayment, even though they would have repaid under individual lending.
Inconclusive empirical evidence accompanies these ambiguous theoretical predictions.
Some empirical studies support the theoretical advantages of group liability. For instance,
in Bangladesh, Sharma and Zeller (1997) show that groups that were formed through self-
selection had better repayment rates; however, this study may suffer from omitted variable
biases. Other studies provide little empirical support for the theory. For example, Ahlin and
Townsend (2007) use Thai data to show that repayment rates are negatively associated with
6

social ties.
Only a handful of studies examine the merits of group liability relative to other contract
structures. Fischer (2010) conducts a series of lab experiments with actual microfinance
clients and provides evidence that contract structure affects project selection. Specifically,
he finds that group liability increases risk-taking, relative to individual liability contracts, as
borrowers free-ride on the insurance provided by their partners. In a randomized experiment
in India where borrowers were assigned to either weekly or monthly repayment meetings,
Feigenberg et al. (2010) find that more frequent repayment meetings build social capital
among borrowers, which in turn leads to reduced default.
The most relevant study on repayment rates under different loan liability structures
are Gine and Karlan (2009) and Attanasio et al. (2011). Gine and Karlan (2009) reports
evidence from two field experiments in the Philippines. In the first, borrowers who had
signed up under a group liability structure were converted to individual liability. Since both
joint and individual liability groups previously underwent the same screening, the authors can
independently identify the peer monitoring effect under group liability. However, they cannot
identify or rule out any impact of screening with this methodology. In addition, the group
repayment and monitoring mechanisms may already be entrenched and difficult to undo
even with an individual liability structure. Their second experiment randomly introduced
either group or individual liability lending to new borrowers. However, the experiment
was conducted at the loan center level and take-up was quite uneven between group and
individual loan centers, resulting in potential statistical power concerns. In both instances,
they find default rates are invariant to contract structure.
Attanasio et al. (2011) conduct a field experiment in Mongolia where villages were ran-
domly assigned to group loans, individual loans, or no loans. The authors seek to measure
the impact of individual and group loans on reducing poverty. In particular, the study finds
that clients who received group loans had higher food consumption and were more likely
to operate a business than control villages. Clients in individual-lending villages had no
7

significant increases on any of these measures. On repayment outcomes, the authors find no
significant differences in repayment rates between individual and group liability.
While loan default and repayment are the primary outcomes of interest when examining
group liability contracts, the economics literature on rotating savings and credit organizations
(Roscas) suggests that group liability may also have positive effects on savings. Bouman
(1995) argues that participating in credit and savings groups allows individuals to avoid
demands of financial support from their relatives, since contributions to a Rosca are generally
recognized by society as a senior claim. In a theoretical model, Ambec and Treich (2007)
show that Roscas may serve as a commitment device which helps people overcome self-
control problems. Gugerty (2007) provides support for this model, reporting that many
Rosca participants in rural Kenya cite “you can’t save alone” or “sitting with other members
helps you to save” as their primary motivation for participating in a Rosca.
Our paper complements Gine and Karlan (2009) by examining optimal contract structure
in an alternative setting. While the original experiment in Gine and Karlan (2009) focuses
on moving from group to individual liability contracts, we explore the reverse; that is, the
shift from individual to group liability. The following section describes the setting and our
empirical strategy in more detail.
3 Empirical Setting
Our partner institution, Saath, is a non-government organization based in Ahmedabad, India.
Founded in 1989, Saath implements development initiatives in slum communities, including
health, infrastructure improvement, and livelihood training programs. Additionally, Saath
provides credit and savings services to the urban poor through its Microfinance Unit. In 2009,
Saath Microfinance had over 6,400 active clients in 4 branches, with a savings portfolio of
INR 18 million (USD 390,000) and a loan portfolio of INR 19 million (USD 410,000).3
While Saath has provided mentoring support to community-based credit and savings
3Based on Saath’s 2008-2009 Annual Report.
8

groups since the mid-1990s, its Microfinance Unit was not formally established until 2002.
In that year, Saath integrated these credit and savings groups into its organization, as
well as registered them as cooperative societies with the Indian government. Saath also
began managing these credit and savings cooperatives at this time, giving way to the Saath
Microfinance Unit. Today, Saath Microfinance provides various financial services to slum
communities, including voluntary savings accounts, compulsory savings accounts, and group
liability loans.
3.1 Savings Products
Since its inception in 2002, Saath Microfinance has been offering voluntary savings accounts
to its clients. These voluntary savings earn an interest of 6% per year and do not have a
minimum balance. As the name suggests, members are not obliged to make regular deposits
in voluntary savings accounts. Any amount may be deposited, but only six withdrawals per
year may be made.
In November 2007, Saath Microfinance initiated compulsory savings accounts among its
members. Specifically, members are required to deposit INR 100 (USD 2) every month into
compulsory savings accounts, for the duration of their membership with Saath Microfinance.
Clients may withdraw any amount from their compulsory savings at any time, as long as
a minimum balance of INR 3,500 (USD 70) is maintained. Similar to voluntary savings,
compulsory savings earn an interest of 6% per year. Any amount which the client deposits
over the compulsory savings of INR 100 is deposited in the client’s voluntary savings account.
The goal of the compulsory savings account is to allow clients to build a financial buffer
stock against adverse shocks, and to provide low-cost capital to Saath. These compulsory
deposits were mandated of all borrowers, independent of the switch to group liability loans.
Hence, all outstanding loans under both individual and group liability were required to make
compulsory deposits after November 2007. In Section 5, we compare the adherence to these
compulsory deposits for the same person as she moves from individual to group liability.
9

3.2 Loan Products
In addition to savings products, Saath Microfinance provides loans for asset creation (e.g.
house repairs), production (e.g. business working capital), and consumption (e.g. health,
social functions). From its beginnings in 2002 until November 2007, Saath provided credit
through individual liability loans. Beginning in November 2007, Saath discontinued individ-
ual liability loans, offering instead group liability loans to members applying for credit.
Under the individual liability loan model, a client was required to have been a member
of Saath for at least six months with a savings account in order to be eligible for a loan.
Members could borrow up to three times their savings account balance, at an interest rate
of 18% per year.4 These individual-liability loans generally require no collateral; however,
each loan applicant must meet two requirements. First, the loan applicant must have two
“guarantors” who also have a savings account with Saath. Second, the combined savings
balances of the loan applicant and the two guarantors must be greater than or equal to
the loan amount applied for. Although guarantors are in principle required to maintain
these savings balances through the duration of the loan, in practice this rule was not strictly
enforced. Guarantors are not eligible for a loan until the loan they guaranteed has been fully
repaid, but loan repayment is the sole responsibility of the borrower. Borrowers are required
to make monthly installments which cover principal and interest. The monthly principal
installment is a fixed amount, and since the interest rate is declining balance, the total
installment amount (principal plus interest) varies every month. If the borrower defaults,
Saath reserves the right to seize the borrower’s savings, and if this amount is not enough to
cover the loan, Saath reserves the right to take the guarantor’s savings as well. However, in
practice, as an NGO whose mission is to empower the poor, Saath never seized any of its
individual borrowers’ or guarantors’ savings.
4Microfinance organizations typically quote interest rates in one of two forms: “declining,” the standardused in developed markets, where the amount of interest due each period is calculated based on the interestrate and the remaining principal, and “flat,” where the interest payments are calculated using the originalprincipal amount. Thus a 10% “flat” rate is significantly higher than a 10% “declining” rate. Saath quotesrates using the standard declining balance approach.
10

With the group liability model, on the other hand, Saath extends credit to groups of
individuals at an interest rate of 24% per year. Four loan size categories are available to
clients: (1) Rs. 3,000-5,000, (2) Rs. 6,000-10,000, (3) Rs. 11,000-20,000, and (4) Rs. 21,000-
30,000. These groups form primarily through self-selection with joint applications submitted
to Saath. Groups are composed of three to six individuals, all of whom must be Saath
Microfinance members. Within each group, several criteria must be fulfilled. First, at least
50% of the group must have been Saath Microfinance members for at least 6 months with at
least a savings account. Second, at least 50% of the group must be female. Third, relatives
or individuals from the same household are not allowed in the same group. And finally, loan
terms must be homogenous across group members; that is, the number of installments as
well as the monthly installment due dates must be the same, and the loan amount must not
vary widely within each group. As in the individual liability model, group liability borrowers
are required to make monthly installments for both principal and interest, although in this
setting, total installment amounts (principal plus interest) are equated every month. (In the
individual liability model, the monthly principal installment repayment was fixed, but the
interest and therefore installment size varied each month.) Before any loans are disbursed,
group members are also required to sign a “mutual agreement form,” stating that they are
liable to pay each other’s debt in the event of default or delinquency. Borrower groups who
have defaulted or are delinquent are no longer eligible to receive another loan from Saath.
3.3 Shift from Individual to Group Liability
Saath’s decision to shift from offering individual liability to group liability loans in November
2007 was due to a change in the management’s priorities. Saath wanted to lend to more
people, provide larger loan amounts, and expand its microfinance operations geographically,
but its lending activities had become stagnant under the individual liability model. In par-
ticular, the “guarantors” requirement for individual liability loans restricted credit eligibility,
as Saath had already reached a point where almost all of its members were either borrowers
11

or guarantors. Additionally, savings clients were reluctant to stand as guarantors for another
client’s loans, and loan amounts were limited to 3 times the total savings account balance
of the borrower. Saath management thus shifted to group liability loans to overcome the
restrictions in its individual liability model. In terms of the models discussed above, the
limited ability of Saath members to pledge savings as a collateral prevented Saath from ex-
panding, and it saw group liability as a way to solve this problem. In the year following this
change, Saath gained almost 800 new clients and increased its reach from 11 to 20 wards.
The transition from individual liability to group liability loans was implemented with the
following rule. Beginning in November 2007, all new loans disbursed were group liability
loans; Saath would no longer disburse individual liability loans. However, existing loans
whose term lasted beyond November 2007 were unaffected. For example, individual liabil-
ity loan clients who completed their loan in February 2008 continued under the individual
liability contract until then, and following February 2008 would receive a group liability
loan should they borrow again. The date of switching from individual to group liability
was therefore determined by individual liability loan completion dates. These completion
dates and subsequent conversion to group liability loans were distributed relatively uniformly
throughout the year.
Although Saath’s loan product moved from individual to group liability beginning in late
2007, the location where repayments are made, the frequency of loan repayment collection,
and the salaries for field officers remained similar across time in our dataset. An empirical
concern for the analysis to follow is whether Saath’s policy shift from individual to joint
liability was also accompanied by a shift in their loan collection techniques. In June 2010,
we conducted a short interview of Saath field officers regarding repayment collection. We
were able to interview 10 out of the 12 Saath field officers who collected repayment among the
sample of clients we study, while the remaining field officers are no longer with Saath. Results
from this survey confirms that the location and frequency of loan repayments remained the
same across the two settings; specifically, for both individual and group liability loans, we
12

find that field officers collected repayment at the client’s household, every month, 100% of
the time. Additionally, 90% of the time under both regimes, the lender turned down future
loan requests by defaulting clients.
For group liability borrowers, Saath does not require groups to designate one of its mem-
bers as a “group leader,” but in practice, all groups have a leader who is in charge of collecting
repayments from other members. Hence, among individual borrowers, field officers visited
each borrower, while among group borrowers, field officers typically visit only the group
leader’s household. If any member of a particular borrower group fails to make a scheduled
payment, the field officer assembles all group members together and collects the installment
amount from the other members as stipulated in the group liability contract. Both individual
liability borrowers and joint liability borrower groups in default are not granted any loans
in the future. In addition, over the period we study, there was no change in wages among
field officers, who continued to receive a fixed monthly sum.5
In summary, borrowing conditions changed in the following ways: (1) borrowers were
obliged to enter joint liability lending groups, rather than borrowing on their own from
Saath; (2) the loan officers collected repayment from the group leader, rather than from each
individual borrower; (3) monthly installments became fixed, rather than varying, and (4)
the interest rate increased from 18% to 24%. Given that multiple dimensions of the contract
structure were changing, we discuss the implications of each of these changes on our analysis
in Section 5.2.
4 Data Collection and Summary Statistics
In this study, we use data from Saath Microfinance’s administrative software systems. The
loan data cover outstanding loans every month from April 2005 through March 2009. Since
the change in the type of loan contract occurred in November 2007, the data contain over
5After March 2009 field officers received 1% of the loan interest they collect. Surveys of field officersindicate that they were not aware of this change in compensation structure before it occurred. Nevertheless,to isolate the focus of our study on contract structure, we exclude months after March 2009 in the analysis.
13

two years of monthly data on individual liability loans and over one year on group liability
loans. Data are available electronically from only 2 out of 4 Saath Microfinance branches,
Behrampura and Vasna, and we focus on these. They are the two largest branches, and the
oldest, accounting for the vast majority of Saath’s clients.
The data were maintained for accounting purposes, recording cash flowing in and out
of each branch. They are therefore of very high quality. They do not, however, contain
information on the terms of each loan, such as maturity dates, installment amounts, and
amounts outstanding. These data were recorded by loan officers in client passbooks and
administrative ledgers. As a result, we are unable to look at overdue amounts, prepayments,
and other similar measures.6
While the data on loans cover April 2005 to March 2009, the savings data were only
available from January 2008 to March 2009. The savings data include monthly aggregate
deposit and withdrawal amounts, for compulsory savings accounts.
As previously described, in our main analysis we study borrowers who have received both
individual and group liability loans to overcome the selection problem. Hence, in our dataset,
these clients begin with an individual liability loan, and after November 2007, receive a group
liability loan. Within Saath’s Behrampura and Vasna locations, we find a sample of 276 such
clients, representing 22% of the loan client base in these two branches as of March 2009.
Table 1 provides summary statistics for our sample. Collectively, these clients received a
total of 748 loans from Saath, of which 450 are individual liability loans and 298 are group
liability loans. The average individual liability loan amount is about INR 10,000 (USD
220), and about INR 18,000 (USD 390) for group liability loans. Figure 1 plots the number
6The loan data come from three software systems which Saath Microfinance has used at different pointsin time. Each of the two branches in our dataset used a separate system until early 2008, when the currentsystem was introduced in both branches. Because client identifiers were not carried over from one softwaresystem to another, we had to rely on using client names to track individuals over time. These names wereunique since they included first, middle, and last names. In identifying clients across systems, 80% of theclients had exact name matches, while 14% had to be matched by hand due to name spelling errors. Theremaining 6%, on the other hand, could not be matched to the current software system. It is likely thatthese clients have withdrawn their membership with Saath Microfinance and therefore have not borrowedunder the group liability setting, since Saath migrated information from the previous to the current softwaresystem only for existing members.
14

of group liability loans that are disbursed over time. As the figure shows, the borrowers
in our sample, all of whom received individual liability loans, switched to group liability
loans at varying months. Our empirical strategy takes advantage of this staggered timing,
comparing individual liability loan clients who have already received group liability loans to
future recipients, to identify the impact of group liability on loan repayment behavior and
savings discipline.
5 Empirical Strategy and Analysis
5.1 Empirical Strategy
To study the effect of contract structure on lending outcomes, we exploit the natural exper-
iment provided by Saath’s change in policy. The presence of an exogenous policy change
is important. Without exogenous variation, it would be very difficult to know whether
differences in outcomes were attributable to contract structure or to any number of other
unobservable characteristics of borrowers or lending institutions. Indeed, theory predicts
that different contracts will be optimal for different types of borrowers.
To overcome the selection problem, we focus our attention on borrowers of Saath who
received both individual and group liability loans. We exploit the natural phasing-in of
group liability, in what amounts to a repeated difference-in-difference framework. At any
particular point in time, our “treatment” group then consists of clients who have fully repaid
their individual liability loan and currently have a group liability loan, while our “control”
group consists of individual liability loan clients who will eventually convert to a group
liability loan. Specifically, we estimate the following equation:
yilt = α + βTil + γi + δt + εilt (1)
where the subscript i refers to individuals, l refers to loans, and t refers to months. T is
15

a dummy variable equal to 1 if loan l of client i is a group liability loan, and 0 if it is
an individual liability loan. yilt is a measure of loan repayment or savings discipline. The
estimate of β then provides the effect of switching to group liability loans for individuals who
are already borrowing. We include time effects δt since conversion to group liability loans
was staggered across individuals, and the individual fixed effects γi absorb time-invariant
characteristics of each borrower.
5.2 Limitations
In what follows, we note some features of our setting which may limit the generalizability of
the empirical results.
5.2.1 Concurrent Changes in Loan and Savings Products
As discussed in Section 3.3, the shift from individual to group liability lending contracts
was accompanied by other changes in contract features. Specifically, in the group liability
setting, the loan officers collected repayment from the group leader, rather than from each
individual borrower; monthly installments became fixed, rather than varying; and the interest
rate increased from 18% to 24%. Furthermore, simultaneous with the change to joint liability
loan products, savings rules shifted as well, since Saath began requiring all of its members
to keep compulsory savings accounts.
In our view, an ideal experimental evaluation would have included (1) obliging borrowers
to enter joint liability lending groups, rather than borrowing on their own, and (2) loan offi-
cers collecting repayment from the group leader, rather than from each individual borrower,
and would have left installment sizes and the interest rate fixed. Group lending contracts
offered by the majority of MFIs in India collect repayment either from one person—an as-
signed leader—or from every borrower in the group at the same time. Hence, the change in
mode of payment, we believe, is a feature of the group liability contract.
While the interest rate change and the change in monthly installments are not typical, our
16

regression coefficients estimating the impact of the contract change are likely lower bounds.
The increase in interest rate could in theory have several effects: a price effect might reduce
demand, while the higher interest rate could increase repayment burden and induce default.
Most evidence suggests microfinance borrowers are not very price elastic, so we are not
too concerned about demand effects. The increase in interest rate should bias us against a
finding that joint liability lending reduces default. Furthermore, our empirical analysis only
considers individuals who borrowed under both the individual and group liability regimes,
thus accounting for any self-screening among clients based on the increase in interest rates
between the two loan contracts.
The change in monthly repayment installments and mode of payment also bears further
discussion. The repayment schedule for individual liability loans required fixed principal
repayments, along with interest. Hence, the nominal size of the monthly payments declined
over the cycle of the loan. In contrast, the group liability repayment structure is based on a
fixed monthly repayment throughout the term of the loan. Since our analysis focuses on the
shift from individual to joint liability loans for the same person, for the same loan amount we
are picking up the effect of a lower payment under individual liability (since the borrower is
at the end of her loan cycle) vs. a relatively higher fixed payment under joint liability. This
should bias us against finding a reduction in default. This bias effect is likely even greater
in our case because the average loan size and corresponding repayment installment size is
higher under joint liability.
The mode of payment also shifted under the individual and group liability settings. In
the former, the field officer visited each individual liability borrower to collect repayment,
while in the latter, the field officer only visited the group leader, who is in charge of collecting
repayment from the other members. Nevertheless, this change in the mode of payment is a
feature of group lending, since in the setting we study, group liability is a lending contract
which involves both joint repayment to a group leader and joint liability. Thus, the “group”
features, such as repayment to a group leader, may lower default, while the higher interest
17

rates may increase default, so the effect we capture may well be a lower bound.
Saath’s savings products also changed during our study period, as discussed in Section 3.1.
However, we note first that in our main analysis on loan repayment and savings discipline,
we focus only on individuals who converted to group liability loans, exploiting the timing of
their switch. Doing so allows us to control for any changes that occurred at the microfinance
institution level under the two loan contract regimes. In the context of the MFI-wide change
in savings requirements, we are in other words comparing a shift from individual to joint
liability for the same person (when we include individual fixed effects) facing mandatory
savings under both liability structures. Since our empirical strategy rests on the continuous,
rolling changeover from individual to joint liability after the announcement, our sample
consists of borrowers who are opening and maintaining mandatory savings accounts prior
to shifting to a joint liability loan. While the introduction of a mandatory savings account
may have influenced the composition of borrowers, the internal validity of our results remain
unaffected, since our analysis considers only those individuals who chose to renew their loans
with Saath.
Theoretically, the imposition of mandatory savings could have two opposing effects: (a)
it could discourage borrowers from renewing their loans since the real cost of borrowing has
gone up with the imposition of a mandatory savings plan; or (b) it could encourage borrowers
to renew their loans as individuals appreciate the saving discipline that compulsory accounts
provide. This latter point is not trivial. Individuals may fail to save enough because they
consistently put off savings to their future selves (Laibson, 1997), may be tempted to spend
on immediate consumption (Banerjee and Mullainathan, 2010), or may face intra-household
constraints (Ashraf et al., 2010). In a recent field experiment, Atkinson et al. (2010) find
that prompting individuals to save at the time of loan repayment doubles the amount of
savings.
The overall effect of mandatory savings on borrower selection is therefore ambiguous,
and unfortunately we lack any household level data to be able to empirically differentiate
18

these effects. In addition, we only have basic socioeconomic data from Saath records for
clients who eventually joined joint liability groups. Nevertheless, we run a simple regression
of renewal on percentage payments missed and find a strong statistically significant negative
coefficient. Hence, clearly, there is screening based on past loan performance. However, we
also find that this screening happened even for previous individual-to-individual renewals,
and therefore cannot be considered an effect of joint liability or mandatory savings.
5.2.2 External Validity
Our study sample consists of individual borrowers who have repaid their individual loan and
choose to borrow under joint liability. We therefore estimate the effect of joint liability on
improving repayment rates among those who would choose to borrow under joint liability.
While restricting our analysis to this sample may compromise external validity, we believe
this is a highly relevant sample: measuring the effect on those who decline to borrow under
joint liability would have little relevance for the outside world. Of course, the sample is
also selected on individuals who chose to borrow in an individual liability setting. However,
given that most theory suggests that joint liability leads to stricter screening and stricter
monitoring, this additional screen may not be that restrictive.
While the setting we study may be anomalous in that the typical transition in the mi-
crofinance industry at present is the reverse, we believe that carefully studying the effects
of shifts in liability, in either direction, is informative and valuable. Indeed, the recent col-
lapse of Banco del Exito (BANEX), one of the largest microlenders in Nicaragua, highlights
the importance of examining the relative merits of group liability and individual liability
contracts. Furthermore, the main question that we ask—that is, conditional on borrowing,
whether liability rules impact repayment performance—is of important policy and theoretic
interest, as we consider how joint liability lending may improve on individual liability lend-
ing. It is difficult to imagine how any single study could capture both the compositional
effects and the effect of contract structure on those who have borrowed in individual and
19
joint liability settings.
By focusing on clients who borrowed under both individual and joint liability, our study
further highlights the importance of examining the impact of lending contracts on financial
inclusion. In the setting we study, almost 80% of borrowers who completed their individual
liability loan and could have borrowed under joint liability did not do so. While this indicates
that it is possible for the shift in joint liability to have negative consequences on financial
inclusion, we do not have data on why people choose or don’t choose to borrow with Saath.
On the one hand, many new clients (who had not previously borrowed under individual
liability) joined Saath after joint liability may have chosen to stop borrowing for a number
of reasons (e.g. no further project/investment needs, shifting business or employment status).
Without further data, we cannot determine the impact of joint liability on financial inclusion.
Finally, while we do find strong evidence that joint liability improves upon individual
liability lending in terms of repayment behavior, we cannot be certain that the treatment
effect would be similar for other MFIs. The MFI we study, Saath, has operations that are
fairly typical of small MFIs around the world. But on the other hand, we also evaluate a
particular joint liability lending program, wherein borrower groups have a group leader who
collects repayment for her group, as opposed to public repayment (e.g. at the village center),
which is the collection method that is perhaps more common among other MFIs. In this
sense, the external validity of our findings may be limited.
5.2.3 Data Limitations
Since the data that are available were used primarily for accounting purposes, the dataset
does not contain information on the terms of each loan, such as maturity dates, installments
amounts, and outstanding loan amounts, all of which were recorded by loan officers in paper
ledgers. Thus, our analysis is limited to observing whether a client made a loan repayment or
a compulsory savings deposit for a particular month, and we are unable to look at outcomes
on overdue loan amounts, prepayments, and other measures. Furthermore, aside from data
20

on gender and the client’s neighborhood, the data does not contain other demographic or
household characteristics of clients.
Because of data limitations, our ability to understand why borrowing amounts increase is
limited. Under individual liability, borrowers were limited to loan amounts that were a fixed
proportion of their savings and their guarantors’ savings. These restrictions were removed
under joint liability and replaced with a strict appraisal process for group members. Ideally, if
we had deposit data under individual liability, we could see exactly whether these borrowing
constraints were binding under individual liability. Unfortunately, Saath did not keep good
records of this data in the past, hence, it is not possible to statistically distinguish demand
and supply effects on loan size.
5.3 Effect of Lending Structure on Loan Repayment
We now turn to the critical question of loan repayment. We note that the joint liability
structure will in theory induce not only better screening, but also greater monitoring efforts.
Our empirical design does not distinguish between the two potential causes of improved
repayment, but rather estimates the combined causal effect.
Table 2 presents OLS estimates of Equation 1, where the outcome of interest is a dummy
variable for a missed payment. This dummy variable indicates whether the client failed to
make a repayment for a particular month. Saath Microfinance clients are required to make
monthly repayments until the principal balance is paid in full, beginning 30 days following
disbursement. Hence, the dependent variable takes on the value 1 for a particular month if
the total amount repaid by the borrower for that month is nil, and 0 otherwise. We use this
dummy variable as our first measure of monthly loan repayment discipline.
In our sample, almost 20% of individual liability and only 0.1% of group liability monthly
loan repayments were not made. Our main results are presented in Table 2. Column (1)
presents regression results with no fixed-effects, controlling only for which branch a borrower
uses. Taken at face value, group lending reduces the probability of missing a payment by
21

17.5 percentage points. In columns (2)-(4), we add individual fixed effects, calendar month
fixed effects, and both sets of fixed effects, respectively. Finally, in columns (5) and (6) we
add controls for the age of the loan: repayments may be higher early in the cycle, when
borrowers are flush with cash, or later in the cycle, when borrowers seek to repay a loan in
order to obtain a new one. The coefficient drops, though only coefficients (1) and (6) have
95 percent confidence intervals which (barely) do not overlap. Because only overdue loans
last more than 12 months, loan age coefficients may “soak up” some of the treatment effect,
particularly when individual and month fixed-effects are present.7
Our preferred point estimate is column (4), which indicates that group lending reduces
the probability of a missed payment by 11.2 percentage points. This is a large and meaningful
effect, which could have significant implications for the profitability of a lender.
5.3.1 Internal Validity
We conduct a number of robustness tests. First, we report a direct “falsification” test of
our analysis by using data from our clients’ previous individual-to-individual loan renewals.
Specifically, we focus on clients in our sample who had at least two individual liability loans,
and the sample is reduced since many clients did not have multiple loans in the past. Among
these clients, we study whether borrowing experience with the microlender is related to loan
repayment; in other words, whether having a second loan causes borrowers to repay better.
Table A.1 presents these results and shows no significant effect on missed payments.8
A second concern with the internal validity of our analysis is the fact that joint liability
contracts are a completely new contractual arrangement. In particular, since the arrange-
7A simple way to address the relationship between loan age and repayment status is to to restrict thesample to the first twelve months of repayment data: doing so with the same specifications as reported inTable 2 yields point estimates ranging from -.074 to -.153, statistically indistinguishable from each other,but all statistically different from 0 at the one percent level.
8The specific date (November 2007) for the falsification test was not chosen arbitrarily (rather, it wasprecisely one year prior to the actual change in date), but we have conducted the analysis for all monthsat least one year before the policy change, and find our effect is dramatically larger than any other date.Specifically, we re-ran our specification with each of the previous twelve months as our placebo date, andfound only two cases to be significant, but of much lower magnitude.
22

ment is new, clients may be in a “honeymoon” period.9 During this period, clients may be
on their best repayment behavior while they are learning the rules of the game, but over
time, as clients gain a better understanding of the consequences of missing a payment, they
may start behaving more strategically. To test for this “honeymoon” effect, we compare the
default rates of new clients (i.e. first-time Saath borrowers) under the individual and joint
liability regimes over our sample period. Specifically, we find that first-time Saath borrowers
make late payments 49% of the time in the individual liability setting, and 2% of the time
under joint liability. Since we are comparing clients who are borrowing for the first time in
either setting, this result suggests that the “honeymoon” effect does not drive repayment
behavior of clients.
A third concern is that a client’s propensity to repay may be correlated with the time in
the loan cycle: specifically, clients may be more likely to make repayments towards the end
of their last individual liability cycle, in order to ensure eligibility for a group liability loan
in the future. We note that this would bias estimates against finding that group liability
improves borrower performance. Nevertheless, we investigate this possibility using an event-
time regression with the dependent variable for missed payment as previously described,
where the event is the conversion from an individual liability to a group liability-loan.
Figure A.1 plots the coefficients for each event-time dummy. The first month of repayment
in the group liability setting is at time = 0, the final repayment month in the individual
liability loan is at time = −1, the second to the last individual liability loan repayment
month is at time = −2, and so on. Thus, the figure describes loan repayment behavior
under the individual liability contract, before switching to group liability. Saath requires
its borrowers to pay their current loan in full before they are given their next loan, so by
definition, all clients in our sample made a repayment at time = −1. Examining the periods
where time ≤ −2 shows no pattern supporting the idea that clients strategically repaid their
individual liability loan so that they may borrow under the group liability setting.
9We thank an anonymous referee for raising this point.
23

Alternatively, clients may be more likely make repayments early on in the loan cycle,
as they may be flush with cash from a recent loan disbursal. We examine this possibility,
again using an event-time regression, as shown in Figure A.2. We estimate how repayment
rates change around loan renewal times when a client pays off an individual liability loan
and renews for another individual liability loan (blue line), and for the cases when a client
pays off a group liability loan and renews for a second group liability loan (red line). Note
that the first month of repayment in the second loan cycle is at time = 0, and the final
repayment in the first loan cycle is at time = −1. Similar to Figure A.1, at time = −1, all
clients made a repayment by definition, so the missed payment dummy must mechanically
equal zero. Figure A.3 shows that prior missed payments are uncorrelated with the number
of months since loan origination.
Our study sample consists of individual liability clients who chose to renew their bor-
rowing under the group liability setting. These clients may be better at repayment than
borrowers who did not want to enter into a group liability loan contract. However, our anal-
ysis focuses exclusively on those who renew and includes individual fixed effects. Hence, an
interpretation of our results is that even “good” clients exhibited higher repayment discipline
under the group liability setting, in comparison to the individual liability setting. However,
we also acknowledge that by focusing only on those clients who borrowed under both types
of contracts, we limit the external validity of our results.
The outcome we have considered thus far, whether the client missed a loan installment
for a particular month, is a rough measure since repayments may be partial. That is, a
client may have repaid an amount greater than zero, but this amount may be less than the
required installment amount. Another measure of repayment discipline, then, is the standard
deviation of principal amount repaid for individual liability loans and total amount repaid for
group liability loans. As described in Section 3, the principal installment amount was fixed
in the individual liability setting, whereas in group liability, the required total installment
amount (principal plus interest) was equated every month. If the required amount is repaid
24

each month, then the standard deviation would be zero. However, if there are many months
where people pay less or more than the required amount, then the standard deviation would
be higher. Table A.2 provides OLS estimates where the dependent variable is the standard
deviation of repayment. Again, our estimates show that there is greater loan repayment
discipline in the group liability setting relative to individual liability, although this effect is
not statistically significant.
Finally, we note that the average loan size increased from 10,000 INR under individual
liability to 18,000 INR under joint liability (see Table 1). This increase is large and warrants
further discussion. In some ways, it can be thought of as an effect of the group lending
model, as Saath was willing to extend larger loans to borrowers on the strength of social
collateral. Indeed, Saath management told us that they were willing to give larger loans
precisely because of the joint liability framework.
However, one may reasonably wonder whether the increase in loan size itself affects
repayment rates. For example, if borrowers invest in convex production technologies, higher
credit limits themselves could increase repayment. We test for this in two ways. First, we split
the sample into four quartiles, based on the percentage increase in credit limit a borrower
benefited from as she or he converted to joint liability lending. We do not observe systematic
variation in the treatment effect estimate along this dimension (results not reported). Second,
because our dataset includes the reported purpose of each group liability loan, we can conduct
separate analyses for loans taken for the purpose of consumption, productive activities, and
asset creation. Again, we find no evidence the treatment effect varies across these three
categories (results not reported).
5.3.2 Discussion
Given these results, a natural question that arises is why group liability outperforms indi-
vidual liability for clients who are already borrowing. Although the guarantors requirement
in individual liability contracts provided incentives for guarantors to monitor loans and en-
25

force repayment, these incentives in practice were quite weak: the microlender rarely seized
the savings of guarantors of defaulting clients, and did not strictly enforce that guaran-
tors maintain their savings account balance. The microlender collected repayment from the
guarantors only if all other options (e.g. seizing the defaulting borrower’s savings, revisiting
the defaulting borrower, threatening to charge penalties, rescheduling the loan, having the
branch manager intervene) have been exhausted. In contrast, the group liability structure
strengthens cooperation and trust among group members, as indicated by the fact that al-
most all joint liability borrower groups designate a group leader even though it is not required.
It is possible that having a group leader increases incentives for monitoring and enforcing
repayment. For example, having a group leader perhaps creates a person of authority who
can enforce repayment or impose sanctions in the event of default.
We also note that the borrowing requirements for individual liability loans suggest that
the effects we find would likely be smaller in magnitude had such requirements not been in
place. Since individual liability loan borrowers must have two guarantors and Saath may use
guarantors’ savings in the event of default, it is possible that these requirements encourage
the screening of potential individual liability loan borrowers; we are not able to control for
such effects.
5.4 Savings Discipline
We now turn our attention to the compulsory savings deposits required by Saath. As dis-
cussed in Section 2, we might expect savings to be higher in the joint liability setting, since
participating in a borrower group may allow individuals to avoid financial demands from
their families, or to overcome self-control problems. Furthermore, compulsory savings is re-
quired to continue as a member in good standing with Saath, as those who do not meet the
compulsory savings requirements are not allowed to borrow until these requirements have
been met. Thus, the same form of peer pressure that applies to loan repayment may apply
to compulsory savings as well.
26

Although Saath initiated both a shift to group liability lending and compulsory deposits
at the same time in November 2007, we can separately identify the effect of group liability
on compulsory savings by exploiting the time-series variation in loan renewals. Specifi-
cally, while the compulsory savings were mandated across the board for all borrowers post-
November 2007, the shift from individual to group liability was staggered, depending on when
each individual loan term expired. As explained earlier, these renewals were distributed rel-
atively uniformly throughout the year, resulting in variation in loan contract at a time where
compulsory savings was uniform. Hence, we can study the adherence to compulsory savings
for the same person who was borrowing under an individual liability contract post-November
2007 and who eventually converted to a group liability contract.10
Table 3 presents OLS estimates where our dependent variable is a dummy for missing
a compulsory savings deposit. The dependent variable takes on the value 1 if the client
deposited less then INR 100, and 0 otherwise. The point estimate in column (4), which in-
clude month and individual fixed effects, indicates that the same borrower is 20.5 percentage
points less likely to miss a compulsory deposit when in a group lending arrangement than
when borrowing individually.
This suggests that one possible mechanism through which group liability reduces loan
delinquency may be increased savings: a greater savings balance may provide a buffer for
borrowers hit with liquidity shocks.
5.5 Heterogenous Effects
We test for heterogenous effects along two dimensions. As before, our dependent variable is a
dummy for whether a client missed a loan repayment for a particular month. Columns (1)-(3)
indicate a significantly larger impact of group liability in reducing missed payments among
men, although the effect for females is still negative and significant. It is important to note,
10Since we only have savings data from January 2008 onwards, we cannot study the effect of compulsorysavings under the individual liability setting, as we have no pre-period data (i.e. savings data pre-November2007).
27
however, that the control group means for females are also significantly lower, with missed
payment rates at 16 percent for females and 23 percent for males.11 The results suggest that
group liability effectively neutralizes this gender differential in missed payments.
In columns (4)-(6), we examine whether group lending improves repayment behavior more
for clients who initially exhibited poor repayment discipline under individual liability. We
define ‘borrower quality’ as the percentage of missed payments in the client’s first individual
liability loan in the data, and we split the sample in two along this measure. Note that since
our definition of borrower quality makes use of a client’s repayment behavior in her first
individual loan, the regressions columns (4)-(6) are restricted to the subsample of clients
who had at least two individual loans, and include repayment data only from the client’s
second individual loan onwards.
In terms of past missed payments, we find that group liability has a larger impact on
borrowers who, at the outset, were of poor quality: clients who missed 10 percent of their
first individual loan monthly payments are 2.4 percent less likely to miss repayments under
the group liability regime. Hence, similar to the gender results, the introduction of group
liability is effective in reducing missed payments among those with inconsistent payment
records.
6 Discussion and Conclusion
Microfinance has reached over 150 million borrowers worldwide and is growing at a 40 percent
cumulative average growth rate. Recent initial public offerings (IPOs) which valued the
Mexican microfinance institution Compartamos at $2 billion, and SKS in India at $1.5
billion, have attracted the attention of global financial markets. Yet, there have also been
spectacular failures, such as the collapse of Banco del Exito (BANEX), which with a $125
million dollar loan portfolio was recently the largest micro and small and medium enterprise
lender in Nicaragua. Suffering from a 45 percent delinquency rate, it was ordered into
11A difference in means test is significant at the 1 percent level.
28

liquidation.12
As many microlenders around the world weaken their group liability approach and shift
towards individual lending, understanding the role of group liability in enhancing perfor-
mance has become a critical question in microfinance programs, moving forward. Yet, the
empirical literature provides little guidance for policy makers and microfinance practition-
ers, since few empirical studies have examined group liability contracts with other lending
strategies.
In this paper, we exploit an exogenous change in liability structure in an Indian mi-
crofinance program, where the program shifted from individual liability to a group liability
structure. We find evidence that for the same borrower, the shift to group liability reduces
default rates and improves savings discipline. Under the group liability setting, required
monthly loan installments are 11% less likely to be missed and compulsory savings deposits
are about 20% less likely to be missed, relative to individual liability. Thus, our findings
indicate that group lending outperforms individual lending in loan repayment and savings
discipline.
We see our study as an important piece of evidence, rather than a definitive answer
to the question of optimal lending structure for microfinance. The microlender we study,
Saath, has operations that are fairly typical of MFIs that lend in urban areas. Moreover,
the management, infrastructure, and stated goals of Saath are not markedly different from
lenders throughout India, or other MFIs in low-income settings. Saath’s most remarkable
characteristic is probably its small size, as the microfinance industry includes an important
right tail of very large lenders. Yet, small institutions like Saath (an NGO with $410,000
dollars in total loan portfolio as of 2009) make up a non-trivial portion of the industry.
Second, as with any natural experiment, we caution that there are limitations to our
study: our sample consists of only those who elected to continue from the individual to
group lending model and thus may not be representative of the entire population that would
12See: http://financialaccess.org/node/3547
29
be effected by changes in lending models; we are unable to clearly identify the mechanisms
through which group lending improves repayment; and our data are not sufficient to allow us
to precisely calculate the effect of lending structure change on lender profitability. An ideal
experiment to answer these questions might have randomly assigned individuals to a range
of different lending models, such as group lending with self-selected group members, group
lending with randomly assigned group members, and group lending without group liability.
It may be nevertheless useful to discuss our view of the mechanisms at work, based on
our reading of the evidence, and on numerous conversations with Saath clients, staff, and
management. We think peer pressure is important. The Saath operations manual itself
stated, “The concept of peer pressure must be executed properly in favor of the organization
and concept of micro finance,” arguing that the group leader should take responsibility for
ensuring members repay, and stressing the importance of joint liability. In case of repeated
missed payments, the manual instructed staff to ensure “the members take the responsibility
of closing the loan amount of” a delinquent borrower. We also interviewed 10 Saath field
officers about how the loan collection process changed with group lending. All ten field
officers mentioned that collection under joint liability was easier, because clients were more
disciplined about paying on time, and several others mentioned the importance of “collec-
tive responsibility” within the group. These qualitative reports are consistent with a recent
paper on microfinance in Andhra Pradesh, which finds that peer pressure was an important
determinant of loan repayment (see Breza (2012)).
Taken in their whole, we believe our results should provide a cautionary tale for policy-
makers and microfinance institutions eager to convert from group to individual lending mod-
els. While most microfinance organizations around the world have reported repayment rates
that are impressively high, the industry has also witnessed both idiosyncratic failure and
more widespread collapse, such as the recent crisis in Andhra Pradesh. Our results highlight
the importance of the group lending structure in facilitating sustainable provision of credit
to the poor. Our findings suggest a need for further research, to identify the precise mech-
30

anisms of how joint liability affects borrower behavior, the role of savings as a mechanism
for improving repayment, and the relative merits of peer screening versus peer monitoring
under group liability contracts. Finally, it would be useful to understand whether the group
lending structure itself could be improved upon, perhaps by introducing some formal group
or sub-group level repayment incentives or insurance mechanisms.
References
Ahlin, C., Townsend, R. M., February 2007. Using repayment data to test across models of
joint liability lending. The Economic Journal 117 (517), F11–F51.
Ambec, S., Treich, N., 2007. Roscas as financial agreements to cope with self-control prob-
lems. Journal of Development Economics 82 (1), 120–137.
Armendariz de Aghion, B., 1999. On the design of a credit agreement with peer monitoring.
Journal of Development Economics 60 (1), 79–104.
Armendariz de Aghion, B., Morduch, J., 2010. The Economics of Microfinance. MIT Press.
Ashraf, N., Karlan, D., Yin, W., March 2010. Female empowerment: Further evidence from
a commitment savings product in the philippines. World Development 38 (3), 333–344.
Atkinson, J., de Janvry, A., McIntosh, C., Sadoulet, E., 2010. Creating incentives to save
among microfinance borrowers: A behavioral experiment from guatemala. Working paper.
Attanasio, O., Augsburg, B., Haas, R. D., Fitzimons, E., Harmgart, H., 2011. Group lending
or individual lending? evidence from a randomized field experiment in mongolia. IFS
Working Paper No. W11/20.
Banerjee, A., Besley, T., Guinnane, T., 1994. Thy neighbor’s keeper: The design of a credit
cooperative with theory and a test. Quarterly Journal of Economics 109 (2), 491–515.
31

Banerjee, A., Duflo, E., Glennerster, R., Kinnan, C., 2009. The miracle of microfinance? Ev-
idence from a randomized evaluation. Department of Economics, Massachusetts Institute
of Technology (MIT) Working Paper.
Banerjee, A., Mullainathan, S., 2010. The shape of temptation: Impications for the economic
lives of the poor. Working paper.
Banerjee, A. V., Newman, A. F., April 1993. Occupational choice and the process of devel-
opment. Journal of Political Economy 101 (2), 274–98.
Beck, T., Demirguc-Kunt, A., Maksimovic, V., 2005. Financial and legal constraints to
growth: Does firm size matter? The Journal of Finance 60 (1), 137–177.
Beck, T., Demirguc-Kunt, A., Martinez-Peria, M. S., 2007. Reaching out: Access to and use
of banking services across countries. Journal of Financial Economics 85 (1), 234–266.
Besley, T., Coate, S., 1995. Group lending, repayment incentives and social collateral. Journal
of Development Economics 46 (1), 1–18.
Bouman, F. J. A., 1995. Rotating and accumulating savings and credit associations: A
development perspective. World Development 23, 371–384.
Breza, E., 2012. Peer effects and loan repayment: Evidence from the krishna default crisis.
Working Paper.
Cetorelli, N., Gambera, M., 2001. Banking market structure, financial dependence and
growth: International evidence from industry data. The Journal of Finance 56 (2), 617–
648.
Chen, G., Rasmussen, S., Reille, X., February 2010. Growth and vulnerabilities in microfi-
nance. CGAP Focus Note No. 61.
Daley-Harris, S., 2009. State of the Microcredit Summit Campaign Report 2009. Washington,
DC: Microcredit Summit Campaign.
32

Feigenberg, B., Field, E., Pande, R., 2010. Building social capital through microfinance.
NBER Working Paper No. 16018.
Fischer, G., 2010. Contract structure, risk sharing and investment choice. LSE Working
Paper No. EOPP/2011/23.
Ghatak, M., 2000. Screening by the company you keep: Joint liability lending and the peer
selection effect. Economic Journal 110 (465), 601–31.
Gine, X., Karlan, D., November 2009. Group versus individual liability: Long term evidence
from philippine microcredit lending groups. Working Paper.
Gugerty, M. K., January 2007. You can’t save alone: Commitment in rotating savings and
credit associations in kenya. Economic Development and Cultural Change 55 (2), 251–282.
Laibson, D., 1997. Golden eggs and hyperbolic discounting. Quarterly Journal of Economics
112, 443–477.
Morduch, J., December 1999. The microfinance promise. Journal of Economic Literature
XXXVII (4), 1569–1614.
Rajan, R., Zingales, L., 1998. Financial dependence and growth. American Economic Review
88 (3), 559–586.
Sharma, M., Zeller, M., 1997. Repayment performance in group-based credit programs in
bangladesh: An empirical analysis. World Development 25 (10), 1731–42.
Stiglitz, J. E., 1990. Peer monitoring and credit markets. World Bank Economic Review
4 (3), 351–366.
World Bank, 2008. Finance for All? Policies and Pitfalls in Expanding Access. World Bank:
Washington, DC.
33

Funding
This work was supported by the World Bank Gender Action Plan; and the HBS Division of
Faculty Research and Development to S.C.
Acknowledgements
This project is a collaborative research effort with Saath Microfinance. We thank Saath,
Xavier Gine, David McKenzie, Petia Topalova, and workshop participants at the World
Bank for helpful comments and suggestions. Stuti Tripathi and the Center for Microfinance
at IFMR provided excellent research assistance. F.C. acknowledges support from the NSF
Graduate Research Fellowship Program.
34

Table 1: Summary StatisticsThis table reports summary statistics for borrowers in our sample. These borrowers receivedboth individual liability and group liability loans.
Individual Liability Group LiabilityBranch Total No.
of ClientsTotal No.of Loans
No. ofLoans
Ave. LoanAmt (Rs.)
No. ofLoans
Ave. LoanAmt (Rs.)
Behrampura 198 512 303 9981.1 209 19081.34Vasna 78 236 147 9927.211 89 16764.04
Full Sample 276 748 450 9963.014 298 18389.26
35

Table
2:
Dep
endent
Vari
able
:M
isse
dP
aym
ent
Dum
my
This
table
rep
orts
resu
lts
from
OL
Sre
gres
sion
sw
ith
pan
eldat
afr
omA
pri
l20
05to
Mar
ch20
09,
wher
eth
edep
enden
tva
riab
leis
adum
my
for
mis
sing
apay
men
t.T
his
dum
my
take
son
the
valu
eof
1fo
ra
par
ticu
lar
mon
thif
the
tota
lam
ount
repai
dby
the
bor
row
erfo
rth
atm
onth
isnil,
and
0ot
her
wis
e.O
bse
rvat
ions
are
atth
elo
an-m
onth
leve
l.T
he
sam
ple
incl
udes
loan
sof
clie
nts
who
rece
ived
bot
han
indiv
idual
and
agr
oup
liab
ilit
ylo
an.
The
vari
able
Group
Liability
Loan
Dummy
isa
dum
my
vari
able
equal
to1
ifth
elo
anis
agr
oup
liab
ilit
ylo
an,
0if
itis
anin
div
idual
liab
ilit
ylo
an.Behrampura
Branch
isa
dum
my
for
one
ofth
etw
oM
FI
bra
nch
esin
the
sam
ple
.Number
of
Previous
Loans
isth
enum
ber
oflo
ans
that
the
clie
nts
rece
ived
bef
ore
the
curr
ent
loan
.Loan
Age
in
Months
isth
ediff
eren
ceb
etw
een
the
mon
thof
the
obse
rvat
ion
and
the
mon
thw
hen
the
loan
was
dis
burs
ed,
plu
s1.
Sta
ndar
der
rors
,cl
ust
ered
atth
ein
div
idual
leve
l,ar
egi
ven
inpar
enth
eses
ben
eath
each
poi
nt
esti
mat
e.
(1)
(2)
(3)
(4)
(5)
(6)
Gro
up
Lia
bilit
yL
oan
Dum
my
-0.1
75∗∗
∗-0
.163
∗∗∗
-0.1
52∗∗
∗-0
.112
∗∗∗
-0.1
59∗∗
∗-0
.081
∗∗
(0.0
14)
(0.0
12)
(0.0
42)
(0.0
26)
(0.0
15)
(0.0
33)
Beh
ram
pura
Bra
nch
0.06
7∗∗∗
0.07
2∗∗∗
0.06
7∗∗∗
(0.0
16)
(0.0
15)
(0.0
16)
Num
ber
ofP
revio
us
Loa
ns
-0.0
080.
045∗
∗∗
(0.0
07)
(0.0
17)
Loa
nA
gein
Mon
ths
-0.0
28∗∗
∗-0
.014
∗∗
(0.0
07)
(0.0
07)
Loa
nA
geSquar
ed0.
003∗
∗∗0.
002∗
∗∗
(0.0
01)
(0.0
01)
Loa
nA
geC
ub
ed-0
.000
∗∗∗
-0.0
00∗∗
∗
(0.0
00)
(0.0
00)
Con
stan
t0.
128∗
∗∗0.
091∗
∗∗0.
217∗
∗0.
181∗
∗0.
167∗
∗∗0.
272∗
∗∗
(0.0
13)
(0.0
04)
(0.0
87)
(0.0
86)
(0.0
20)
(0.0
86)
Con
trol
for
Cal
endar
Mon
thN
oN
oY
esY
esN
oY
esIn
div
idual
FE
sN
oY
esN
oY
esN
oY
es
R-s
quar
ed0.
082
0.22
90.
098
0.24
60.
095
0.25
3N
6055
6055
6055
6055
6055
6055
Mea
nof
Dep
Var
0.10
50.
105
0.10
50.
105
0.10
50.
105
∗p<
0.10
,∗∗
p<
0.0
5,∗∗
∗p<
0.01
36

Table
3:
Dep
endent
Vari
able
:M
isse
dC
om
puls
ory
Dep
osi
tT
his
table
rep
orts
resu
lts
from
OL
Sre
gres
sion
sw
ith
pan
eldat
afr
omJan
uar
y20
08to
Mar
ch20
09,
wher
eth
edep
enden
tva
riab
leis
adum
my
for
mis
sing
aco
mpuls
ory
dep
osit
.T
his
dum
my
take
son
the
valu
eof
1fo
ra
par
ticu
lar
mon
thif
the
clie
nt
dep
osit
edle
ssth
anth
ere
quir
edam
ount
ofR
s.10
0,an
d0
other
wis
e.O
bse
rvat
ions
are
atth
ein
div
idual
-mon
thle
vel.
The
sam
ple
incl
udes
clie
nts
who
rece
ived
bot
han
indiv
idual
and
agr
oup
liab
ilit
ylo
an.
The
vari
able
Group
Liability
Loan
Dummy
isa
dum
my
vari
able
equal
to1
ifth
ecl
ient
had
agr
oup
liab
ilit
ylo
an,
0if
itis
anin
div
idual
liab
ilit
ylo
an.Behrampura
Branch
isa
dum
my
for
one
ofth
etw
oM
FI
bra
nch
esin
the
sam
ple
.Number
of
Previous
Loans
isth
enum
ber
oflo
ans
that
the
clie
nt
rece
ived
bef
ore
the
curr
ent
loan
.Loan
Age
in
Months
isth
ediff
eren
ceb
etw
een
the
mon
thof
the
obse
rvat
ion
and
the
mon
thw
hen
the
loan
was
dis
burs
ed,
plu
s1.
Sta
ndar
der
rors
,cl
ust
ered
atth
ein
div
idual
leve
l,ar
egi
ven
inpar
enth
eses
ben
eath
each
poi
nt
esti
mat
e.
(1)
(2)
(3)
(4)
(5)
(6)
Gro
up
Lia
bilit
yL
oan
Dum
my
-0.2
34∗∗
∗-0
.338
∗∗∗
-0.0
74∗
-0.2
05∗∗
∗-0
.230
∗∗∗
-0.1
98∗∗
∗
(0.0
35)
(0.0
32)
(0.0
41)
(0.0
45)
(0.0
38)
(0.0
69)
Beh
ram
pura
Bra
nch
0.00
3-0
.008
-0.0
00(0
.036
)(0
.034
)(0
.035
)N
um
ber
ofP
revio
us
Loa
ns
-0.0
010.
124
(0.0
17)
(0.0
98)
Loa
nA
gein
Mon
ths
-0.0
40∗∗
0.05
0∗∗∗
(0.0
19)
(0.0
19)
Loa
nA
geSquar
ed0.
004
-0.0
06∗∗
(0.0
03)
(0.0
03)
Loa
nA
geC
ub
ed-0
.000
0.00
0∗∗
(0.0
00)
(0.0
00)
Con
stan
t0.
389∗
∗∗0.
698∗
∗∗0.
607∗
∗∗0.
807∗
∗∗0.
461∗
∗∗0.
623∗
∗∗
(0.0
39)
(0.0
27)
(0.0
45)
(0.0
40)
(0.0
49)
(0.1
23)
Con
trol
for
Cal
endar
Mon
thN
oN
oY
esY
esN
oY
esIn
div
idual
FE
sN
oY
esN
oY
esN
oY
es
R-s
quar
ed0.
054
0.48
90.
103
0.51
10.
059
0.51
4N
2929
2929
2929
2929
2929
2929
Mea
nof
Dep
Var
0.20
50.
205
0.20
50.
205
0.20
50.
205
∗p<
0.10
,∗∗
p<
0.0
5,∗∗
∗p<
0.01
37

Table
4:
Hete
rogenous
Eff
ect
sby
Gender
and
Borr
ow
er
Qu
ality
Th
ista
ble
rep
orts
resu
lts
from
OL
Sre
gres
sion
sw
her
eth
ed
epen
den
tva
riab
leis
ad
um
my
for
mis
sin
ga
pay
men
t.T
his
du
mm
yta
kes
on
the
valu
eof
1fo
ra
par
ticu
lar
mon
thif
the
tota
lam
ount
rep
aid
by
the
borr
ower
for
that
month
isn
il,
an
d0
oth
erw
ise.
Reg
ress
ion
sin
colu
mn
s1
to3
pro
vid
eh
eter
ogen
ous
effec
tsby
gen
der
and
incl
ud
eth
efu
llsa
mp
leof
clie
nts
.R
egre
ssio
ns
inco
lum
ns
4to
6p
rovid
eh
eter
ogen
ou
seff
ects
by
borr
ower
qu
ali
ty,
defi
ned
by
the
per
centa
geof
mis
sed
pay
men
tsin
the
clie
nt’
sfi
rst
ind
ivid
ual
liab
ilit
ylo
an
inth
ed
ata
.R
egre
ssio
ns
inco
lum
ns
4to
6in
clu
de
on
lyth
esu
bsa
mp
leof
clie
nts
wh
oh
adat
leas
ttw
oin
div
idu
al
liab
ilit
ylo
an
s,an
don
lylo
an
sfr
om
the
2n
dlo
an
onw
ard
s.A
llob
serv
ati
on
sare
at
the
loan
-month
leve
l.T
he
vari
able
GroupLiabilityLoanDummy
isa
du
mm
yva
riab
leeq
ual
to1
ifth
elo
an
isa
gro
up
liabil
ity
loan
,0
ifit
isan
ind
ivid
ual
liab
ilit
ylo
an.BorrowerQuality
isth
ep
erce
nta
geof
mis
sed
pay
men
tsin
the
clie
nt’
sfi
rst
ind
ivid
ual
liab
ilit
ylo
an
inth
ed
ata
.BehrampuraBranch
isa
du
mm
yfo
ron
eof
the
two
MF
Ib
ran
ches
inth
esa
mp
le.NumberofPreviousLoans
isth
enu
mb
erof
loan
sth
at
the
clie
nt
rece
ived
bef
ore
the
curr
ent
loan
.LoanAgeinMonths
isth
ediff
eren
ceb
etw
een
the
month
of
the
ob
serv
ati
on
an
dth
em
onth
wh
enth
elo
an
was
dis
bu
rsed
,p
lus
1.
Sta
nd
ard
erro
rs,
clu
ster
edat
the
ind
ivid
ual
level
,ar
egi
ven
inp
are
nth
eses
ben
eath
each
poin
tes
tim
ate
.
(1)
(2)
(3)
(4)
(5)
(6)
Gro
up
Lia
bil
ity
Loa
nD
um
my
-0.2
24∗
∗∗-0
.212∗
∗∗-0
.132∗∗
∗-0
.137∗∗
∗-0
.122∗
∗∗-0
.075
(0.0
34)
(0.0
32)
(0.0
42)
(0.0
28)
(0.0
25)
(0.0
48)
Fem
ale
-0.0
41
(0.0
39)
Gro
up
Lia
bil
ity
Loa
n∗
0.0
63∗
0.0
65∗
0.0
70∗∗
Fem
ale
(0.0
37)
(0.0
35)
(0.0
32)
Bor
row
erQ
ual
ity
0.2
23∗∗
(0.1
11)
Gro
up
Lia
bil
ity
Loa
n∗
-0.2
34∗
-0.2
40∗
-0.2
48∗∗
Bor
row
erQ
ual
ity
(0.1
19)
(0.1
23)
(0.1
21)
Beh
ram
pu
raB
ran
ch0.0
61∗∗
∗0.0
79∗
∗∗
(0.0
17)
(0.0
24)
Nu
mb
erof
Pre
vio
us
Loa
ns
0.0
45∗∗
∗0.0
25
(0.0
17)
(0.0
23)
Loa
nA
gein
Mon
ths
-0.0
14∗
0.0
12
(0.0
07)
(0.0
08)
Loa
nA
geS
qu
ared
0.0
02∗
∗∗-0
.001
(0.0
01)
(0.0
01)
Loa
nA
geC
ub
ed-0
.000∗
∗∗0.0
00
(0.0
00)
(0.0
00)
Con
stan
t0.1
65∗
∗∗0.1
08∗∗
∗0.2
96∗∗
∗0.0
88∗
∗∗0.0
75∗∗
∗0.1
47
(0.0
38)
(0.0
11)
(0.0
87)
(0.0
22)
(0.0
10)
(0.1
44)
Ind
ivid
ual
FE
sN
oY
esY
esN
oY
esY
esM
onth
FE
sN
oN
oY
esN
oN
oY
es
R-s
qu
ared
0.0
84
0.2
31
0.2
55
0.0
95
0.2
39
0.2
68
N6055
6055
6055
2579
2579
2579
Mea
nof
Dep
Var
inC
ontr
ol(M
ales
)0.2
26
0.2
26
0.2
26
Mea
nof
Dep
Var
inC
ontr
ol(F
emale
s)0.1
57
0.1
57
0.1
57
∗p<
0.10
,∗∗
p<
0.0
5,∗∗
∗p<
0.01
38

Figure 1: Group Liability Loans Disbursement in SampleThis figure plots the number of group liability loans that are disbursed over time in our sam-ple. All borrowers are previously individual liability borrowers, who subsequently received agroup liability loan after the policy change.
39

Table
A.1
:Fals
ifica
tion
Test
This
table
rep
orts
resu
lts
from
afa
lsifi
cati
onte
st,
wher
eth
edep
enden
tva
riab
leis
adum
my
for
mis
sed
pay
men
t.T
his
dum
my
vari
able
take
son
the
valu
eof
1fo
ra
par
ticu
lar
mon
thif
the
tota
lam
ount
repai
dby
the
bor
row
erfo
rth
atm
onth
isnil,
and
0ot
her
wis
e.T
he
regr
essi
ons
corr
esp
ond
wit
hth
ose
inT
able
2.T
he
sam
ple
conta
ins
obse
rvat
ions
ofin
div
idual
liab
ilit
ylo
ans
amon
gcl
ients
who
rece
ived
bot
hin
div
idual
and
agr
oup
liab
ilit
ylo
an,
and
who
obta
ined
atle
ast
2in
div
idual
liab
ilit
ylo
ans,
the
mos
tre
cent
ofw
hic
hw
asdis
burs
edaf
ter
Nov
emb
er20
06.
Obse
rvat
ions
are
atth
elo
an-m
onth
leve
l.False
Treatment
isa
dum
my
vari
able
equal
to1
ifth
elo
anw
asdis
burs
edaf
ter
Nov
emb
er20
06,
0ot
her
wis
e.Behrampura
Branch
isa
dum
my
for
one
ofth
eM
FI
bra
nch
esin
the
sam
ple
.Number
of
Previous
Loans
isth
enum
ber
oflo
ans
that
the
clie
nt
rece
ived
bef
ore
the
curr
ent
loan
.Loan
Age
in
Months
isth
ediff
eren
ceb
etw
een
the
mon
thof
the
obse
rvat
ion
and
the
mon
thw
hen
the
loan
was
dis
burs
ed,
plu
s1.
Sta
ndar
der
rors
,cl
ust
ered
atth
ein
div
idual
leve
l,ar
egi
ven
inpar
enth
eses
ben
eath
each
poi
nt
esti
mat
e.
(1)
(2)
(3)
(4)
(5)
(6)
Fal
seT
reat
men
t-0
.004
-0.0
110.
049
0.00
20.
021
0.05
8(0
.023
)(0
.026
)(0
.041
)(0
.025
)(0
.025
)(0
.050
)B
ehra
mpura
Bra
nch
0.07
6∗∗∗
0.08
9∗∗∗
0.06
6∗∗
(0.0
27)
(0.0
27)
(0.0
29)
Num
ber
ofP
revio
us
Loa
ns
-0.0
28∗∗
0.04
6(0
.014
)(0
.035
)L
oan
Age
inM
onth
s-0
.025
-0.0
14(0
.019
)(0
.022
)L
oan
Age
Squar
ed0.
003
0.00
4(0
.003
)(0
.003
)L
oan
Age
Cub
ed-0
.000
-0.0
00(0
.000
)(0
.000
)C
onst
ant
0.09
5∗∗∗
0.05
8∗∗∗
0.22
20.
139∗
∗∗0.
158∗
∗∗0.
319∗
∗
(0.0
25)
(0.0
13)
(0.1
42)
(0.0
20)
(0.0
43)
(0.1
29)
Con
trol
for
Cal
endar
Mon
thN
oN
oY
esN
oN
oY
esIn
div
idual
FE
sN
oY
esN
oN
oN
oY
es
R-s
quar
ed0.
011
0.14
00.
042
0.00
00.
016
0.17
5N
1584
1584
1584
1584
1584
1584
Mea
nof
Dep
Var
0.14
00.
140
0.14
00.
140
0.14
00.
140
∗p<
0.10
,∗∗
p<
0.05
,∗∗
∗p<
0.0
1
40
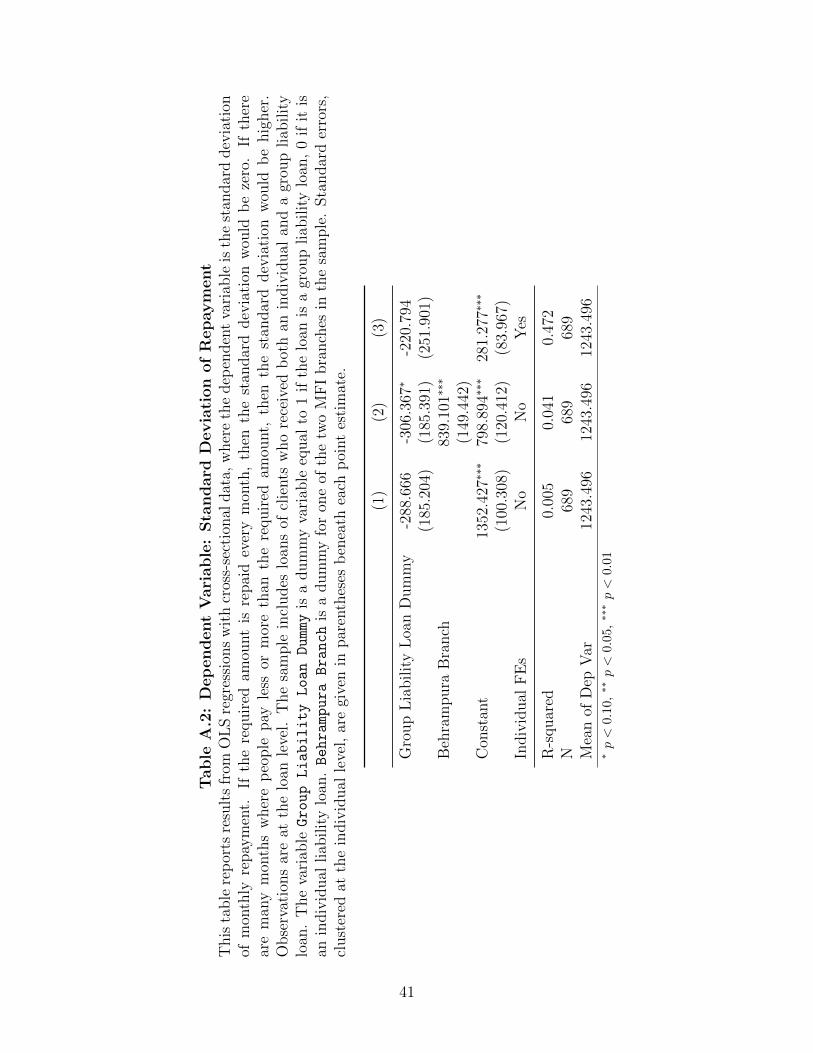
Table
A.2
:D
ep
endent
Vari
able
:Sta
ndard
Devia
tion
of
Repaym
ent
This
table
rep
orts
resu
lts
from
OL
Sre
gres
sion
sw
ith
cros
s-se
ctio
nal
dat
a,w
her
eth
edep
enden
tva
riab
leis
the
stan
dar
ddev
iati
onof
mon
thly
repay
men
t.If
the
requir
edam
ount
isre
pai
dev
ery
mon
th,
then
the
stan
dar
ddev
iati
onw
ould
be
zero
.If
ther
ear
em
any
mon
ths
wher
ep
eople
pay
less
orm
ore
than
the
requir
edam
ount,
then
the
stan
dar
ddev
iati
onw
ould
be
hig
her
.O
bse
rvat
ions
are
atth
elo
anle
vel.
The
sam
ple
incl
udes
loan
sof
clie
nts
who
rece
ived
bot
han
indiv
idual
and
agr
oup
liab
ilit
ylo
an.
The
vari
able
Group
Liability
Loan
Dummy
isa
dum
my
vari
able
equal
to1
ifth
elo
anis
agr
oup
liab
ilit
ylo
an,
0if
itis
anin
div
idual
liab
ilit
ylo
an.Behrampura
Branch
isa
dum
my
for
one
ofth
etw
oM
FI
bra
nch
esin
the
sam
ple
.Sta
ndar
der
rors
,cl
ust
ered
atth
ein
div
idual
leve
l,ar
egi
ven
inpar
enth
eses
ben
eath
each
poi
nt
esti
mat
e.
(1)
(2)
(3)
Gro
up
Lia
bilit
yL
oan
Dum
my
-288
.666
-306
.367
∗-2
20.7
94(1
85.2
04)
(185
.391
)(2
51.9
01)
Beh
ram
pura
Bra
nch
839.
101∗
∗∗
(149
.442
)C
onst
ant
1352
.427
∗∗∗
798.
894∗
∗∗28
1.27
7∗∗∗
(100
.308
)(1
20.4
12)
(83.
967)
Indiv
idual
FE
sN
oN
oY
es
R-s
quar
ed0.
005
0.04
10.
472
N68
968
968
9M
ean
ofD
epV
ar12
43.4
9612
43.4
9612
43.4
96∗p<
0.10
,∗∗
p<
0.05,∗∗
∗p<
0.0
1
41

Figure A.1: Event Time Regression: Missed Payment onEvent Time Dummies of Switching from Individual to Group Liability LoanThis figure plots coefficients for event-time dummies where the event is the conversion fromindividual liability to a group liability loan. The dependent variable is a dummy for missinga monthly repayment, which takes on the value 1 for a particular month if the total amountrepaid by the borrower for that month is nil, and 0 otherwise. The first month of repaymentin the group liability setting is at time = 0, the final repayment month in the individualliability setting is at time = −1. The dashed lines indicate the 95% confidence interval.
(a) No Controls
(b) With Month FEs
42

Figure A.2: Event Time Regression: Missed Payment onEvent Time Dummies of Switching from the First to the Second Loan CycleThis figure plots coefficients for event-time dummies where the event is the shift from theclient’s first loan cycle to the second loan cycle, for each of the individual and group liabilityloans. The dependent variable is a dummy for missing a monthly repayment, which takeson the value 1 for a particular month if the total amount repaid by the borrower for thatmonth is nil, and 0 otherwise. The first month of repayment in the second loan cycle is attime = 0, the final repayment month in the first loan cycle is at time = −1. The dashedlines indicate the 95% confidence interval.
(a) No Controls
(b) With Month FEs
43

Figure A.3: Calendar Month of Loan Origination and Missed PaymentsThis figure plots the percentage of monthly repayments that were missed, using the firstthree repayments from loan disbursement of the client’s most recent individual liability loan.The calendar month of loan origination refers to the calendar month when the loan wasdisbursed. The size of the bubbles represent frequencies. The red line represents the best-fitline. The sample includes clients who received both an individual and a group liability loan.
44