li yang and sofia thorman li.yang@innventia - jpmtr.orgjpmtr.org/iarigai_conference/2b1_yang.pdf ·...
TRANSCRIPT

Critical evaluations of liquid absorption
testing methods for package printing
Li Yang and Sofia Thorman

www.innventia.com © 2015 2
Topography + absorption print quality
Appropriate and robust measurements
predictable print quality
How to measure the absorption properties ?
– Total absorption
Cobb60 ?
Bristow wheel ?
IGT penetration tester ?
…
– Absorption non-uniformity
Stain technique
Background

www.innventia.com © 2015 4
Measurement methods
Two relatively new methods have been
evaluated
– ASA – Automatic Scanning Absorptometer
– ACT – Automatic Cobb Tester
Both methods provide time-resolved absorbency
measurements
– To examine short or long time absorption
characteristics
– Capillary-driven absorption (no external pressure
applied)
tkVtV 0)(

www.innventia.com © 2015 5
Paper boards
Six pilot coated paper boards
– Different top-coatings on the same pre-coated base
– Similar surface roughness
– But broad absorbency range
Latex
– Latex A: vinyl acetate acrylate (VAA)
– Latex B: styrene butyl acrylate (SBA)
Pigments
– HC90=Hydrocarb® 90
– SCHG=Setacarb® HG
– Clay=Capim NP delaminated clay
– CCN75 = Covercarb® 75, narrow PSD
No. Board
notation
Coating compositions Roughness,
std. dev ,
height [µm]
Contact
angle,
H2O
1 12.5 Latex
A
12.5 pph VAA Latex A,
60 pph HC90 + 40 pph SCHG.
0.86 71.2
2 15 Latex A 15 pph VAA Latex A, Pigments as 1. 0.88 75.2
3 20 Latex A 20 pph VAA Latex A, Pigments as 1. 0.76 80.8
4 15 Latex B 15 pph SBA latex B, Pigments as 1. 0.89 84.4
5 40 Clay 15 pph VAA latex.
Pigments; 60 pph HC90 + 40 clay
0.83 70.3
6 N75 GCC 15 pph VAA latex. 100 pph CCN75 0.87 73.4
- Pre-coating 100 pph Hydrocarb® 60 and 13 pph
of the VAA latex.

www.innventia.com © 2015 6
Measurements
Testing liquids
ASA
– 12% (volume) of the condensed blue liquid,
methylene blue, diluted in deionized water.
– 8.6 wt-% n-propanol in order to reduce the
surface tension similar to flexographic inks.
(38 mj/m2)
ACT
– water
Surface roughness
OptiTopo
– height standard deviation
– wavelength interval 0.06-1 mm
PPS
Bendtsen

www.innventia.com © 2015 8
Full-scale printing with an in-line flexographic press at Tetra Pak, Lund, Sweden.
Print density of a solid cyan area was measured on five consecutive signatures.
– Spectro-densitometer, SpectroDens (TECHKON GmbH, Königstein, Germany),
calibrated against the board white and with the following settings: D50 illumination, 2º observer, polarization
filter and density filter ISO E.
Print trial
www.innventia.com © 2015 9
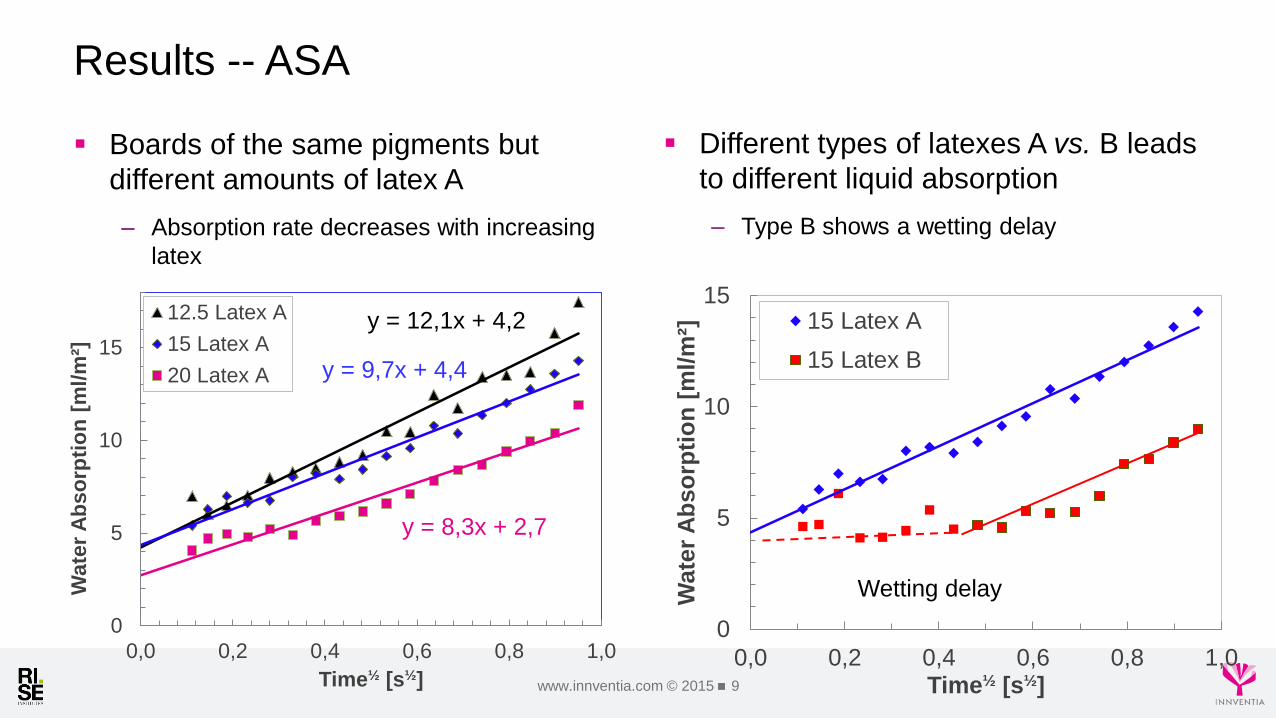
Results -- ASA
Boards of the same pigments but
different amounts of latex A
– Absorption rate decreases with increasing
latex
Different types of latexes A vs. B leads
to different liquid absorption
– Type B shows a wetting delay
Wetting delay
y = 12,1x + 4,2
y = 9,7x + 4,4
y = 8,3x + 2,7
0
5
10
15
0,0 0,2 0,4 0,6 0,8 1,0
Wate
r A
bso
rpti
on
[m
l/m
²]
Time½ [s½]
12.5 Latex A
15 Latex A
20 Latex A
0
5
10
15
0,0 0,2 0,4 0,6 0,8 1,0
Wate
r A
bso
rpti
on
[m
l/m
²]
Time½ [s½]
15 Latex A
15 Latex B

www.innventia.com © 2015 10
Results -- ASA
The porosity of the coatings affect the
liquid absorption
– Board (N75) having the most porous
surface (GCC of narrow PSD)
– Board with 40% clay is less porous
– Board having GCC of broad PSD has the
lowest porosity.
– The boards have similar contact angle
y = 9,7x + 4,4
y = 10,9x + 4,7
y = 13,1x + 5,2
0
2
4
6
8
10
12
14
16
18
0,0 0,2 0,4 0,6 0,8 1,0
15 Latex A
40 Clay
N75 GCC
Wate
r A
bso
rpti
on
[m
l/m
²]
Time [√s]

www.innventia.com © 2015 11
Results -- ACT
The measurements show similar long-
term trends as those from ASA
Less reliable in short-term behaviour
– More latex, higher absorption
– Incorrect measurement at t0
– In contradictory to the ASA observations
0
10
20
30
40
50
60
70
0,0 2,0 4,0 6,0 8,0
Wate
r A
bso
rpti
on
[m
l/m
²]
Time½ [s½]
12.5 Latex A
15 Latex A
20 Latex A
0
2
4
6
8
10
12
14
0,0 0,2 0,4 0,6 0,8 1,0
Wate
r A
bso
rpti
on
[m
l/m
²]
Time½ [s½]
12.5 Latex A
15 Latex A
20 Latex A

www.innventia.com © 2015 12
Results -- ACT
The measurements show similar long-
term trends as those from ASA
– For short term, it is less obvious with less
information
No wetting delay observed
0
10
20
30
40
50
60
70
0,0 2,0 4,0 6,0 8,0
Wate
r A
bso
rpti
on
[m
l/m
²]
Time½ [s½]
15 Latex A
15 Latex B
0
2
4
6
8
10
12
14
0,0 0,2 0,4 0,6 0,8 1,0
Wate
r A
bso
rpti
on
[m
l/m
²]
Time½ [s½]
15 Latex A
15 Latex B

www.innventia.com © 2015 13
At t=0, the liquid only fills the surface
roughness.
The intercept with the y-axis (t=0) is
proportional to surface roughness
Surface roughness vs. absorption at t0
0
5
10
15
0,0 0,5 1,0
Wate
r A
bso
rpti
on
[m
l/m
²]
Time½ [s½]
15 Latex A 15 Latex A
R² = 0,01
R² = 0,73
-2,0
0,0
2,0
4,0
6,0
0,7 0,8 0,9
Inte
rcep
t y-a
xis
[m
l/m
²]
Surf. rough. Std. Dev [µm], Optitopo (0.06-1mm)
ACT ASA
tkVtV 0)(

www.innventia.com © 2015 15
Absorption rates
– Both methods reveal similar long-term trends
The absorption rates of ASA measurements are generally
proportional to those of ACT
– the board 15 Latex B is an exception
Their short-term observations differs significantly
– t< 1.0 s
– ASA’s measurements is probably more reliable
makes more sense as it reveal surface topography
Comparison between ASA and ACT measurements
0
5
10
15
12.5 15 20 15 40 N75
Latex A Latex B Clay GCC
Ab
so
rpti
on
ra
te [
ml/
m²s
½]
ASA ACT
0
5
10
15
20
25
0.0 1.0 2.0 3.0 4.0
Wa
ter
Ab
so
rpti
on
[m
l/m
²]
Time½ [s½]
ASA
ACT
15 pph Latex B

www.innventia.com © 2015 16
There are a clear correlation between the
absorption rates of the boards and the
respective print densities.
Print density vs. absorption rates
R² = 0.38 R² = 0.71
1.3
1.4
1.5
1.6
0 5 10 15
Pri
nt
den
sit
y
Absorption rate [ml/m²s½]
ACT ASA
15 LatexB

www.innventia.com © 2015 19
Being capable of predicting print quality from unprinted surfaces (paper/board) will help the
producers to
– supply substrates with properties demanded by converters and end-users.
– develop products of preferred printing surfaces.
– increase production efficiency and effectiveness by reliable in-house quality control.
Industrial applications

www.innventia.com © 2015 20
KRK KUMAGAI RIKI KOGYO Co., Ltd. and FIBRO system AB for supporting with
measurements and allowing us to use their equipment.
BillerudKorsnäs, Stora Enso and Tetra Pak for financial support.
The Research Institute of Sweden (RISE) and the Knowledge Foundation via VIPP Industrial
Research College – Values Created in Fiber Based Processes and Products – at Karlstad
University, Sweden, are also acknowledged.
Acknowledgements