}li-s a model for the space shutt!e main engine high
TRANSCRIPT

}li-s ?
NASA Technical Memgrandum, 103697 .......
A Model for the Space Shutt!e_Main Engine
High Pressure Oxidizer TurbopumpShaft Sea! System -
Daniel E. Paxson
Lewis Research Center
Cleveland, Ohio
Prepared for theSecond Annual Conference on Health Monitoring for
Space Propulsion Systems -__:_
sponsored by the University of Cincinnati_Cincinnati, Ohio, November 14-15, 1990
(HASA-T_-IO36QI) A MODEL FOR '/-ME SPACE N91-20_-89 ,__i:_-_.._
SI-!UTT| Z MAI,,'_ _-NGINL HIbH pRESSURE OXIDIZER, _ _ _ :__
T_IR_ODU_p SHAFT S_TAL SY_IFEM (NASA) %1 p -_-- -CSCL 13I Uncld, s


A Model for the Space Shuttle Main Engine
High Pressure Oxidizer Turbopump Shaft Seal System
Daniel E. Paxson
National Aeronautics and Space AdministrationLewis Research Center
Cleveland, Ohio 44135
Abstract
A simple static model is presented which solves for the flow properties of pressure, temperature, and
mass flow in the Space Shuttle Main Engine High Pressure Oxidizer Turbopump Shaft Seal System.
This system includes the Primary and Secondary Turbine Seals, the Primary and Secondary Turbine
Drains, the Helium Purge Seals and Feed Line, the Primary Oxygen Drain, and the Slinger/Labyrinth
Oxygen Seal Pair. The model predicts the changes in flow variables that occur during and after
failures of the various seals. Such information would be particularly useful in a post flight situation
where processing of sensor information using this model could identify a particular seal that had
experienced excessive wear. Most of the seals in the system are modeled using simple one
dimensional equations which can be applied to almost any seal provided that the fluid is gaseous. A
failures is modeled as an increase in the clearance between the shaft and the seal. Thus, the model
does not attempt to predict how the failure process actually occurs (e.g. wear, seal crack initiation,
etc.). The results presented herein were obtained using a FORTRAN implementation of the model
running on a VAX computer. Solution for the seal system properties is obtained iteratively; however,
a further simplified implementation (which does not include the Slinger/Labyrinth combination) has
also been developed which provides fast and reasonable results for most engine operating conditions.
Results from the model compare favorably with the limited redline data available.

Nomenclature
c ..................... clearancebetweenshaftand seal (radial) in inches
C D .................... discharge coefficient
C 1 .................... experimental coefficient
d ..................... diameter of shaft in inches
G ..................... geometric factor depending upon slinger dimensions
h ..................... fluid enthalpy in btu/lbm
ks .................... smooth side slip coefficient
kv .................... vaned side slip coefficient
L ..................... seal length in inches
M 1 .................... mach number at the end of the inlet nozzle
M 2 .................... mach number at the end of the channel
ria .................... flow rate in lbm/sec
N ..................... number of teeth in labyrinth seal
Po .................... pressure at origin or inlet of a seal in psi
Pe .................... pressure seal exit in psi
R ..................... real gas constant for a specific gas in ft-lbf/lbm-°R
r ..................... radial position in inches
8t ..................... flow resistance in seJ/in 5
T O .................... temperature at origin or inlet of a geal in clegrees Rankine
•y ................ . .... ratio of specific heats
_t ..................... fluid viscocity in Reyns
p ..................... fluid density in lbm/ft 3
o ..................... shaft rotational speed in rpm

Introduction
Sealfailureshavebeenrecognizedasanimportantpotentialfailuremodein reusablerocket engines
[1,2,3]. Seals are critical for the operation of many major components and appear in many forms
throughout the engine. However, despite their varied appearance many of these seals function in a
similar fashion and thus lend themselves to a generalized representation. Unfortunately, to the
author's knowledge, no reliable model is readily available in the literature today. In an effort to
eliminate this void, the present investigation was undertaken and resulted in the model to be
described below.
Before describing the model itself it is worthwhile to discuss the nature of failure modelling in general
and its relation to the approach taken in this investigation. There are two basic approaches which
seem to be espoused in the field. The first is a true first principles approach in which one asks, "what
are the dynamics of the failure?" An attempt is made to actually link together the fluid mechanical
and structural interactions which lead to a given component failure. This is a bold and difficult
approach which has yet to yield fruitful results, however; if successful, it will give the most valuable
information. The second approach proceeds along the lines of asking, "suppose a certain failure does
occur, what are the effects on the rest of the engine?" This is a purely pragmatic line of thinking in
which the only goal is detection and isolation of a failure. No consideration is given to its cause. It
is this approach which was taken in the present work and which will now be discussed.
A schematic of the High Pressure Oxidizer Turbopump (HPOTP) seal system on the Space Shuttle
Main Engine (SSME) is shown in Figure 1. Generally, its purpose is to prevent the leakage of any
fluids in down the shaft and in particular, to prevent the mixing of hot Hydrogen rich turbine gases
on one side of the pump from combining with Oxygen from the other side. Also shown in the figure
are the points at which pressure and temperature sensors reside in the actual HPOTP. There are
five static seals, that is seals which have no moving parts, and a dynamic seal, often referred to as
a slinger, which depends upon shaft rotation in order to function. Proceeding from right to left, the
first two seals are referred to as the primary and secondary turbine seals. These separate the hot
turbine gases from the Helium purge gases. The second set of seals are referred to collectively as
the Purge seals. These serve to separate hot gas which has leaked through the turbine seals from
gaseous oxygen which has leaked through the slinger/labyrinth seal combination on the left of the
figure (often called the Primary Oxidizer Seal). Gaseous, inert Helium is forced through the purge
seal pair from high pressure tanks on board the shuttle. This gas then mixes with the hot turbine gas
and gaseous oxygen on either side of the seal pair and exits through separate drain lines which are
also shown in Figure 1. The constant flow of Helium thus provides a barrier between the two gases
(Hydrogen rich turbine gas and gaseous oxygen) which if combined would be extremely volatile. The
labyrinth seal, in combination with the slinger, serves to stem the flow of oxygen leaking from the
high pressure LOX pump. Like the other seals mentioned, it provides high resistance to through flow
by maintaining a small clearance between the seal face and the shaft. The labyrinth differs from the

others however, in that it is composed of many thinner seal faces, or teeth, instead of just one thick
face. Thus, there is a relatively small drop in pressure across each of the labyrinth teeth, but the
accumulated pressure drop across the entire seal is quite large. Finally, the slinger seal is a dynamic
seal (e.g. has moving parts) which serves two purposes. First, it restricts the flow. Secondly, it
gasifies the liquid oxygen which does leak through by doing work on it. Many papers have been
written on the slinger seal [4,5,6,7] and details of the principles of operation will not be presented
here. Suffice it to say that generally speaking, a slinger is conceptually the same as a pump in which
the pressure gradient that it must overcome is too great and the fluid flows backward. The
shortcoming of this analogy is that unlike most pumps, the slinger has the added complexity of a
gas/liquid interface.
Model Description
Annular Seals
The Turbine seals and the two seals which compose the Purge seal are all simple annular clearance
seals thus, a general description of them was sought. It was found that they could be well modeled
by considering each to be composed of a nearly isentropic entrance nozzle attached to a one
dimensional channel with frictional losses through which perfect gases flowed. This is shown in
Figure 2. Several implications are embedded in this model. First, the clearance of the seal is
presumed to be much less than the radius of the shaft. Second, the fluid velocities associated with
axial flow through the seal are assumed much greater than those in the circumferential direction
caused by the rotation of the shaft. This is a reasonable assumption since seals typically operate at
or near a choked condition, and the speed of sound in the gases is significantly larger than the
characteristic circumferential speed which is the shaft angular rotation rate multiplied by the shaft
radius. Thirdly, it is supposed that fluid velocities inside the seal proper are much greater than those
outside so that the fluid on either side of the seal is nearly stagnant. Finally, it is assumed that heat
transfer effects are negligible. That is, that the flow is adiabatic. The information necessary to
calculate the flow through the seal includes the pressure drop across the seal, the seal clearance, and
length, the fluid viscosity, ratio of specific heats, and real gas constant and the coefficient of discharge
for the entrance nozzle. For the nozzle region, the equation for the flow rate may be written as
I 2 1I/2
= _dcCDPo V'_Y . Ml111
4RTo y+l(i)
This equation assumes that the nozzle flow is unchoked, however; it may be shown that, when the
nozzle is joined to a constant area duct with friction, choking can occur only in the duct. In the duct
region the relation between the entrance and exit mach numbers (regions 1 and 2 respectively in
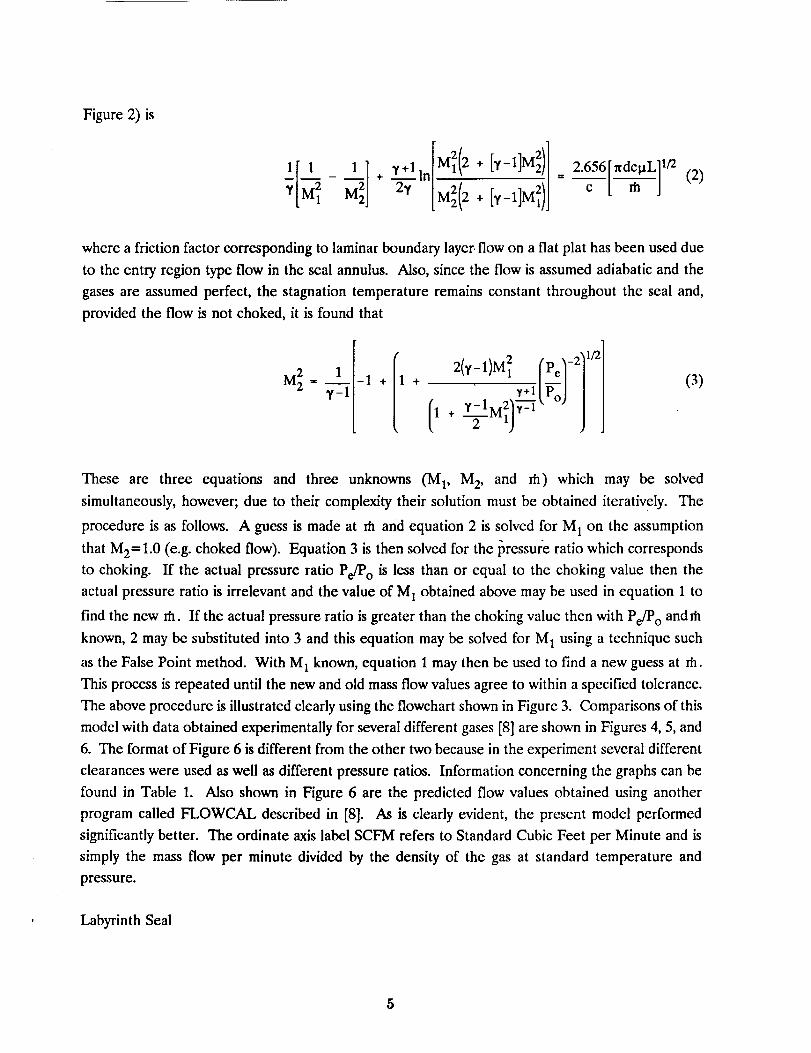
Figure2) is
Y+llnIM_(2 + [¥-1]M2)]- 2.656[ndcpL] 1/2(2)
where a friction factor corresponding to laminar boundary layer, flow on a flat plat has been used due
to the entry region type flow in the seal annulus. Also, since the flow is assumed adiabatic and the
gases are assumed perfect, the stagnation temperature remains constant throughout the seal and,
provided the flow is not choked, it is found that
M2 y-1 {1 • v+l
(3)
These are three equations and three unknowns (M1, M2, and rh) which may be solved
simultaneously, however; due to their complexity their solution must be obtained iteratively. The
procedure is as follows. A guess is made at rh and equation 2 is solved for M 1 on the assumption
that M2= 1.0 (e.g. choked flow). Equation 3 is then solved for the pressure ratio which corresponds
to choking. If the actual pressure ratio Peflao is less than or equal to the choking value then the
actual pressure ratio is irrelevant and the value of M 1 obtained above may be used in equation 1 to
find the new ria. If the actual pressure ratio is greater than the choking value then with Pe/Po andrh
known, 2 may be substituted into 3 and this equation may be solved for M 1 using a technique such
as the False Point method. With M 1 known, equation 1 may then be used to find a new guess at rh.
This process is repeated until the new and old mass flow values agree to within a specified tolerance.
The above procedure is illustrated clearly using the flowchart shown in Figure 3. Comparisons of this
model with data obtained experimentally for several different gases [8] are shown in Figures 4, 5, and
6. The format of Figure 6 is different from the other two because in the experiment several different
clearances were used as well as different pressure ratios. Information concerning the graphs can be
found in Table 1. Also shown in Figure 6 are the predicted flow values obtained using another
program called FLOWCAL described in [8]. As is clearly evident, the present model performed
significantly better. The ordinate axis label SCFM refers to Standard Cubic Feet per Minute and is
simply the mass flow per minute divided by the density of the gas at standard temperature and
pressure.
Labyrinth Seal
5

The Labyrinthseal,shownin Figure7, was modeled according to an analysis performed by Martin
[9]. Here it is assumed that each seal within the Labyrinth may be treated as an orifice (e.g. the
length is negligible) and that the fluid stagnates completely on either side of the seal tooth.
Furthermore, it is assumed that the pressure drop across any one tooth is not large. This is a valid
assumption for the HPOTP labyrinth since it has seventeen teeth. The equation for the mass flow
across the entire seal may be written as
1/2
(4)
This is an established and accepted model and therefore no experimental data is presented here for
verification. It is noted however, that modifications exist in the literature [10] which account for
residual kinetic energy (non stagnant flow between teeth) and geometrical variations such as teeth
which fit into grooves on the shaft instead of the smooth shaft type shown in Figure 7. These
modifications were used in the present investigation. For reasons to be explained later it was
necessary to solve this equation for the pressure ratio with the flow rate given. This was done by
moving the right side of equation 4 to the left and solving for the roots of the resulting equation
using the False Point method.
Slinger Seal
The Slinger seal was extremely difficult to model and it is noted at the outset that this aspect of the
seal system model is probably the least accurate. At best it is claimed that reasonable qualitative
results may be expected. An analysis by Voss [5] provided the starting point for the present model.
For reference a schematic drawing of the slinger seal is shown in Figure 8. As shown by the arrows,
the fluid flow path originates at the high pressure point just upstream the turbine side bearing set.
As it travels radially outward along the smooth side of the slinger there is an increase in the pressure
owing to the centrifugal force of rotation. On the other side of the slinger there is a set of vanes.
Because of the vanes there is much less fluid slip than on the smooth side. Consequently, the
centrifugal effects are multiplied considerably. If both sides of the slinger were filled with liquid it
can be seen that for a given radial position the pressure on the vaned side would be less than on the
smooth side. Furthermore, this difference increases as one moves closer to the shaft. This is the
operating principle of the slinger, however; there is another important feature of this particular
system. The vanes also "stir" the fluid like the whisks of a beater. Consequently, work is done on
the fluid thereby raising its internal energy. When enough energy has been added, and the proper
pressure conditions exist (e.g. at some radial point) the liquid oxygen will turn to vapor. When this
6
happens the density drops substantially, thereby greatly reducing the centrifugal effects. The vanes
however, can continue to heat the gas. On the smooth side of the seal it is assumed that no work
is done and that the flow is isentropic. The change in pressure due to the centrifugal force is
expressed as
Pr+tLr = Pr + k2p_a2rAr (5)
Here it is assumed that the change in radius is small so that, over the interval, the density may be
assumed constant. The slip factor k s used in the present study was 0.5. To find conditions at the
outer radius of the slinger, it was divided into 20 intervals. At each new radial position the pressure
was calculated using equation 5 and the value of density and pressure from the previous position.
A new density and temperature were then found using the new pressure and constant entropy. This
was accomplished by utilizing a series of software routines known collectively as GASPLUS available
on the VAX cluster at NASA [11]. These routines are designed to calculate the properties of many
gases and liquids over a wide range of conditions. The process was repeated until the outside of the
slinger was reached. On the vaned side equation 5 could again be used, however,; this time the
direction of travel is inward and the value of the slip factor k v was much higher (e.g. less slip). In
the present investigation the value was chosen as 0.98 if the fluid was liquid and 0.93 if it was vapor
or saturated vapor. An energy balance on a "thin ring" control volume yields
hr_Ar = hr+ GC1O_(1-kv)2r3-'Xr (6)
This equation is based on the assumption that the work done per mass on the fluid flowing through
the ring is equal to the work rate of the torque. A simple analysis of the torque induced on the
slinger vanes is outlined in [12]. The procedure was thus to again divide the vaned side of the slinger
into 35 intervals beginning at the outer edge. For each new radial position equations 5 and 6 were
used to calculate a new pressure and enthalpy based on the density at the last position. Using the
GASPLUS routines the new temperature and density were then found. This process was repeated
until the shaft radius was reached. Of course, at some point the liquid would change to a vapor.
When this happened the new kv for gas was then used to continue the calculations. For this
calculation to proceed, the flow rate through the seal, and the state of the LOX on the slinger's
smooth side are needed. The result is the conditions at the base of the vaned side just upstream of
the Labyrinth seal. Since the Slinger and the Labyrinth seal are in series (Figure 1) it is necessary
that the flow through them be the same. This fact was used to solve for the flow through the
Slinger/Labyrinth combination. A guess was made at the flow rate, fia and equations 5 and 6 were
used to find the properties upstream of the Labyrinth seal. With the same flow rate and the known
downstream pressure, equation 4 was also used to find the pressure upstream of the Labyrinth. If
this pressure matched that calculated with equations 5 and 6 then the flow was solved. If not, a new
guess (based on the magnitude of the pressure difference) was made and the cycle was repeated until
7

the pressures matched. Figures 9 and 10 show the Slinger/Labyrinth mass flow and exit temperature
respectively as functions of exit pressure for two different Labyrinth seal clearances. The LOX
conditions at the base of the slinger (inlet) as well as the slinger rpm were held constant for these
calculations. The inlet conditions are presented for reference in Table 2 following the figures. Note
that this is in contrast to the other seals discussed where the exit pressure was held constant and the
inlet pressure was varied. The inlet information was obtained from the SSME Power Balance
Model. Figure 9 shows an expected trend in that flow rate increases as the exit pressure is dropped
and eventually chokes at very low exit pressures. One interesting aspect however, is fact that the
calculations show that it is possible for the exit pressure to exceed the inlet pressure and still maintain
positive through flow. In these cases the centrifugal effects on the smooth side remain the same and
increase the pressure at the tip of the slinger above the inlet pressure at the base. In the low flow
cases however, the work done per unit mass on the gas is large on the vaned side and the interface
occurs near the slinger tip. With the gasification of the Oxygen, the centrifugal effect on the vaned
side is substantially reduced and the pressure at the base of the slinger on the vaned side can remain
higher than that at the inlet. It is noted here that the _waviness" of the data is a result of the rather
large finite intervals into which the slinger was divided in order to calculate properties up and down
the sides (e.g. the deltas in equations 5 and 6). Smaller divisions lead to better results but far more
computing time. Figure 10 is presented because, unlike the annular seals described earlier in which
the temperature changes vary little across them, this seal combination shows a fairly strong
dependence of exit temperature on the flow rate. This, of course, makes intuitive sense for as the
flow rate decreases more work is done to heat the fluid.
Drain Lines
The seal drain lines, of which there are three (see Figure 1), and the helium purge feed line were
all modeled using a simple resistance type equation based upon an incompressible flow analysis.
Some allowance was made for compressibility by using an average density for the flow in the drains
based upon inlet and exit pressures and the inlet temperature (assumed constant throughout the
drain). Although the flows in the seals were not, in fact incompressible, it was assumed that in the
drain lines, where velocities and mach numbers are relatively low, the assumption was nearly valid.
According to this analysis, the flow rate may be expressed in the form
I 2 2
Po - Pe
rh ,, 2RToS_ (7)
The resistances (_'s) for the various drain lines were obtained either through discussions with MSFC
personnel [13] or by matching experimental flow rates with known pressure differences.

The System
The final step in the modelling process was simply to put all of the various smaller models described
above into one complete representation of the seal system. This was accomplished using iterations
on the equations of continuity. Figure 11 is a redrawing of Figure 1, however; here the system has
been broken into three sections. Also shown in the figure are the points at which the fluid properties
and flow rates are calculated. The procedure begins by guessing at the pressure at point 3. With this
pressure know, all of the flow quantities in region III may be found. Next a guess is made at the
pressure at point 6. With this known, the flow through the oxygen drain (7) and the
Labyrinth/Slinger may be found. The Pressure at point 4 may then be adjusted until the net flow into
point 6 is zero. Hence, all flow quantites in region I become known. With the pressure at point 4
known, the net flow into point 3 may then be found. If this is zero, the iteration is complete. If not,
a new guess must be made for the pressure at point 3 (e.g. using the false point method) and the
procedure is repeated. This process is done until the net flows into points 1, 4, and 6 are all zero.
Results
Although the flow rate was calculated at each of the prescribed points, it will not be presented in any
of the results. Flow rate measurements are not currently practical within the small confines of the
seal system passages and thus, it is not expected that they would be used in a health
monitoring/failure detection capacity. It is noted however, that in the case of a Primary Turbine Seal
failure of the magnitude (i.e. clearance) discussed here, the flow rate across the seal is large and
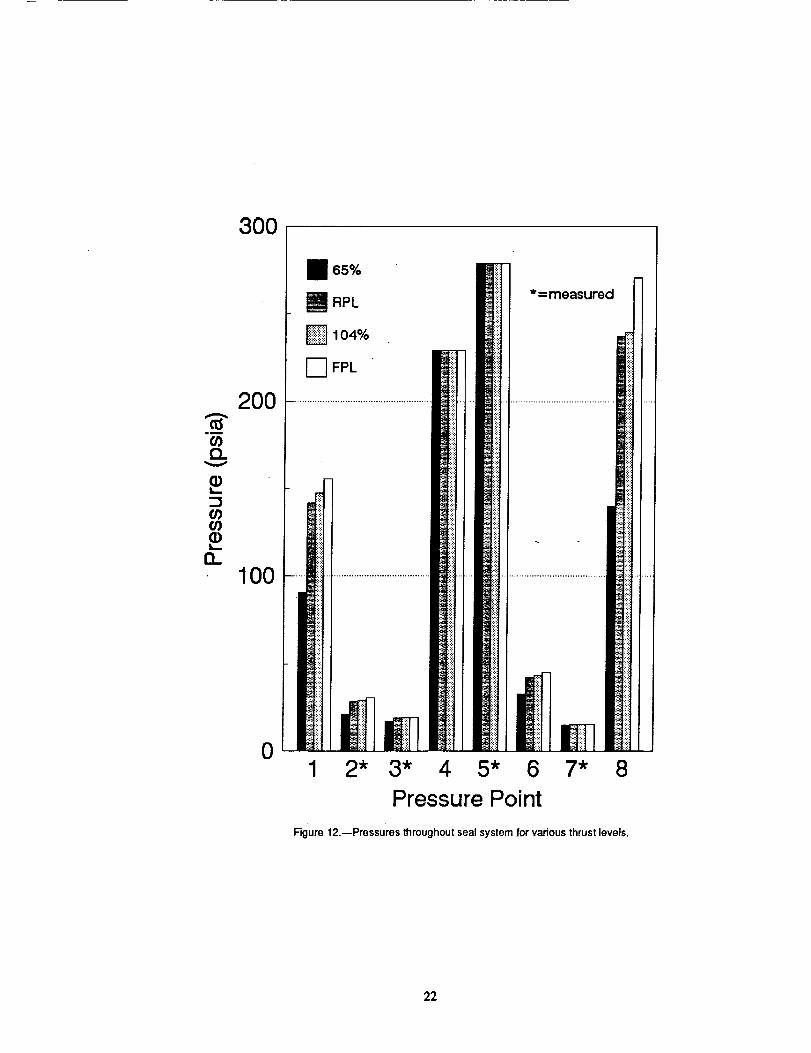
amount to approximately 6% of the total flow through the HPOTP turbine. Figures 12 and 13 show
the pressure and temperature values respectively at each of the calculation points for four different
engine power levels, using the nominal seal clearances listed in Table 3. The calculation points as
well as the points where conditions are assumed known are labeled in Figure 11. Also shown in
Figures 12 and 13 are the points (marked with asterisks) where actual transducers are located (this
is also shown in Figure 1). As mentioned earlier, the information for the known conditions was
obtained from the Power Balance Model. The Primary Turbine Seal inlet conditions were taken to
be those at the exit of the HPOTP turbine with 400 ° R subtracted from the temperature. This
accounts for the mixing of the gas with some coolant flow from other parts of the pump [13]. Slinger
inlet conditions were taken to be those just upstream of the number 4 bearing set. These were
estimated as follows. The pressure was assumed that at the HPOTP LOX pump inlet, with an
accounting for area change due to the location of the passage and a flat 20 psi added to the pressure
to account for the flow over the bearings. Temperature was taken to be that at the inlet to the
booster pump. Finally, the exit pressure for all of the drain lines was assumed to be 1 atmosphere
or 14.7 psia. It is seen from these figures that the conditions stay relatively constant over most of the
engine power levels. The one exception is the 65% level where a sharp drop in pressure is occurs
at points 1 and 8 as well as a significant temperature drop at nearly all points. The pressure and
9
temperature values for a primary turbine seal failure and a secondary turbine seal failure are shown
in Figures 14 and 15. The broken line at point 1 for the primary turbine seal failure indicates that
the pressure exceeds the maximum value in the figure (it is 728.6 psia). Failures for all the seals were
manifested by changing the clearance. The values used for failed seals are shown in Table 3. As
expected, a primary turbine seal failure increases the flow through the primary seal drain and thus
raises the pressure at points 1 and 2 considerably. With this pressure elevated, the flow through the
secondary turbine seal is also increased thereby increasing the flow through the secondary drain and
subsequently the pressure at point 3. The increased temperature at point 3 is the result of increased
hot gas flow through the drain line. The secondary turbine seal failure results also display expected
trends. Here, the pressure at point 1 drops due to the increased flow across the secondary turbine
seal and hence reduced flow through the primary seal drain. Similarly, the increased secondary
turbine seal flow increases flow through the secondary seal drain and therefore increases pressure and
temperature at point 3. It is found that if both primary and secondary turbine seals failed, the redline
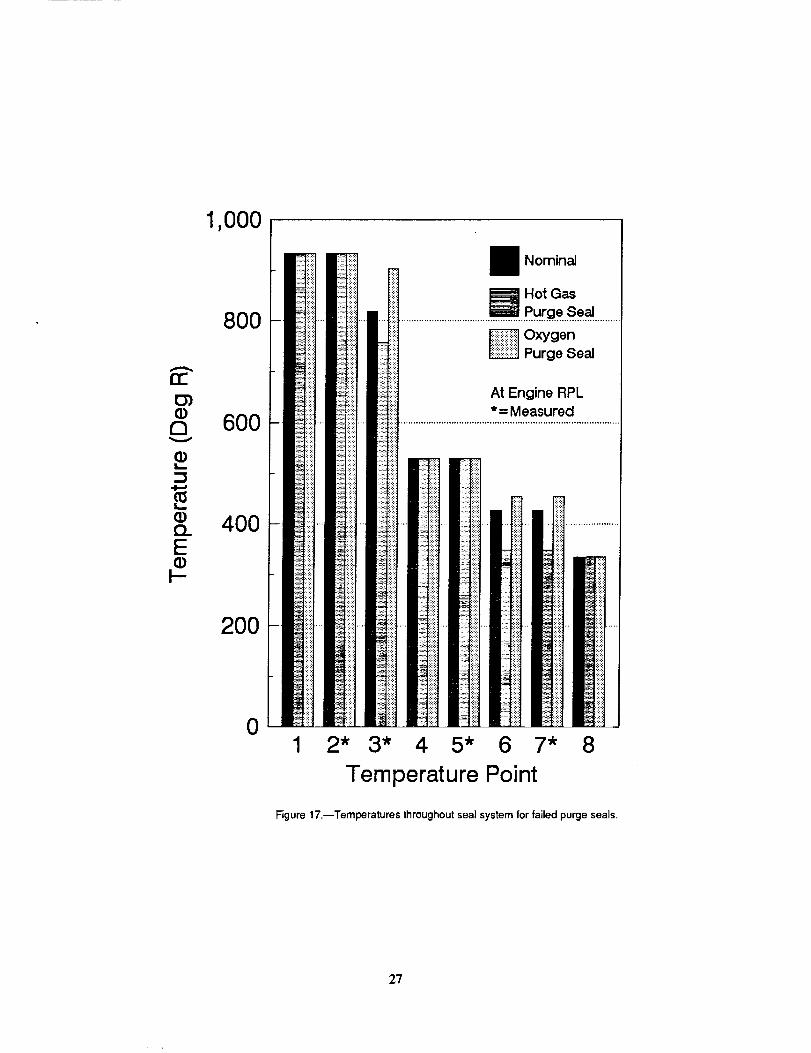
pressure value of 100 psi is exceeded at point 3 (secondary seal drain cavity). Figures 16 and 17 show
the results of purge seal failures. For either purge seal failure a large drop in the pressures at points
4 and 5 are seen. This is explained by the fact that the resistance to flow is greatly reduced as the
seal clearance is increased. Thus it takes less pressure difference across the seal to drive more flow.
Again it is found that the pressure calculated at point 5 falls below the redline value for a failure of
either seal. The remainder of the deviations from the nominal pressures and temperatures
throughout the seal system for the purge seal failures may be explained using analogous arguments
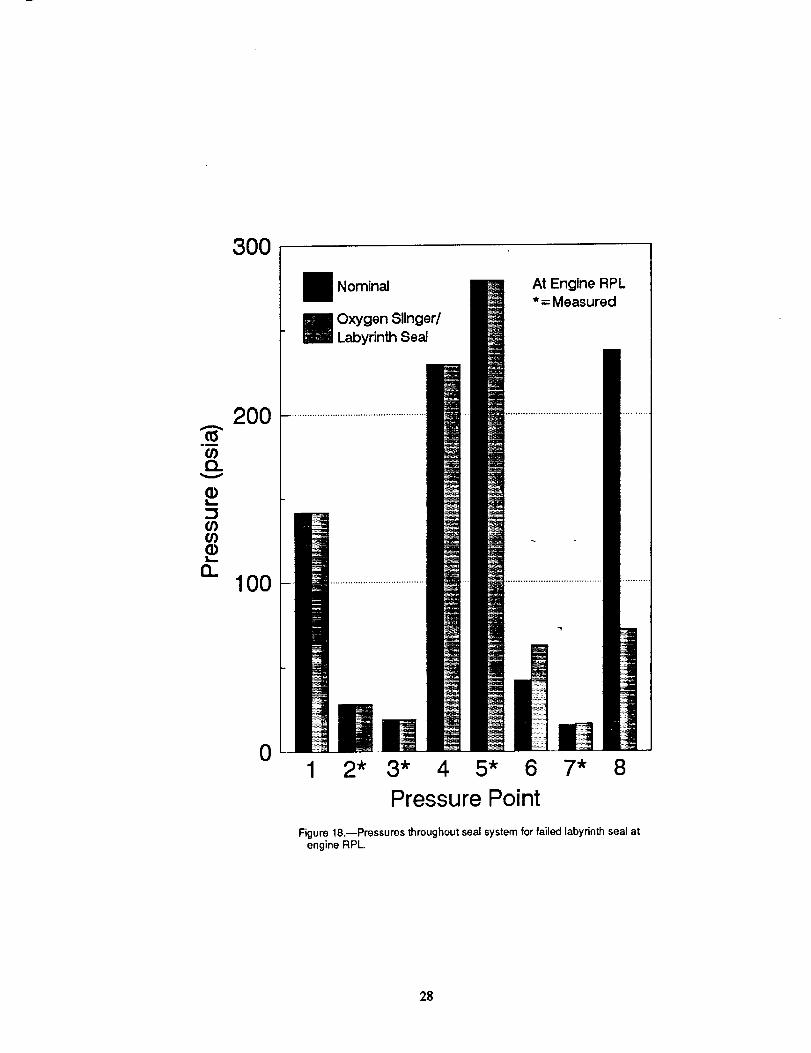
to those used for the turbine seal failures. Finally, the results of a-slinger/labyrinth seal failure are
shown in figures 18 and 19. Since a failure of the slinger seal itself is extremely unlikely it was
assumed here that failure was brought about by a change in the clearance of the labyrinth seal. It
is seen in the figures that a pressure rise occurs at point 6 due to the increased flow through the
drain line but that a significant pressure drop occurs at point 8. This drop is due to the fact that
increased flow through the slinger decreases the work done per mass of fluid, which in turn moves
the interface toward the shaft and hence allows the centrifugal effects to provide a greater pressure
drop. Since less work is done on the fluid it is also discharged at a lower temperature which is
reflected at point 6, 7, and 8 of Figure 19. Although the results presented above are in qualitative
agreement with expectations, the lack of available experimental data makes them difficult to evaluate
objectively.
It is interesting to note that if the actual magnitude of the pressure and temperature changes
associated with a given failure are ignored and instead only their direction (greater than or less than)
away from the nominal values are considered, each failure seems to have a characteristic pattern.
This result is illustrated in Tables 4 and 5. In these tables, the respective pressure and temperature
deviations of each point from the nominal value (at RPL), are shown as either upward or downward
facing arrows for positive or negative deviations, or as a dash indicating no change. These tables
suggest that a potential failure detection and isolation scheme for this seal system could rely on more
qualitative measurements and still be successful.
10

Another noteworthy aspect of the results was the reliability of the seal system as a whole. Recall that
the main purpose of this system was to keep the Oxygen flow through the pump separate from the
hot, Hydrogen rich gas flow through the turbine. From the results presented it appears that this
separation is maintained despite the failure of any one of the seals. In fact, when further test were
conducted it was found that potential mixing of the two gases exists only when both of the purge seals
fail or the Helium supply pressure is reduced to values of under 100 psia. These are highly unlikely
occurances. Thus, from a health monitoring/failure detection standpoint it would seem that
monitoring these seal failures during flight is unnecessary. Since a failure is not catastrophic to the
engine and, in fact, does not even seem to imply minor damage, it is enough to monitor the condition
of the seals in a post flight mode using stored data.
Conclusions
A model of the HPOTP Shaft Seal System for the SSME was successfully developed. The model
predicts the fluid properties and flow rates throughout this system for a number of conditions
simulating failed seals. The results agree well with qualitative expectations and redline values but
cannot be verified with actual data due to the lack thereof. The results indicate that each failure
mode results in a unique distribution of properties throughout the seal system and can therfore be
individually identified given the proper instrumentation. Furthermore, the detection process can be
built on the principle of qualitative reasoning without the use of exact fluid property values. A
simplified implementation of the model which does not include the slinger/labyrinth seal combination
has been developed and will be useful for inclusion in a real time diagnostic system.
11
References
1
*
o
1
System Controls Technology Inc., "Failure Modes Definition for Reusable Rocket Engine
Diagnostic system," NASA Contract No. NAS3-25813, June, 1990.
Perry, J. G., "Reusable Rocket Engine Turbopump Health Monitoring System," NASA
Contract No. NAS3-25279, March, 1989.
Martin Marietta Inc., "Failure Mode and Effects Analysis and Critical Items List," NASA
Contract No. NAS8-30300, April, 1987.
Reshotko, E. and Rosenthal, R. L., "Fluid Dynamic Considerations in the Design of Slinger
Seals," Journal of the American Society of Lubrication Engineers, Vol. 24, July, 1968, pp.
303-314.
° Voss, J. S., "Fluid Dynamic Analysis of the Space Shuttle Main Engine High Pressure
Oxidizer Turbopump Slinger Seal," NASA University Grant No. NGT-01-002-099, August,
1980.
.
.
.
Thew, M. T., and Saunders, M. G., "The Hydrodynamic Disk Seal," Proc. 3rd Int. Conf. on
Fluid Sealing, British Hydromechanics Research assoc., Paper H:5, April, 1967.
Due, H. F., "An Emperical Method for Calculating Radial Pressure Distribution on Rotating
Disks," Journal of Engineering for Power, April, 1966, pp.188-197.
Proctor, M. P., "Leakage Predictions for Rayleigh-Step Helium Purge Seals," NASA
Technical Memorandum No. 101352, December, 1988.
.
10.
11.
12.
13.
Martin, H. M., "Labyrinth Packings," Engineering, January, 1908, pp. 35-36.
Vermes, G., "A Fluid Mechanics Approach to the Labyrinth Seal Leakage Problem," ASME
Journal of Engineering for Power, April, 1961, pp. 161-169.
Fowler, J. R., "GASPLUS User's Manual," NASA Lewis Research Center, Cleveland, Ohio,
August, 1988.
Thew, M. T., "Further Experiments on the Hydrodynamic Disk Seal," Presefited at Fourth
Intl. Conf. on Fluid Sealing, Paper No. 39, April, 1969.
Wilmer, G., Marshall Space Flight Center, Huntsville, Alabama, 1990.
12

Figure 4 Figure 5 Figure 6
Hydrogen Air Helium
Downstream Pressure, Pe psia 14.7 14.7
Upstream Temperature, T O °R 555.0 530.0 530.0
Seal length, L in. 0.28 2.0 0.077
Shaft diameter, d in. 1.97 6.0 1.968
Radial clearance, c in. 2.26 x 10 -3 0.029
Discharge coefficient, CD 0.6 1.0 1.0
Viscosity, I_ Reyns 1.21 x 10 -9 2.76 x 10 -9 2.89 x 10⁻⁹
Ratio of specific heats, y 1.39 1.40 1.66
Real gas constant, R ft.lbf/lbm.°R 772.5 53.46 386.0
Table 1 Annular Seal Conditions
Inlet pressure, psia 354.8
Inlet temperature, °R 191.1
Inlet density, lbm/ft 3 66.41
Shaft Speed, rpm 27210
Number of Labyrinth teeth 17
Table 2 Labyrinth Seal Inlet Conditions
13

Nominal Clearance Failed Clearance
(in.) (in.)
Primary Turbine Seal 0.003 0.015
Secondary Turbine Seal 0.003 0.015
Hot Gas Side Purge Seal 0.0015 0.015
Oxygen Side Purge 0.0015 0.015
Labyrinth 0.005 0.05
Table 3 Seal Clearances
1 2 3 4 _ 6 7 8
Power Level 1 1 - 1 1
Primary Turbine Seal T T t
Secondary Turbine Seal ! l - - -
Hot Gas Purge Seal r 1 1 1 - -
Oxygen Purge Seal 1 _ 1 1 - -
Slinger/Labyrinth - - - t !
Table 4 Direction of Pressure Deviations for Various Seal Failures
14
PowerLevel
PrimaryTurbineSeal
SecondaryTurbineSeal
Hot GasPurgeSeal
OxygenPurgeSeal
Slinger/Labyrinth
Table5
2
1
3
t
t
t
t
t
5 6
l
7 8
1 t
l -
t -
1 t
Direction of Temperature Deviations for Various Seal Failures
®-rurU,,eSe,d, @ k,,. , / / @" @®:PureeSe,,s Ill "1_ Ill Ill(_Lebydnth _al 1'I I2i I'I I' I®=S,,noerS., I:1 I;I I:1 I:1®=Dr, aln Line I' I I' I I' I I!1
,=Sensor Locations 1;I I!L l i/ /;I .,
M • : --_l -:+, l ++ ,:• +,+ +,t ++ +_
I .,, I ?-_" I $_::.'_. .:._" " :
M GOX I I I I " I V I , _ , _ HOTGASLox __+22_+2° "" _.... " .................. :__._
'. . <_' .....:.:.',_" _".'_..... -, ..... :-, . - ............... ° _¢._,+:--:'--.+,_+• ........... _-+":+,!_. .,'.."....... :.-.++i.:!_:._ " • .._,_i'- SHAFT
Figure 1.--Seal system schematic.
15

! • I
I
I
Seal
Shaft
Figure 2.--Step seal model.
16

Guess initial m
Solve Eqn. 2 for M 1 with M 2 = 1.0 (e.g. choked)
[1[ 21 1 _ 1 Y+lln MI(1 + Y) ] 2.656[_tdc/zL]1/2
Solve Eqn. 3 for
With current m and
1 1
P_}chokedwithra2=1.0
4 2 11/2
7;-i M1 /_ v+l/
Is [ _._/actuat less than fS]kPo/choked?
-_no
yes
[yfor M 1 with M 2[P°}solve Eqn/s. 2 and 3 simultaneo
! +Y÷I,n -
]1"12(y-1)M_ (pe/-22 I -I+ I+
no
Use Eqn. 1 with current M 1 to find new
rune w = _r dCCDP o Y\ RTo
ill
__ ]112
¥+
Is abs[mne W - m] less than specified tolerar
Figure 3.--Seal flowchart.
17
1200
8OO
400
0
Analysis __
0 500 1000 1500
Pressure Drop Across Seal (psi)
Figure 4.--Hydrogen ring seal leakage rate.
2000
1000
LLOO3
80O
600
400
200
00
Analysis
, I = I , I i ,| ..... ,
20 40 6O 80
Pressure Drop Across Seal (psi)
Figure 5.--Air ring seal leakage rate.
100
18
20
U_0u_ 15
n,"
Q.
0
/k Present Analysis
O FLOWCAL
0
O
OO
O o
O OI I I
5 10 15
Measured Leakage Rate (SCFM)
Figure &--Helium purge seal leakage rate.
2O
Figure 7.--Labyrinth seal schematic.
19

LOX/GOXInterface ..................... ..r"
r
i
Figure8.--Slinger seal.
Labyrinth
0.20
E.Oiv
oLLu)
0.15
0.10
0.05
0.00-100
Labyrinth Clearance=0.005 in.
o Labyrinth Clearance=0.01 in.
OZ_
O
Zl
O
A
O
A
O
A
O
A
0
Zl
O
Z_
I
0, ..I , I ,
100 200
Pressure Drop Across Seal (psi)
Figure9.---Slingerllabyrinthseal leakagerate.
I
300
O O
Z_A
400
2O
1000
_" 800
"10
® 600
L_
(!)o. 400EI-
xw 200
0-100
A
O
A
O
z_ Labyrinth Clearance=0.005 in.
o Labyrinth Clearance=0.01 in.
A
O A
OA
A0 A A AA
00 0 0 0
I , I , I , I
0 100 200 300
Pressure Drop Across Seal (psi)
Figure 10.---Slinger/labyrinthseal exit temperature•
400
* = Known Conditions
• =Calculation Points
II
( He
7 _
III
_iii!iiiiiiiiiii!;_i_!_!ii_[_i_iiiii_iiiii_iiiii_iiiiiii!_i_iiiiii_iiiiiiiiiiii_iiiiiiiiiiiiiiii!_iiii!i!_iii_i_iii_i_i_iii_i_iii_i_
H...- ..............:i:]:ii:i:i:_:_:_:!:]:]:_:!:i:!:]ii_iiiii]iiiii]iiiii_!]!_!_]_!_i_!i!_i_!i!_i]ii_ii!iii!iiii_!ii!iii]]i]iii]iiiiiiiii!i]_]!!i!_]!i!!!i!i!iiiiiii]]i]]!
Figure 11.---Seal systemregions and calculationpoints.
21
3oo[
w_
¢-_V
L-
L..
13_
2OO
IO0
0
65%
RPL
104%
[_ FPL
*= measured
I 2* 3* 4 5* 6
Pressure Point
7 _ 8
Figure 12.--Pressures throughout seal system for various thrust levels.
22

1,000
rr
C_Q)£3V
.m
(Do_E(DF-
80O
600
400
2OO
0
_65%
RPL
1 2* 3* 4 5* 6 7* 8
Temperature PointFigure 13,--Temperatures throughout seal system for various thrust levels.
23

mD
o3
L_
O3O3(1)IL
Q.
3OO
2OO
100
0
I
Nominal
Primary
Turbine Seal
_ SecondaryTurbine Seal
At Engine RPL* = Measured
1 2* 3* 4 5* 6 7* 8
Pressure Point
Figure 14.--Pressures throughout seal system for primary and secondaryturbine seal failures at engine RPL
24

03¢D£3V
(I)
(DEL
E(D
8OO
600
4OO
2OO
0
Nominal
_ PrimaryTurbine Seal
Secondary::::::::::::::::::-I.:.:.:.:.:.:.:.:.:._
!_:/::_:::_/.i_!i:_Turbine Seal
At Engine RPL* = Measured
::::::!:i:!
!ilil
1 2* 3* 4 5* 6 7* 8
Temperature Point
Figure 15.--Temperatures throughout seal system for failed primary andsecondaryturbine seal failures at engine RPL
i ..................... •
ii_ii!i
25

300
=n
V
L_
O_
13.
2OO
100
0
Nominal
B Hot GasPurge Sea]
Purge Seal
1 2* 3* 4 5* 6 7*
Pressure Point
At Engine RPL* = M easured
8
Figure 16.--Pressures throughout seal system for failed purge seals at
engine RPL.
!_i!iili_i!i!i
;iiiiii
iliiii
26
1,000
rr"
(9£3
(9
(9o..E(9!--
8OO
600
4OO
2OO
0
Nominal
Hot Gas
Purge Seal
1 2* 3* 4 5* 6 7* 8
Temperature Point
Figure 17.--Temperatures throughout seal system for failed purge seals.
2?
mm
O313.
V
(D
O3O3
L_
Q..
300
200
100
0
Nominal
_ Oxygen Slinger/Labyrinth Seal
At Engine RPL* = Measured
1 2* 3* 4 5* 6 7* 8
Pressure Point
Figure 18.--Pressures throughout seal system for failed labyrinth seal at
engine RPL
2.8

1,000
n-
O3
£3v
ELEF--
8OO
600
400
200
0
Nominal
1 2* 3* 4 5* 6 7* 8
Temperature Point
Figure 19.--Temperatures throughout seal system for failed labyrinth seal
at engine RPL
29

Report Documentation PageNalional Aeronaulics andSpace Administration
1. Report No. 2. Government Accession No. 3. Recipient's Catalog No.
NASA TM- 103697
5. Report Date4. Title and Subtitle
A Model for the Space Shuttle Main Engine High Pressure Oxidizer
Turbopump Shaft Seal System
7. Author(s)
Daniel E. Paxson
9. Performing Organization Name and Address
National Aeronautics and Space AdministrationLewis Research Center
Cleveland, Ohio 44135-3191
12. Sponsoring Agency Name and Address
National Aeronautics and Space Administration
Washington, D.C. 20546-0001
6. Performing Organization Code
8. Performing Organization Report No.
E-5919
10. Work Unit No.
590-2 i -4 !
11. Contract or Grant No.
13. Type of Report and Period Covered
Technical Memorandum
14. Sponsoring Agency Code
15. Supplementary Notes
Prepared for the Second Annual Conference on Health Monitoring for Space Propulsion Systems, sponsored by
the University of Cincinnati, Cincinnati, Ohio, November 14-15, 1990. Responsible person, Daniel E. Paxson,
(216) 433-8334.
16. Abstract
A simple static model is presented which solves for the flow properties of pressure, temperature, and mass flow
in the Space Shuttle Main Engine pressure Oxidizer Turbopump Shaft Seal Systems. This system includes the
Primary and Secondary Turbine Seals, the Primary and Secondary Turbine Drains, the Helium Purge Seals andFeed Line, the Primary Oxygen Drain,and the Slinger/Labyrinth Oxygen Seal Pair. The model predicts the
changes in flow variables that occur during and after failures of the various seals. Such information would be
particularly useful in a post flight situation where processing of sensor information using this model could
identify a particular seal that had experienced excessive wear. Most of the seals in the system are modeled using
simple one dimensional equations which can be applied to almost any seal provided that the fluid is gaseous. Afailures is modeled as an increase in the clearance between the shaft and the seal. Thus, the model does not
attempt to predict how the failure process actually occurs (e.g. wear, seal crack initiation, etc.). The results
presented herein were obtained using a FORTRAN implementation of the model running on a VAX computer.
Solution for the seal system properties is obtained iteratively; however, a further simplified implementation
(which does not include the Slinger/Labyrinth combination) has also been developed which provides fast and
reasonable results for most engine operating conditions. Results from the model compare favorably with thelimited redline data available.
17. Key Words (Suggested by Author(s))
Space shuttle main engine; High pressure oxidizer
turbopump; Shaft seals
18. Distribution Statement
Unclassified- Unlimited
Subject Categories 34 and 37
19. Security Classif, (of this report)
Unclassified
20. Security Classif. (of this page)
Unclassified
21. No. of pages
3O
22. Price*
A03
NASAFORM162SOCT86 *For sate by the National Technical Information Service, Springfield, Virginia 22161