l^ffi^js i rep hard copy 3. od $. ö
TRANSCRIPT
H
O
G <
MDC-TDR-64-382
RADAR CROSS SECTION TARGET SUPPORTS - METAL COLUMNS AND SUSPENSION DEVICES
TECHNICAL DOCUMENTARY REPORT NO. RADC-TDR-64-382 June 196A
l^ffi^JS I rep HARD COPY MICROFICHE
3. OD $. ö.ts
L_.
Space Surveillance and Instrumentation Branch Rome Air Development Center
Research and Technology Division Air Force Systems Command
Griffiss Air Force Base, New York
%($o
Project No. 650 3
DDC
DDCIRA B
(Prepared by General Dynamics/Fort Worth, A Division of General Dynamics Corporation under Contract No. AF30(602)-2831)
NOTICES
Copies available at Office of Technical Services.
Qualified requesters may obtain copies from Defense Documentation Center.
When US Government drawings, specifications, or other data are used for any purpose other than a definitely related government procurement operation, the government thereby incurs no responsibility nor any obligation whatsoever, and the fact that the government may have formulated, furnished, or in any way supplied the said drawings, specifications, or other data is not to be regarded by implication or otherwise, as in any manner licensing the holder or any other person or corporation, or conveying any rights or permission to manufacture, use, or sell any patented invention that may in any way be re- lated thereto.
Do not return this copy. Retain or destroy.

BLANK PAGES IN THIS DOCUMENT WERE NOT FILMED
CLEARINGHOUSE FOR FEDERAL SCIENTIFIC AND TECHNICAL INFORMATION, CFSTI DOCUMENT MANAGEMENT BR-:.<CH 410.11
LIMITATIONS IN REPRODUCTION QUALITY
Accession # (/) Ö Co |2.^
pZl i- We regret that legibility of this document is in part unsatisfactory. Reproducticn has been made from best available copy.
/V7 2. A portion of the originsl document contains fine detail which may make reading of photocopy difficult.
/ , / 3. The original document contains color, but distribution copies are available in black-and-white reproduction only.
/ / 4. The initial distribution copies contain color which will be shown in black-and-white when it is necessary to reprint.
/ / 5. Limited supply on hand; when exhausted, document will oe available in Microfiche only.
/ / 6. Limited supply on hand; when exhausted document will not be available.
I 7 7. Document is available in Microfiche only.
I 7 8. Document available on loan from CFSTI (TT documents only).
£79.
Processor« \|*'>
NBS _ 9/64
- :
■ - ■
KADC-TDR-64- 382
RADAR CROSS SECTION TARGET SUPPORTS - METAL COLUMNS AND SUSPENSION DEVICES
TECHNICAL DOCUMENTARY REPORT NO. RADC-TDR-64-382 June 1964
Space Surveillance and Instrumentation Branch Rome Air Development Center
Research and Technology Division j Air Force Systems Command I Griffiss Air Force Base, New York
i Project No. 650 3 i <
(
1 i
(Prepared by General Dynamics/Fort Worth, A Division of General Dynamics Corporation under Contract No. AF30(602)-2831)
RADC-TDR-64-382 June 1964
'
FOREWORD
In order to meet the need for a National Radar Reflectivity Range, Rome Air Development Center (RADC) awarded a development contract on 29 June 1962 to General Dynamics/Fort Worth (GD/FW) to design, fabricate, and develop the Radar Target Scatter Site (Project RAT SCAT) on the Alkali Flats, Holloman AFB, New Mexico, (Contract AF30(602)-2831). The operational RAT SCAT Site was de- livered to the Air Force on 30 June 1964.
The RAT SCAT facility was developed for full-scale radar cross section measurements. In the pursuit of this development, an R&D Program was undertaken to provide for the specific needs of Project RAT SCAT as requirements appeared in the implementa- tion of the function of the Site. A significant portion of this work was subcontracted. Emphasis was placed on those areas thought to be most promising in achieving measurement objectives. The presentation of the results of the R&D Program is covered in eight reports which were prepared as RADC Technical Documentary Reports.
This report (General Dynamics/Fort Worth Report No. FZE-222- 5) is No. 5 in the series. It contains a description of the re- sults of the investigations of two types of target support tech- niques used in making radar cross section measurements, i.e., shielded metal column and suspension target support techniques. The material on the shielded metal column was prepared by Dr. C. C. Freeny of General Dynamics/Fort Worth. The material on suspension target supports was prepared by Mr. R. A. Ross of Cornell Aeronautical Laboratory, Inc., under subcontract to General Dynamics/Fort Worth.
The contents of this zeport and the abstract are unclassi- fied.
t
RADC-TDR-64-382 June 1964
ABSTRACT
The shielded metal column program was devoted specifically to the Investigation of errors In cross section measurement re- sulting from the use of a large, hydraullcally actuated metal target support at the RAT SCAT Site. The analytical model used and the factors taken Into consideration In arriving at a test program for use In evaluating shielding techniques for the metal target support are described In this report. The suspension target support program was an experimental program carried out by Cornell Aeronautical Laboratory. A scale ground plane range was used to simulate low-frequency operation on the RAT SCAT range. Most of the measurements made were for the purpose of determining the cross section return of such conventional sus- pension target supports as nylon. The parameters of primary con- cern were size and the polarization of the transmitter and re- ceiver. This report is No. 5 In a series of 8 RAT SCAT Research and Development Program reports.
PUBLICATION REVIEW
Thit report has been reviewed and is approved. For further technical information on this project, contact
Approved:
Approved:
M. MOITOAr Program Directors' Office Space Surveillance and Instrumentation Branch
CQQIA ' .JOSEPH FALLUC / .Chief, Space Surveillance and /Instrumentation Branch
Surveillance and Control Division
ill
TABLE OF CONTENTS
Section Title Paee
LIST OF FIGURES vii
1 INTRODUCTION I
2 SHIELDED METAL COLUMN INVESTIGATION 3
General 3
Measurement Errors Introduced by 4 Metal Supports
Shielding Techniques for Use with 9 Metal Supports
Test Program for Evaluating 13 Shielding Techniques
Measurement Procedures 13
Data Analysis 14
3 SUSPENSION TARGET SUPPORT INVESTIGATION 17
General 17
The Conventional Suspension Support 19
Suspension Support - General 20 Considerations
RAT SCAT Capabilities and 22 Suspension Supports
Suspension Support for the Low- 24 Frequency RAT SCAT Range
Tower Study 24
Main Line Suspension Study *
30
Vertical Suspension Line Study 36
■ V
•
Section Title page
Target Sling Study 38
Trrget Control Line Study 46
Conclusions 48
Recommendations 49
Appendix - The Scale Ground Plane Range 51
General 51
Circular Polarization Investigation 59
Investigation of the Disturbed 60 Ground Plane Range
vi
LIST OF FIGURES
Number Title Page
2-1 Hydraulic Raa Shield Configurations 10
3-1 Conventional Suspension Support 19
3-2 Support Line Breaking Strength vs. Diameter 21
3-3 Tower Placement Based on Range Gating 25 Considerations
3-A Tower Blstatlc Effects, Vertical Polarization, 26 21-Inch Tower - Target Separation
3-5 Tower Blstatlc Effects, Horizontal Polarization, 27 21-Inch Tower - Target Separation
3-6 Tower Blstatlc Effects, Vertical Polarization, 28 8-Inch Tower - Target Separation
3-7 Tower Blstatlc Effects, Horizontal Polarization, 29 8-Inch Tower - Target Separation
3-8 Radar Cross Section of Horizontal Rods, 32 Vertical Polarization
3-9 Radar Cross Section of Horizontal Rods, 33 Horizontal Polarization
3-10 Main Suspension Line Models 34
3-11 Vertical Support Line Study - Long Lines 37 Vertical Polarization Data
3-12 Vertical Support Line Study • 2-1/2 Inch 39 Line Length Vertical Polarization Data
3-13 Vertical Line Study (Contours of 40 Constant Radar Cross Section)
3-14 Models Used in Target Sling Study 41
vil I V
Number Title
3-15 Radar Cross Section of Cone-Cylinder- Cone Model Vertical Polarization
3-16 Target Sling Study
3-17 Target Sling Study
3-18 Control Line Configuration
Page
43
44
45
46
'
Ä-1 Scale Ground Plane Range
A-2 Field Strength Measurements Above Target Control Pit
A-3 Field Strength Measurement Above Target Control Pit - Linear Cross Polarization
A-4 Field Strength Measurements Above the Ground Plane
A-5 Plane Reference Runs, New Antennas, 34-Inch A-T Station 40, Vertical Polarization
A-6 Plane Reference Runs, New Antennas, 34-Inch A-T Station 40, Horizontal Polarization
A-7 Allowable Height Irregularity
A-8 Comparison of Wet and Dry Subsurface, Vertical Polarization
A-9 Comparison of Wet and Dry Subsurface, Horizontal Polarization
A-10 Field Strength Diagram, Wet and Dry Subsurface, Vertical Polarization
A-11 Turntable Configuration
52
54
55
56
57
58
61
63
64
65
67
vlll
SECTION
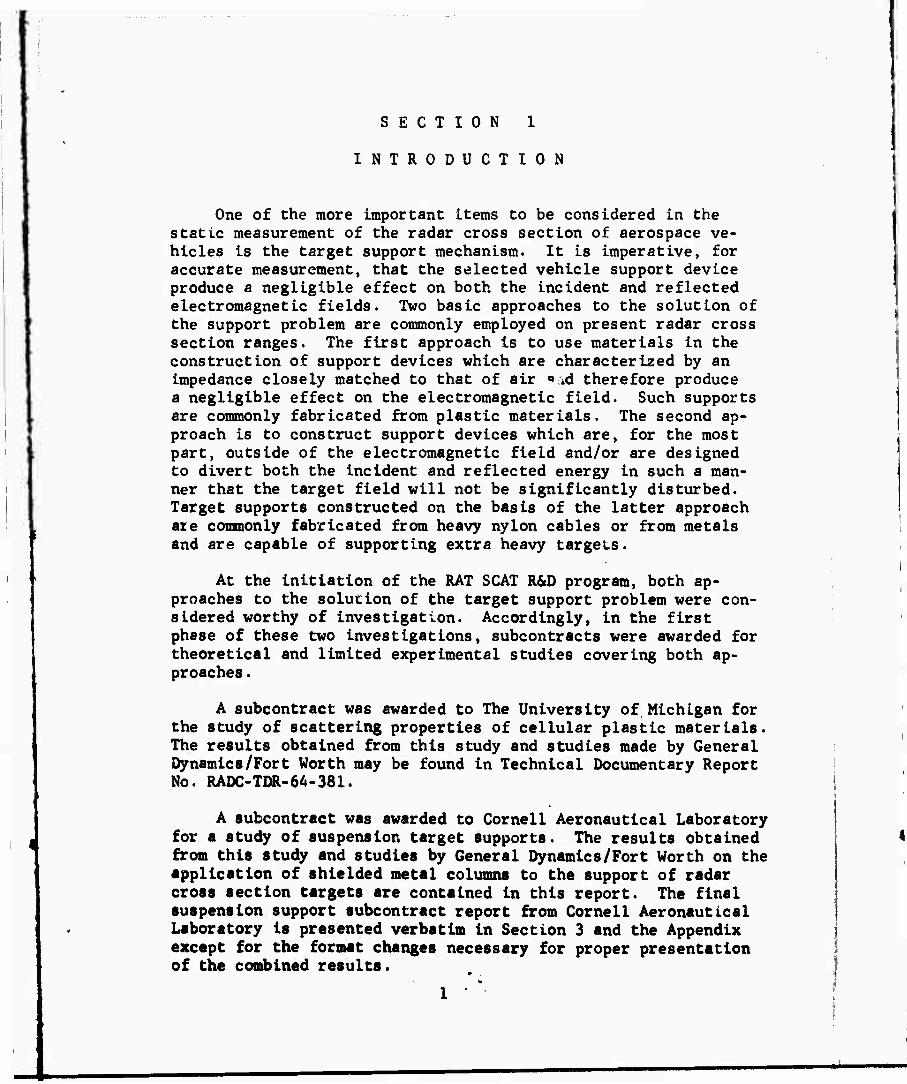
INTRODUCTION
One of the more important items to be considered in the static measurement of the radar cross section of aerospace ve- hicles is the target support mechanism. It is imperative, for accurate measurement, that the selected vehicle support device produce a negligible effect on both the incident and reflected electromagnetic fields. Two basic approaches to the solution of the support problem are commonly employed on present radar cross section ranges. The first approach is to use materials in the construction of support devices which are characterized by an impedance closely matched to that of air s id therefore produce a negligible effect on the electromagnetic field. Such supports are commonly fabricated from plastic materials. The second ap- proach is to construct support devices which are, for the most part, outside of the electromagnetic field and/or are designed to divert both the incident and reflected energy in such a man- ner that the target field will not be significantly disturbed. Target supports constructed on the basis of the latter approach axe commonly fabricated from heavy nylon cables or from metals and are capable of supporting extra heavy targets.
At the Initiation of the RAT SCAT R&D program, both ap- proaches to the solution of the target support problem were con- sidered worthy of investigation. Accordingly, in the first phase of these two investigations, subcontracts were awarded for theoretical and limited experimental studies covering both ap- proaches .
A subcontract was awarded to The University of Michigan for the study of scattering properties of cellular plastic materials. The results obtained from this study and studies made by General Dynamics/Fort Worth may be found in Technical Documentary Report No. RADC-TDR-6A-381.
A subcontract was awarded to Cornell Aeronautical Laboratory for a study of suspension target supports. The results obtained from this study and studies by General Dynamics/Fort Worth on the application of shielded metal columns to the support of radar cross section targets are contained in this report. The final suspension support subcontract report from Cornell Aeronautical Laboratory is presented verbatim in Section 3 and the Appendix except for the format changes necessary for proper presentation of the combined results.
It will be noted in this report that both studies culminated in recommendations for implementation of the program at the RAT SCAT Site. Such implementation was not carried out because of a diversion of contract funds to more promising R&D areas. However, documentation is provided herein that will provide a base line for the continuation and completion of the radar cross section target support investtgation.
i \
SECTION 2
SHIELDED METAL COLUMN
INVESTIGATION
GENERAL
The RAT SCAT R&D shielded metal column task was undertaken to develop methods for making cross-section measurements with a high degree of confidence when a metal column is used as a tar- get support. It was anticipated that the theoretical and experi- mental results of the work could be used as a guide in specifying a uneful shield for the 1.5-foot diameter, 30™foot-long hydrau- lically actuated, metal target support at the RAT SCAT Site. This Technical Documentary Report contains a definition and discussion of the measurement errors considered prevalent in the use of a metal target support. Shielding techniques for reducing these errors are also discussed, and an outline is presented for an ex- perimental program designed to obtain information for evaluating various shielding techniques.
i
MEASUREMENT ERRORS INTRODUCED BY METAL SUPPORTS
The cross section measurement errors arising from Che use or a metal target support can be classified in the same manner as the errors associated with cellular plastic or any other sup- port system. The main distinction in the use of a metal support is that the potential magnitudes of the errors are much greater than those encountered in using cellular plastic supports of a comparable size. A general classification and discussion of tar- get support errors will be presented. This material will then be used in a discussion of metal supports in which it will be as- sumed that the only pertinent measurement errors are those re- sulting from the target support system (i.e., measurement errors, such as equipment nonlinearities, RFI, target mii-alignment, will be considered negligible). A measurement error E caused by a given target support system may be defined as
om - ^t (1)
where
m cross section of target plus the target support system
cross section of target.
The cross sections used in Equation 1 may be either mono- static or bistatic, as well as a function of target orientation and/or polarization. However, since the target support error classifications are independent of these parameters, the above factors will not be used in indexing the appropriate parameters. In general, Equation 1 is only of academic interest since E, (rm, and Ofc are ueuslly unknown; but subject to various assumptions, it can be used to estimate either E, crm, or ^t* The most general- ly used assumption is that (% can be determined by comparing the return of the target with the return from an object whose cross section is known (e.g., that of a sphere). In other words, the system can be so calibrated that a negligible resultant error is obtained because the power level seen by the receiver has been con- verted to dbsm in an erroneous manner. In the evaluation of a support system, such as a metal column, this assumption should be quite valid. For example, use of a sphere, mounted on a Styrofoam column or hoisted by a balloon, should enable the calibration of the system to at least an order of magnitude better than the errors associated with "t because of the metal target support. Hence, in
4
the remaining discussion, <% will be taken as a measurable quantity in terms of dbsm. If crm is known, then confidence limits on E can be obtained by using a target with a known cross section. In turn, these confidence limits can be used in measuring a target when its cross section is known only to an order of magnitude. The latter situation constitutes the practical application of Equa- tion 1; whereas the former case is useful in any attempt to es- tablish confidence limits for E. Since the establishment of con- fidence limits for E is the objective set for this program, the cross sections of the targets to be used in the experimental pro- gram will be taken as known quantities (e.g., the targets may be measured in the manner suggested for calibration).
To estimate the error represented in Equation 1, individual sources of error and their relationship to the total error will be formulated. The reason for the use of this approach, rather than the direct use of Equation 1, is that "representative" tar- gets have not been defined; consequently, an estimate for the total error E is not as meaningful as estimates for components of E, i.e., targets are available and experiments can be designed for the investigation of the individual errors which contribute to the total error.
The individual errors which contribute to the total error may be divided into three types. These errors will be defined by using the following nomenclature along with the earlier defini- tions :
tTg = cross section of target support system without target and without cancellation.
o-s' ■ cross section of target support with target and with- out cancellation.
o-g" ■ equivalent cross section of cancellation signal.
^'t " cross section of target as modified by the target support system.
0 (with appropriate Indexes) - phases associated with the appropriate cross section returns.
The first type of error is considered In terms of a ratio be- tween the cross section of the target support system and the cross section of the target which Is being measured. This error factor will be denoted by Efe and is defined as

% O)
The second cype of error represents a measure of the induc- tion of the E|) type of error which is achievca through ceucella- tion. This error will be denoted by Ec and is defined as
\ v i(0s " ^s) (3)
The third type of error is a measure of the potential error- introduced by coupling between the target and the target support. This error will be divided into two terms, as suggested, from consideration of a system of only two scatterers. The first coup- ling error will denote the cross section change of the support caused by the target and will be denoted by Ets• The second coup- ling error will denote the influence of the support on the target cross section and will be denoted by Est« These two errors are defined as
^ts M~ (4)
-st 1 - \
oy £ ic^'t - 0t) (5)
■
To relate the above error factors to the total error, the target support cross section, o-mjcan be expressed in terms of
^t'» ^s'» and ^s" as
m {^e 10,S - iv,£ i0S" ^ (V6 i^t' (6)
By solving Equations 3, 4, and 5 for the appropriate terms indi- cated in Equation 6, ar^ can be expressed in terms of the measur- able quantities <rs and (rt, along with the errors Ec, Est, and Ets- With these substitutions, o-m Is expressed as
'm J^ e^s (1. J^c i0ts) ^e i0c +^€ i0t(1. ^.e i0st)
(7)
By using Equation 7, along with Equations 1 and 2, the total er- ror E can be expressed as
Jve (i- Ks*i0t8)c 1(0st0c)^ i0t(i- NfiTt6 i0st) (8)
Equation 8 indicates the manner in which the three types of er- rors are vectorially related to form the total error. However, even though the individual coupling errors help to provide a physical picture of the problem, they cannot be separated by ex- periment (except for the trivial case of complete independence). Hence they are combined for evaluation,as suggested by Equation 8. This combined coupling error will be denoted by Exs and is defined as
ETS \|EbEcEts i(0s-^c^ts) Kte i(0st+0t) (9)
3y using Equation 9 in Equation 8, the total error can be writ- ten as
6 i(0S+0c-0t) . JZ:€i(0TS-0t) + ! (10)
Dcpanding Equation 10 into an incoherent (amplitude only) and co- herent (amplitude and phase) term gives
E - EbEc + ETS + 2 I - yjETSEbEc cos(0s-f^c-0TS)
+ ^EbEc cos(0s-^c-0t) - ^7co8(0TS-0t) (ID
If it is assumed that the amplitude and phases in Equation 11 are independent and the phases are distributed uniformly over 2T, then the average error is given by
E ■ EbEj. + EJS (12)
Although the «ssunptlons used to obtain Equation 12 are valid only when a large class of targets and/or repeated measurements are considered, this equation can be used to show that a positive aver- age error tends to exist. Actually, because of the quasi-fixed
7
relationship between the target and support (limited target shapes, measurement frequencies, and spacing between target and support) in the test program, a somewhat biased average coupling error may be obtained. To indicate that a value of average coupling error is determined from a limited test program, the average coupling error will be denoted by ETS«
In the case of conditions commonly achieved by using Styro- foam supports, errors calculated from Equations 11 and 12 are com- pared by using the maximum positive error obtained from Equation 11. The maximum positive error will be denoted by EJJ and defined by
EM = EbEc -r E^ + 2(jETSEbEc + {E^ + Ji^) (13)
Two conditions are often encountered in outdoor pulse ranges when Styrofoam columns are used as target supports: Ec - 1 (no cancel- lation is used), and Eb-.Ol (i.e., the target support is at least 20 db down from the target to be measured). In the case of the above conditions, it is observed that orm is never more than 1 db larger than ^t when Equations 13 and 1 are used and the coupling error, Exs, is neglected. If the conditions used in the above example are imposed on the average errors represented by Equation 12, it is observed that the average measured cross section level, (Tm, differs from the cross section level, o't. by only 0-^3 db. Similar conditions are often assumed for Indoor ranges, except that Ec ^ 1 and EbEc are taken as i.01 since cancellation is us- ually necessary on an indoor range. On both types of ranges, where Styrofoam or other low dielectric material target supports are used, the coupling errors are usually neglected. However, for the case of metal target supports, the coupling error may present a major difficulty in achieving accurate cross section measure- ments. The remainder of this note is devoted to the discussion of methods for reducing the errors encountered when metal supports are used.
8
SHIELDING TECHNIQUES FOR USE WITH METAL SUPPORTS
From the previous analysis, it is evident that a technique for shielding a metal support should be evaluated in terms of the errors E^,, Ec, and ETS« In addition, other factors, such as cost, installation and storage time, maintenance problems, etc., need to be considered. Before techniques for shielding the hydraulic ram at the RAT SCAT Site are considered, several facts concerning the ram are discussed.
An advantageous feature of the ram, relative to the error Ec, is that the ram does not rotate. Target rotation will be accom- plished by a rotator on top of the ram. However, the rotator will probably be larger in diameter than the column itself; consequently, Ei, will tend to increase. A disadvantageous feature, relative to cancellation, is that the ram will be used to raise the targets to the required measurement heights. Hence, to use cancellation, any shield which is attached to the ram must be so designed that its geometrical relationship relative to the ram can be controlled quite accurately. Another factor which will tend to increase Eb, and especially ETS and Ec, is that the target will not be appre- ciably elevated above the top of the metal rotator by any low di- electric support, such as Styrofoam. Consequently, the rotator will be illuminated with the same intensity wave as the target. Normally, these errors are reduced by raising the target several feet above the rotator with a support, such as Styrofoam. How- ever, because of the target weights anticipated for the hydraulic ram, this approach is not feasible.
A desirable operational feature would be the capability for operating the ram from several heights (e.g., 10, 20, 30 feet). To attain this operational capability, the shield would also have to be devised to Include this capability. Another desirable op- erational feature is the ability to use the ram for bistatic as well as raonostatic cross section measurements. Hence a technique for shielding the ram should be considered relative to Its bistatic as well as its monostatlc properties.
4 Three shields are considered for reducing the measurement errors to be encountered in connection with the use of the hydrau- lic ram. These were chosen after consideration of the two basic methods used in cross section reduction of any target. The two basic methods are (1) use of materials placed on the target, such as absorbers and (2) shaping of the target. A combination of target shaping and absorber materials can be considered as a third method. These three reduction techniques will be investigated by evaluating the shields shown in Figure 2-1 in terms of the errors and operational features discussed earlier.
9
1
C/5
Q r' r
'
Ü
^(
«
M
Ü
I K
M
I I
CM
00
-0
•
The wedge shield without absorber Is representative of a metal shield shaped to reduce the cross section from that of the metal cylinder (configuration a In Figure 2-1). When this type of shield Is used, simple analysis (physical optics) Indicates the target support return at small blstatlc angles can possibly be made 30 to 50 db lower than the return obtained from the metal cylinder.
Shield configuration b, shown In Figure 2-1, Is representa- tive of the application of pure absorber techniques. Although the target support return will probably be somewhat larger than that obtained by use of the metal shield, application of the technique shown In configuration b appears to provide the best operational characteristics of all techniques considered. Shield configuration c, shown In Figure 2-1, represents a combination of Shield configurations a and b.
Although the shields shown In Figure 2-1 may not represent the ultimate design obtained by use of the shielding concepts dis- cussed heretofore, they should be sufficient to obtain a relative Indication of the technique which can be used to show the least measurement error. Hence If there are no significant differ- ences In the measurement errors encountered In measurement of the basic shields Illustrated In Figure 2-1, the recommended shield- ing techniques for RAT SCAT should be based on considering cost and other operational characteristics of the shield.
The wedge shields may be constructed from two 2/8-Inch sheets of 3- by 8-foot plywood. The surface seen by the radar may be covered with aluminum foil to simulate the metal wedge shown as configuration a In Figure 2-1. To obtain the absorber-covered wedge shown In configuration c, the plywood wedge may be covered with absorber. The wedge may be Installed on wooden supports which lift Che bottom of the wedge approximately 1 foot from the ground. The front support should be adjustable so that the tilt angle of the wedge can be adjusted. The wedge half angle should be that needed to obtain a "cone-sphere" type of matching between the wedge and cylinder boundaries
The metal cylinder covered with absorber can be constructed by using the 16-inch diameter, 10-foot long metal cylinder which has been shipped to RAT SCAT for use In the Range Geometry and Ac- curacy Investigation Program. The cylinder may be covered with 2- by 2-foot VHP absorber which is available at the Site. Since the circumference of the cylinder is slightly over 4 feet (4.16 feet), 10 pieces of available absorber will cover the cylinder.
II
The length of the shields was chosen on the basis that the shields would be relatively inexpensive to construct yet of suf- ficient length to enable conservative estimates of the measure- ment error which can be expected from longer shields. The only expected difference between the measurement errors obtained by evaluating 10-foot-long shields and that obtained from longer shields is the difference in magnitude of the error Eb» In other words, the coupling errors are assumed to be "localized" within a region extending 10 feet from the target.
12
TEST PROGRAM FOR EVALUATING SHIELDING TECHNIQUES
An average coupling error ETS may be estimated for the three types of shields by using the data obtained when frequency step- ping is used. Although frequency stepping is only available at band 7, it seems reasonable to assume the test results will be indicative of test results from similar experiments at bands 4, 5, and 6 because of the large (compared to wavelength) size of shield and targets being considered. A test program is outlined below in steps 1 through 9.
Measurement Procedure
1. Band 7 is set up to operate at a stepped frequency be- tween 8.8 and 9.8 gigacycles.
2. A 36-inch sphere is mounted on a Styrofoam column 10 feet in length and 19 inches in diameter, and the antennas are adjusted for a target height of 10 feet. The phase average return is recorded for horizontal and vertical polarizations for 36-, 24-, and 12-inch spheres, along with the return from a 80-inch, 16-inch diameter cylinder mounted horizontally.
3. A 4-foot saddle is then placed on top of the column, and returns from off-center rotation of three spheres are re- corded for both vertical and horizontal polarizations.
4. The Styrofoam column is then replaced by an absorber- covered cylinder. The cylinder is rotated and the return for both polarizations is recorded.
5. Step 3 is then repeated.
6. The 80-»inch cylinder is placed on top of the column and the return for both polarizations is recorded. This step is then repeated for the 16-inch cylinder.
7. The absorber is removed from the cylinder support and the conducting wedge is placed in front of the cylinder. The return at zero azimuth angle is recorded for tile angle settings of 0, 5, ID, and 15 degrees for both hori- zontal and vertical polarizations.
8. The wedge tilt angle is then set at zero, and Steps 3 and 6 are repeated by rotating the 80-inch cylinder saddle and sphere saddle manually. The return of the 80-inch
13
cylinder is recorded at azimuth angles of 0 through 90 degrees in 10-degree increments. These steps are then repeated for the 16-inch cylinder. The return from the spheres is recorded from 0 through 100 degrees in 20- degree increments for both horizontal and vertical polari- zations.
9. Absorber material is then placed over the conducting wedge, and Steps 7 and 8 are repeated.
By using the test data obtained from the tests outlined above, an average coupling error E^s n«y he computed for each of the three shields. The procedure to be used in computing Exs is described in the next paragraph.
Data Analysis
At each azimuth angle, the phase-averaged return obtained in step 2 is denoted by (rt for each target. Likewise, the phase- aver agedjre turn of the shield is denoted by <r8. An estimate of Eb, say Ef) maximum, can then be obtained by using ^t an^ ^s in Equation 2. <% is used to denote the phasg-averaged return of the target plus shield; the average error E can then be estimated as indicated by Equation 1. To obtain Exs, Equation 11 can be written in the form suggested earlier as
E - Eb + Exs (1^)
in order to indicate that the coupling error term may be biased either positively or negatively. When E and Eb of Equation 14 art estimated as outlined above, for each of the five targets.,. Esx can then be estimated at each azimuth by averaging 1 and Eb relative to the five targets. Plots of Irs can then be made as a function of azimuth for use in rating the three shielding methods.
A rating of the three shields, relative to the error Eb. can be made from similar plots. However, since the use of cancella- tion is contemplated in order to reduce the error Eb, comparison of the shielding techniques should be made relative to EbEc rather than Eb* Cancellation la not used in the test program since it is not practical with frequency stepping; nevertheless, the esti- mate obtained for the average coupling error is Indicative of the potential effectiveness of using cancellation. For example. If ITS approaches zero In the case of one shield and approaches -lb
14
■t^*
■
In the case of a second, cancellation can probably be used to In- crease the measurement accuracy In the first case, while the meas- urement accuracy Is likely to be decreased In the second case (I.e., the first case Is Indicative of Independence between tar- get and support whereas the second case Is Indicative of a high degree of coupling, such as shielding of the target support). The error Ec will also be Influenced by the common stability problems associated with maintaining correct amplitude and phase of the
cancellation signal J^V» e^s. Ideally, the cancellation signal,
^s € S, Is set equal to the support return without target,
\ Og £^*8, However, several factors Influence the degree to which
the Ideal condition can be approached. The degree of stability re- quired for useful cancellation Is discussed In the RAT SCAT R&D Report on discrimination techniques. This referenced report (General Dynamics/Fort Worth Report No. FZE-222-8, dated July 1964) Is documented as an RADC Technical Documentary Report. The perti- nent stability problems presently under consideration are those associated with removal and replacement of a shield and Its wind characteristics. In both respects, the absorber shield configura- tion b Illustrated In Figure 2-1 appears to be the best design.
■i.
■ i:
%
! s
\ '• 15 ,:;?
1
'
SECTION 3
SUSPENSION TARGET SUPPORT
INVESTIGATION
GENERAL
The investigation of suspension target supports described in this section was conducted by Cornell Aeronautical Laboratory, Inc. under subcontract to GD/FW as part of the RAT SCAT R&D Pro- gram. The Cornell material is presented verbatim with the excep- tion of the changes needed to ensure uniformity of format of the overall report. An examination of the results obtained by Cor- nell has revealed the following in terms of applicability to RAT SCAT:
1. The reduction in the return from a suspension support tower should be significantly less than the 70 db stated herein because the intermediate system will ring for a significant period of time after the onset of a received pulse. A receiver design with a range gated local oscil- lator could be used to reduce this effect significantly although other features which commonly reduce the theo- retical range resolution of pulsed radar may then become significant. This comment can be interpreted in terms of tower and line load requirements, i.e., at the dis- tance between the tower and the target necessary to achieve a high degree of reduction by range gating, the tower load and line size requirements may be excessive.
2. The off-normal relationship between the target rotation axis and the radar boresight can be small, as suggested. The angular error is about 30 and 20 minutes from the local horizontal In the respective cases of Pits II and III. This tilt angle does not exceed that specified for the accuracy of the azimuth angle. It is suggested that this tilt error may be further reduced by utilizing a small cellular plastic column to bear a small percentage of the target load; in addition, this configuration may aid in reducing any tendency of the target to oscil- late in the tilt or azimuth planes. *
t I
3. A null of suitable extent and depth above the main lobe, | in which to place the main suspension line, may be dif- j flcult to realize in the case of certain range |
I 17 I
configurations and frequencies. This effect has been observed experimentally and shown theoretically for large D/X antennas.
4. Operational nulling equipment is not available at the RAT SCAT Site although R&D experimental background sub- traction equipment for Band 4 (1 to 2 gigacycles) has been implemented and may be of value in analytically reducing the effective level of portions of the suspen- sion support configuration.
18
.
THE CONVENTIONAL SUSPENGION SUPPORT
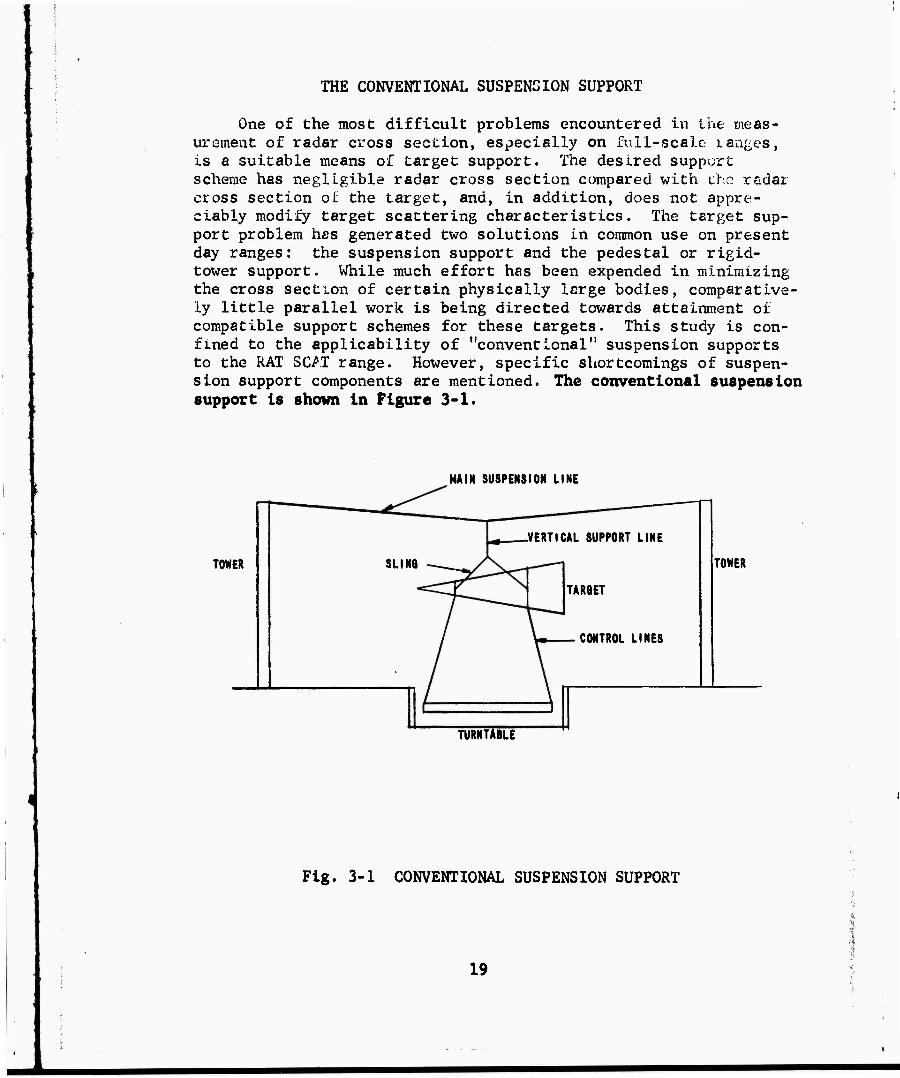
One of the most difficult problems encountered in the nteas- urament of radar cross section, especially on full-scale ranges, is a suitable means of target support. The desired support scheme has negligible radar cross section compared with iho radar cross section ot the target, and, in addition, does not appre- ciably modify target scattering characteristics. The target sup- port problem has generated two solutions in common use on present day ranges: the suspension support and the pedestal or rigid- tower support. While much effort has been expended in minimizing the cross section of certain physically large bodies, comparative- ly little parallel work is being directed towards attainment of compatible support schemes for these targets. This study is con- fined to the applicability of "conventional" suspension supports to the RAT SCAT range. However, specific shortcomings of suspen- sion support components are mentioned. The conventional suspension support is shown in Figure 3-1.
MAIN SUSPENSION LINE
TOWER SLINQ
VERTICAL SUPPORT LINE
TARGET
CONTROL LINES
TONER
TURNTABLE
Fig. 3-1 CONVENTIONAL SUSPENSION SUPPORT
19
Suspension Support - General Considerations
The conventional suspension-type target support illustrated in Figure 3-1 consists of towers (usually two), a main suspen- sion line, a vertical support line, a target sling and target con- trol lines. Cross-section accuracy is maintained by
1. Minimizing tower effects through shaping, absorber mater- ials, location of towers in nulls of the field pattern, and range gating techniques,
2. Reducing main suspension-line interactions by means of aspect control and placement above the main beam.
Three components remain in the main beam of the radar. Because control lines consist of smaller-diameter guy ropes, they do not warrant consideration compared to the vertical support line and target sling, although care in selection of these ropes and their placement may be necessary for targets having very small cross sections. Proper design of the latter two components insures a range capable of high-precision cross section measurements.
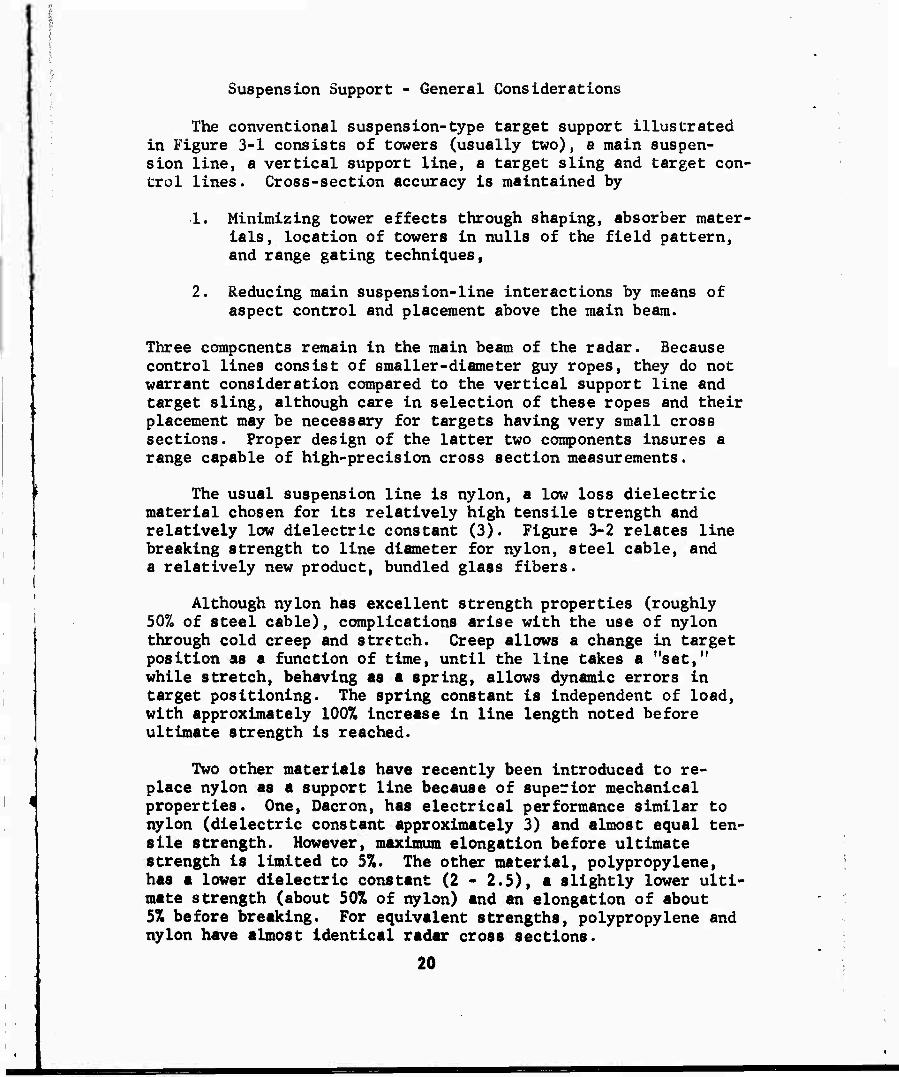
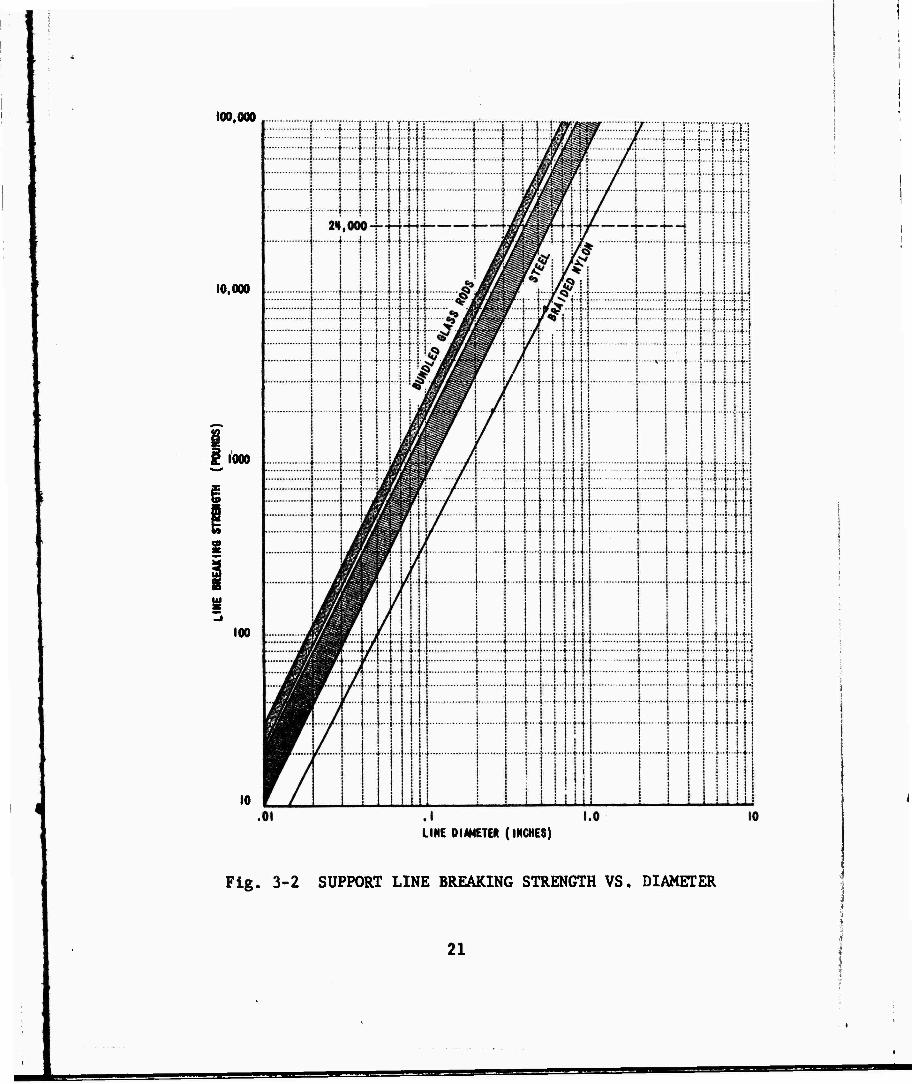
The usual suspension line is nylon, a low loss dielectric material chosen for its relatively high tensile strength and relatively low dielectric constant (3). Figure 3-2 relates line breaking strength to line diameter for nylon, steel cable, and a relatively new product, bundled glass fibers.
Although nylon has excellent strength properties (roughly 30% of steel cable), complications arise with the use of nylon through cold creep and stretch. Creep allows a change in target position as a function of time, until the line takes a "set," while stretch, behaving as a spring, allows dynamic errors in target positioning. The spring constant is Independent of load, with approximately 100% increase in line length noted before ultimate strength is reached.
Two other materials have recently been Introduced to re- place nylon as a support line because of superior mechanical properties. One, Dacron, has electrical performance similar to nylon (dielectric constant approximately 3) and almost equal ten- sile strength. However, maximum elongation before ultimate strength is limited to 5%. The other material, polypropylene, has a lower dielectric constant (2 - 2.5), a slightly lower ulti- mate strength (about 50% of nylon) and an elongation of about 5% before breaking. For equivalent strengths, polypropylene and nylon have almost Identical radar cross sections.
20
100,000
10.000
1000
100
'
10
]■ •! ••!■ f i-H
LINE DIAMETER (INCHES)
Fig. 3-2 SUPPORT LINE BREAKING STRENGTH VS. DIAMETER
21
I
Of the three materials, polypropylene exhibits the finest environmental and aging behavior. While both nylon and Dacron deteriorate under prolonged exposure to ultraviolet, becoming brittle and losing strength, polypropylene remains relatively un- affected. Furthermore, it is less hygroscopic, retaining about 1% moisture after prolonged submersion, compared to the 10 to 15% noted for nylon. The surface of polypropylene is also easier to maintain in terms of dust and grime accumulation; while nylon can retain a coat of foreign matter, it is almost impossible to "stick" a coat of anything to polypropylene.
A recent development that may replace all three plastics as a support line is bundled glass fibers. With a dielectric con- stant of 3.5 and an ultimate strength of roughly 10 times nylon, it is apparent that such lines will have a cross section 10 db less than a nylon line of equivalent strength. Unfortunately, present glass lines are easily damaged, since small nicks and scratches drastically modify ultimate strength, and thus re- quire extreme care in handling. It is expected that they will become practical when suitable protective coverings are developed.
Line fastenings should, in the case of multistrand lines, follow accepted practice of eye-knots or equivalent to retain strength capability. A 50% loss in load capacity can be noted through improper fastening. In those cases where the line must pass over a pulley or roller, the pulley diameter must be as large as possible to relieve localized stress.
RAT SCAT Capabilities and Suspension Supports
RAT SCAT range characteristics pertinent to this discussion include ground-plane operation, use of range-gating techniques, bistatic-cross section measurement capability, and proposed meas- urements at discrete frequencies throughout a broad frequency in- terval. The first two characteristics promise ease of support construction and measurement accuracy; the latter two capabilities can Impose definite limitations on the application of suspension supports to RAT SCAT.
Aspects Easing the Suspension Support Problem
Ground-plane-range operation allows the upper null of the first lobe of the field to be about 50 feet about the ground plane. Placement of a sagged main suspension line in this null thus can be accomplished with towers less than 150 feet high.
The use of pulse gating techniques on the RAT SCAT range
22
^^
provides additional reduction of tower and main suspension line disturbances. Towers may be located such that direct reflection and bistatic interactions from towers are effectively eliminated. Range gating will also reduce the main suspension line contribu- tion to measurement errors.
Aspects Complicating the Suspension Support Problem
A problem that arises with a suspension support used in con- junction with either an oblique range or a ground plane range is the off-normal relationship between target rotation axis and radar boresight. The "soft" control afforded by lines does not allow effective target rotation about axes other than that parallel to the local "g" vector, so that rotation axis intersects boresight axis at 90° plus boresight elevation angle. Compensation for this condition can be accomplished through data reduction, although the error iitroduced in most cases is of secondary importance.
The application of suspension supports to cross-section ranges contemplating bistatic measurements can limit the utility of the range, unrestricted bistatic capability in azimuth re- quires moveable towers or a portable transmitter-receiver configu- ration. It is concluded that suspension supports have limited application to such ranges. In the following analyses it is as- sumed that measurements are performed monostatically or at small bistatic angles (less than 10 degrees).
23
I
SUSPENSION SUPPORT FOR THE LOW-FREQUENCY RAT SCAT RANGE
Tower Study
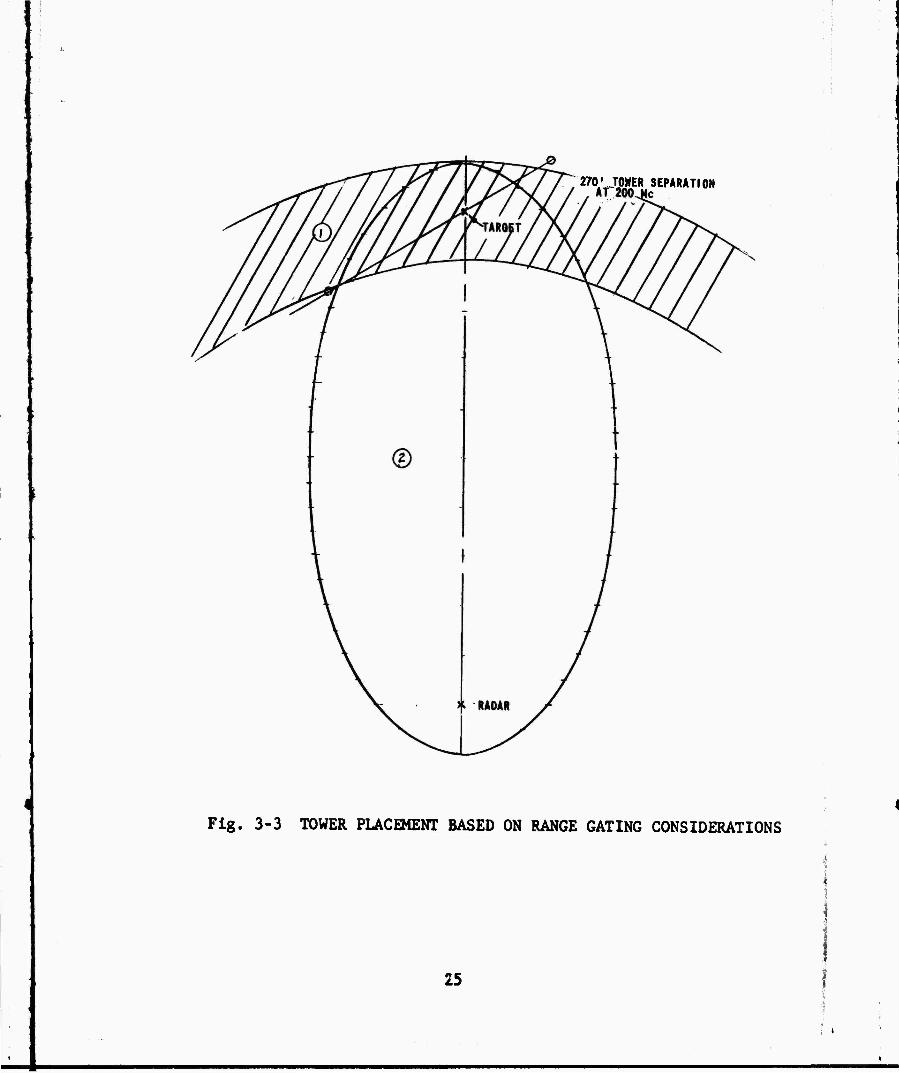
Figure 3-3 illustrates the situation to be found on the RAT SCAT range, where a 100/u sec transmitted pulse and a 100 ^ sec range gate are employed. Area (T) of the figure shows the equal range region, where time differentiation between true target and spurious responses cannot be accomplished. Area (2) is the reg- ion where bistatic interference occurs between the true target and environment, and is again impossible to gate out.
By placing the towers outside areas (T) and (2) a large measure of tower discrinlnation is possible. For example, assume a gate discrimination capability of 70 db. Then the signal scat- tered from the towers will be reduced in the receiver by at least 70 db. Since this signal occurs outside the time interval for reception of target signal, it need only be slightly less then target signal. Thus, for a -60 dh/square meter capability, tower cross section, if illuminated by the main beam, could be as much as 10 db/square meter. Quite fortunately, the towers could be located in antenna side lobes and, assuming at least a -30 db two way side lobe level (well designed antennas should yield 60 db), tower cross section can be as high as 40 db/square meter. It thus appears no special tower treatment is required (such as placement of radar absorber) in order to achieve effective direct return reduction.
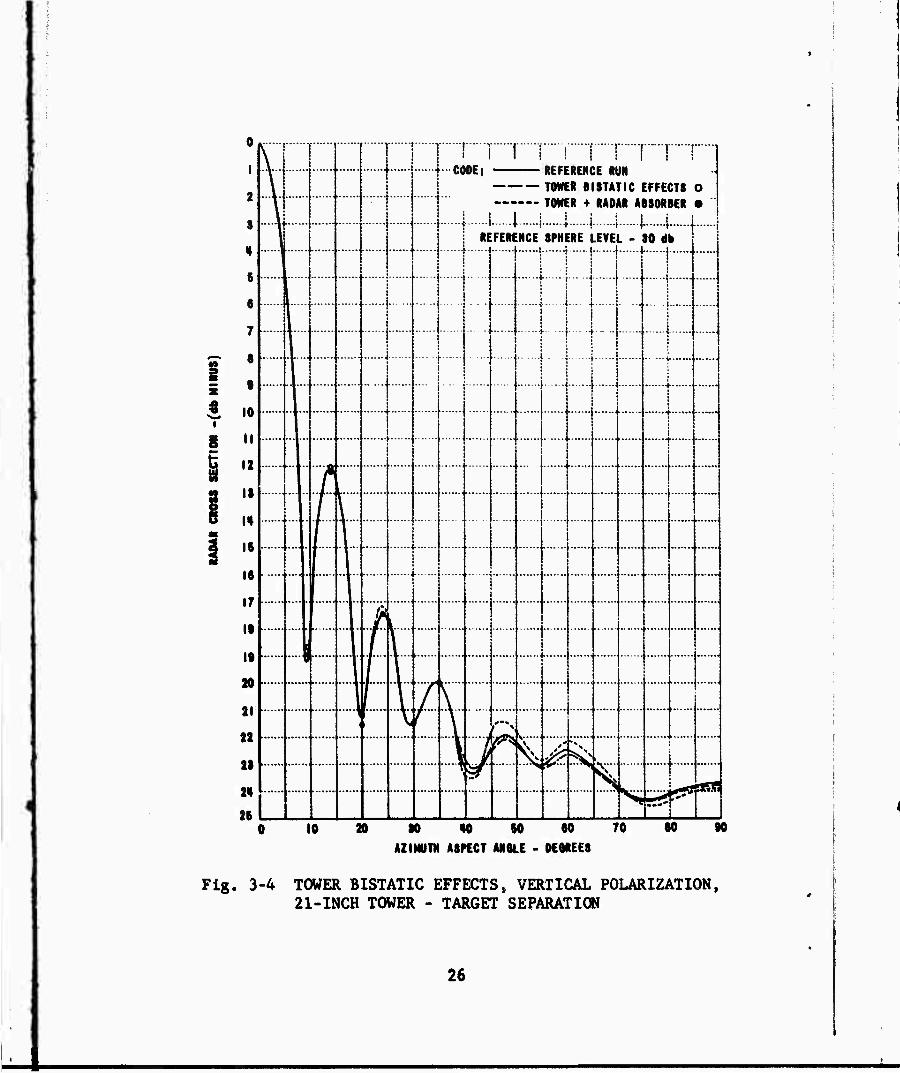
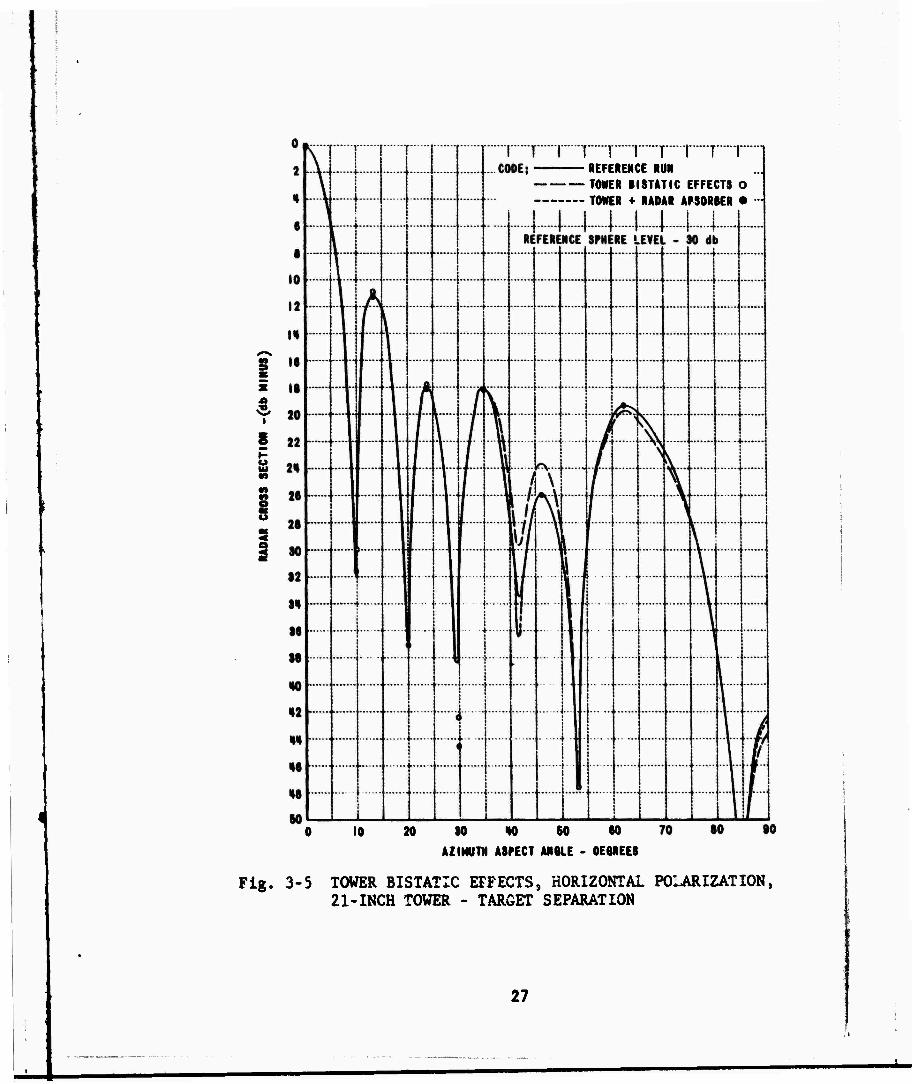
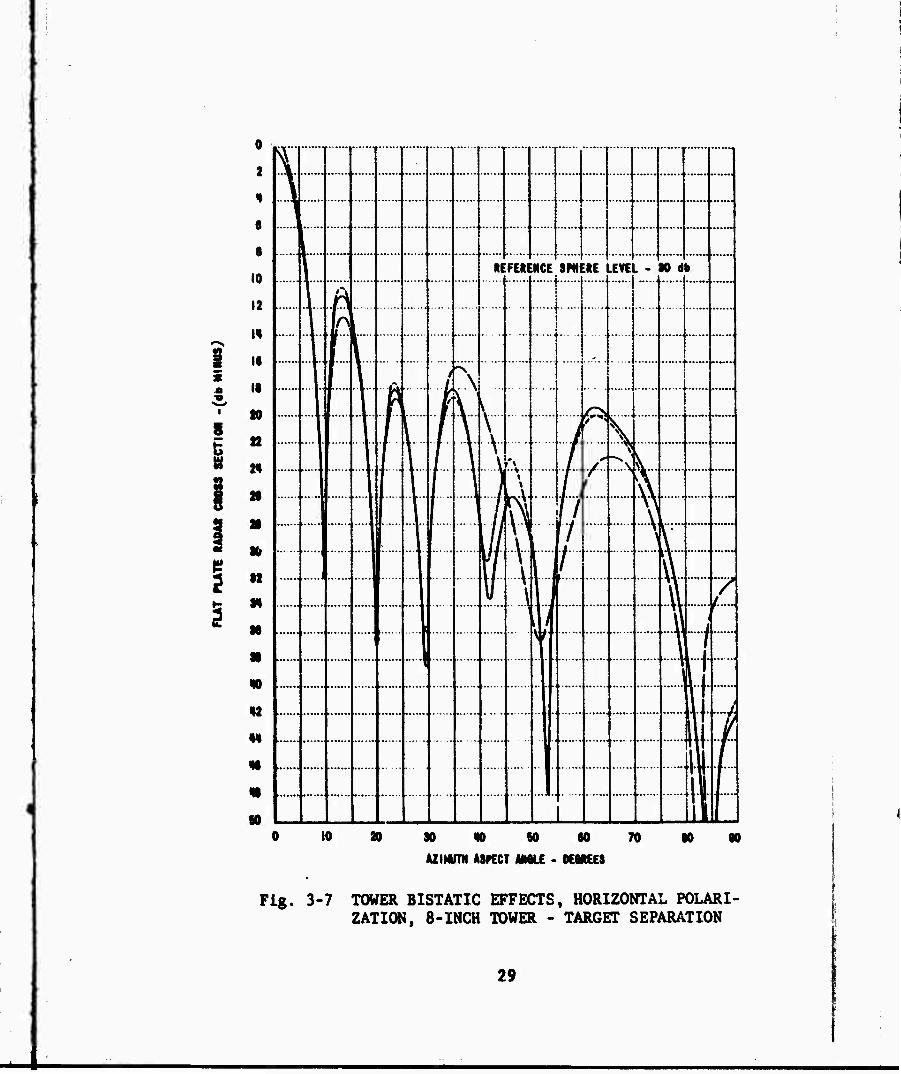
Bistatic interference effects are not quite as simple to predict analytically, although the 70 db reduction is still achievable through range-gating. In order to obtain firm data on bistatic interaction, a simulation program was conducted on CAL's scale ground plane range, with results shown in Figures 3-A through 3-7.
Here towers were simulated by two 5/8 copper pipes 10" high, corresponding to 150* towers 12' In diameter at 200 mcs. A one inch flat plate was used as a target since It exhibits a well understood and large bistatic cross section.
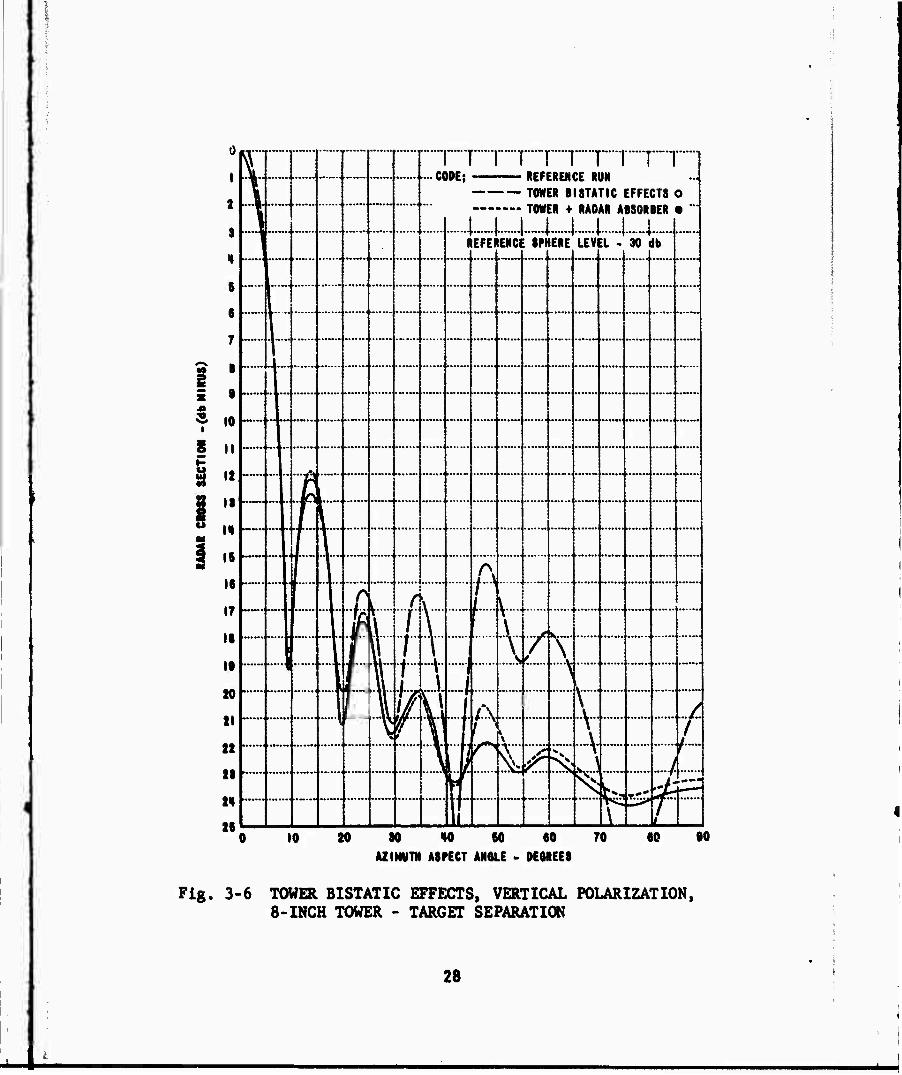
Comparisons between free space cross section and those ob- tained with the pipes in place at 21" and 8" respectively from the target are shown In Figures 3-4 to 3-7. From these data it can be seen that the main bistatic interaction is at the 8" sepa- ration (100* full scale) and is approximately 20 db below the peak cross section value. As a consequence, the maximum bistatic
24
270;VJ0|»ER SEPARATION "1c
Fig. 3-3 TOWER PLACEMENT BASED ON RANGE GATING CONSIDERATIONS
25
I
8
20
21
2
2
2«
26
1 1
...HI
t 1
OE,' 1 i i i i I i
i * .......
vo
ncrcncnvc win TONER BlSTATIC EFFECTS O TOWER + RADAR ABSORBER • Li 1 1 i i 1 1
i 1 . 1 . i
REFERENCE SPHERE LEVEL - 90 db j j l l i t i ! I'll
— I-;I i
i i i
1 I
) i L 1 i
! j ; . .i • i ';
.,-..».rf
t
.—...
::: ......
.......
H
H
— r
i...
7;
v
2
Q
I
4 ^ k....
L
ass 's ■J^> 10 20 SO W SO «0 70
AZINUTN ASPECT ANOLE - DEGREES
80 90
Fig. 3-4 TOWER BISTATIC EFFECTS, VERTICAL POLARIZATION, 21-INCH TOWER - TARGET SEPARATION
26
■
T 1 ( T" ■ REFERENCE RUN
s
I
M
I
TWER IISTATIC EFFECTS O TOWER + RADAR AMORBER •
Fig.
to w so w AZIMUTH ASPECT ANOLE - DEGREES
3-5 TOWER BISTATIC EFFECTS, HORIZONTAL POLARIZATION, 21-INCH TOWER - TARGET SEPARATION
27
I
o
i
2
3
•I
6
6
7
8
9
10
II
a „ It
\%
IS
16
17
IS
IS
20
21
22
2t
21
26
L—
v
■
> j
y.. J
*
E 1 \
\
y
i
■
^
1
i r ■»■•
r 1 ] -CODE;
1 i i i T i rrn REFERENCE RUN -4 TOWER SI STATIC EFFECTS O
V 1
1
...J.
EFEI
^ ENCI
- ■
\
\ : SPI ......j
/ t....
Z
IERE
\
■■■\
nnw
LEV!
v •v V
■L - 1 30
......
.......
lb
......
1
\ '
U f
]
i 10 20 SO «O 60 60
AZIMUTN ASPECT AN6LE - DE6REES 70 60 SO
Fig. 3-6 TOWER BISTATIC EFFECTS, VERTICAL POLARIZATION, 8-INCH TOWER - TARGET SEPARATION
28
■
■^1
i ■9
I
M
22
2«
21
21
»
12
n N
«
m 12
W
«•
m 80
s frv
i
f
J
\
III
\ V \
FEII
'v..
\
\
^
MCE
1
sn
f/ ; i
•RE
.. . .
P
/
IEVE
—
...A
L -
j
j
i\-
L .u...i
U M
i ]
[
I •
i
||
L- L
10 20 30 W 60 60 70
AZINOTN ASPECT AMLE - DEMEES
W 90
Fig. 3-7 TOWER BISTATIC EFFECTS, HORIZONTAL POLARI- ZATION, 8-INCH TOWER - TARGET SEPARATION
29

■
effect noted on a full scale gated system should be approximately 90 db below the peak monostatic cross section value. Allowing 10 db/square meter for maximum target cross section, it can be seen that bistatic effects should prove negligible.
In order to verify the efficacy of absorbent in reducing bi- static interference, both posts were covered with a 20 db absorber. As expected, the interference was reduced by about 20 db. It thus appears certain that towers can be built that will meet the RAT SCAT requirements.
Main Line Suspension Study
TWo procedures exist by which the direct return from a con- ventional main suspension line can b? reduced. First, main line azimuth orientation can be chosen such that a cross section mini- mum is produced in the back scattered direction. Second, main line height can be chosen such that the line lies essentially in a null of the vertical field pattern.
Two programs were run on the scale ground plane range to evaluate the return from the conventional main line. The first was concerned with azimuth aspect dependence of the line cross section, the second treated the resultant cross section of realis- tic configurations under minimization conditions.
The cross section of nylon lines at RAT SCAT frequencies was determined through model tests of nylon rods at a frequency of 35 Gc. Such tests are valid provided the lines have essentially the same dielectric constant at the scale frequency as at the full scale frequency. Under this condition, the full scale line diam- eter is given by:
Am
where ^tn ^8 the wave length used in measurement, D^ is the actual diameter of line measured, X0 is full scale wavelength and D0 is full scale line diameter, while full scale cross section is given by:
2 2 ^o " (^o/xra)o-m (15)
where orm is measured cross section.
30
Preliminary atudy of Main Line Radar Cross Section
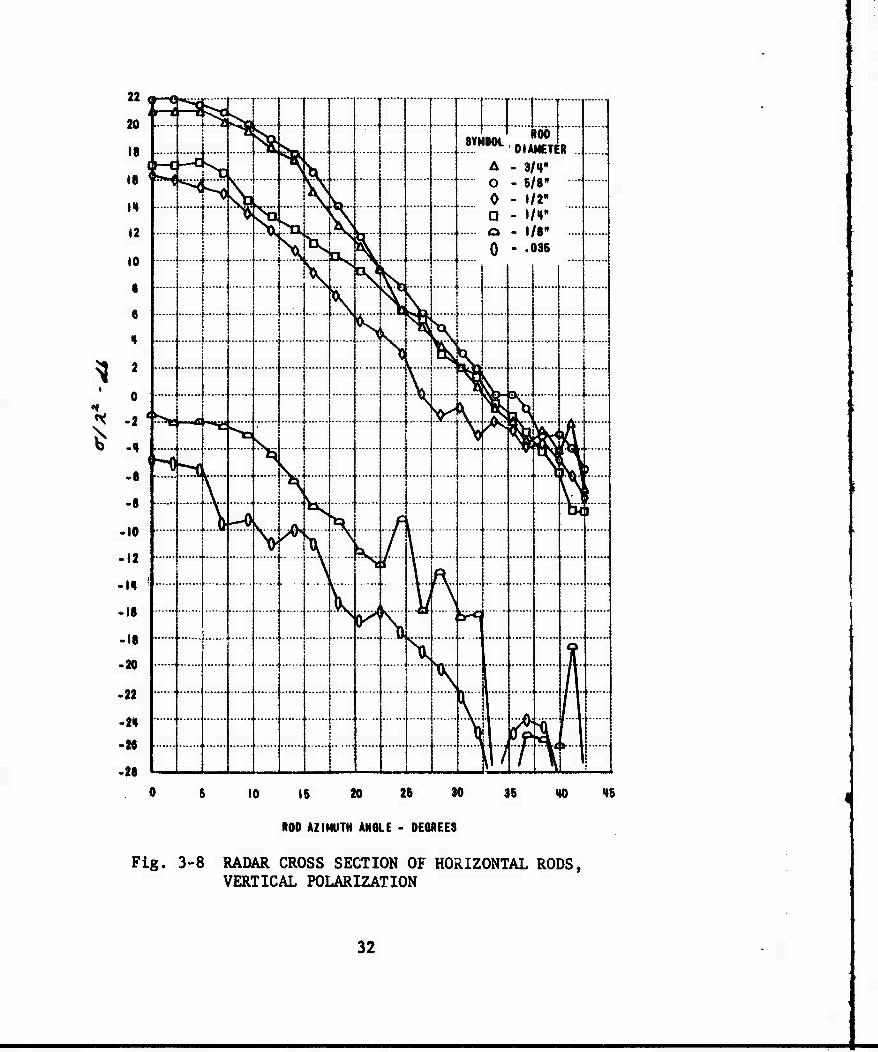
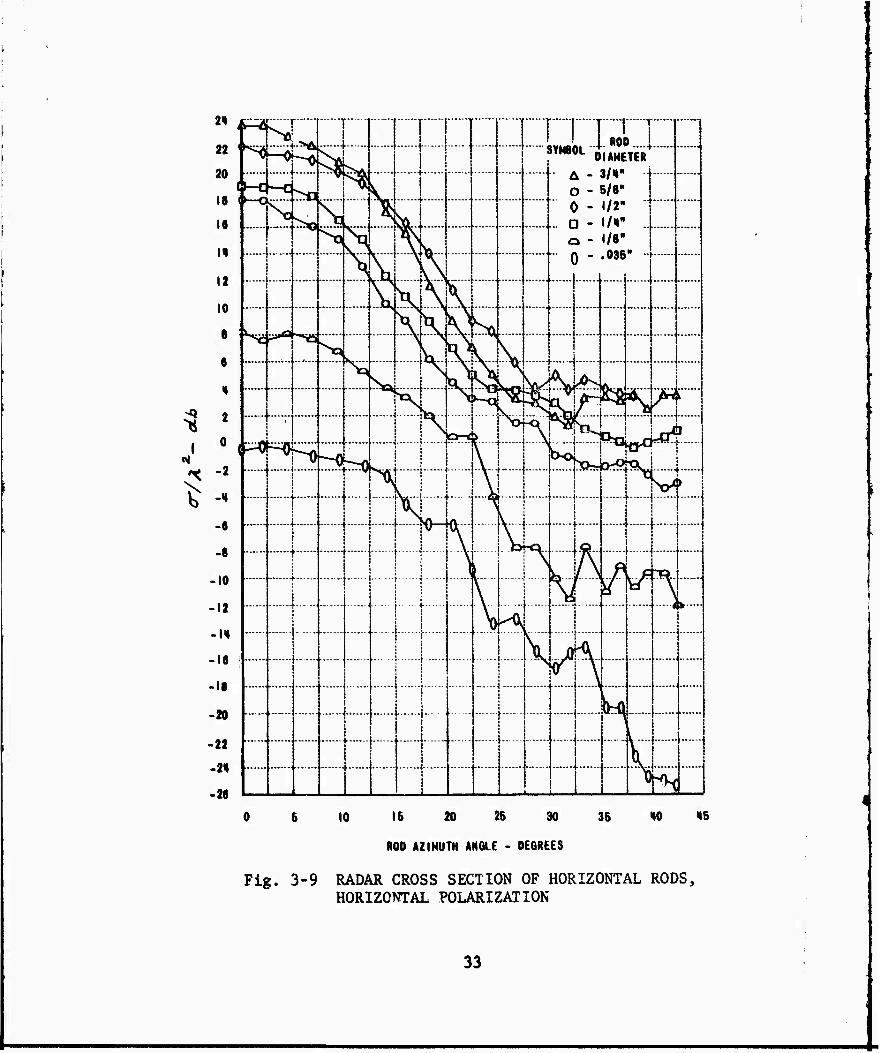
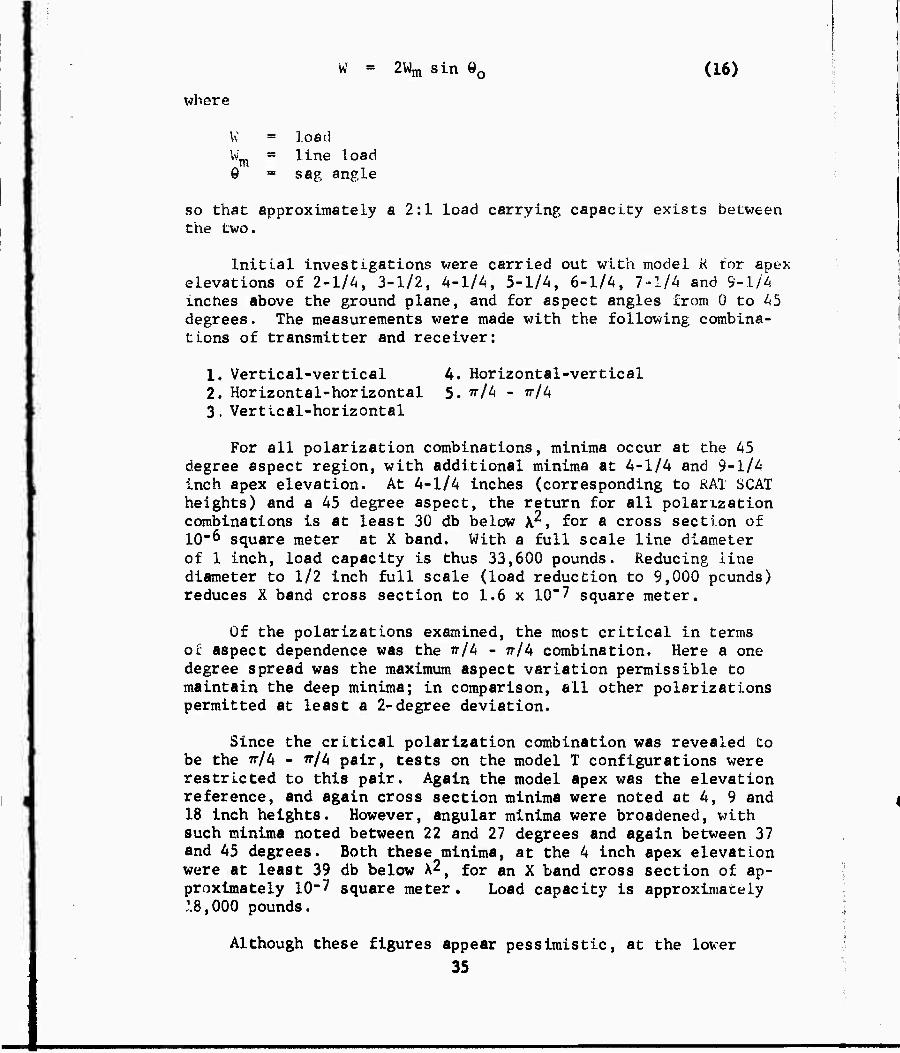
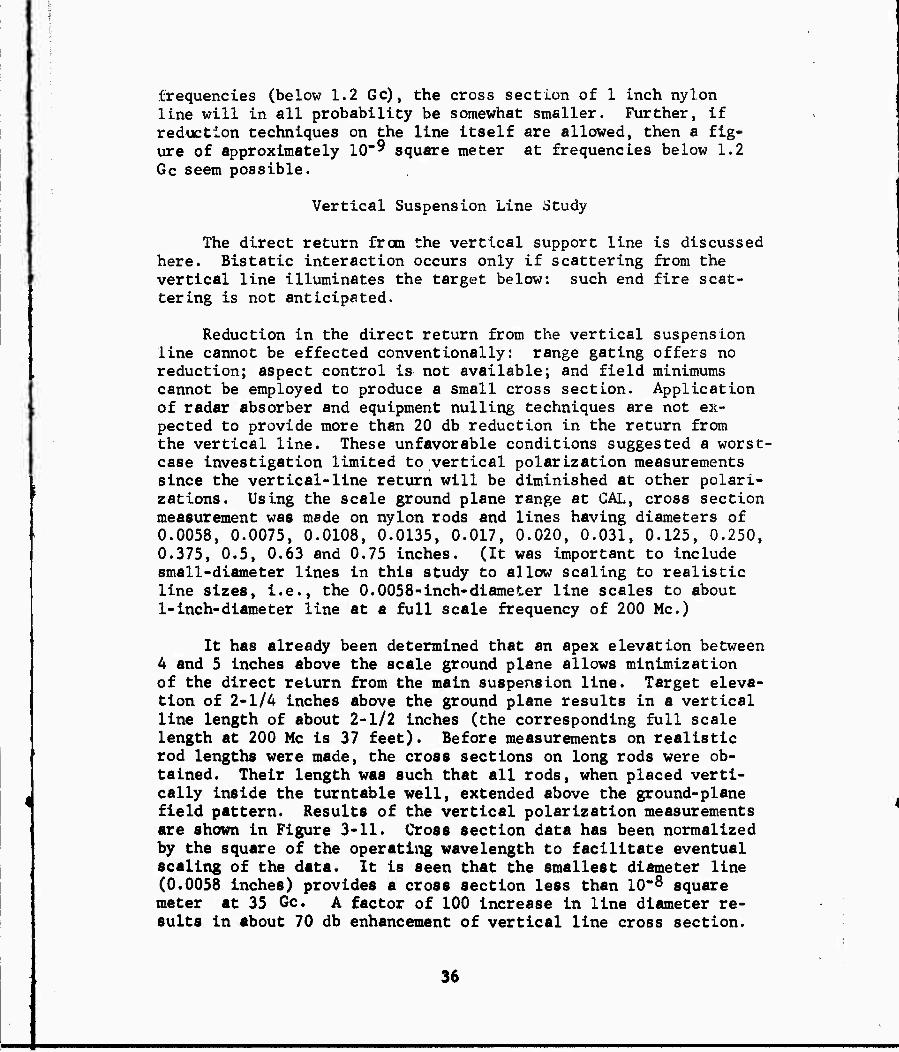
Initial estimates of main line cross section were obtaiaed from measurements of nylon rods at the two principal polariza- tions. The rods were located in the main beam of the scalr. ground plane range (2-1/4 inches above the ground plane), wi.th their longitudinal axes maintained in a horizontal plane, cross sections were then measured as a function of azimuth aspect angle from the specular or broadside view to an angle 45° off specular.
The rods were 8 feet long wi.h diameters of 0.035, 1/8, 1/4, 1/2, 5/8 and 3/A inches respectively, and, with the exception of the 0.035 diameter line, constructed of Nylon 101. Line material was nylon of standard formulation for fish line or rope purposes. Because of rod length, support effects were negligible, so that recorded results are a function of aspect angle, rod diameter and antenna pattern only.
Results are shown in Figures 3-8 and 3-9 for the two princi- pal polarizations, horizontal and vertical. Since actual line diameter to be used on the full scale range will depend upon ehe weight and shape of the vehicle, these data are plotted as a function of k^, allowing, with the aid of Figure 3-2, an extra- polation to cross section versus load carrying capacity at a par- ticular frequency. For example, let 24,000 pounds be required of the line. From Figure 3-2, a one-inch line is necessary, hence data taken on the 1/4 inch rod corresponds, from equation 14, to a frequency 1/4 of the measurement frequency, or approximately 9 Gc. From Figures 3-8 and 3-9, the cross section is given for specular return, as 17 db and 19 db above \2 respectively, or 0.05 square meters and 0.08 square meter full scale, since X* is ap- proximately 10"3 square meter .
From Figures 3-8 and 3-9, it can be seen that at least a 20 db reduction from specular cross section Is afforded by orienting the line at 45 degrees from the radar. Further reductions of 24 and 18 db for horizontal and vertical polarizations respectively are possible by location of the line In the first minimum of the vertical field pattern (see Figure A-2). The corresponding line cross sections, full scale, for a one-inch line are given In Table 1.
At frequencies below 1,200 Me, line cross section can be assumed not to exceed the above figure, with a high probability of reduction below 1,200 Me.
31
1
22
20
IS
16
14
12
10
8
6
•>
2
0
-2
-4
-e
-8
• 10
-12
-II
• 16
-18
-20
-22
-2"l
•26
-28
o-<? r^ v^,-
^ ^
^
?
...... k
t goo 8VMB0L OIAMETH
B ^
h-C —0
^s
A - 3/H" O - 5/8" 0 - 1/2" D - 1/1" « - i/«" ., J
%
^S ^
... ^
0 - .( >36
^
N k ^s ^ L ^ N \
^
K\-,..
SB
.......
—Ä -*c ^
s^ .-.---.
^ ^ \ ^
s
i i
5
r
^
S
^
h r:
-..A
: I
\
\i 4 an / J 1
10 15 20 25 3C
ROD AZIMUTH ANGLE - DEMEE8
35 HO 16
Fig. 3-8 RADAR CROSS SECTION OF HORIZONTAL RODS, VERTICAL POLARIZATION
32
-Q ^i
I
2H
22
20
18
I«
It»
12
10
8
6
*
2
0
-2
-8
-8
-10
-12
-IH
-16
-18
-20
■22
.2*1
•28
pi hs h-c
| T 1 j ! ... J. ROD S lYMBOL 0,AMETER
• oiu« L
§
s 5 !
A - 3/1" O - B/8" 0 - 1/2"
... a - «/'»• .. Q - 1/8"
N Si ^
^
o -
L
r
r-0 ^5
....... ^ >t
\
■-•V-«-V-- ^
5 A -
^ ^
^0 -0
....... ^
^:
p \
1 t
j
1 4
1 !
}■
1 J
j >
.......
»
i 1
V
\>t-CJ.
— —1 1 -^
\ I ^
v a A h
.......
\
s -
<r J M
I
V 1
* r^ 10 15 20 25 30
ROD AZIMUTH ANGLE - DEGREES
35 HO HS
Fig. 3-9 RADAR CROSS SECTION OF HORIZONTAL RODS, HORIZONTAL POLARIZATION
33
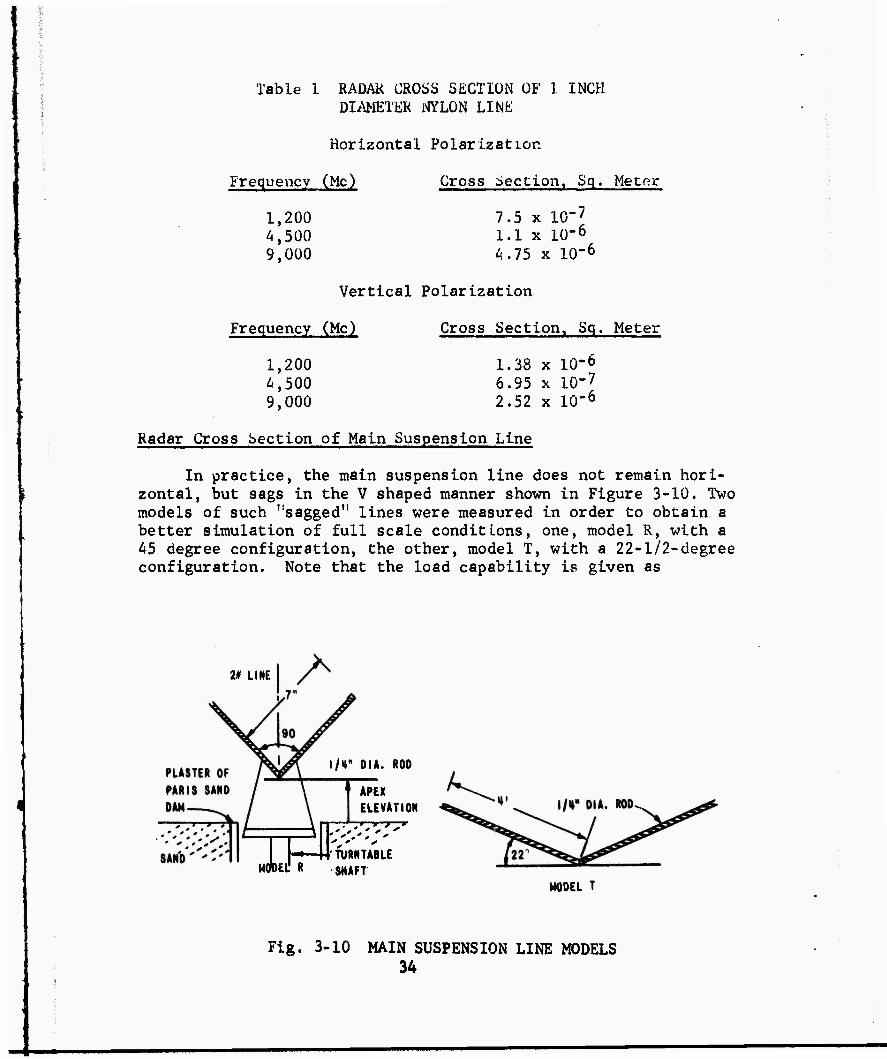
Table 1 RADAK CROSS SECTION OF 1. INCH DIAMETER NYLON LINE
Horizontal Polarization
Frequency (Mc)
1,200 4,500 9,000
Cross Section, Sq. Metor
7.5 x lO'7
1.1 x ur6
A.75 x lO"6
Vertical Polarization
'
Frequency (Mc)
1,200 4,500 9,000
Cross Section. Sq. Meter
1.38 x 10⁻⁶ 6.95 x lO"7
2.52 x lO-6
Radar Cross Section of Main Suspension Line
In practice, the main suspension line does not remain hori- zontal, but sags in the V shaped manner shown in Figure 3-10. Two models of such "sagged" lines were measured in order to obtain a better simulation of full scale conditions, one, model R, with a 45 degree configuration, the other, model T, with a 22-1/2-degree configuration. Note that the load capability is given as
2# LINE
l/r DIA. ROD
APEX ELEVATION
-*-44'TURNTABLE MCfcEL1 R SHAFT
MODEL T
Fig. 3-10 MAIN SUSPENSION LINE MODELS 34
W = 2Wm sin eo (16)
where
lv = load Wm = line load 9 = sag angle
so that approximately a 2:1 load carrying capacity exists between the two.
Initial investigations were carried out with model K for apex elevations of 2-1/^, 3-1/2, 4-1/4, 5-1/4, 6-1/4, 7-1/4 and 9-1/4 inches above the ground plane, and for aspect angles from 0 to 45 degrees. The measurements were made with the following combina- tions of transmitter and receiver:
1. Vertical-vertical 4. Horizontal-vertical 2. Horizontal-horizontal 5. W4 - 7r/4 3. Vertical-horizontal
For all polarization combinations, minima occur at the 45 degree aspect region, with additional minima at 4-1/4 and 9-1/4 inch apex elevation. At 4-1/4 inches (corresponding to RAT SCAT heights) and a 45 degree aspect, the return for all polarization combinations is at least 30 db below X^, for a cross section of 10"^ square meter at X band. With a full scale line diameter of 1 inch, load capacity is thus 33,600 pounds. Reducing line diameter to 1/2 inch full scale (load reduction to 9,000 pounds) reduces X band cross section to 1.6 x 10"7 square meter.
Of the polarizations examined, the most critical in terms or aspect dependence was the w/4 - 7r/4 combination. Here a one degree spread was the maximum aspect variation permissible to maintain the deep minima; in comparison, all other polarizations permitted at least a 2-degree deviation.
Since the critical polarization combination was revealed to be the 7r/4 - fl74 pair, tests on the model T configurations were restricted to this pair. Again the model apex was the elevation reference, and again cross section minima were noted at 4, 9 and 18 inch heights. However, angular minima were broadened, with such minima noted between 22 and 27 degrees and again between 37 and 45 degrees. Both these minima, at the 4 inch apex elevation were at least 39 db below X^y for an X band cross section of ap- proximately 10"^ square meter. Load capacity is approximately 18,000 pounds.
Although these figures appear pessimistic, at the lover
35
frequencies (below 1.2 Gc), the cross section of 1 inch nylon line will in all probability be somewhat smaller. Further, if reduction techniques on the line itself are allowed, then a fig- ure of approximately 10"^ square meter at frequencies below 1.2 Gc seem possible.
Vertical Suspension Line Study
The direct return fron the vertical support line is discussed here. Bistatic interaction occurs only if scattering from the vertical line illuminates the target below: such end fire scat- tering is not anticipated.
Reduction in the direct return from the vertical suspension line cannot be effected conventionally: range gating offers no reduction; aspect control is not available; and field minimums cannot be employed to produce a small cross section. Application of radar absorber and equipment nulling techniques are not ex- pected to provide more than 20 db reduction in the return from the vertical line. These unfavorable conditions suggested a worst- case investigation limited to vertical polarization measurements since the vertical-line return will be diminished at other polari- zations. Using the scale ground plane range at GAL, cross section measurement was made on nylon rods and lines having diameters of 0.0058, 0.0075, 0.0108, 0.0135, 0.017, 0.020, 0.031, 0.125, 0.250, 0.375, 0.5, 0.63 and 0.75 inches. (It was important to include small-diameter lines in this study to allow scaling to realistic line sizes, i.e., the 0.0058-inch-diameter line scales to about 1-inch-diameter line at a full scale frequency of 200 Mc.)
It has already been determined that an apex elevation between 4 and 5 inches above the scale ground plane allows minimization of the direct return from the main suspension line. Target eleva- tion of 2-1/A inches above the ground plane results in a vertical line length of about 2-1/2 inches (the corresponding full scale length at 200 Mc is 37 feet). Before measurements on realistic rod lengths were made, the cross sections on long rods were ob- tained. Their length was such that all rods, when placed verti- cally inside the turntable well, extended above the ground-plane field pattern. Results of the vertical polarization measurements are shown in Figure 3-11. Cross section data has been normalized by the square of the operating wavelength to facilitate eventual scaling of the data. It is seen that the smallest diameter line (0.0058 Inches) provides a cross section less than 10~8 square meter at 35 Gc. A factor of 100 increase in line diameter re- sults in about 70 db enhancement of vertical line cross section.
36

<
55
a H < N H
v - JA
o
<3 Ü H
%
•1 V -i i- + i-
••i >■■
■i I
a a: o
85 L at
en w 2
O
o
H w w z H
H 5 a, a, CO
w M
w >
8 o 8 3
o o
s *
I CO
00 •H fa
37
■
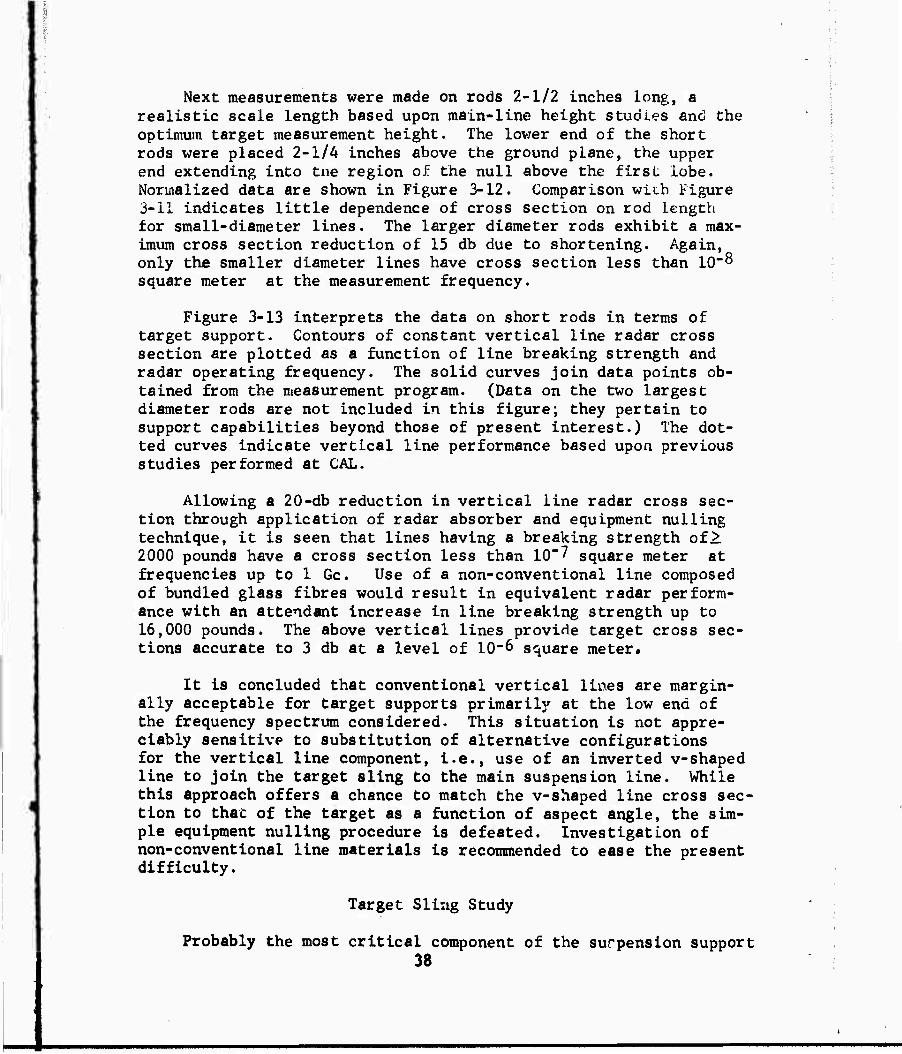
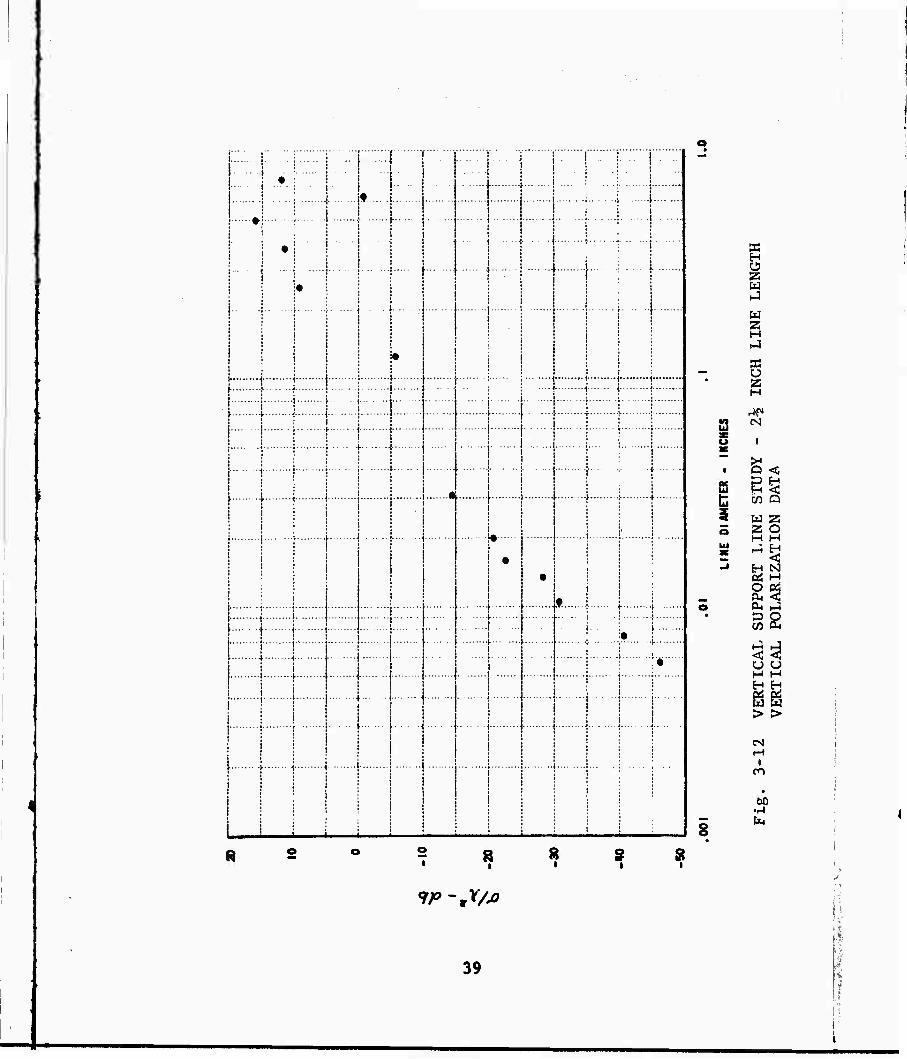
Next measurements were made on rods 2-1/2 inches long, a realistic scale length based upon main-line height studies and the optimum target measurement height. The lov/er end of the short rods were placed 2-1/A inches above the ground plane, the upper end extending into tne region of the null above the first lobe. Normalized data are shown in Figure 3-12. Comparison with Figure 3-11 indicates little dependence of cross section on rod length for small-diameter lines. The larger diameter rods exhibit a max- imum cross section reduction of 15 db due to shortening. Again, only the smaller diameter lines have cross section less than 10"^ square meter at the measurement frequency.
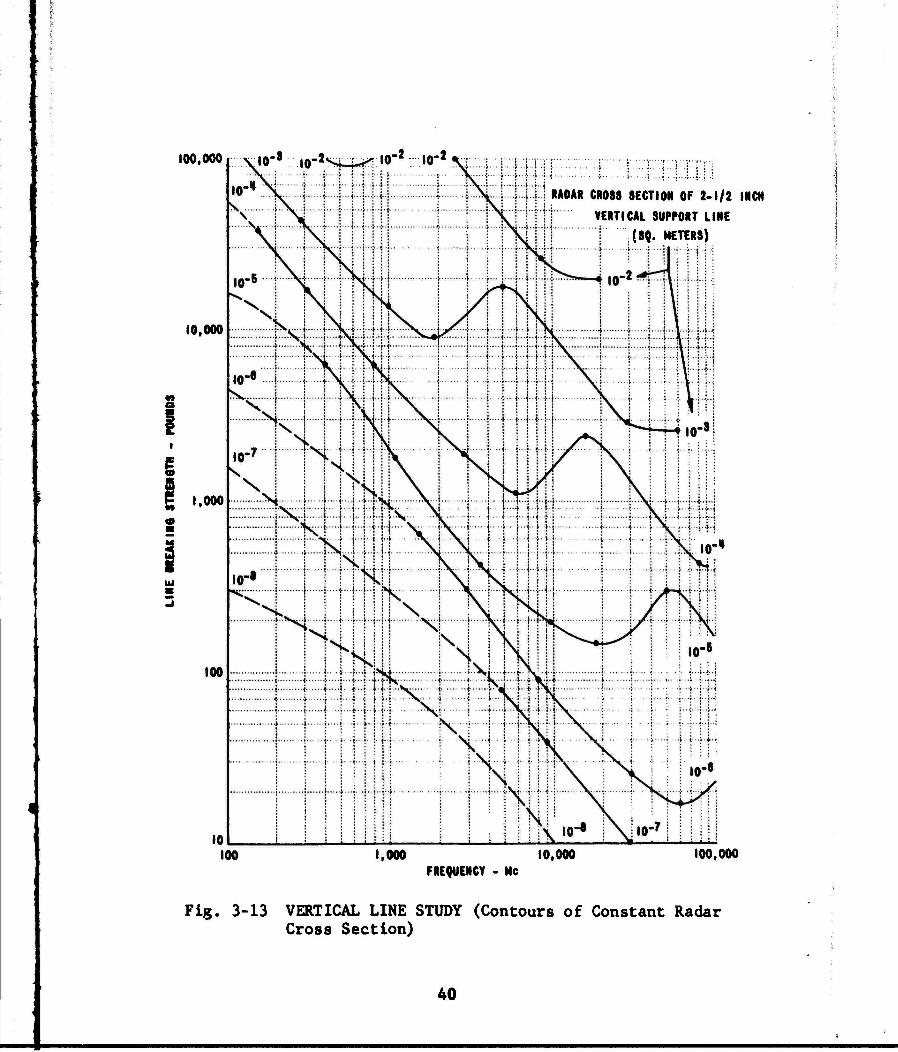
Figure 3-13 interprets the data on short rods in terms of target support. Contours of constant vertical line radar cross section are plotted as a function of line breaking strength and radar operating frequency. The solid curves join data points ob- tained from the measurement program. (Data on the two largest diameter rods are not included in this figure; they pertain to support capabilities beyond those of present interest.) The dot- ted curves indicate vertical line performance based upon previous studies performed at CAL.
Allowing a 20-db reduction in vertical line radar cross sec- tion through application of radar absorber and equipment nulling technique, it is seen that lines having a breaking strength of >. 2000 pounds have a cross section less than 10"? square meter at frequencies up to 1 Gc. Use of a non-conventional line composed of bundled glass fibres would result in equivalent radar perform- ance with an attendant increase in line breaking strength up to 16,000 pounds. The above vertical lines provide target cross sec- tions accurate to 3 db at a level of 10-6 square meter.
It is concluded that conventional vertical lines are margin- ally acceptable for target supports primarily at the low end of the frequency spectrum considered. This situation is not appre- ciably sensitive to substitution of alternative configurations for the vertical line component, i.e., use of an inverted v-shaped line to join the target sling to the main suspension line. While this approach offers a chance to match the v-shaped line cross sec- tion to that of the target as a function of aspect angle, the sim- ple equipment nulling procedure is defeated. Investigation of non-conventional line materials is recommended to ease the present difficulty.
Target Sling Study
Probably the most critical component of the surpension support 38
I...
R
■1 •.-■
-i f I [
-{ j- ■■+ ■)•■
•t.
r
i
4 !■■
f i
■!•■
1 1"
o 8 • 8 i
M I- < '.■■
1 Y
X u
3 5
8 S
x H O Z W
W 23
3C Ü Z H
CM
5 <
W 23 2 O H M •J H
H N Cd H O &
On rJ
CO ft
^^ CJ u H M
> >
CM
cn
••-I
Wjt/fi
j»
39
100,000 to-3 10-^ l0-2 l0.2
:.. -i.-i .1 .: \..i..r..\.:
RADAR CROSS SECTION OF 2-1/2 INCH
VERTICAL SUPPORT LINE
(80. METERS)
10,000
i 1,000
1.000 10.000 FREQUENCY - Nc
100.000
Fig. 3-13 VERTICAL LINE STUDY (Contours of Constant Radar Cross Section)
40

Is the target sling. The presence of sling lines in the form of loops, harness, etc., about a target modifies the surface currents on the target, and, in some cases, produces sufficient percurba- tion in current distribution to cause a gross error in measured cross section. Furthermore, the proximity of the sling downlines introduces some bistatic effects, and, more seriously, introduces an aspect sensitive direct return which can be unacceptable in terms of the target return at the same aspect. Since cross sec- tion inaccuracies caused by downline direct return and bistatic interaction are impossible to separate, they are treated as a sin- gle entity in this report.
Because sling presence will be most apparent when target re- turn is minimal, a low cross-section body was fabricated espec- ially for the target sling study. An additional design consider- ation was precise alignment of the target: estimation of cross section inaccuracies as a function of sling diameter required alignment repeatability in pitch to within one degree. Figure 3-1A depicts the cone-cylinder-cone model employed during the sling investigation. Model length Is scaled to about 28 feet at 200 Mc. Such size, along with pointed extremities, was neces- sary in easing the alignment procedure. The conventional sling configuration is illustrated in the same figure. A single loop of nylon line supported the model in the manner shown above. The measurement program involved slings of nylon line 0.0058, 0.0075, 0.0108 and 0.017 inches in diameter. Cross section measurements on the cone-cylinder-cone model supported by a 0.003 inch diam- eter nylon sling serve as a reference cross section.
HVLOM LII»IE —
COME-CYLIHOCT-COIIE ALUMINUM MODEL ^sf^. ^ ''.MlucllTlftM.1 „ .„. CONVENTIONAL 8LIN0
-
Fig. 3-14 MODELS USED IN TARGET SLING STUDY v i
41 s
'
r
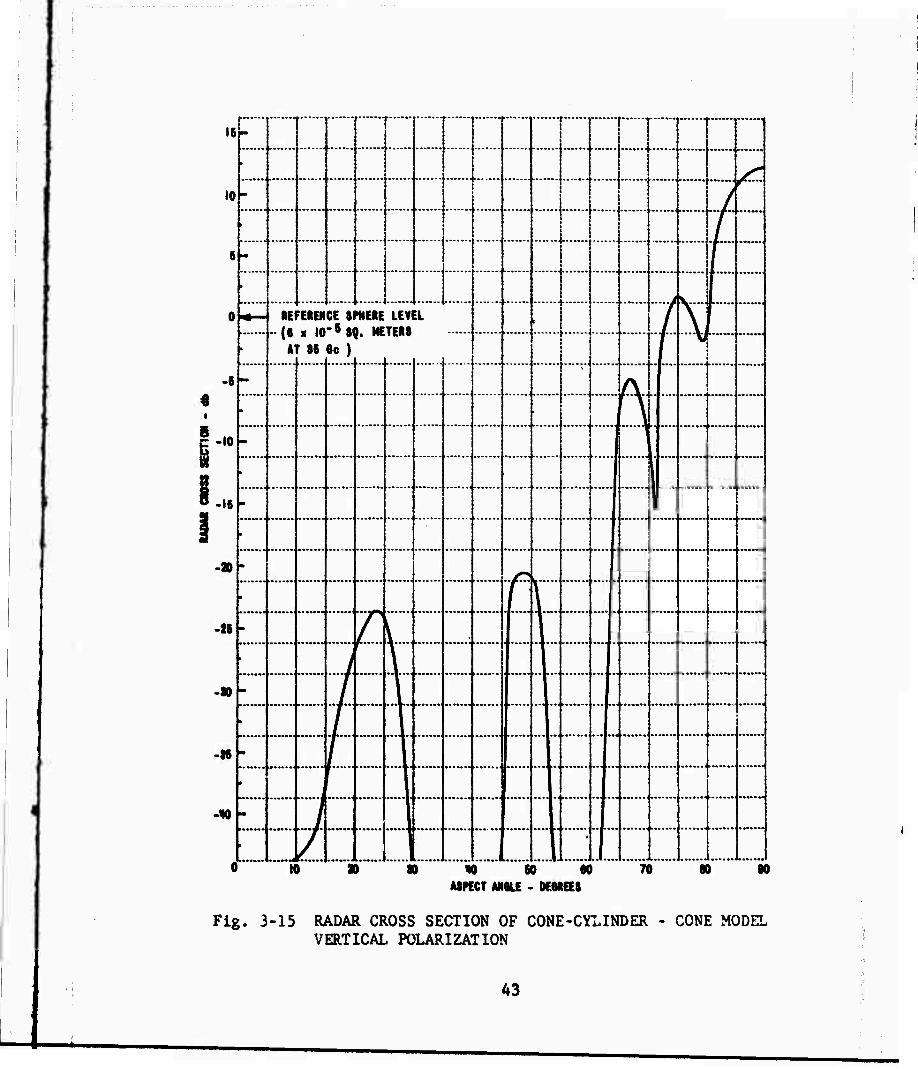
A typical reference run is shown in Figure 3-15. The verti- cal polarization cross section lies below the room null (^2 x 10"9 square meter at Ka band) in the aspect regions near nose-on. At broadside the cross section compares to that of the reference sphere (6 x 10*5 square meter ).
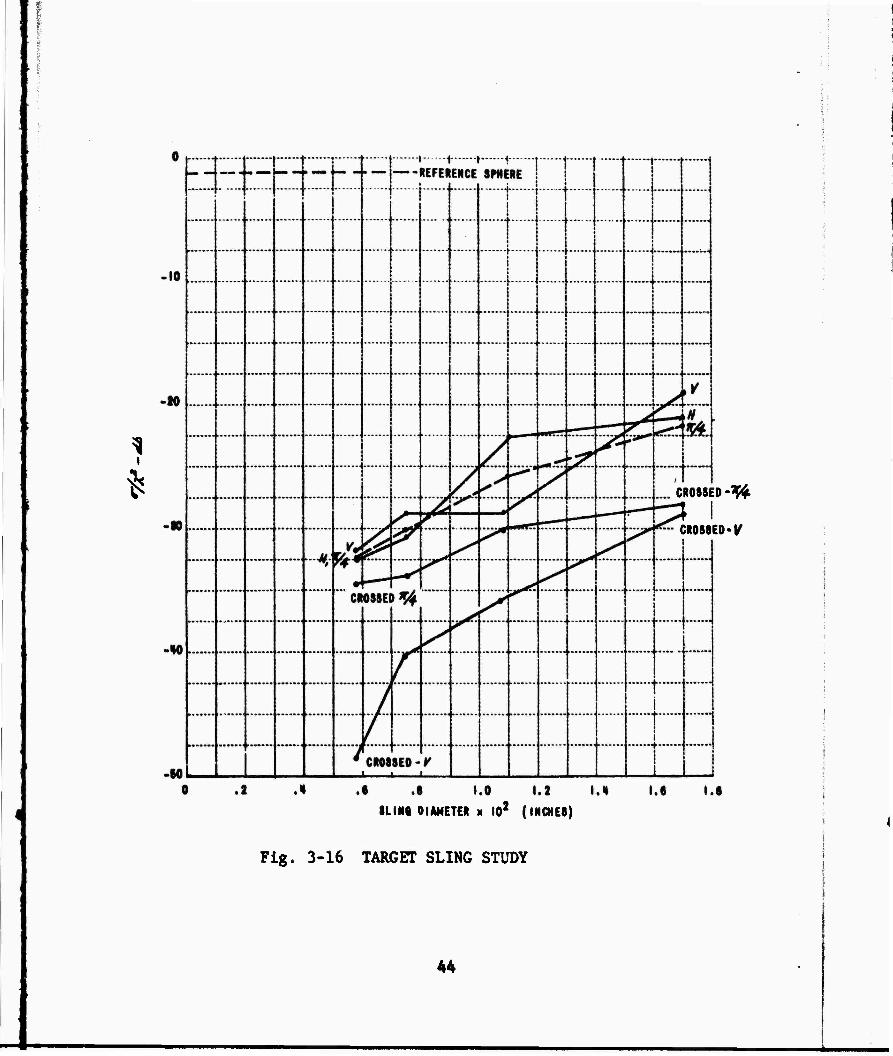
Target cross sections at vertical, horizontal, 7r/4, crossed- vertical and crossed-7r/4 linear polarizations were obtained with slings of various line diameters providing support. These data were compared to the reference runs and whenever a 3 db variation in the two cross sections was observed, the aspect angle and cross section level was noted. Results are given in Figure 3-16.
The maximum variation in cross section for crossed vertical, and crossed-"74 polarization, occurred in the aspect interval be- tween 25 and 30 degrees. This contribution to measurement error was probably caused by the direct return from the target sling. In contrast horizontal and "/A polarization cross sections pro- duced a maximum error near nose-on. In this case the contribu- tion to measurement error probably was associated with the bi- static interaction between the sling and the target.
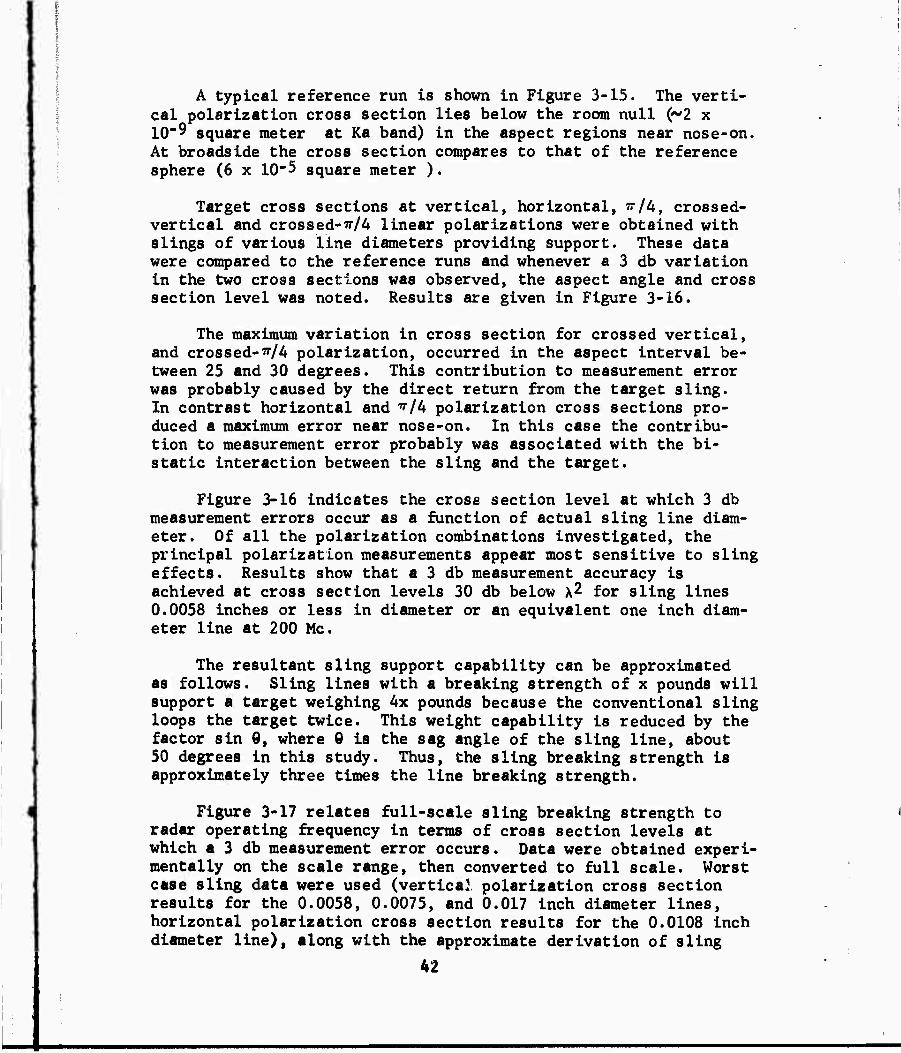
Figure 3-16 indicates the cross section level at which 3 db measurement errors occur as a function of actual sling line diam- eter. Of all the polarization combinations investigated, the principal polarization measurements appear most sensitive to sling effects. Results show that a 3 db measurement accuracy is achieved at cross section levels 30 db below X^ for sling lines 0.0058 inches or less in diameter or an equivalent one inch diam- eter line at 200 Mc.
The resultant sling support capability can be approximated as follows. Sling lines with a breaking strength of x pounds will support a target weighing 4x pounds because the conventional sling loops the target twice. This weight capability is reduced by the factor sin 9, where 0 is the sag angle of the sling line, about 50 degrees in this study. Thus, the sling breaking strength is approximately three times the line breaking strength.
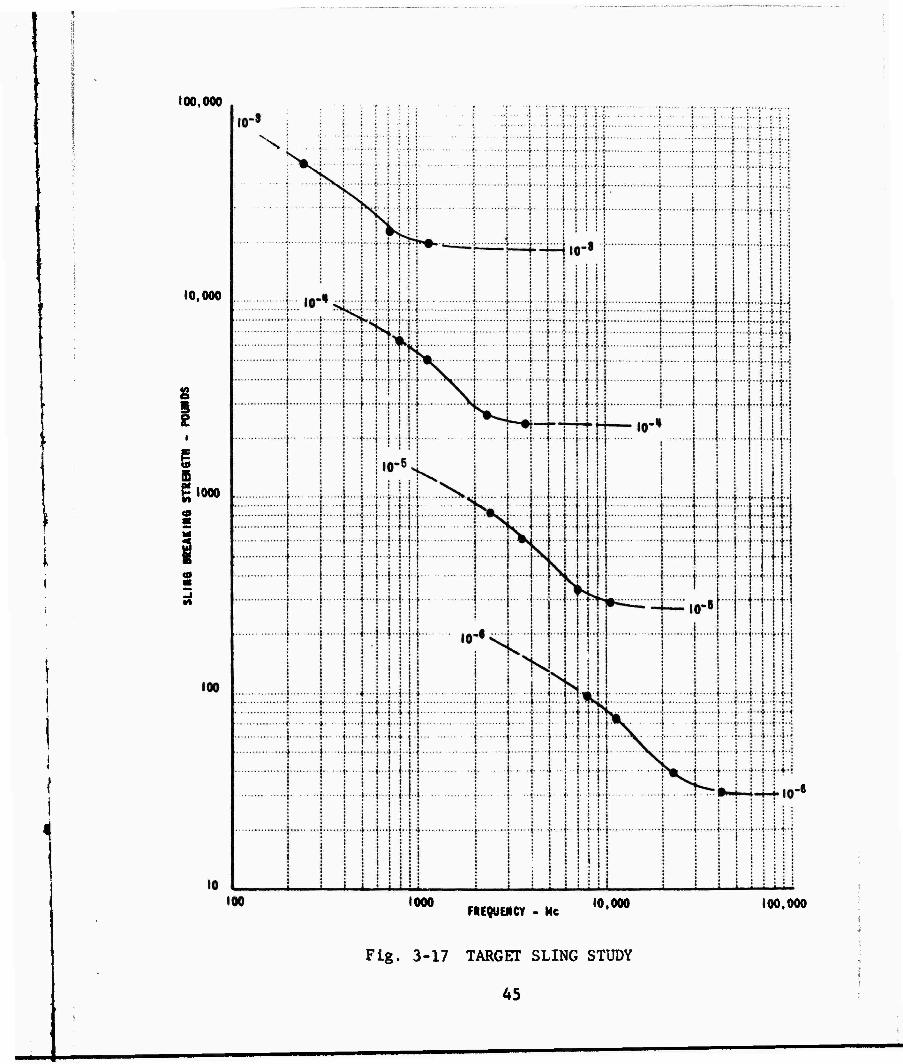
Figure 3-17 relates full-scale sling breaking strength to radar operating frequency in terms of cross section levels at which a 3 db measurement error occurs. Data were obtained experi- mentally on the scale range, then converted to full scale. Worst case sling data were used (vertical polarization cross section results for the 0.0058, 0.0075, and 0.017 inch diameter lines, horizontal polarization cross section results for the 0.0108 inch diameter line), along with the approximate derivation of sling
42
,
15 - - -'""1 r-—1
10
6
*
■
RE
Al
•■•••a'
'EREN K 10
r ss
CE SI -1« So)
1-
h
WERE J. ME
Z
LEVI TERS
1
EL
1
.......
1
i
j j
j. i.
\
j 2 j
0 | - ——J
-6
%
•10
-IS
-»
•IS
•m\
.......
\
t !
.. ...^.
■ ■
. —...i
......^
1
r
:
1
7C
E
V
.......
.......
>• .».J
0 M > a } SO IK ) SI i SO « ) SO ASKCT ANSLE - OESREES
Fig. 3-15 RADAR CROSS SECTION OF CONE-CYLINDER - CONE MODEL VERTICAL POLARIZATION
43
^ CROSSED -^4
I ! CROSSED «^
SLINfl DIAMETER M I02 (INCHES)
Fig. 3-16 TARGET SLING STUDY
44
100,000
i
10,000
S 5 £
9 E 1000
■t
1000 FREfUENCY - Nc
10,000 100,000
Fig. 3-17 TARGET SLING STUDY
45
strength. Conventional slings having a breaking strength of at least 1000 pounds allow cross section measurements accurate to within 3 db at levels as low as 10-5 square meter for radar op- erating frequencies less than 2 Gc. Greater accuracy is antici- pated at lower frequencies.
A study of non-conventional techniques applied to the specif- ic task of target support by slings is recommended. Such an in- vestigation would entail more than a search for lines of greater tensile strength (i.e., use of bundled glass fibres increases sling strength from 1000 to 8000 pounds in the foregoing example). Efforts to obtain a better match between the electrical constants of the sling material and those of free space should prove re- warding; in this manner the effects of bistatic interactions can be reduced. Assuming this to be the case, direct returns from the sling can be minimized by distributing the target load over many small-diameter loops instead of two large-diameter loops.
Target Control Line Study
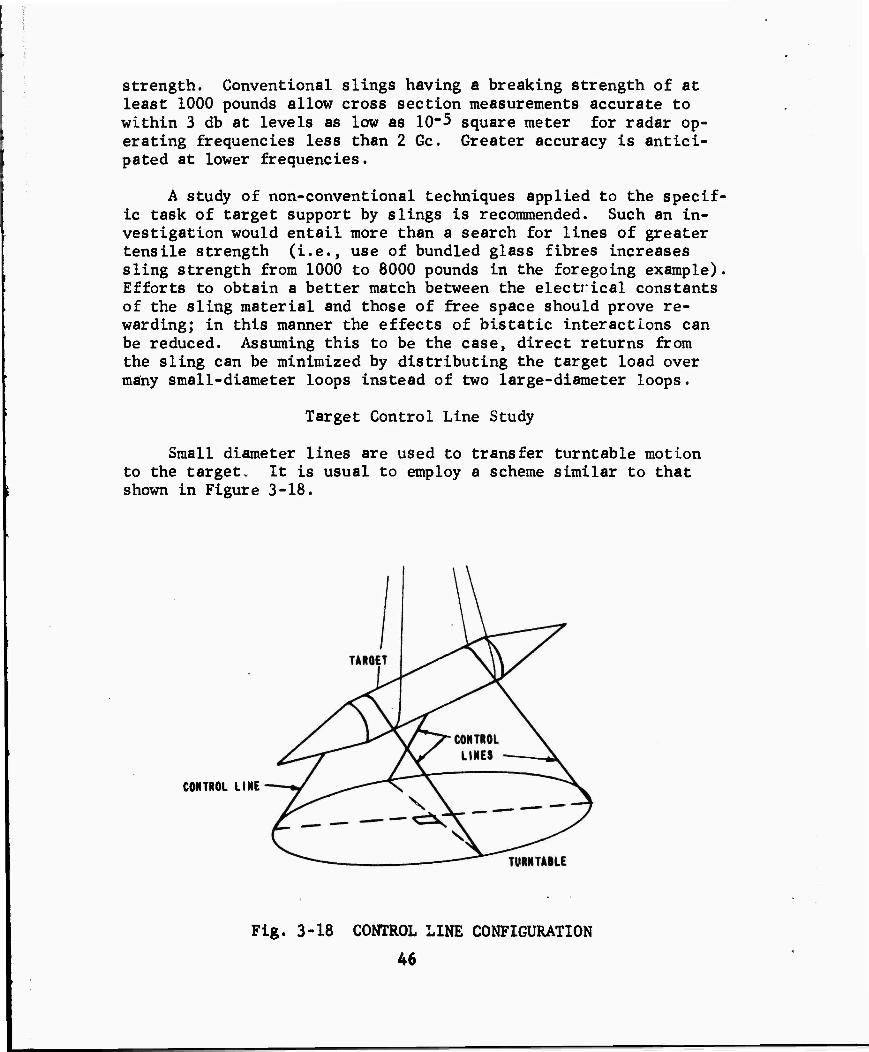
Small diameter lines are used to transfer turntable motion to the target. It is usual to employ a scheme similar to that shown in Figure 3-18.
CONTROL LINE
Fig. 3-18 CONTROL LINE CONFIGURATION
46
I
Control line strength is determined by the required tracking ac- curacy between turntable and target rotation. Although tracking oscillations must be minimized, a constant lag between target and turntable motions is acceptable. The required tracking ac- curacy is related to the variation in target cross section with azimuth rotation angle. Scattering patterns of elongated tar- gets are typified by an average of 2 LA peaks per 90 degrees rotation where L is the length of the target. Because cross- section peaks are not uniformly spaced, two peaks may be less than 45 L/X degrees apart. The previous considerations indicate that a nominal 10 foot target measured at L-band will produce about a 2-degree aspect separation between peaks and nulls in dense peak-null regions. This situation calls for target control to 0.5 degree.
The tendencies of nylon lines to stretch under tensile loads may be a critical factor in the accurate transfer of turntable rotation to a full-scale target weighing several tons. This prob- lem becomes especially serious when the target is exposed to winds; aerodynamic forces tend to align the target with the wind direction causing target oscillations. It is necessary to pro- vide sufficient strength to limit undesirable motion if wind gusts occur. Control lines fabricated of some stretch-resistant material, i.e., bundled glass fibers, would rectify this situa- tion.
47

CONCLUSIONS
Both analytic and experimental data contained in this report support the following conclusions.
1. The towers required for a conventional suspension sup- port can be located so as to introduce negligible effect in radar cross section measurement accuracy (less than 10-8 square meter cross section). A tentative design indicates a tower height of 150 feet with a separation of 270 feet is satisfactory with no application of ab- sorber required. The design is based on a 100 nanosec- ond radar range gate and 15 db antenna side lobes.
2. The main line suspension between towers, using a dielec- tric material, can be so located that its cross section will meet RAT SCAT specifications on the low frequency complex.
3. The vertical support line, made of nylon or other conven- tional synthetic fiber (dacron or polypropylene) cannot meet RAT SCAT specifications. Allowing a 20 db reduction in vertical line radar cross section through application of radar absorber and equipment nulling techniques, con- ventional lines having a breaking strength of 2000 pounds provide cross sections accurate to 3 db at a level of 10-6 square meter at frequencies up to 1 Gc.
4. The limiting feature of the suspension support is the target sling. Conventional slings of nylon, dacron, or polypropylene have effective cross sections of 10"5 square meter and breaking strength of 1000 pounds in the frequency regime belo« 2 Gc.
5. The limiting feature of the overall ground plane range is the target control pit area for frequencies in the region of 200 Mc. At this frequency effective cross sec- tion of the pit is 10"5 square meter.
6. The suspension support using conventional materials can be used at 200 Mc to measure targets as low as 5 by 10-4 square meter with 1 db accuracy.
7. The suspension support, using a line material such as bundled glass fibers, will permit measurement (at 2 Gc or less) of cross sections as low as 2 by 10-3 square meter with 1 db accuracy, assuming a 1000 pound target
48
:
.
and negligible pit cross section. For a 10,000 pound target, minimum cross section rises to 5 by 10'^ square meter.
RECOMMENDATIONS
It Is recommended that the following areas be Investigated to enable RAT SCAT to meet design goals.
1. Methods for reducing pit return. Regardless of what target support technique Is used, the basic limitation of the current low frequency range Is the return arising from the target control area. The basic problem Is con- trol of the surface wave associated with ground plane operation.
Several orders of magnitude reduction are required.
2. Methods for reducing line cross section. Although a com- parison between pedestal supports and suspension supports Is beyond the scope of the present Investigation, It Is felt that the line technique offers the most promising way of achieving the low radar cross section levels re- quired of target supports. This view follows directly from the mechanical properties of modern dielectric materials, which are generally stronger In tension than compression.
Sufficient evidence exists to support the view that ap- proximately a 20-db reduction In line cross section should be achievable through a combination of line mater- ial (such as glass fiber) and periodic loading of the line.
3. Methods of sling cross section reduction.
49
APPENDIX
THE SCALE GROUND PLANE RANGE
General
In order to provide experimental verification of theoretical results, and to provide data that is best obtained by direct measurement, a scale ground plane range was implemented to simu- late the RAT SCAT low frequency complex. Utilizing the CAL Ra CW radar (35 Gc), the range was designed to scale operations at 200 Mc, since at these frequencies ground plane effects (inhomogene- ities, surface curves, etcO are much more pronounced.
Because a complete simulation is impossible (the scale ground plane must be finite in extent), the ground plane was limited to an area of 8 by 4 feet in front of the radar. Subsequent experi- mental results have verified the view that such limitation should not play a serious role in ground plane performance, since the ground plane area was much greater than a Fresnel zone.
Actual ground plane material was extremely fine grain bond- ing sand, held in a 8 by 4 by 1/2 foot water-proof container lined with radar absorber. Although it is not known whether a complete electrical match was obtained between RAT SCAT soil and the sand (200 Mc data on RAT SCAT soil was not available), excel- lent agreement in field strengths were obtained between full scale and scale model measurements.
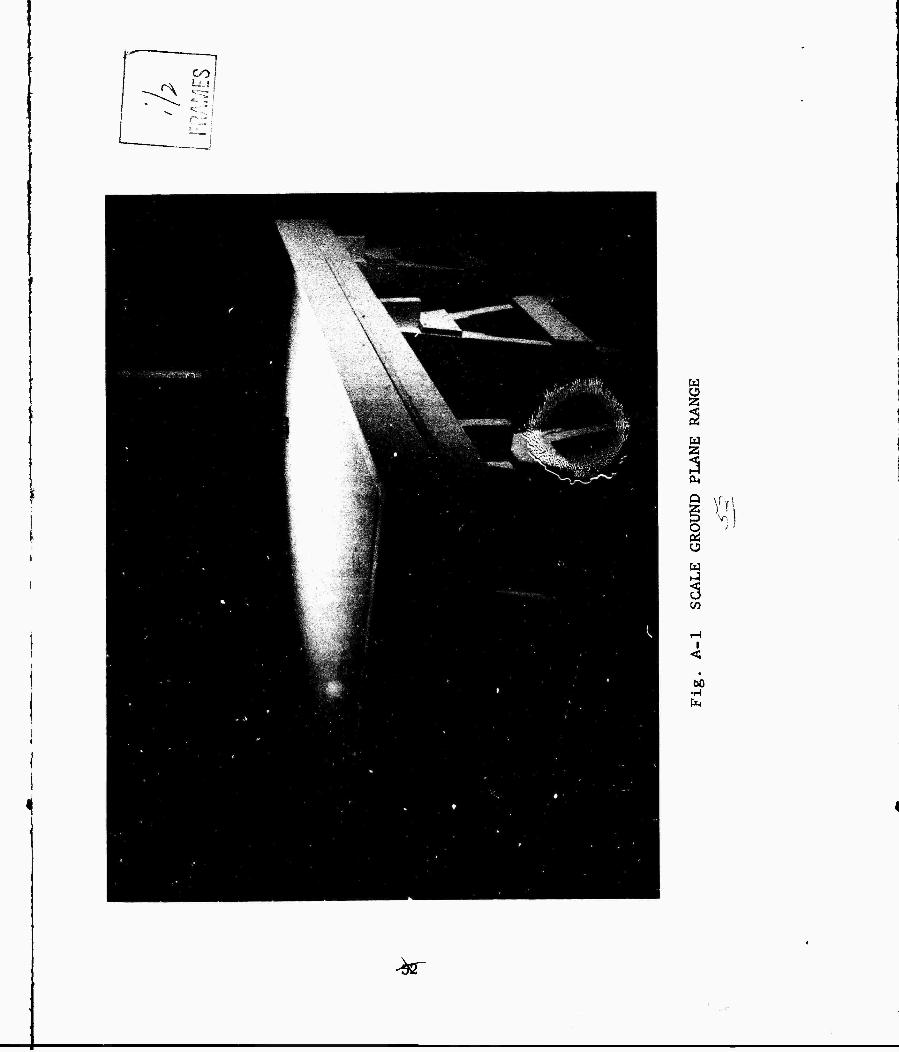
Figure A-l depicts the scale ground plane range in the smooth sand condition with the target (a 1-inch square flat plate) placed 34 inches from the antennas (full scale separation is 500 feet). Rectangular transmitting and receiving horns, approximately 1 inch square, scale to 15 foot horns, about the size of the RAT SCAT low frequency dishes. These linear polarization horns were em- ployed to obtain cross sections having the following transvnitting- receiving antenna polarization combination: vertical-vertical, horizontal-horizontal, ir/U-ir/b and vertical-horizontal. A vari- able-tilt turntable was provided to allow target rotation about «m axis perpendicular to the first lobe of the ground plane field pattern. Sand was dammed away from this turntable by means of a plaster of paris cylinder placed flush with the sand surface and extending through the bottom of the table.
51
~"1 CO r^ ^1
o
z
9 \rrl o O
w
r-i
<
00 •1-1 fa
-•^sr
*
A program was carried out to provide field strength data above the scale ground plane range. A sphere was used to probe field magnitude across the target area in azimuth and elevation; the phase of the field was not obtained. (This technique is identical to that employed on the full scale RAT SCAT range.) Figure A-2 illustrates field strength measurement da^a in eleva- tion at the control pit azimuth angle, using dry sand. The mag- nitudes of the first lobe peaks match to within 1 db for the two principal polarizations, the horizontal polarization peak being larger as expected. Field distributions predicted by theory are observed at the surface of the ground plane; for vertical polari- zation the surface wave contribution lies about 20 db below the first lobe maximum. This is the surface component which illu- minates the control pit area on the full scale RAT SCAT range. The elevation of the first lobe maximums corresponds to a full scale height of 33 feet at 200 Mc.
A similar vertical coverage diagram with dry sand was ob- tained for the cross-polarization antenna combination: the trans- mission antenna orientation was vertical, the receiving antenna horizontal (see Figure A-3). It is seen that the undesired cross- polarization component is down 25 db from the principal polari- zation components at the chosen elevation of the target.
Figure A-4 provides gross characteristics of the field above the ground plane, again using dry sand. While contours of cons- tant field strength vary irregularly in the second lobe above the ground plane, the first lobe characteristics are regular for both vertical and horizontal polarizations. An anomaly common to the field strength patterns for both polarizations is a deep null, symmetrically distributed in azimuth off to the sides of the target area, at the same elevation as the upper null of the first lobe directly above the target location.
Reference measurements on the scale ground plane range were based upon flat plate cross section. Free space (anechoic cham- ber) measurements of a reference one-inch-square flat plate were compared to ground plane range measurements for the principal polarization antenna combinations. (It should be noted that the tilt of the resultant ground plane field requires a target rota- tion axis slightly inclined towards the antenna position. The proper rotation-axis inclination for the scale ground plane range was about 2 degrees.) Results for vertical and horizontal polari- zation are shown in Figures A-5 and A-6, for dry sand. Agreement is excellent. Differences between free space and ground plane cross sections, existing only at the lower cross section levels, are considered acceptable.
53
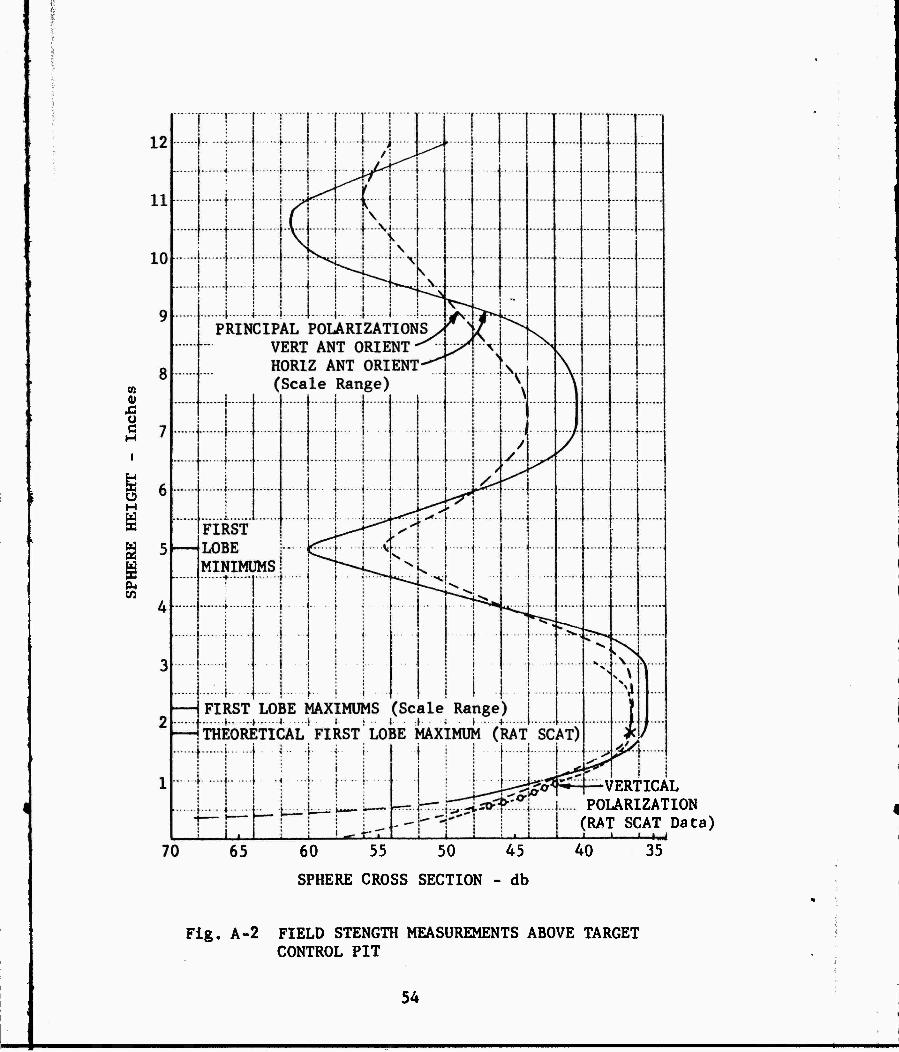
0! 0)
o c H
VERTICAL POLARIZATION (RAT SCAT Data)
60 55 50 45
SPHERE CROSS SECTION - db
Flg. A-2 FIELD STENGTH MEASUREMENTS ABOVE TARGET CONTROL PIT
54
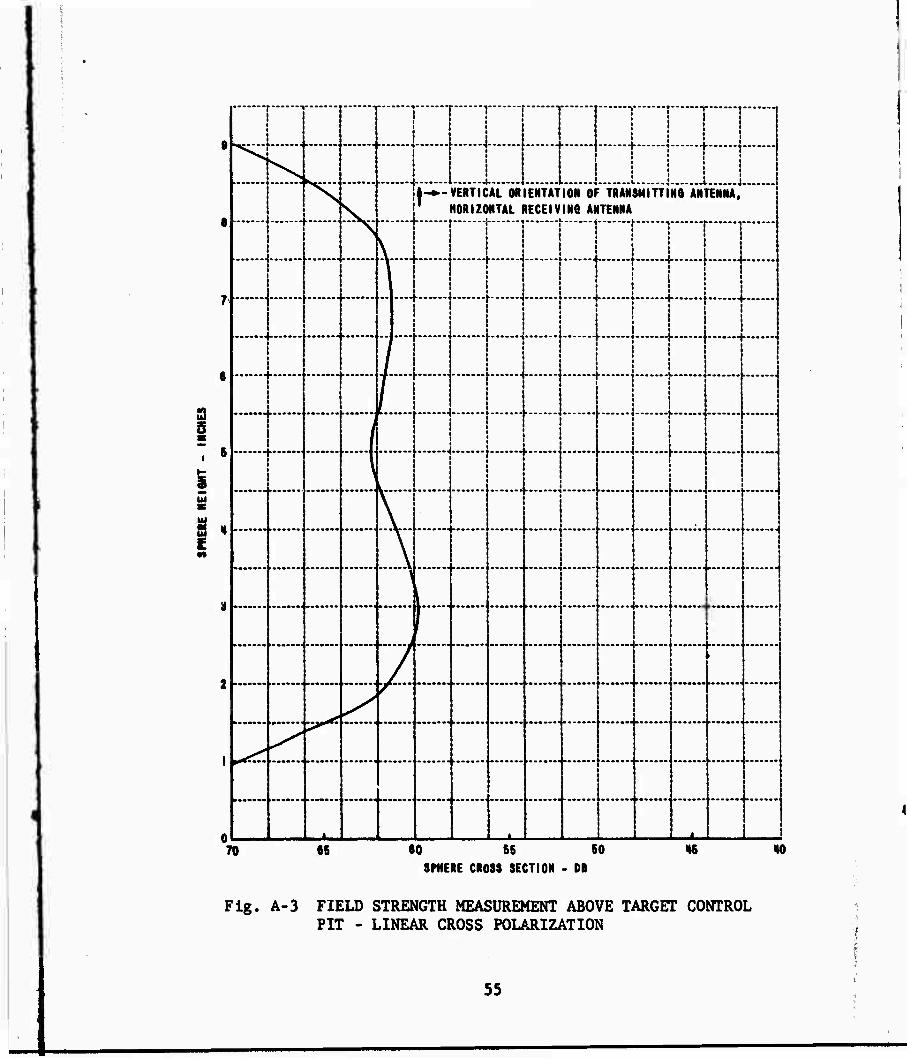
;
3
s
E
2 -
'
•----"1 " 1 ' 'y...\^\ ..._...
j—
—
i-—
^ "\ k.
r ] i i
L I--
1 ! 1 : !
1 _ „. J L ) ! 1
\ V
;|-^-VERTICAL ORIENTATION OF TRANSMITTINO ANTENNA, j' HORIZONTAL RECEIVINQ ANTENNA
..€..•--■ \ .......L.......
j
^"""■""
1 i i !....„
■
1 1 1
1 ! i r 1 1 1 1 1
r "^ i i i * I
i 1 i
i 1
V.......
i
.......
...... .......
I
i
^j^«;
^ ^
.*•«••••« —i
Il 11
70 «B 60 65 SO SPHERE CROSS SECTION - DB
I» HO
Fig. A-3 FIELD STRENGTH MEASUREMENT ABOVE TARGET CONTROL PIT - LINEAR CROSS POLARIZATION
55
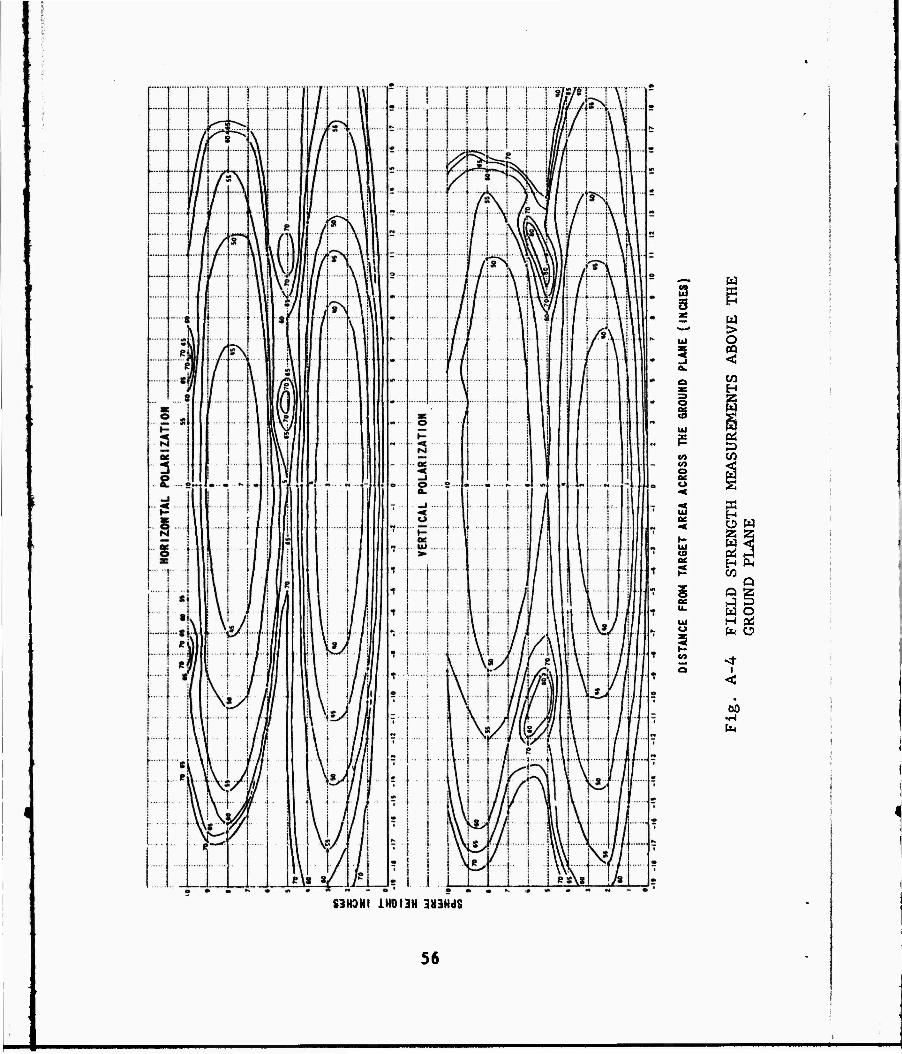
2 s
Ul
3
3 Ui
CO o ae O
to
5
w ä H W > o
H
CO
33 H O W
W < ai J H P-i W
Q Q Z .j s w o
<:
.i-i fa
83H0NI 1H0I3H 383Hd8
56
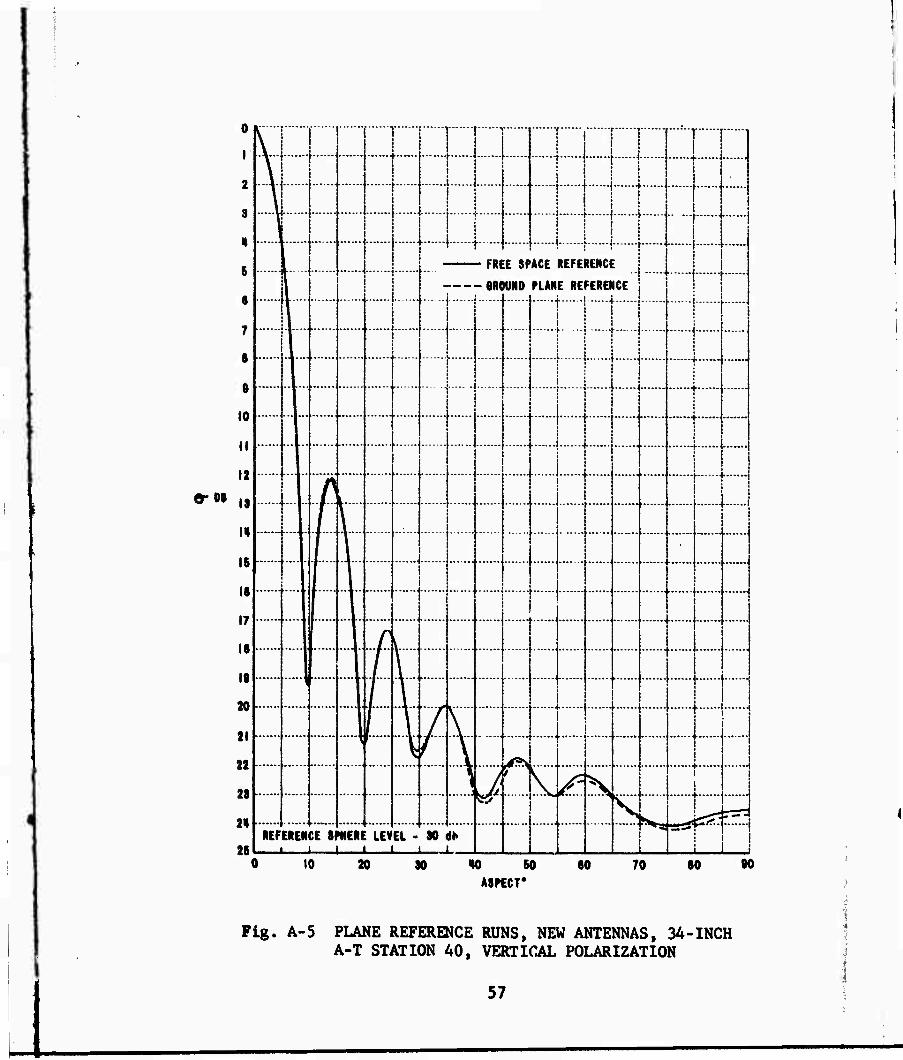
!
I
9* DI
10
II
12
IS
II
IB
ia
17
IS
19
20
21
22
29
i%
26
c f ^ !
y i | I | |
i ••--*••
i 1 J
i
i j i 1 L
[ [
1 ^ | ^ |
i ] J I ! f 1 f 1
1 ni %. ornvt nurtnuvvb
I - GROUND PLANE REFERE»
1 1 J ! J
ICE 1 ; • i
i i j
.....J [ ._ j
j
;
.......
L
1
t
1
(
\
1 .A...
J f*
/- \
i
.«••■•.
■>,
\
Ä^1 REF EREN CE S
l 1 •HER 1 1
LEV 1 1
EL • 1 1
SO L I .,
10 20 30 HO 60 ASPECT*
00 70 80 90
Fig. A-5 PLANE REFERENCE RUNS, NEW ANTENNAS, 34-INCH A-T STATION 40, VERTICAL POLARIZATION
57
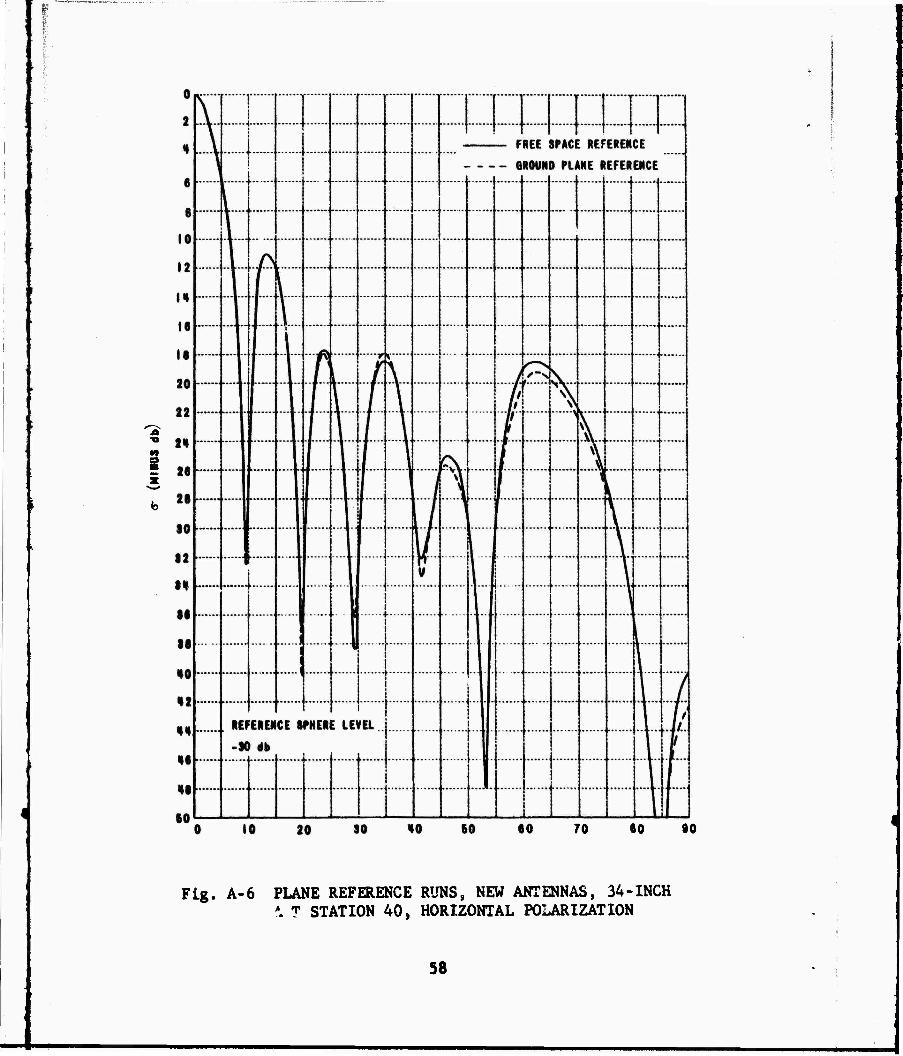
60 70 00 «0
Fig. Ä-6 PLANE REFERENCE RUNS, NEW ANTENNAS, 34-INCH *. T STATION 40, HORIZONTAL POLARIZATION
58
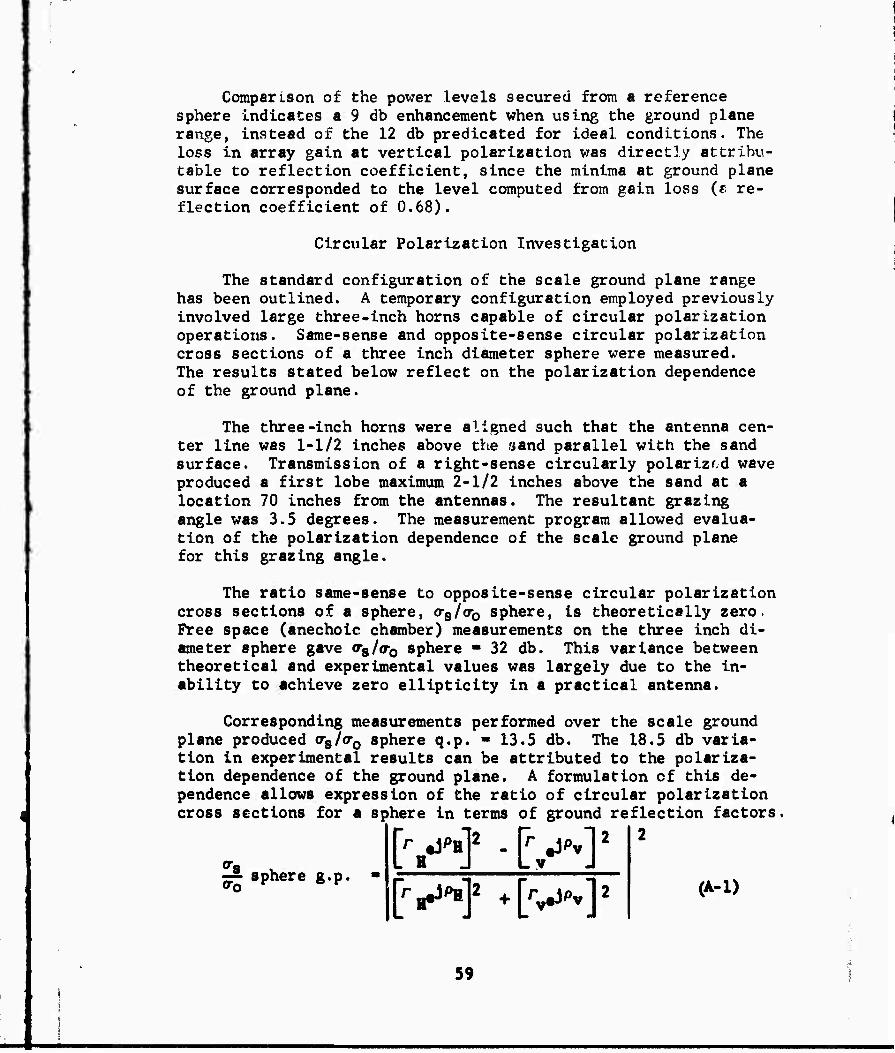
Comparison of the power levels secured from a reference sphere Indicates a 9 db enhancement when using the ground plane range, instead of the 12 db predicated for ideal conditions. The loss in array gain at vertical polarization was directly attribu- table to reflection coefficient, since the minima at ground plane surface corresponded to the level computed from gain loss (s re- flection coefficient of 0.68).
Circular Polarization Investigation
The standard configuration of the scale ground plane range has been outlined. A temporary configuration employed previously involved large three-inch horns capable of circular polarization operations. Same-sense and opposite-sense circular polarization cross sections of a three inch diameter sphere were measured. The results stated below reflect on the polarization dependence of the ground plane.
The three-inch horns were aligned such that the antenna cen- ter line was 1-1/2 inches above the sand parallel with the sand surface. Transmission of a right-sense circularly polarizf.d wave produced a first lobe maximum 2-1/2 inches above the sand at a location 70 inches from the antennas. The resultant grazing angle was 3.5 degrees. The measurement program allowed evalua- tion of the polarization dependence of the scale ground plane for this grazing angle.
The ratio same-sense to opposite-sense circular polarization cross sections of a sphere, (r3/(r0 sphere, is theoretically zero. Free space (anechoic chamber) measurements on the three inch di- ameter sphere gave crs/(r0 sphere ■ 32 db. This variance between theoretical and experimental values was largely due to the in- ability to achieve zero ellipticity in a practical antenna.
Corresponding measurements performed over the scale ground plane produced <rB/cr0 sphere q.p. - 13.5 db. The 18.5 db varia- tion in experimental results can be attributed to the polariza- tion dependence of the ground plane. A formulation of this de- pendence allows expression of the ratio of circular polarization cross sections for a sphere in terms of ground reflection factors
^ sphere g.p. [r.H2 • [yrl [v»]2 ^«H (A-l)
59
,
In the present analysis,the righthand side is equated to -18.5 db. Additional linear polarization cross section measurements of the sphere were performed on the scale ground plane range. Principal polarization measurements provided the ratio "v/0^ sphere g.p. = - 1 db or f'V/ rYj\ * = - 1 db. SubstitutIon of this data in equation gives /»v ~ PH ^ i ^ degrees. Cons [dera- tion of the reflection process shows that the minus sign is cor- rect here and that PV and ^H are opposite in sign. It is not possible to interpret the above results directly in terms of the primary reflection coefficients RHeJ^^ and RveJ^v. However, results of previous measurements at linear polarization gave R v = 0.68, hence RH " 0.8.
Investigation of the Disturbed Ground Plane Range
Operation of the scale ground-plane in an anechoic chamber insured measurements on the well behaved ground-plane range de- fined in Section IV. The following measurement programs were di- rected toward evaluation of certain disturbances associated with full-scale ground plane range operation:
1. The effects of surface irregularities
2. Variable-moisture-content effects
3. Problems associated with surface-wave illumination of the control pit and submerged turntable.
(It is possible to simulate a variety of ground conditions with the scale range; It It tuggasted that disturbances peculiar to the RAT SCAT range be investigated with this valuable tool.)
The Effects of Surface Irregularities
The ground plane acts as if it were perfectly smooth if Rayleigh's criterion is satisfied, that is, if the height of sur- face irregularities times the grazing angle «/r (in radians) is less than X/16. Typical results are plotted in Figure A-7. For the scale ground plane range, $ ml0 and k**l/3 inch. The cal- culated allowable height Irregularity was thus less than one inch. The smooth sand was deliberately disturbed to provide waves more or less perpendicular to the antenna line of sight in the region between the antenna and target locations. Troughs parallel to the antenna line of sight were made off to the sides. The approximate height of the sand waves was one inch. Principal polarization measurements on the reference flat plate (1 inch square) produced cross sections identical to the smooth-sand
60
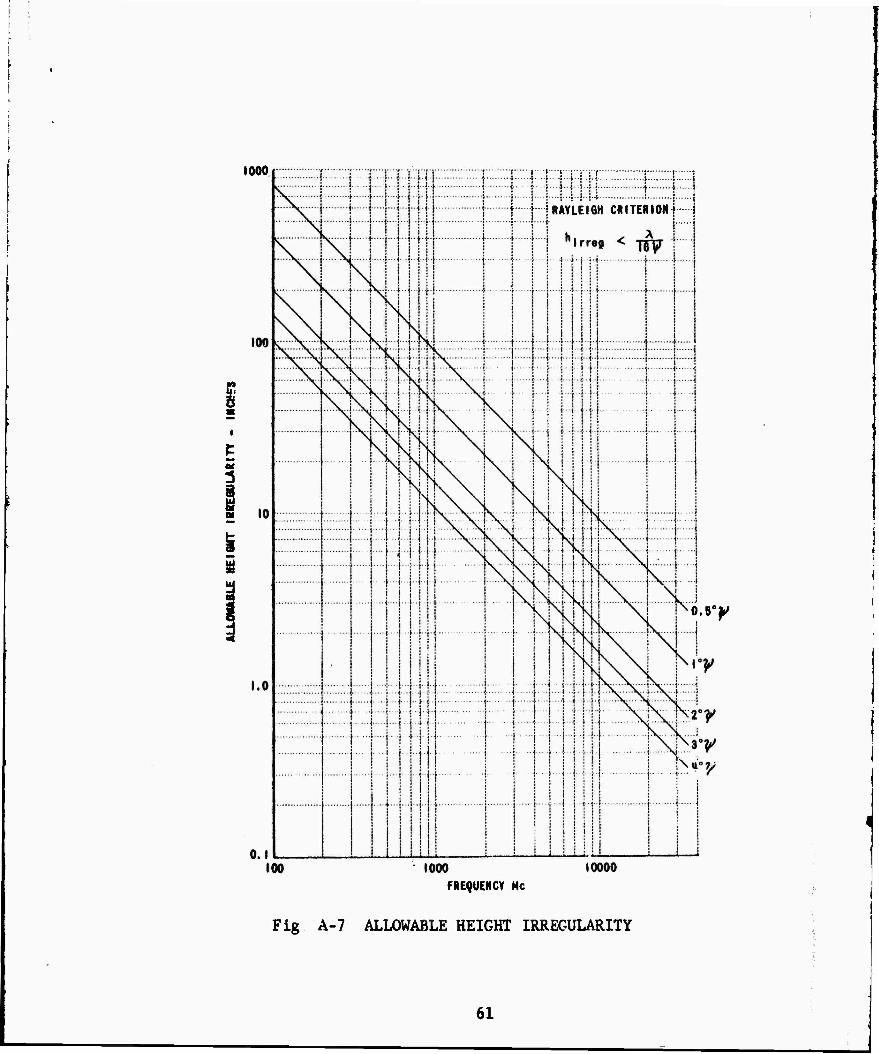
1000
•I-•t-.-i-r-!-!-> ■■ • i jI IRAVLEIOH CHITERIOHl i ;••■•)•
FREQUENCY Mc
Fig A-7 ALLOWABLE HEIGHT IRREGULARITY
O.B'y
61
reference runs. Next a 6-inch mound was shaped in the sand behind the target area across the container. Wo effect on plate cross section was observable.
Compacting an 8 x 12-inch area of sand 3/S inch in the lo- cation of the first Fresnel zone did not perturb measurements. Ground-plane height effects were first noticed when a 2-1/2-inch hill was run through the reflection area perpendicular to the line oc. sight. The specular peaks of the flat-plate cross sec- tions were reduced 7 db, although the data retained symmetry. Angling of this hill with respect to the radar line of sight de- stroyed the symmetry. The program indicated validity of the Rayleigh criterion for surface irregularities in the region be- tween the antenna and the target. Even larger irregularities may exist beyond the target without disturbing measured cross sections.
Operation of 10 Gc with a grazing angle of one degree allows height irregularities of about 4-1/2 inches by the Rayleigh criter- ion, hence, it is felt that irregularities in surface height will produce negligible errors in cross section measurements.
Variable-Moisture-Content Effects
Soil formations at the RAT SCAT Site result in a natural water basin. The presence of varying depths of water beneath
? the measurement site could complicate the basic ground plane con- ( cept, since the ground plane will exhibit the characteristics of
a layered dielectric.
A layered dielectric was simulated on the scale ground plane range by placing a flat base of wet sand beneath a surface of dry sand. Seepage between the wet sand (16 per cent water by weight) and the dry sand (a fraction of one p^r cent) interface was not observed. Dry-sand surface thicknesses of 3, 2, 1 and 0 inches were examined. Using the 3-wavelength-square flat platt as a target for both vertical and horizontal polarizations, layered- dielectric effects became noticeable when the dry surface thick- ness was reduced to one inch. Results are given in Figures A-8 and A-9. Even for the all-wet-sand case, the measured cross sections are within 0.5 db of their free space counterparts.
The all-wet-sand configuration approximates an appriciably conducting ground plane. Investigation of the surface wave for vertical polarization involved raising a sphere through the field to provide a vertical coverage diagram. No increase over the smrll surface wave component existing in the dry ground plane case (refer Co Figure Ä-2) is observed In Figure A-10.
62
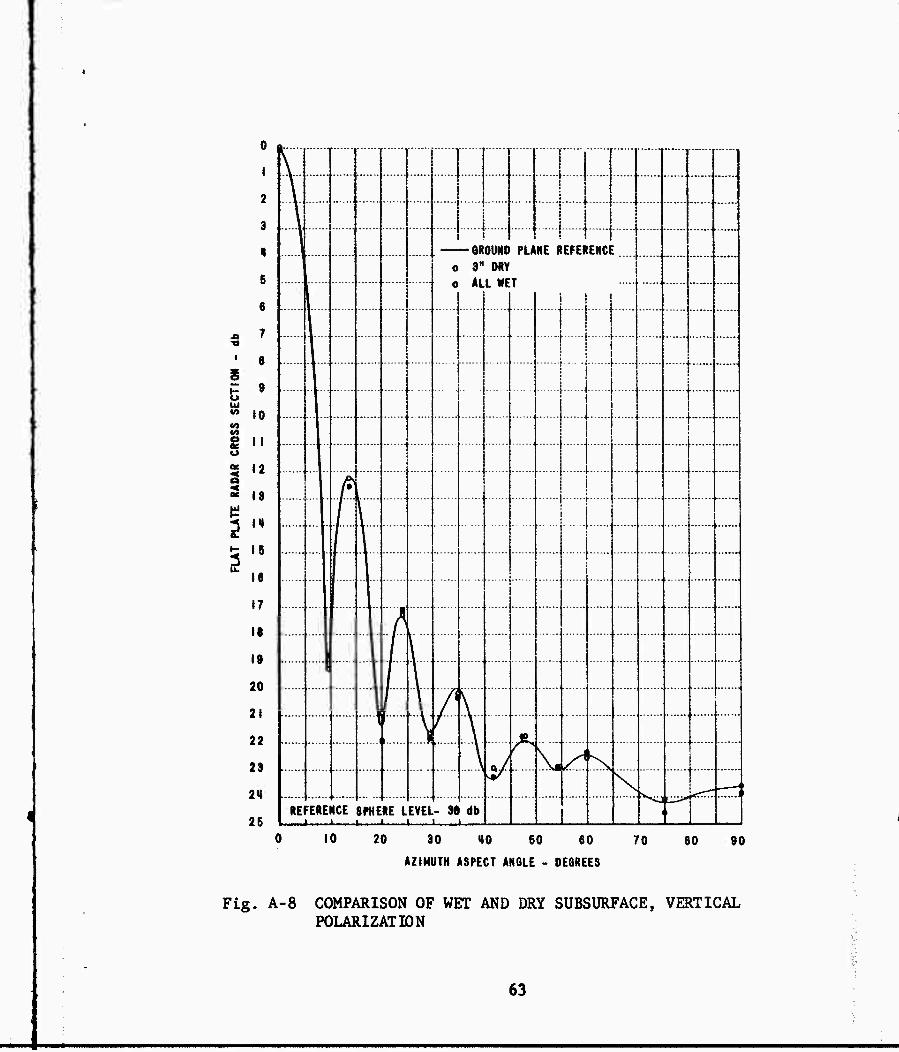
■O •a i
i
CO CO
as 2
2
0
I
2
3
I»
6
6
7
8
9
0
I
2
3
"I
5
6
7
a
9
20
21
22
23
24
26
i
...1.
r ■
| h
j !
5 I I I T 1 -eROUND PLANE REFERENCE
i o 3" DRY
O
;
.......
[ /r
i
/ \ !
| ,
■
i
u_
--,
i
db
A \.
^ "N S -^ :
RE 'ERE NCE SPNE i ,
RE L EVEl i
- 36 •
10 20 30 40 60 60
AZIMUTH ASPECT ANGLE - DEGREES
70 60 90
Fig. A-8 COMPARISON OF WET AND DRY SUBSURFACE, VERTICAL POLARIZATION
63
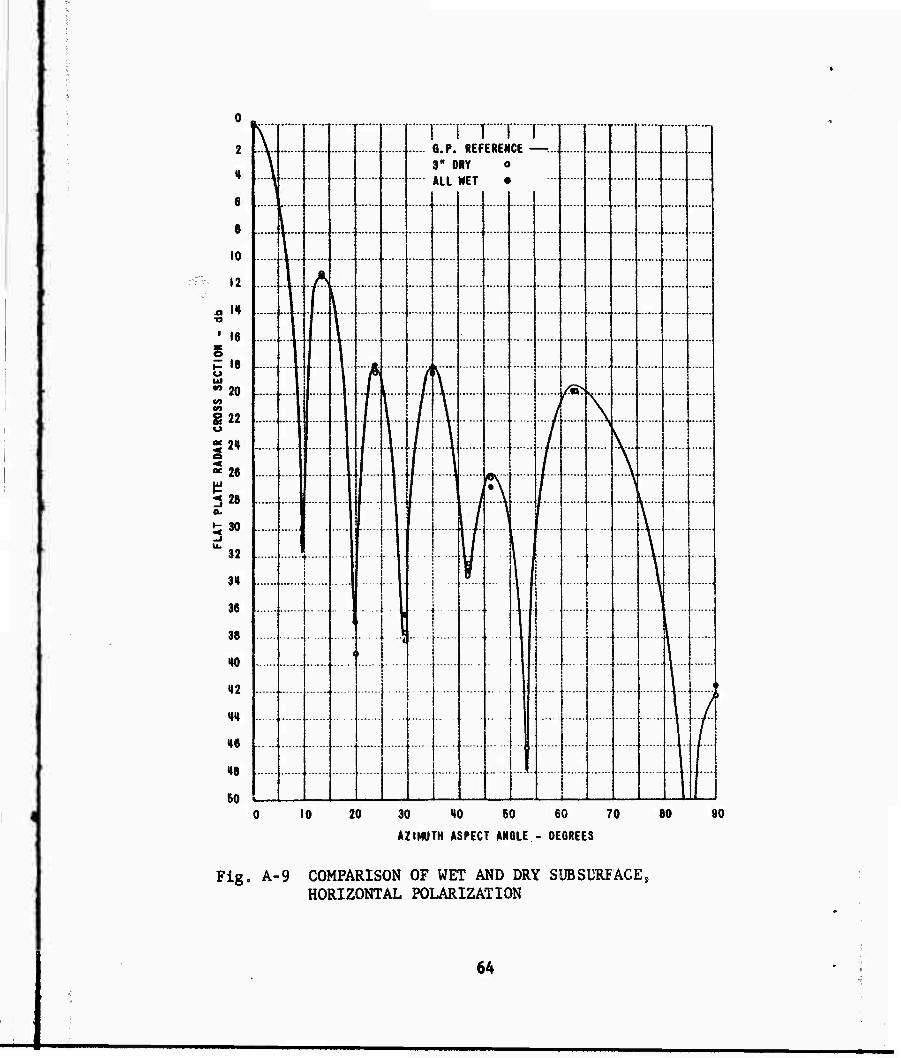
2
*
6
8
10
12
x. It -o 1 16 s i= 18 u UI •» 20 M tn S 22 o * 2» o 2 26
3 28 a. t- 30
"32
34
36
36
HO
H2
46
46
60
11 i! f
../. ..
\
1
'
/
i
a. p. 3" D ALL
»...-—
T 1 REFERENCE
RV o WET •
1 1 1 1 J—- j i
l J
1 1
... .i
I
1.
[
^
^
i t--
1 - -
.. .,
I i
i.j. ...
i
,
1 •
n 1 1
* >
L -■
..... -4 ■-
\
20 30 40 SO 60 70
AZIMUTH ASPECT ANGLE - DEGREES
80 90
Fig. A-9 COMPARISON OF WET AND DRY SUBSURFACE, HORIZONTAL POLARIZATION
64
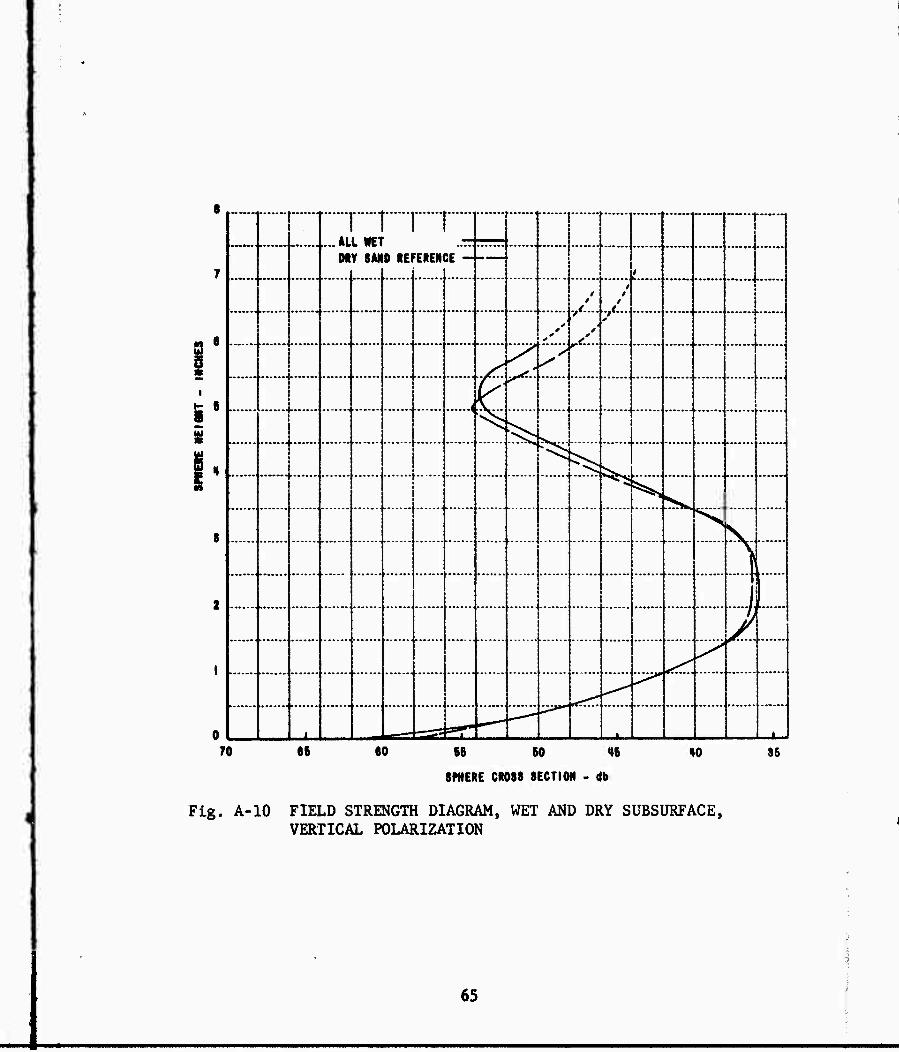
8'
r
i .
i ALL WF1 »
.«•.*.•.
1
-—-•+"—--
M V SAM
0 REI :EREN(
^
BE -
(
I ! i
/
V,< ■
r——■
/ / /
*
, b......
1
^
••-*-••
■^ C^s
■
^ "^ •s: v
I ^
/-
^ ^
—L- ^g; *r ~~~ -"
70 OB 60 SS 50 46
SPHERE CROSS SECTION - db
40 36
. Fig. A-10 FIELD STRENGTH DIAGRAM, WET AND DRY SUBSURFACE,
VERTICAL POLARIZATION i
65 :
,JL,
f"
Control Pit and Submerged Turntable
The conventional solution to the problem of target control Involves use of a rotating turntable. Full-scale ranges usually provide a control pit in which the turntable is submerged. How- ever, vertical polarization transmission over a ground plane re- sults in an appreciable surface-wave component which illuminates the control pit. The direct return from the pit can be nulled out with the background. Nonetheless, sensitivity is lost due to the variation of pit return with turntable rotation. In ad- dition, nulling procedures do not reduce the possible bistatic contribution attendant with pit illumination. The application of absorber material over the turntable will effectively reduce target illumination due to control-pit scattering. However, lit- tle reduction of the direct return is observed through this pro- cedure. Of significance to RAT SCAT is the following history of the direct return from the control pit and turntable employed on the scale ground-plane range. Worst-case results are associated with cross-section measurements using the vertical-vertical an- tenna polarization combination.
In the scale-range configuration, a sand dam corresponded to the control pit. Figure A-11 shows a 3-inch-diameter copper tube extending from the ground-plane surface through to the sand box. A 2-inch-diameter plexiglass turntable was located inside the sand dam 1 inch below the surface. Four small screws set in the plexiglass disc provided attachments for target control lines. The disc was cemented to a pipe flange attached to a 3/4-inch- diameter steel shaft. Provision for variable shaft tilt allowed final inclination of the turntable rotation axis three degrees from vertical in the direction of the radar.
The measurements involve pit and turntable returns only. In each case the return from the stationary configuration was nulled. The vertical polarization peak return was 12-db below the refer- ence sphere level as the turntable rotated, i.e., undesired re- turns were as high as 10"5 square meter at Ka band. A 2-inch- diameter disc of CV 6* 3/4 inches thick was then placed on the turntable, without appreciable effect. The turntable was next lowered to a new height, 1-1/2 inches below the surface and a ring of CV 6 3/4 inches high and 1/2 inch thick installed in the inner surface of the copper sand dam flush with the top. The range was nulled again and resultant peaks as high as 10"6 square
*A radar absorber product of the Emerson and Cummings firm,
66
meter were measured. However, most of the return as a lunction of aspect remained in the null, below lO"8 square meter. Appli- cation of two more rings beneath the first showed no improvement, nor did insertion of a turntable cover of CV 6. Finally, a 5-inch- square piece of CV 6 was placed over the sand-dam opening. The rotating turntable still exhibited at 10-6 square meter cross sec- tion at several rotation angles.
At this point the copper tube was replaced by a plaster of Paris form. The pipe flange was removed and the plexiglass disc was joined to the rotating shaft by means of a centrally located screw. Resultant cross-section measurements of this pit configu- ration indicated undesirable returns below the room null, about 10-9 square meter. No dependence of the return with turntable orientation was observed.
It must be emphasized that reduction of pit cross section was beyond the scope of effort; the achievement of accurate simu- lation of full scale conditions was the basic goal.
'
Fig. A-11 TURN TABLE CONFIGURATION
67
•
Unclassified
Security Classification DOCUMENT CONTROL DATA - R&D
(SteutHy cl«»»/flc«Hon of KM», body ol abaltacl and Indexing annotation mual ba amend when the overall report la elaaaUled)
1. ORIGINATING ACTIVITY (Corporate author)
General Dynaaics/Fort Worth P. 0. Box 748 Fort Worth, Texfls 76101
2a. REPORT SECURITY CLASSIFICATION
UNCLASSIFIED 2b CROUP
M.A. 3 REPORT TITLE
Radar Cross Section Target Supports - Metal Columns and Suspension Devices
4. DESCRIPTIVE NOTES (Type of report and Inclualva dataa)
FINAL 5. AUTHORWfLaalnama, ftnfnama. Initial)
Freeny, C. C. (GD/FW) Ross, R. A. (CAL)
6 REPORT DATE
June 1964 8a. CONTRACT OR GRANT NO.
AF30C602)-2831 b. PROJECT NO. 6503
7a. TOTAL NO. OF PAOCS
71 76. NO. OF R6FS
Q 9a. ORI»INATOR'S REPORT NUMBERfSJ
RADC-TDR-64-382
»b. OTHER REPORT NOfSJ falny othar numbara (hat may ba aaaJ«nad tfila report)
General Dynamics FZE-222-5 10. AVAILABILITY/LIMITATION NOTICES
Qualified requesters may obtain copies of this report from DDC.
11. SUPPLEMENTARY NOTES
None 12. SPONSORING MILITARY ACTIVITY
RADC (EMASP) Griffiss AFB NY 13442
13- ABSTRACT The shielded metal column program was devoted specifically to the in- vestigation of errors in cross section measurement resulting from the use of a large, hydraulically actuated metal target support at the. RAT SCAT Site. The analytical model used and the factors taken into con- sideration in arriving at a test program for use in evaluating shield- ing techniques for the metal target support are described in this re- port. The suspension target support program was an experimental pro- gram carried out by Cornell Aeronautical Laboratory. A seals ground plane range was used to simulate low-frequency operation on the RAT SCAT range. Most of the measurements made were for the purpose of de- termining the cross section return of such conventional suspension target supports as nylon. The parameters of primary concern were size and the polarization of the transmitter and receiver. This report is No. 5 in a series of 8 RAT SCAT Research and Development Program re- ports .
DD FORM I JAN «4 1473
69 Unclassified
Security Classification
Unclassified Security Classification
14. KEY WORDS
LINK A
ROLE WT
LINK B
HOLE LINK C
Radar Scattering From Support Devices
Metal Columns and Suspension Devices
INSTRUCTIONS
I, ORIGINATING ACTIVITY: Enter the name and address of the contractor, subcontractor, grantee, Department of De- fense activity or other organization (corporate author) issuing the report.
2«. REPORT SECUMTY CLASSIFICATION: Enter the over- all security classification of the report. Indicate whether "Restricted Data" is included Marking is to be in accord- ance with appropriate security regulations.
26. GROUP: Automatic downgrading is specified in DoD Di- rective 5200.10 and Armed Forces Industrial Manual. Enter the group number. Also, when applicable, show that optional markings have been used for Group 3 and Group 4 as author- ized.
3. REPORT TITLE: Enter the complete report title in all capital letters. Tides in all cases should be unclassified. If ■ meaningful title cannot be selected without classifica- tion, show title classification in all capitals in parenthesis immediately following the title.
4. DESCRIPTIVE NOTES: If appropriate, enter the type of report, e.g., interim, progress, summary, annual, or final. Give the inclusive d>ites when« specific reporting period is covered.
5. AUTKOR(S): Enter the name(t) of authors) as shown on or in the report. Enter last name, first name, middle initial. If xilitary, show rank and branch of service. The name of the principal author is an absolute minimum requirement
6. REPORT DATZ: Enter the date of the report as day, month, year; or month, year. If more than one date appears on the report, use date of publication.
7a. TOTAL NUMBER OF PAGES: The total page count should follow normal pagination procedures, i.e., enter the number of pages containing information.
76. NUMBER OF REFERENCES: Enter the total number of references cited in the report.
8a. CONTRACT OR GRANT NUMBER: If appropriate, enter the applicable number of the contract or grant under which the report was written.
86, 8c, b 8d. PROJECT NUMBER: Enter the appropriate militury department identificntion, such as project number, subproject number, system numbers, task number, etc.
9a. ORIGINATOR'S REPORT NUMBER(S): Enter the offi- cial report n'imber by which the document will be identified i.tid controlled by the originating activity. This number must *ie unique to this report.
96. THER REPORT NUMBBR(S): If the report has been assigned any other report numbers (either hy the originator or by (he sponsor;, also enter this number(s).
10. AVAILABILITY/LIMITATION NOTICES: Enter any lim- itations on further dissemination of the report, other than those
Imposed by security classification, using standard statements such as:
(1) "Qualified requesters may obtain copies of this report from DDC"
(2) "Foreign announcement and dissemination of this report by DDC is not authorized."
(3) "U. S. Government agencies may obtain copies of this report directly from DDC. Other qualified DDC users shall request through
(4) "U. S. military agencies may obtain copies of this report directly from DDC Other qualified users shall request through
(5) "All distribution of this report is controlled. Qual- ified DDC users shall request through
If the report has been furnished to the Office of Technical Services, Department of Commerce, for sale to the public, indi- cate this fact and enter the price, if known.
!1. SUPPLEMENTARY NOTES: Use for additional explana- tory notes.
12. SPONSORING MILITARY ACTIVITY: Enter the name of the departmental project office or laboratory sponsoring (pay- ing (or) the research and development. Include address.
13. ABSTRACT: Enter an abstract giving a brief and factual summary of the document indicative of the report, even though it may also appear elsewhere in the body of the technical re- port. If additional space is required, a continuation sheet shall be attached.
It is highly desirable that the abstract of classified reports be unclassified. Each paragraph of the abstract shall end with an indication of the military security classification of the in- formation in the paragraph, represented as (TS). (S), (C), or (Vy
There is no limitation on the length of the abstract. How- ever, the suggested length is from 150 to 225 words.
14. KEY WORDS: Key words are technically meaningful terms or short phrases that characterise a report and may be used cs index entries for cataloging the report. Key words must be selected so that no security classification is required. Identi- fiers, such us equipment model designation, trade name, military project code name, geographic location, may be used as key words but will be followed by an indication of technical con- text. The assignment of links, rules, and weights is optional.
70 Unclassified
Security Classification