lf1672146
TRANSCRIPT

Università Commerciale Luigi Bocconi
Faculty of Economics
Bachelor in International Economics, Management & Finance
Benefits and caveats of hedge fund activism: abnormal returns and shareholders’ gains.
Mentored by: Andrea Beltratti
A thesis by:
Stefano Valeri
Identification Number: 1672146
Academic Year 2014/2015

Table of Content
Abstract
Chapter I — Introduction
i. Definition
ii. An historical perspective: activists’ legislative framework and tactics
iii. Controversial effects on target firms
a. Proponents’ view — an active approach
b. Proponents’ view — a passive approach
iv. Research questions
Chapter II — Methodology
i. Sampling
ii. Market model
iii. Cumulative abnormal returns- Abnormal returns by strategy
iv. Cash flows
Chapter III — Implementation
Chapter IV — Results
i. Cumulative abnormal returns
ii. Strategy returns
iii. Cash flows
Chapter V — Conclusions
1
1
2
4
7
8
8
10
12
16
18
22
22
26
30
34
AbstractIn this paper, I analyze hedge funds’ abnormal returns for what concerns the U.S. landscape,
taking into account two separate time periods of different length, respectively the 20-days
and 3-days neighbourhoods around the event date. The ultimate aim of the analysis is that of
checking whether the recent researches’ conclusions on this matter are actually reflected in
latest data available (2014). In order to maintain representativeness, a sample was chosen
after a process of data mining which was designed to grant a wide presence of different
hedge funds’ investment justifications. This peculiar sample and analysis will allow me to check,
on one hand, whether hedge funds in general are able to improve the target firms’ outlook
within a short lapse of time and, on the other hand, whether different strategies ultimately
deliver statistically different returns, although admittedly with small samples.
In a nutshell, both 1-day and 20-day abnormal returns around the date of the 13D filing by
the SEC are statistically different from zero with a confidence level of 10% and 5%, taking
into account expected returns for each firm through their betas. Furthermore, abnormal
returns for hedge funds targeting undervalued companies beat (with a return of 5.8% in the
3-d time lapse) the abnormal returns for both hedge funds which aim to restructure
corporate organisation and those that see incumbent directors’ mismanagement as a
motivation for performance improvements, albeit in the shorter period considered. With
regard to the longer period taken into account, abnormal returns of the price of the
companies targeted on the basis of, respectively, director mismanagement and corporate
restructuring and sales, expose a value of circa 5% (4 percentage points higher than
undervaluated companies’ abnormal returns, even if this different is revealed not to be
statistically significant).

Taking into account the positive change in cash flows from investments (115,9%) and
negative one from operations (-22,8%), I will put forth the hypothesis that target firms’
shareholders and stakeholders may not receive any overall benefit from activist investments,
while hedge funds definitely profit from an active investing approach, especially if we consider
the almost insignificant correlation between abnormal returns and changes in cash flows.

Chapter I — Introduction
i. Definition
According to SEC i.e. the U.S. Securities and Exchange Commission, the term hedge fund has
no precise meaning nor a widely accepted definition . So far, it has been used to refer to 1
those investment funds with unusual characteristics and that are granted more freedom
under applicable law. Since their inception a general trend toward a more active approach in 2
their investments has taken place in the industry. Recent legislation gave a final push to these
funds in order to foster activism engagement in companies they invest in. Hedge funds tend
to favour turn arounds, balanced corporate governance structures, or, more generally, a boost
in value of their target companies. Hedge funds operate both active and passive investments.
An activist shareholder is defined as an individual who acquires a minority equity position in
a public corporation and then applies pressure on management in order to increase
shareholder value through changes in corporate policies . 3
These policies could range from simply reducing the costs structure to blocking acquisition
and favouring divestitures, up to daily managing the target company to boost its intrinsic
value. Timing and share ownership are crucial. Hedge funds’ aim is to accumulate enough
shares to influence changes while trying not to draw attention from the public or from tag-
along investors (those who follow activist investments and risk driving up prices with their
“Implications of growth of hedge funds”, Staff report to U.S. Securities and Exchange Commission, 20031
Alfred W. Jones founded the first hedge(d) fund in history in 1949, “A. W. Jones and Co.”2
David P. Stowell, Investment banks, hedge funds, and private equity, Second edition, Elsevier Academic Press3
1
Chapter I — Introduction

purchases). It’s quite obvious though that the secrecy of hedge funds’ investments cannot be
preserved perpetually since the SEC requires any investor to disclose their stake in the target
company within 10 days from the breach of the 5% ownership threshold. The filing of the s.c.
SEC Schedule 13D is mandatory in order to report the acquisition of the relevant share
participation and other information to both the markets and the issuing company. In the
schedule, the investor clearly defines himself or herself as and activist shareholder, as the
purpose of the statement is that of redirecting managements’ efforts towards some particular
direction, e.g. opposing an existing merger.
ii. An historical perspective: activists’ legislative framework and tactics
Hedge fund investing activities have surged in recent years after the effects of the financial
crisis fade out. During that period those funds saw their market share plunge while their
returns were hitting historical lows due both to a deteriorated market environment on one
hand, and to the hedge fund typical characteristics on the other hand.
I am referring to hedge funds’ ability to leverage up and go short on stocks, along with their
illiquid liability side compared to a somewhat liquid asset side. Furthermore, the fee structure
and the minimal regulation under which they operated actually placed these investment
companies in a separate albeit parallel industry in which absolute returns, extremely risky
strategies, and speed of execution were the key of funds’ success in the booming economy.
As it generally happens , regulators and competitors’ scandals and conflicts of interest made 4
it possible for hedge funds to quickly steal back the central role in financial markets. More
Froud, Nilsson, Moran, and Williams, “Stories and interests in finance: agendas of governance before and after the financial crisis”, Dec. 20114
2
Chapter I — Introduction

specifically, the Dodd-Frank Act of 2010 limited proprietary trading activities for investment
banks, which have been historical competitors for hedge funds (thus granting the latter more
freedom of action and more possibility to choose which firms to invest in). Furthermore, the
Sarbanes-Oxley Act of 2002 focused on corporate governance and disclosure requirements
for public companies, triggering the interest for the active investing approach.
Activism affects the economies around the world as well as specific sectors within each
nation. For this reason, the U.S. have recently put in place reforms that helped hedge funds
widen their target business areas of investment and make their voice effectively heard in
shareholders’ meetings. For example, proxy contests have skyrocketed in numbers since the
2009 SEC reform, prohibiting broker discretionary voting for director elections. Furthermore,
according to the Dodd-Frank Act, the brokers themselves cannot vote on executive
compensations or any important matter using uninstructed shares. So far brokers were
allowed to vote on behalf of their retail clients who failed to vote and their votes were
generally in accordance with directors’ instructions. Plus, almost half of all major U.S.
companies have adopted a majority voting election system in which at least 50% of the
shareholders must be in favour for the current directors to stay in office, replacing the plain
plurality voting system. All these regulations should ensure that there would likely be fewer
votes in favour of management due to the importance that is given to every single share with
voting rights, as an abstention from voting would mean a contrary vote to current directors.
More power is then granted to activists who desire to change the current company situation.
Putting historical issues aside, it’s mandatory to highlight how tactics of both hedge funds and
directors have changed so far. The s.c. Wolf Pack tactic is increasingly important in the hedge
fund world as it allows each member to delay the moment at which it is required to file the
3
Chapter I — Introduction

SEC Schedule 13D. The Wolf Pack tactic consists in the development of a loose network of
activist investors that act in a parallel fashion , while deliberately avoid forming a “group” 5
under Section 13.d.3 of the Securities Exchange Act of 1934 in which it is stated that:
Using this practise a Wolf Pack can build each member’s stake up to the 5% threshold, in
order to go over that limit at the same moment immediately after and finally, as each is
required to disclose the holding within 10 days, further increase each member’s stake before
the actual disclosure. More importantly, by avoiding early 13D filings, the target company will
not be ready to adopt poison pills and golden parachutes, or contact white knights to
counterbalance the hedge funds presence at shareholders’ meeting.
iii. Controversial effects on target firms
Strangely, the main reason for which hedge fund activism is at the centre of today’s financial
press is that it has an unclear effect on target company value, which should de facto be the
principal aim of any active investment. Many studies tried to dismantle price effects from real
variable effects on one hand, while distinguishing between long-term and short-term effects
in both price and real variables, such as free cash flows, ROA, or leverage. Controversial
evidences came up with different analyses, and here it follows a summary on that matter.
John C. Coffee Jr., The impact of hedge fund activism: evidence and implications, Law Working Paper N° 266/2014, September 2014, 5
Columbia University and ECGI, Darius Palia, Rutgers Business School
4
Chapter I — Introduction
[…] when two or more persons act as a […] group for the purpose of acquiring, holding, or
disposing of securities of an issuer, such syndicate or group shall be deemed a ‘person’ for the
purposes of this subsection.

a. Proponents’ view — an active approach
On one hand, under proponents of hedge fund activism perspective, activist
interventions are due to agency problems that arise between managers and
shareholders. Managers focus primarily on increasing their reputation
through large capital expenditures. They sub-optimally exploit free cash
flows to enlarge the firm’s presence in non-core markets, especially when
positive NPV investments are unavailable. In those situations managers
should pay back cash to shareholders via dividends or repurchases according
to the Modigliani-Miller hypothesis on efficient markets; the issue arises
when minority shareholders are unable to file complaints to directors when
this do not happen . 6
With this in mind, it should be acknowledged that focal firms, which
experience cuts in R&D and capital expenditures or that increase dividends
and leverage to force managers service debts after 13D filings, experience
an increase in their share price.
b. Proponents’ view — a passive approach
On the other hand, director supporters enumerate a list of risks that may
arise from the mentioned increasing importance of shareholders.
First, the s.c. short-terminism of managers may decrease the firm’s long-term
value . It is argued that hedge funds force managers to boost short-term 7
Michael C. Jensen, Agency Costs of Free Cash Flow, Corporate Finance and Takeovers, 76. Amer. Eco. Rev. 323 (1986)6
Brian Bushee, Do Institutional Investors Prefer Near-Term Earnings Over Long Run Value?, 18 Contemp. Acct. Res. 207, 213 (2001)7
5
Chapter I — Introduction

earnings while neglecting long-term value creation, which is generally
achieved through an efficient strategy and R&D / marketing investments that
foster development of intangible assets. Accordingly, anothether study 8
showed the link between the presence of short-term investors, such as
hedge funds, and weaker monitoring on actual performance, which
ultimately leads to misevaluations.
Second, directors tend to shift their focus from guiding strategy and advising
management to ensuring compliance and performing due diligence . They 9
indeed leave their role as trusted advisors of managing directors because of
concerns of litigation from independent directors, focusing on their personal
responsibilities and hence drifting their focus away from value maximisation
strategies; this ultimately leads to the dampening of ongoing relationships
with related parties, such as employees, customers, and suppliers, which are
the ultimate driver of competitive positioning.
Finally, directors may give too much power to activists in order to avoid
judicial problems and therefore leave every important decision to
shareholders, decisions that could impede the normal operating procedures
of the company, with significant interruptions in production processes and
lags behind competitors.
Katherine Guthrie and Jan Sokolowsky, Large Shareholders and the Pressure to Manage Earnings, 16 J. Corp. Fin. 302 (2010)8
David P. Stowell, op. cit.9
6
Chapter I — Introduction

iv. Research questions
In this paper, I am going to investigate two hypotheses:
- first, I calculate the cumulative abnormal returns over two different time windows,
where the shorter one covers the period from the day before to the day after the
disclosure date, while the longer one goes from twenty days prior to the SEC Schedule
13D filing date to twenty days after this event date.
I further discuss any evidence of front running and test the significance of the abnormal
returns
- second, I categorize investments according to investment objectives as stated by hedge
funds in 13D schedules and compare their abnormal returns to find evidence of
superior price performance of target company shares under one of them.
Afterwards, I consider the change in three measures of cash flows of target companies
as reported in their balance sheets from the end of 2013 to the end of 2014 and
calculate their averages and correlations with the abnormal returns in order to
contextualize the results from the aforementioned analyses in a framework of value
creation for shareholders.
7
Chapter I — Introduction

Chapter II — MethodologyMy research study focuses on the impact on target firms’ price when there is a SEC Schedule
13D filing by an investing hedge fund, during financial year 2014.
Price impact is widely used as a proxy for value and more in general for activists’ impact on a
company prospects . According to this theory, the abnormal performance has to be 10
attributed to actions taken out by hedge funds or, better, to the prospect of activities that
hedge funds promised to execute by explicating strategies and reasons for their investments,
which market investors discount to present days in the target share price.
i. Sampling
To begin this analysis, I searched for Section 13D filings on SEC’s Edgar online database 11
where it is possible to filter the search for specific time periods. I then looked for those filings
brought about by hedge funds. From this point onwards, it was a matter of deciding which
sample was best at representing the average filing from the average hedge fund without
exaggerating the number of characteristics considered: this task was accomplished with the
aim of not overfitting the data. Overfitting is a phenomenon for which a statistical model
describes random error or noise instead of the underlying relationship; it generally occurs
when a model is excessively complex, due to the presence of too many parameters relative
to the number of observations. A model that has been overfitted will generally have poor
R. Greenwood and M. Schoar, Investor Activism and Takeovers, 92 J. Fin. Eco. 362 (2009), M. Becht, J. Franks, C. Mayer 10
S. Rossi, Returns to Shareholder Activism: Evidence form a Clinical Study of the Hermes U.K. Focus Fund, 22 Rev. Fin. Stud. 3093 (2009)
www.sec.gov/edgar.shtml11
8
Chapter II — Methodology

predictive performance, as its bias can exaggerate minor fluctuations in the data. For this
reason, I sampled through the available hedge fund investments differentiating by declared
investment motivations. Furthermore, I chose investments from the whole financial year
2014, in order to avoid bias deriving from sector seasonal trends (cfr. the January effect or sell
in May and go away effect ) that could affect the returns of the market in given periods. 12
Finally, I considered a variety of industries for the target companies considered, as well as a
variety of stake participations. These cast over different sectors, going from online retailers to
regional saving & loan banks, to oil refinery.
The above tables illustrate, respectively, disclosed stakes and market capitalization of firms
taken in consideration for this thesis which rage between 0,4 millions and 117 billions.
These criteria led me to the gathering of a sample composed by 52 diversified U.S.-based
hedge fund investments made in financial year 2014.
'Sell in May and Go Away' Just Won't Go Away, Sandro C. Andrade Vidhi Chhaochharia, Michael E. Fuerst; July 1, 2012; Financial 12
Analysts Journal, Forthcoming
9
Chapter II — Methodology

ii. Market model
To proceed with the analysis I needed a beta for each investment, which had to be estimated
with respect to market movements; this meant developing a market model in which target
returns are regressed against market returns. By allowing for the existence of the intercept
(alpha), a more meaningful value for the resulting estimated beta was computed. There are
two common practices which involve using 52-weekly data from the most recent period or,
alternatively, the 277-daily natural logarithm of returns over the same time lapse. While the
former is generally preferred when it is reasonable to assume that prices are normally
distributed, the latter should prevail in case of doubts over distribution patterns in order to
foster ease of interpretation. As it is common practise for studies like this one, I went for the
daily log returns to estimate target firm’s betas along with the market returns as provided by
DataStream database specific for different markets, which in this analysis are mainly centred
in the british and american markets.
With a market model regression run with IBM’s SPSS software, the best beta estimate for
each target was tested through Student’s T to check whether it was statistically different from
zero; the test was also run against the null hypothesis (beta≠1). It was necessary to proceed
as stated because of the ultimate aim of this research, i.e. confronting expectations of returns
with actual returns for specific share titles. The single-index market model (SIM) is a simple
asset-pricing model to measure both the risk and the return of a stock, mathematically:
is return to stock i in period t, is the risk free rate (i.e. the interest rate on treasury
bills) which I assumed zero as this is the general situation in Europe and U.S. led by the
10
Chapter II — Methodology

respective Central Banks’ expansionary policies, is the return to the market portfolio in
period t, is the stock's alpha, or abnormal return, is the stock’s beta, or responsiveness
to the market return. Note that is called the excess return on the stock, while
represents the excess return on the market.
Fina l ly, are the residual (random) returns, which are assumed independent normally
distributed with mean zero and standard deviation .
These equations show that a stock return is influenced by the market (beta), that it holds a
firm-specific expected value (alpha), as well as a firm-specific unexpected component
(residual). Hence, each stock's performance is in relation to the performance of a market
index. The estimates found this way are calculated using a least square estimation model.
This is a model which has been run for each stock, in which the squared difference between
yit (return to stock i in period t) and (expected return for the stock in the 277 day
period considered) is minimized:
SPSS output provides an estimated for where y stands for the returns of the
stock i, x for those of the market, for the sample correlation between x and y, and S
for the sample standard deviation of respectively y and x.
Using the above-mentioned estimates, I went on predicting expected returns for each target
company over the event windows considered. If D is defined as the event day, which in this
thesis is the date of the 13D filing, and T as the number of days from the event date onwards
11
Chapter II — Methodology

and backwards, the expression (-T; +T) defines the event window under analysis. As
previously mentioned, I will test whether positive abnormal returns exist around the filing
date focusing my attention of two specific periods, (-20; +20) and (-1; +1) respectively. By
differentiating across time lengths I will further check whether there is proof of information
spinning, which will be the case if a positive abnormal return appeared earlier than the event
day, meaning that the building up of hedge fund’s position has become somehow public news
with other market players trying to gain from the expected price jump once the investment
is disclosed. In other words, if prices began climbing up unexpectedly in the period
antecedent to the filing date, there would be proof that market participants detected hedge
fund investments.
iii. Cumulative abnormal returns
The expected daily returns were then compared with the actual logarithm of daily returns in
order to obtain an estimate of the daily abnormal returns around the event date. Due to the
nature of these (being them natural logarithms) it was possible to simply sum them up over
the period of interest to calculate the cumulative abnormal return for each target firm stock.
The average return among firms for both the 20-day and the 1-day neighbourhoods were
tested to check their statistical significance. As customary in empirical statistical testing, the
sample values, in these cases the 20-day and 1-day average abnormal returns, are analyzed
with regard to a null hypothesis for that variable. must represent the value expected to
be found in the population, i.e. the value the sample is supposed to significantly represent.
12
Chapter II — Methodology

The expected abnormal return can be considered such either on a general wisdom basis or
on on a widely accepted theory. In this thesis, I based my evaluations on the Efficient Market
Hypothesis (EMH), which states that it is impossible to beat the market due to stock market
efficiency causing existing share prices to always incorporate and reflect all public information.
According to the EMH, stocks always trade at their fair value on stock exchanges, making it
impossible for investors to either purchase undervalued stocks or sell stocks for inflated
prices. As a consequence, it should be impossible to outperform the overall market through
expert stock selection or market timing: the only way an investor can possibly obtain higher
returns is by purchasing riskier investments. This hypothesis, applied to the following analysis,
has some implications. Indeed, it should be impossible for investors to gain abnormal returns
by simply copycatting hedge funds following their investment strategies by buying stocks
when a 13D filing is disclosed, as no actual change wouldn’t have happened yet nor the
likelihood of turn-arounds would have been improved . In other words, under ABN returns 13
must equal zero. : ABN avg. R=0; : ABN avg. R≠0.
In order to perform a statistical test through Student’s T, the difference between the sample
abnormal average return and the expected abnormal average return under must be
divided by the sample standard deviation of the abnormal returns previously obtained,
divided itself by the square root of the sample size. By doing so, the aforementioned result
gets standardized so that first, extreme results are brought back to normality and second, the
distribution of the sample abnormal returns follows a Student’s T distribution. This
Alon Brav, Wei Jiang, Frank Partnoy, and Randall Thomas, Hedge Fund Activism, Corporate Governance, and Firm Performance, The journal 13
of finance , vol. xiii, no. 4, august 2008,
13
Chapter II — Methodology

distrubution was chosen because it represents a good approximation of real price trends in
financial markets, albeit it misses the skewness that is empirically observed.
The p-value is defined as the probability, under the assumption of the null hypothesis, of
obtaining a result equal to or more extreme than what was actually observed. It is therefore
mandatory to preliminarly define a certain significance level, which is usually set to 10% or
5% according to the desired strength of the test. Thereafter, it is necessary to check whether
the latter is bigger than the p-value. If the p-value is equal to or smaller than the significance
level (α), the observed data are inconsistent with the assumption that the null hypothesis is
true, and thus that null hypothesis must be rejected, accepting consequently the alternative
hypothesis. When the p-value is calculated correctly, such test is guaranteed to control the
Type I error rate not to be greater than α, which means avoiding the risk of rejecting a true
null hypothesis. In a nutshell, I performed a two-tail t-test on the average abnormal returns
against a null hypothesis of them equalling zero, excluding two extreme outliers.
To deepen the ongoing analysis, I calculated the correlation between 1-day-neighbourhood
and 20-day-neighbourhood abnormal returns, and checked for its significance. The Students’ T
value related to the sample correlation was computed through the quantity , where r
stands for sample correlation and n for sample size. If the sample size is bigger than 6, as in
this case, this value will follow a Students’ T distribution and can be tested against a null
hypothesis of null correlation between the abnormal returns in the two time lapses
considered.
14
Chapter II — Methodology

- Abnormal returns by strategy
Additionally, using the data already computed, I tested for differences in
expected abnormal returns across different hedge fund declared investment
motivations: director mismanagement, corporate governance improvements,
undervaluation, expected growth, upcoming sale/spinoff/windup.
I had to consider the difference in their sample standard deviations by
deploying a paired sample t-test on the expected return differences:
In the formula above, the numbers 1 and 2 refer to the considered
investment motivations for each test.
This test is appropriate when the following conditions are met : 14
- The sampling method for each sample is simple random sampling.
- The samples are independent.
- Each population is at least 10 times larger than its respective sample.
- Each sample is drawn from a normal or near-normal population.
Generally, the our sampling distribution will be approximately normal.
P. Newbold, W.L.Carlson, B. Thorne (2010), Statistics, Pearson - Prentice Hall14
15
Chapter II — Methodology

I assumed that at least one of the following conditions applies:
iv. Cash Flows
As a last note, though without statistical inference, I computed the correlation between
abnormal returns for each company and the corresponding percentage change in reported
cash flows from the beginning of 2014 to its end. This calculation was conducted with a
twofold aim: first is that of checking consistency of results with regard to other studies on 15
the matter.
The rationale behind this was that I needed to be sure that 2014 results were in line with
historical series and, therefore, that I would have been able to provide a more
comprehensive analysis of the hedge fund activism phenomenon.
Furthermore, another objective was that of developing a statistical inference in order to
assess whether the price impact on the focal firm’s stock price was fictitious or not. Again,
the aim was that of understanding if hedge funds’ investments actually delivered value to
shareholders. Calculations on correlation between cash flows and abnormal returns were
In E. Zur, “The activists investors — Investment opportunities, free cash flow, and overinvestment”, SSRN Electronic Journal, Jul. 2007 results 15
are not consistent; in Klein, Zur, “Hedge fund activism”, NYU Working Paper, CLB-06-017 results are indeed consistent.
16
• The population distribution is normal.
• The population data are symmetric, unimodal, without outliers,
and the sample size is 15 or less.
• The population data are slightly skewed, unimodal, without
outliers, and the sample size is 16 to 40.
Chapter II — Methodology

conducted in order to acknowledge whether the variation in terms of value was ultimately
reflected, in the long run, on the focal firm’s stock price as should indeed happen in
accordance with the efficient market hypothesis, as I will discuss later on in this thesis.
17
Chapter II — Methodology

Chapter III — ImplementationThe analysis begins with the selection of the sample and its size. In particular, we have that a
sample size of circa 50 companies is enough to proceed with the statistical inferences 16
necessary for this study. With regard to the specific companies I selected, I was lucky enough
to find a wide spread range of both types of companies and percentage stake of investment
available throughout the year 2014, geographically focused in both U.K. and U.S.
More specifically, I found that the main investment motivations seemed to be those driven by
director mismanagement: 21 sample target companies exposed this result. Plus, those sought
for future potential sale or corporate restructuring were 15, and, finally those targeted for
allegedly being undervalued were 12. Each of the 4 firms left over is a company that
undertook a merger/divestiture (in the period taken into account) with one of the other 48
previously mentioned corporations. In order to avoid biases, firms were tracked with the
ultimate aim of ensuring that, when calculating the returns for the hedge funds, an eventual
conversion of hedge funds’ previously held stocks into new company stocks was taken into
account. This had to be done because these companies’ shares could possibly have been
listed for some period of time following the conversion.
DRESSER-RAND GROUP, URS DEAD – TAKEOVER, SIMPLICITY BANCORP DEAD, HOMESTREET, BWIN PARTY DIGITAL 16
ENTM., VITACOST COM DEAD - ACQD., KROGER, LNB BANCORPORATION, JOE'S JEANS, CARBONITE, REALD, CONMED, YAHOO, INNVEST RLST.INV.TST., SERVICESOURCE INTL., RENTECH, MANITOWOC, ALLERGAN DEAD - DELIST., ACTAVIS, NOBLE ROMANS, 1347 PROPERTY INSURANCE HOLDINGS, CLAUDE RESOURCES, DAKOTA PLAINS HOLDINGS, SYNACOR, TELECOM ITALIA, JURIDICA INVESTMENTS, METRO BANCORP, GOODYEAR TIRE & RUB., EXTENDED STAY AMERICA, MEDIENT STUDIOS, CIVEO, OIL STS. INTL., BANC OF CALIFORNIA, WESTBURY BANCORP, FAMILY DOLLAR STORES, SHARPS COMPLIANCE, FANNIE MAE, FREDDIE MAC, MIDAS MEDICI, GP.HDG.MEADWESTVACO, MAGNUM HUNTER RESOURCES, INSIGNIA SYSTEMS, ICTL.HTLS.GP., POWERSECURE INTL., PMFG, LIFETIME FITNESS, ALANCO TECHS., WAUSAU PAPER, CLIFFS NATURAL RESOURCES, SIGNET JEWELERS, MORRISON(WM)SPMKTS., EBAY. Indexes — U.S.-DS Market, U.K.-DS Market
18
Chapter III— Implementation

The simplicity of this model used for sample selection, along with its similarity to the real
population, ultimately helped me to avoid sampling-related issues and, consequently, to derive
an imprecise statistical analysis of the price effects of hedge fund activism.
The following step was computing all necessary data. In fulfilling this task, I took into account
dividends and repurchases along with each target company’s daily returns from the adjusted
share price. Calculations were run using natural logarithm on two consecutive days:
Ln (Pt/Pt-1). This procedure, adopted instead of the normal non-continuous return calculation,
improves the power of the regression model explained in the next passage and permits to
avoid serious biases, in particular non-normality and/or heteroscedasticity of return
residuals . 17
On one hand, with regard to the non-normality, if sample size is sufficiently large (as in our
case) it is not a serious issue if errors are not normally distributed: the OLS estimators
indeed remain approximately normal, and inference is therefore valid. If, on the contrary,
errors are not normal but sample size is small, OLS estimators happen not to be normal
either, causing the standard error to be biased and inference to be possibly invalid (i.e. t-test
could lead to wrong conclusions). Moreover, standard errors are usually biased downward,
while significance levels are higher than correct ones.
These biases can be caused by several factors, but in a simple regression analysis they are
mainly determined by omission of significant variables (because of the simplicity of the basic
market model) and by outliers.
P. Newbold, op. cit.17
19
Chapter III— Implementation

On the other hand, with regard to the heteroscedasticity, if the variance of the error terms
is not constant, then the assumption of homoscedasticity is violated and ordinary least square
estimators (Betas) lose efficiency, which can make t-tests meaningless. Additionally and for
simplicity, as the logarithm is a linear operator, it is possible to add the daily returns together
to derive the cumulative ones.
The followings are the betas estimated via the application of the market model regression
analysis covering a period of 277 days prior to 30 days from the filing event; betas in red
colour are the ones statistically not different from one but different from zero, which were
dropped and subsequently replaced by one meaning perfectly tracking market returns.
After computing betas, I used them to predict a point estimate of the expected returns for
each specific day within the event window by using the market model with a forward-looking
viewpoint. In particular, I multiplied the beta point estimate for daily market returns for each
event window. By subtracting the actual return from the expected one on each day, I
obtained the abnormal daily returns for each target company stock. Two of these returns
were so extremely negative that the respective investments had to be discarded to avoid
disruptive effects on the average daily cumulative returns; the two were that in
20
Table 3 — Betas
Chapter III— Implementation

POWERSECURE INTL. with a 20-days-neighbourhood (from now on cited as 41-d)
cumulative return of -108,94% and that in MEDIENT STUDIOS of -122,52% for the same
period. Thanks to the properties of logarithms, I averaged these returns across companies'
stocks for each day and then summed up these values over the hypothetical window period,
always keeping the event date as referece.
21
Chapter III— Implementation
Chapter IV — Results
i. Cumulative abnormal returns
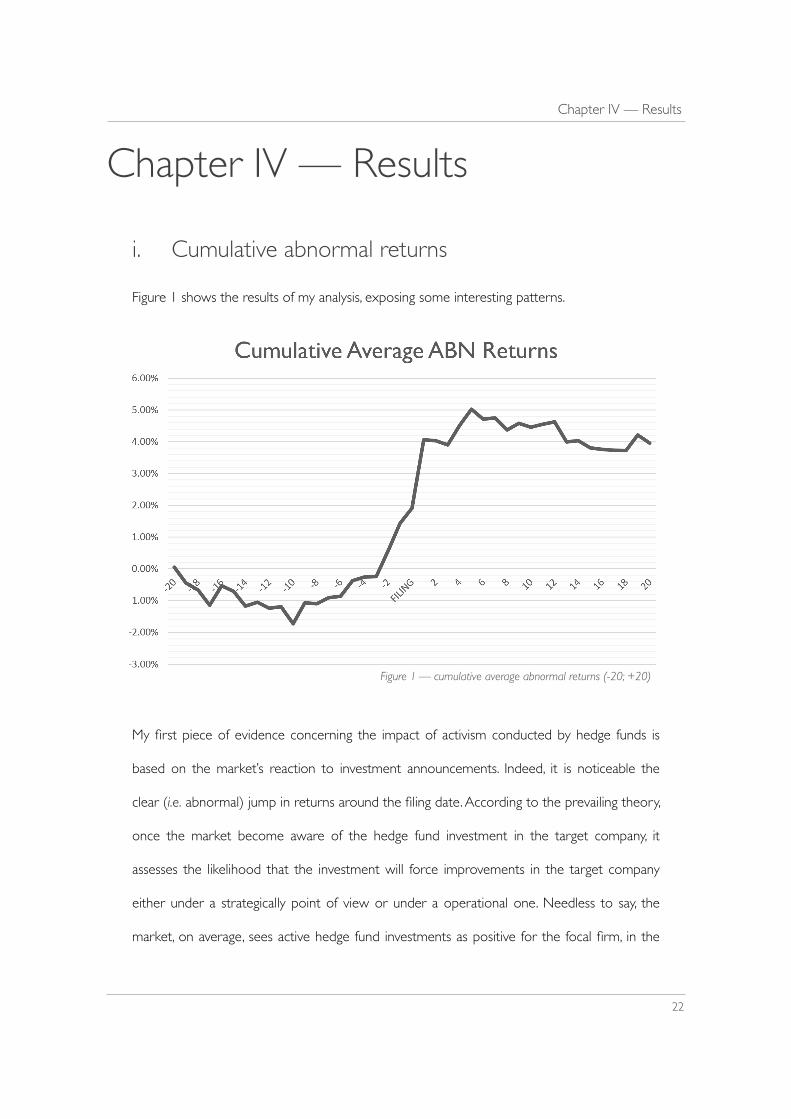
Figure 1 shows the results of my analysis, exposing some interesting patterns.
My first piece of evidence concerning the impact of activism conducted by hedge funds is
based on the market’s reaction to investment announcements. Indeed, it is noticeable the
clear (i.e. abnormal) jump in returns around the filing date. According to the prevailing theory,
once the market become aware of the hedge fund investment in the target company, it
assesses the likelihood that the investment will force improvements in the target company
either under a strategically point of view or under a operational one. Needless to say, the
market, on average, sees active hedge fund investments as positive for the focal firm, in the
22
Figure 1 — cumulative average abnormal returns (-20; +20)
Chapter IV — Results
sense that this investment is believed to make it less prone to agency problems. Furthermore,
it’s interesting to notice how, after the initial jump, no clear pattern arises, with prices trending
neither upward nor downward. This finding further strengthen the hypothesis that it is indeed
the news related to the investment that guides investors to bid up the price immediately
after the filing of the SED Schedule 13D. This pattern could also be interpreted as another
evidence in favour of the efficient market hypothesis.
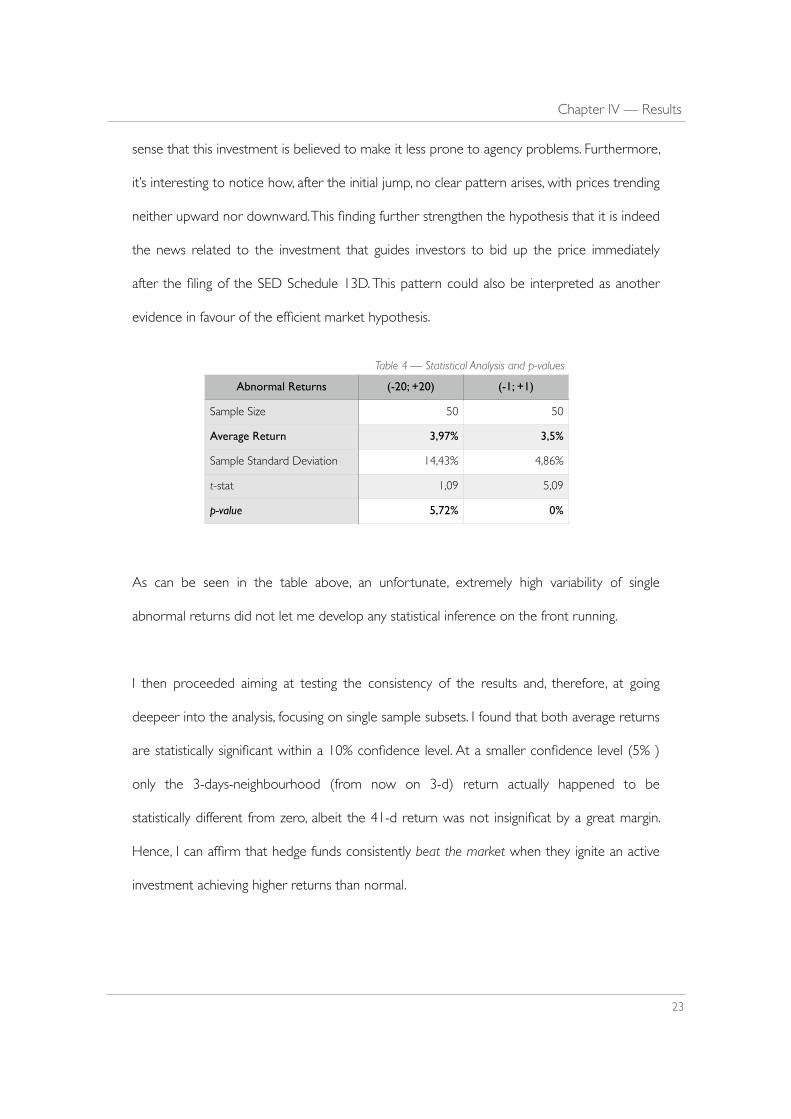
As can be seen in the table above, an unfortunate, extremely high variability of single
abnormal returns did not let me develop any statistical inference on the front running.
I then proceeded aiming at testing the consistency of the results and, therefore, at going
deepeer into the analysis, focusing on single sample subsets. I found that both average returns
are statistically significant within a 10% confidence level. At a smaller confidence level (5% )
only the 3-days-neighbourhood (from now on 3-d) return actually happened to be
statistically different from zero, albeit the 41-d return was not insignificat by a great margin.
Hence, I can affirm that hedge funds consistently beat the market when they ignite an active
investment achieving higher returns than normal.
23
Chapter IV — Results
Abnormal Returns (-20; +20) (-1; +1)
Sample Size 50 50
Average Return 3,97% 3,5%
Sample Standard Deviation 14,43% 4,86%
t-stat 1,09 5,09
p-value 5,72% 0%
Table 4 — Statistical Analysis and p-values
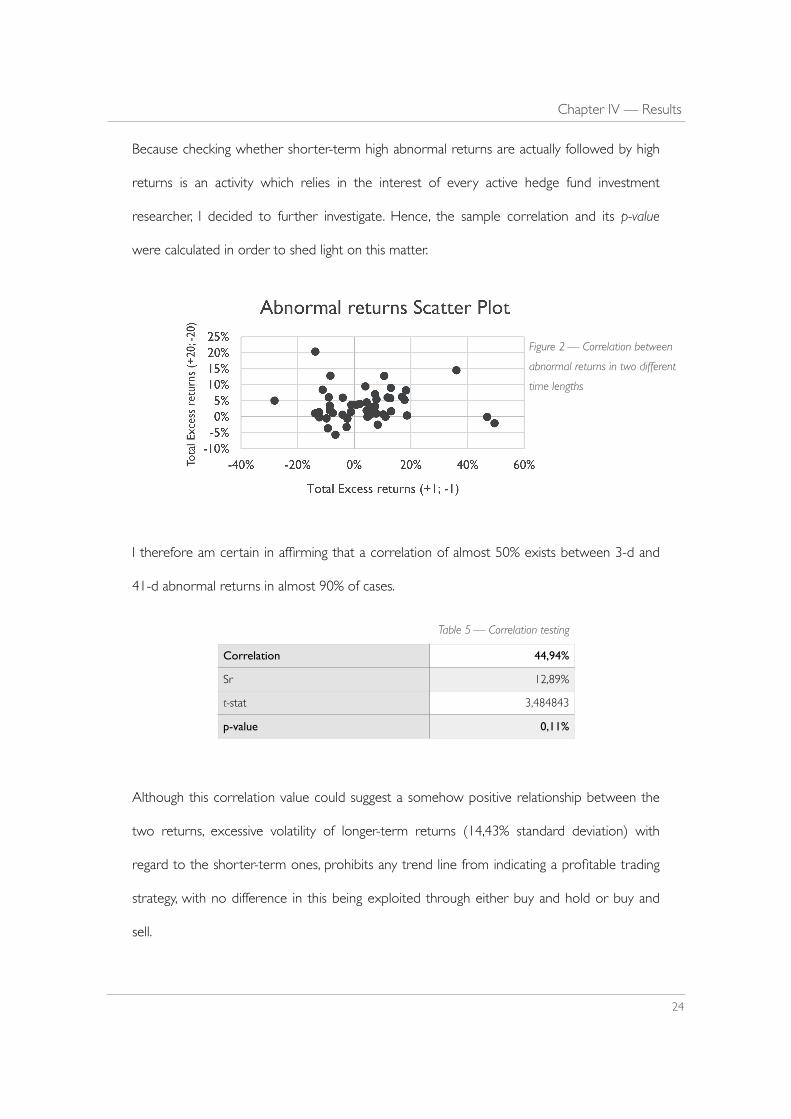
Because checking whether shorter-term high abnormal returns are actually followed by high
returns is an activity which relies in the interest of every active hedge fund investment
researcher, I decided to further investigate. Hence, the sample correlation and its p-value
were calculated in order to shed light on this matter.
I therefore am certain in affirming that a correlation of almost 50% exists between 3-d and
41-d abnormal returns in almost 90% of cases.
Although this correlation value could suggest a somehow positive relationship between the
two returns, excessive volatility of longer-term returns (14,43% standard deviation) with
regard to the shorter-term ones, prohibits any trend line from indicating a profitable trading
strategy, with no difference in this being exploited through either buy and hold or buy and
sell.
24
Figure 2 — Correlation between
abnormal returns in two different
time lengths
Correlation 44,94%
Sr 12,89%
t-stat 3,484843
p-value 0,11%
Table 5 — Correlation testing
Chapter IV — Results
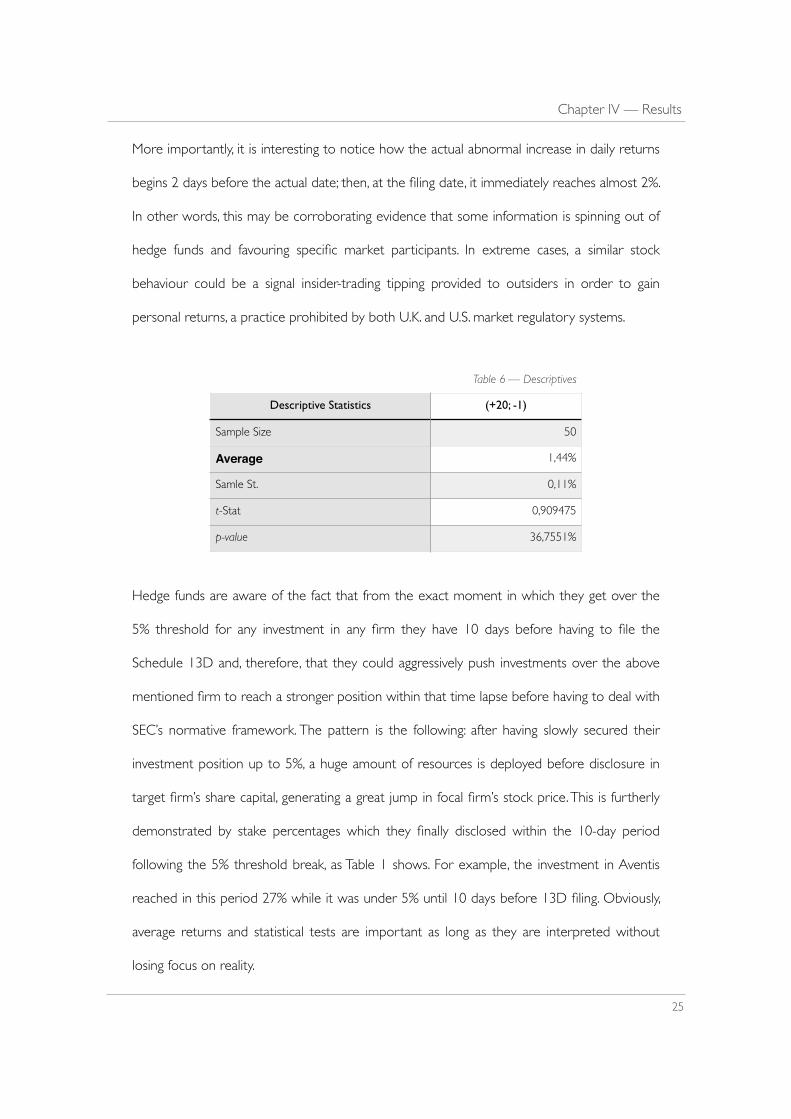
More importantly, it is interesting to notice how the actual abnormal increase in daily returns
begins 2 days before the actual date; then, at the filing date, it immediately reaches almost 2%.
In other words, this may be corroborating evidence that some information is spinning out of
hedge funds and favouring specific market participants. In extreme cases, a similar stock
behaviour could be a signal insider-trading tipping provided to outsiders in order to gain
personal returns, a practice prohibited by both U.K. and U.S. market regulatory systems.
Hedge funds are aware of the fact that from the exact moment in which they get over the
5% threshold for any investment in any firm they have 10 days before having to file the
Schedule 13D and, therefore, that they could aggressively push investments over the above
mentioned firm to reach a stronger position within that time lapse before having to deal with
SEC’s normative framework. The pattern is the following: after having slowly secured their
investment position up to 5%, a huge amount of resources is deployed before disclosure in
target firm’s share capital, generating a great jump in focal firm’s stock price. This is furtherly
demonstrated by stake percentages which they finally disclosed within the 10-day period
following the 5% threshold break, as Table 1 shows. For example, the investment in Aventis
reached in this period 27% while it was under 5% until 10 days before 13D filing. Obviously,
average returns and statistical tests are important as long as they are interpreted without
losing focus on reality.
25
Chapter IV — Results
Table 6 — Descriptives
Descriptive Statistics (+20; -1)
Sample Size 50
Average 1,44%
Samle St. 0,11%
t-Stat 0,909475
p-value 36,7551%

As already anticipated, the range of longer-term returns is wider than that of the
shorter-term ones. Obviously, during a defined period around the 13-D filing announcement
date prices tend to fluctuate more as more information gets spread, while buys and sells at a
microstructure level take place. Also, copying every hedge fund investment by buying into
target stocks when a 13D filing takes place is not necessarily a win-win situation, because
40% of abnormal returns over the 41-d period and 20% over the 3-d period end up being
negative. This strategy could only work at a widely-diversified porfolio level to spread the risk
of negative returns over a widen base .18
ii. Strategy Returns
As I approached the last part of this statistical analysis, I had to recognize that the available
sample sizes for different hedge fund stated strategies were actually quite small, even though
literature is available about the properties of the t-test as a function of sample size, effect 19
Hasanhodzic, Jasmina, and Lo, “Can hedge fund returns be replicated? The linear case”, Journal of Investment Management, Q2 2007 18
R. Clifford Blair James J. Higgins, “A Comparison of the Power of Wilcoxon's Rank-Sum Statistic to that of Student'st Statistic Under Various 19
Nonnormal Distributions”, Journal of educational and behavioural statistics, December 21, 1980 vol. 5 no. 4 309-335; Joost C. F. de Winter and D. Dodou, “Five-Point Likert Items: t test versus Mann-Whitney-Wilcoxon”, Practical Assessment, Research & Evaluation, Vol 15, No 11
26
Chapter IV — Results
Descriptives (-20; +20) (-1; +1)
Min 50 50
Q1 3,97% 3,5%
Median 14,43% 4,86%
Q3 1,09 5,09
Max 5,72% 0%
Table 7 — Descriptive statistics
Counts (-20; +20) (-1; +1)
> 0 30 40
< 0 20 10
size, and population distribution. In addition, sample variances of different strategies’ returns
obviously differ among strategies themselves, which adds complexity to Student’s t-test with
regard to comparison of means. All in all, however, it has been empirically shown in different
research papers that, with sample sizes close of circa15 elements and even if populations of 20
returns are not normally distributed, a strong t-test can be performed without risking type 1
errors, i.e. rejecting the null hypothesis when it is true. Actually, solid t-test can be performed
even with sample size smaller than five, but it must be assumed that there would be a huge
effect size bias in the population. Falsely accepting a wrong null hypothesis may be the only
risk, even if the low statistical power of tests is present also for better structured samples and
does not pose problems as long as one recognizes the limits of a model's inferences . 21
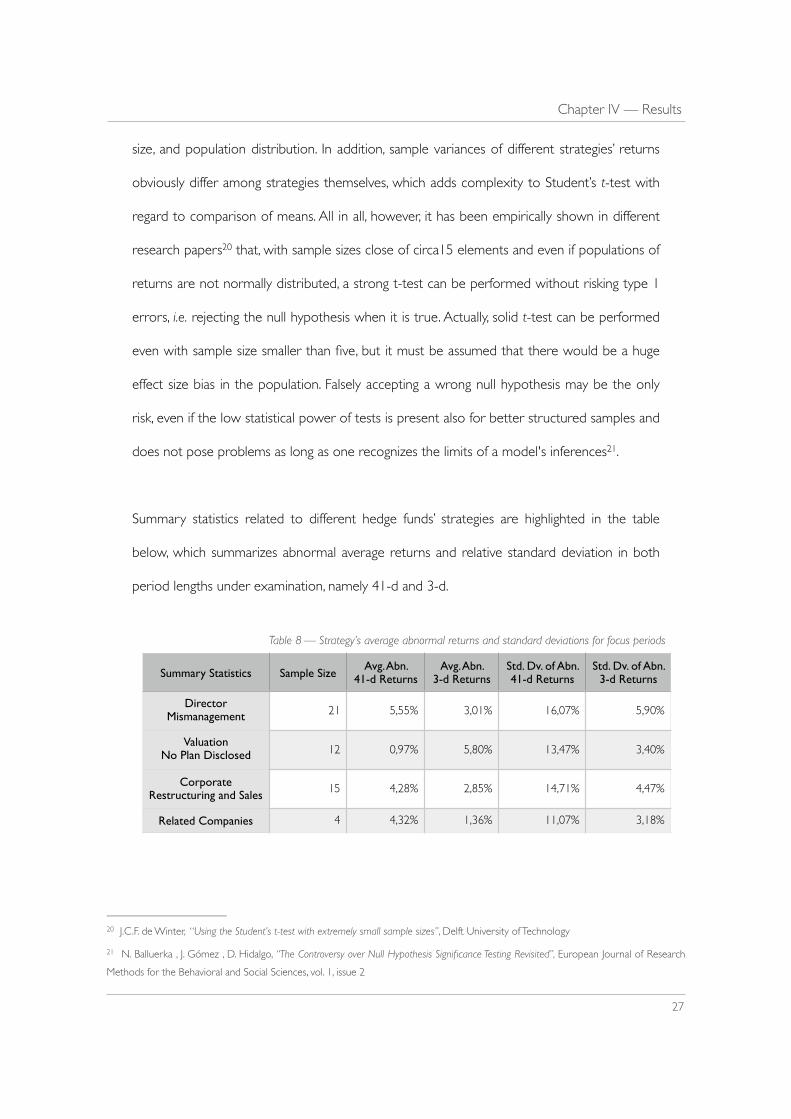
Summary statistics related to different hedge funds’ strategies are highlighted in the table
below, which summarizes abnormal average returns and relative standard deviation in both
period lengths under examination, namely 41-d and 3-d.
J.C.F. de Winter, “Using the Student’s t-test with extremely small sample sizes”, Delft University of Technology20
N. Balluerka , J. Gómez , D. Hidalgo, “The Controversy over Null Hypothesis Significance Testing Revisited”, European Journal of Research 21
Methods for the Behavioral and Social Sciences, vol. 1, issue 2
27
Summary Statistics Sample SizeAvg. Abn.
41-d ReturnsAvg. Abn.
3-d ReturnsStd. Dv. of Abn. 41-d Returns
Std. Dv. of Abn. 3-d Returns
Director Mismanagement 21 5,55% 3,01% 16,07% 5,90%
Valuation No Plan Disclosed 12 0,97% 5,80% 13,47% 3,40%
Corporate Restructuring and Sales 15 4,28% 2,85% 14,71% 4,47%
Related Companies 4 4,32% 1,36% 11,07% 3,18%
Table 8 — Strategy’s average abnormal returns and standard deviations for focus periods
Chapter IV — Results

Quickly scanning the results, it is impressive to notice how much valuation-motivated
investments underperform all the others in the longer-term while over performing by at least
2,80% in the narrower event window. To an expert eye, this fact should not be surprising at
all: according to recent data gathered by John Authers of The Financial Times, current
valuations tell us nothing about the chance of a correction in the short term, as they are only
useful for long-term investors who can adjust their positions immediately after a SEC filing
and then holding on to their best idea stocks with little regards to short term fluctuations . 22
In other words, I put forth the hypothesis that, while value investing focuses on long-term
trends, informed investors shift their holdings immediately towards companies seen as
supposedly undervalued by hedge funds, which pushes prices to jump immediately after a
filing, and then manage their asset allocation independently of following short-term
fluctuations. As a consequence, the 41-d abnormal returns take lower valus with regard to
comparables. There are however doubts around the potential benefits to the target company
that I will address later.
John Authers, “Stock valuations are no help in timing trades”, FT, 29/4/201522
28
Director Mismanagement
ValuationNo Plan Disclosed
Corporate Restructuring and Sales
Related Companies
Director Mismanagement X 0,87411237 0,24517228 0,18869528
Valuation No Plan Disclosed 1,72169973 X 0,60885397 0,49400814
Corporate Restructuring and Sales 0,09015914 1,943203281 X 0,49400814
Related Companies 0,80331536 2,37008346 0,75734913 X
Table 9 — t-stats for differences in mean abnormal returns between strategies
(-20 ; +20)(-1 ; +1)
Chapter IV — Results

Moving on to statistically testing the said results for divergence in means of strategy returns,
table 9 shows consistent results with the pattern I just analyzed, i.e. that value Iìinvesting beats
all other investment strategy over 3-day period under an abnormal return perspective both
with 5% and 10% confidence levels. Contrary to what expected though, there is no statistical
difference between abnormal returns over the longer period studied. This happens because
of the high standard deviation of each sample when compared to the sample sizes. A
hypothesis test of differences in abnormal returns’ means has been conducted by firstly
calculating the standard error of the sampling distribution and by secondly
calculating the t-scores which are checked against critical values and highlighted
in red whenever they are above the latter.
As expected, there is no difference among different strategy returns over the longer period
considered, a conclusion that seems to suggest that performance is based, indeed quite
logically, on the ability to organise and implement each fund’s declared strategy and not
dependent on any a priori approach to investing. These results are partially consistent with
other research papers using bigger pre-crisis samples , where the discrepancy of results is 23
found only about which strategy is the most successful under an abnormal return
perspective, while they expose the same results in finding that those hedge funds that target
a change in corporate structure actually obtain positive abnormal returns not statistically
different from zero.
Alon Brav, Wei Jiang, Frank Partnoy, and Randall Thomas, op. cit.23
29
Chapter IV — Results

iii. Cash Flows
For what concerns cash flows, I began investigating to what extent abnormal returns and
changes in cash flows were correlated. I gathered target companies’ cash flow values from
DataStream, collecting data from both 2013 and 2014. I then computed their correlation
factor against target abnormal returns in order to understand whether hedge funds that
promise substantial change in focal firms are actually capable of doing so and, consequently,
boost the ultimate driver of a company’s value. Results are shown in the table below:
As already found in other research papers no statistically significant correlation was found 24
with respect to all major categories of cash flows taken into accout, respectively operating,
financing and investing cash flows. The analysis summarized in the previous table ideed
exposes unsatisfactory p-values for their relative t-statistics. Such high p-values demonstrate
that variations in cash flows are actually not correlated to abnormal returns for hedge funds;
nevertheless, it is important to note the fact that, among the others, the significance of the
Operations’ t-stat for the 41-d time lapse is the only one that exposes a low-moderate
statistical significance. On the contrary, levels of average changes cash flows are consistent
Klein, Zur, op. cit. 24
30
Cash Flows
Operations Investing Financing
T.E.R. t-stat p-value T.E.R. t-stat p-value T.E.R. t-stat p-value
(-20 ; +20) 22.73% 1,46 15% 3.82% 0,24 81% -6.00% 0,38 71%
(-1 ; +1) -14.70% 0,93 36% 9.84% 0,62 54% -19.14% 1,22 23%
Table 10 — Correlation between abnormal returns and changes in cash flows
Chapter IV — Results

with previous researches . Nevertheless, the absolute values of these changes may be biased 25
in the direction of an exagerration due the small sample size, as shown in the table below:
It can be seen that, on average, hedge funds tend to more than double cash flows from
investments or, in other words, to decrease capital expenditures and R&D expenses in target
companies. If one also takes into account the reduced operating cash flows, the big picture
does not look rosy: even if it is generally acknowledged that the main objective for active
hedge funds is to improve results achieved by the focal firm (would you put your money into
something if not to gain from its appreciation?), the outcome of my analysis highlights a
different situation. It seems that not only in the short term hedge funds actually worsen the
operating situation in the focal firm, but that they also got the tendency to decrease its
potential in order to exploit a better positioning in the future.
By means of the efficient market hypothesis, the immediate shift in prices should reflect the
shift in expectations on the focal firm’s future. Changes in cash flows in the hedge funds’
engagement year can be seen as a proxy for these changes; furthermore, cash flows can be
seen as the actual driver of value for a firm. Hence, I chose not to run a regression, rather a
simple correlation, because I do not want to imply any kind of causal relationship in my
analysis, rather a merely logical one.
Brav, Jiang, Partnoy and Thomas op.cit., 200825
31
Average Change2014 — 2015
Cash Flows
Operations Investing Financing
-22,79% 115,90% -13,66%
Table 11: Percentage change in CF measures 2014-2015
Chapter IV — Results

Initially I wanted to compare CARs with HPRs, with regard to the achievement (or failure to
achieve) the stated ojectives; unfortunately, I did not manage to accomplish this due to lack of
data. Nevertheless, I ended up finding that what I was expecting was actually not true: higher
CARs are not correlated to increases in cash flows. As a consequence of this find, I decided
to compare the average change in cash flows (that I computed through my data set) with
others from other paers di altri paper, finding that these latter being consistent the former.
Finally I can affirm that an increase in investment cash flows, along with a decrease in
operation cash flows, actually pinpoint a worsening of the firm’s future positioning.
As a final remark, it’s mandatory to highlight that the selected sample, ableit being perfectly
structured to sustain an effective retrospective analysis, it’s not flawless. As a consequence, it
could lead to minor bias for what concerns the inference conducted immediately thereafter,
exposing thus a slightly depressed statistical power.
Furthermore, despite conclusions drawn above, when we talk about corporate restructuring
and investment evaluation, we have to take into account some elements that could possibly
help us in finding what actually defines this bias. There’s indeed the possibility that an activist
finds himself / herself re-evaluating an investment that had been taken out by the company
previously for reasons aside from it exposing a positive Net Present Value. This means that
these past CAPEX could actually have been fostered by, to name a few, sociopolitical reasons
or excessive growth targets that depress a company outlook. By a mere realignment of the
focal firm towards its core businesses and the elimination of past-decisions negative NPV
expenditures, an activist may trigger the arising of positive cash flows from investments in the
32
Chapter IV — Results

short term. The focal company should benefit from this refocus toward its core
competencies and achieve an improved overall cash flow and stock price in the long run.
To sum thing up, positive, short-term improvements in investing cash flows do not necessarily
mean short-terminism and value destruction, contrarily to the conclusion I drew in the
paragraphs above, as shown in recent literature .26
L. A. Bebchuck, A. Brav, W. Jiang, "The Long-Term Effects of Hedge Fund Activism", Harvard Law School John Paper 802, 201526
33
Chapter IV — Results

Chapter V — ConclusionsIn this section, I will collect all evidences gathered from this analysis in order to show that
hedge funds consistently profit from their activism, albeit the detriment of target firm’s
current and future prospects.
Hedge funds’ abnormal returns around announcement day suggest that activism is indeed a
profitable investment strategy for the hedge fund industry. The large positive price impact
around Schedule 13D filings on target companies’ stocks is consistent with the assumption 27
that markets immediately discount back to present every actual future value improvement.
However, some questions cast shadow on these findings. It is worrying that 40% and 20% of
the target firms with regard to, respectively, 41-d and 3-d periods, end up with negative
abnormal returns, as is consistently shown in other studies . In this matter, diversification 28
happen to be the discriminant variable: hedge funds have the luxury of diversifying their
portfolios across several firms and, consequently, will not care whether any specific
investment goes under water. On the contrary, target companies are non-diversified by
nature, causing extremely aggressive turn-around plans brought about by hedge funds to be
rightly discarded and labelled as excessively risky for the firm’s current stakeholders.
Nevertheless, there are other explanations that could address the causes of positive
abnormal results as found in this research paper. More specifically, these results could derive
Figure 1 — Table 427
Christopher P. Clifford, “Value Creation or Value Destruction? Hedge Funds as Shareholder Activists”, 14 J. Corp. Fin. 323 (2008)28
34
Chapter V — Conclusions

from either market overshootings and temporary price impacts or from stock picking
abilities . It is indeed reasonably possible that markets address too far into the future the 29
potential benefits of activists’ commitments, making prices jump on announcements and
hedge funds cash in from no actual abilities but timing. However, this is ruled out by the
actual data as long term abnormal returns are similar to shorter ones as confirmed by
correlation analysis . It should be impossible that an hedge fund dumped its shares 30
immediately after any capital gain, as hedge funds’ average investment horizon is close to one
year. This way I reject the hypothesis that funds’ activity consists in the mere exploitation of
positive price shocks, after having caused them by spreading informations into the market.
If the alternative hypothesis is rejected and it is stated state that those returns come from
actual ability, it is then mandatory to acknowledge what this ability consists of. In other words,
if it is the activism itself that drives changes in prices, we ought to notice some changes in real
variables that will ultimately affect cash flows should be noticed.
The average target company sees its investing cash flows increase while its financing and
operational cash flows decrease during the year in which a hedge fund approaches it . 31
Besides defendants of hedge funds, this is a clear picture showing that, at least in that
particular year, target companies put themselves in a difficult competitive position, with fewer
investments and a deteriorated operating business . 32
Alon Brav, Wei Jiang, Frank Partnoy, and Randall Thomas, op. cit.29
Table 5 — Figure 230
Table 1031
Nicole M. Boyson and Robert Mooradian, “Corporate Governance and Hedge Fund Activism”, Rev. Deriv. Res., vol. 14, 169 32
(2011); Y. Hamao, K. Kutsuna, and P. Matos, “Investor Activism in Japan: The First 10 Years”, Working Paper, Columbia Business School (2010) (cash); Clifford op.cit. (leverage). Klein and Zur; See Klein and Zur op. cit. (dividends)
35
Chapter V — Conclusions

As cited above, other papers showed that abnormal returns are not statistically correlated 33
with changes in real variables.
In this framework, it is noteworthy that only companies’ shares bought for their supposedly
undervaluation achieve a stronger jump in price in the 3-day period around schedule 13D
filings, while no difference actually exists afterwards . A comparable company analysis is 34
implied in this case: markets seem to actually appreciate news found by hedge funds only in
the case that target firms’ share price is lower than comparable competitors’, disregard
long-term value creation (as should be suggested by improvements in DCF analysis).
Finally, while the outcome is not so clear for shareholders of companies targeted by hedge
funds (as contrasting evidences on all major aspects exposed throughout this thesis), it looks
bright and shining for hedge funds carrying on activist behaviours, as they benefit from
abnormal returns in first instance, gathering positive cash flows from then on and, finally,
exiting the investment without a shot being fired.
Stuart Gillian and L. Starks, “Corporate Governance Proposals and Shareholder Activism: The Role of Institutional Investors”, 57 J. Fin. Eco. 33
275 (2000); M. Becht, J. Franks, C. Mayer and S. Rossi, “Returns to Shareholder Activism: Evidence form a Clinical Study of the Hermes U.K.
Focus Fund”, 22 Rev. Fin. Stud. 3093 (2009); Nicole M. Boyson and Robert Mooradian, “Corporate Governance and Hedge Fund Activism”, 14 Rev. Deriv. Res. 169 (2011)
Table 934
36
Chapter V — Conclusions

Bibliographyi. Books
- David P. Stowell, “Investment banks, hedge funds, and private equity”, Second edition, Elsevier Academic Press
- P. Newbold, W.L.Carlson, B. Thorne (2010), Statistics, Pearson - Prentice Hall
ii. Scientific Journals
- Staff report to U.S. Securities and Exchange Commission, 2003, “Implications of growth of hedge funds”
- Froud, Nilsson, Moran, and Williams, “Stories and interests in finance: agendas of governance before and after the financial crisis”, Volume
25, Issue 1, pages 35–59, January 2012
- Michael C. Jensen, “Agency Costs of Free Cash Flow, Corporate Finance and Takeovers”, 76. Amer. Eco. Rev., Vol. 76, No. 2, papers and
proceedings of the nighty-eight annual meeting of the American Economic Association (May, 1986) pp. 323-329
- Brian Bushee, “Do Institutional Investors Prefer Near-Term Earnings Over Long Run Value?”, 18 Contemp. Acct. Res., Volume 18, Issue
2, pages 207–246, Summer 2001
- Katherine Guthrie and Jan Sokolowsky, “Large Shareholders and the Pressure to Manage Earnings”, 16 J. Corp. Fin. Volume 16, Issue 3,
June 2010, Pages 302–319
- R. Greenwood and M. Schoar, “Investor Activism and Takeovers”, 92 J. Fin. Eco. 362 (2009)
- M. Becht, J. Franks, C. Mayer, S. Rossi, “Returns to Shareholder Activism: Evidence form a Clinical Study of the Hermes U.K. Focus Fund”, 22
Rev. Fin. Stud. 3093 (2009)
- Sandro C. Andrade Vidhi Chhaochharia, Michael E. Fuerst, “'Sell in May and Go Away' Just Won't Go Away”, Financial Analysts Journal
- Alon Brav, Wei Jiang, Frank Partnoy, and Randall Thomas, “Hedge Fund Activism, Corporate Governance, and Firm Performance”, The
journal of finance , vol. 63, no. 4, august 2008, pp. 1729 – 1775
- E. Zur, “The activists investors — Investment opportunities, free cash flow, and overinvestment”, SSRN Electronic Journal, Jul. 2007
- Hasanhodzic, Jasmina, and Lo, “Can hedge fund returns be replicated? The linear case”, Journal of Investment Management, 2007
- J.C.F. de Winter, “Using the Student’s t-test with extremely small sample sizes”, Practical Assessment, Research & Evaluation, Vol 18, No
10, August 2013, Delft University of Technology
- Christopher P. Clifford, “Value Creation or Value Destruction? Hedge Funds as Shareholder Activists”, J. Corp. Fin. Volume 14, Issue 4,
September 2008, Pages 323–336
- Stuart Gillian and L. Starks, “Corporate Governance Proposals and Shareholder Activism: The Role of Institutional Investors”, J. Fin. Eco.
Volume 57, Issue 2, August 2000, Pages 275–305
- M. Becht, J. Franks, C. Mayer and S. Rossi, “Returns to Shareholder Activism: Evidence form a Clinical Study of the Hermes U.K Focus Fund”,
Rev. Financ. Stud. (2010), 23 (3):3093-3129.
Bibliography

- Nicole M. Boyson and Robert Mooradian, “Corporate Governance and Hedge Fund Activism”, Rev. Deriv. Res. July 2011, Volume
14, Issue 2, pp 169-204
- R. Clifford Blair James J. Higgins, “A Comparison of the Power of Wilcoxon's Rank-Sum Statistic to that of Student'st Statistic Under Various
Nonnormal Distributions”, Journal of educational and behavioural statistics, December 21, 1980 vol. 5 no. 4 309-335
- Joost C. F. de Winter and D. Dodou, “Five-Point Likert Items: t test versus Mann-Whitney-Wilcoxon”, Practical Assessment, Research &
Evaluation, Vol 15, No 11
- N. Balluerka , J. Gómez , D. Hidalgo, “The Controversy over Null Hypothesis Significance Testing Revisited”, European Journal of Research
Methods for the Behavioral and Social Sciences, vol. 1, issue 2
iii. Working papers
- John C. Coffee Jr., “The impact of hedge fund activism: evidence and implications”, Law Working Paper N° 266/2014, September 2014,
Columbia University and ECGI, Darius Palia, Rutgers Business School
- Klein, Zur, “Hedge fund activism”, NYU Working Paper, CLB-06-017
- L. A. Bebchuck, A. Brav, W. Jiang, "The Long-Term Effects of Hedge Fund Activism", Harvard Law School John Paper 802, 2015 Columbia
Law Review, Vol. 115, June 2015, Forthcoming; Columbia Business School Research Paper No. 13-66; Harvard Law School John M.
Olin Center Discussion Paper No. 802
- Y. Hamao, K. Kutsuna, and P. Matos, “Investor Activism in Japan: The First 10 Years”, Working Paper, Columbia Business School (2010)
Bibliography

Webliographysec.com
- http://www.sec.gov/edgar.shtml
- www.sec.gov/Archives/edgar/data/764065/000090266414000408/p14-0281sc13d.htm
- www.sec.gov/Archives/edgar/data/1065088/000119312514090232/d661450dprec14a.htm
- www.sec.gov/Archives/edgar/data/105076/000095014214000181/eh1400189_13d-wausau.htm
homestreet.com
- ir.homestreet.com/file.aspx?IID=103809&FID=28066334
vitocost.com
- www.vitacost.com/investor-relations
allergan.com
- www.allergan.com/investors/index.htm
civeo.com
- i r . c i v e o . c o m / s e c . c f m ? D o c Ty p e = & D o c Ty p e E x c l u d e = & S o r t O r d e r = F i l i n g D a t e
%20Descending&Year=&PageNum=9&FormatFilter=&CIK=&NumberPerPage=10
homestreet.com
- www.streetinsider.com/SEC+Filings/Form+SC+13DA+SIGNET+JEWELERS+LTD+Filed+by%3A+Corvex
+Management+LP/10407309.html
ft.com
- http://www.ft.com/intl/cms/s/0/dee64c62-ee75-11e4-88e3-00144feab7de.html
Webliography