leveraging air quality observing systems in the united...
TRANSCRIPT

Leveraging Air Quality Observing Systems in the United States: An Approach to Addressing Operational Gaps and Earth System Science Challenges Related to
Atmospheric Composition and Dynamics
Jim Szykman, U.S. EPA+ others Lukas Valin, Rohit Mathur, Russell Long, Kevin Cavender ‐ U.S. EPA
Jim Crawford, Barry Lefer, Bob Swap ‐ NASA Kelly Chance ‐ Smithsonian Astrophysical Observatory
Ruben Delgado ‐ UMBCWORKSHOP ON THE FUTURE OF ATMOSPHERIC BOUNDARY LAYER OBSERVATIONS
October 24‐26, 2017Airlie House
Warrenton, VA
Theme 2: Emerging Technology for ObservationsPanel 2.3: Leveraging existing networks and mobile devices – ARM, NEON, smartphones, cars, planes, etc.

Aggregate map of the majority of routine U.S. monitoring stations, illustrating relatively broad coverage across the continental United States.
Note spatial gaps in sparsely populated areas.
Ambient Air Monitoring Stations in the US
• Network intended to determine state/tribe compliance with health and secondary (e.g., visibility) standards
• Addressing the most intractable pollution issues demands better integration of network with rigorous scientific standards.
• Working with bridging state AQ management staff with EPA and NASA research team on one segment of network, PAMS, hopefully providing roadmap for further collaboration of federal agencies on other state networks

EPA Photochemical Assessment Monitoring Station (PAMS) Network
PAMS Network established as a result of 1990 Clean Air Act Amendments (CAAA) to better understand high‐O3 locations.
The 2015 revision of the O3 National Ambient Air Quality Standard from 75 ppb to 70 ppb includes changes that will result in:
• A Broader and less dense network, merged with NCORE network with a large set of required measurements.
• A requirement for states to propose additional Enhanced Monitoring Plans, to better understand the local O3 problem.
PAMS merged with NCORE
NO, NO2, hourly VOC (or high‐sensitivity HCHO), NOy, O3 (year round). SO2, ppb‐precision CO, PM2.5mass and speciation (At least 1‐in‐3 day), PM2.5continuous, PM10‐2.5 mass, basic met. parameters, mixed layer height (via ceilometers/lidar/profilers)
Ground Based‐Spectrometers column NO2, HCHO, O3, and SO2 via collaboration with NASA
PAMS Network Present (blue‐green circles) Future 2019 (green)

Leveraging Large and Small Research Efforts to inform Boundary Layer Measurements with EPA Networks
4Denver, CO Observation Strategy July-August 2014
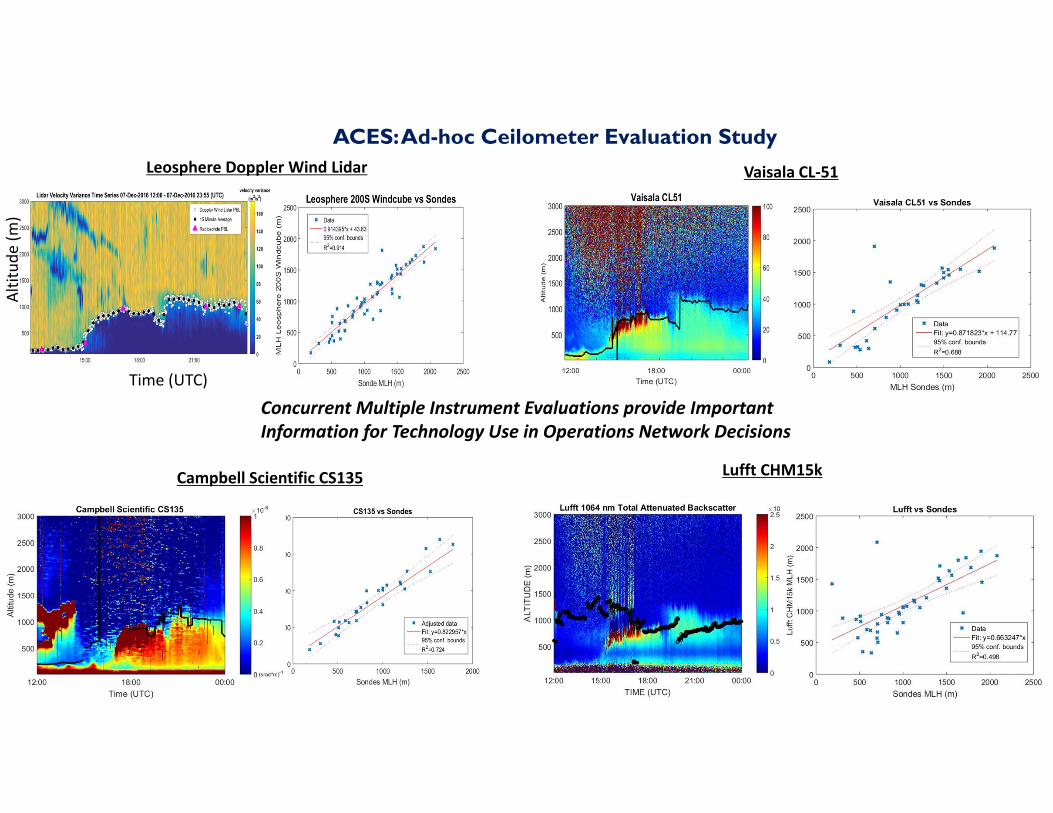
ACES: Ad-hoc Ceilometer Evaluation Study
• Nov. 15-Dec. 16, 2016 @ UMBC (Catonsville, MD) : EPA/NWS/UMBC Measurements to help guide EPA PAMS program implementation for new hourly MLH requirement and supplement current efforts under NWS ceilometer test bed.
• Test ceilometer performance in low aerosol loading environment
• Focused on mixing layer height determination during morning and evening transition periods:
• MLH using available vendor software
• MLH using a common algorithm
DISCOVER-AQ: Deriving Information on Surface Conditions from Column and Vertically Resolved Observations Relevant to Air Quality
• Multi-year mission: Overall Goal - How can ambient air quality be reliably informed using non-traditional approaches, such as satellite remote sensing?
• EPA research used to inform:
• Evaluation of emerging measurements technology (in-situ, small sensors, and remote sensing) for use in AQ Networks
• Evaluation and improvements for Community Multiscale Air Quality (CMAQ) fine-scale modeling
Time (UTC)
Altitud
e (m
)
Leosphere Doppler Wind Lidar
Campbell Scientific CS135 Lufft CHM15k
Vaisala CL‐51
Concurrent Multiple Instrument Evaluations provide Important Information for Technology Use in Operations Network Decisions
ACES: Ad-hoc Ceilometer Evaluation Study
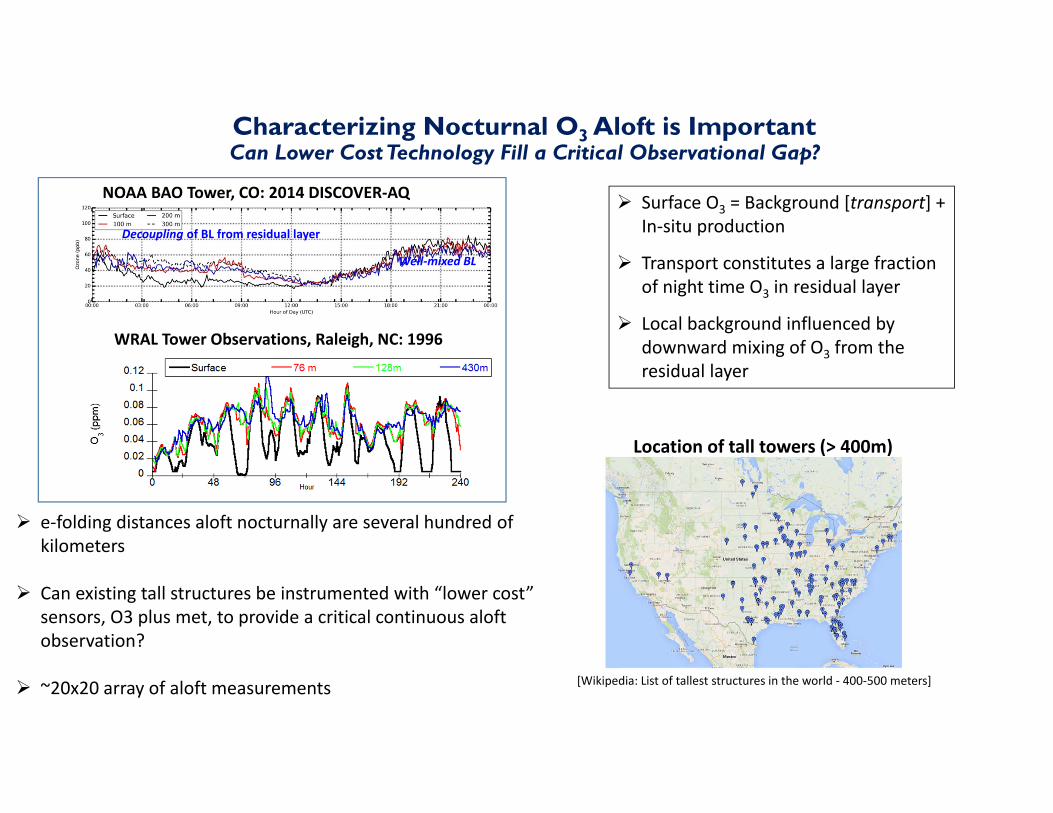
Characterizing Nocturnal O3 Aloft is ImportantCan Lower Cost Technology Fill a Critical Observational Gap?
WRAL Tower Observations, Raleigh, NC: 1996
NOAA BAO Tower, CO: 2014 DISCOVER‐AQ
Decoupling of BL from residual layer
Well‐mixed BL
Surface O3 = Background [transport] + In‐situ production
Transport constitutes a large fraction of night time O3 in residual layer
Local background influenced by downward mixing of O3 from the residual layer
Location of tall towers (> 400m)
[Wikipedia: List of tallest structures in the world ‐ 400‐500 meters]
e‐folding distances aloft nocturnally are several hundred of kilometers
Can existing tall structures be instrumented with “lower cost” sensors, O3 plus met, to provide a critical continuous aloft observation?
~20x20 array of aloft measurements

System developed at NASA Goddard
Extensive Use/Testing During DISCOVER‐AQ
Solar source spectrometer (280 ‐ 525 nm: 0.6 nm resolution) – column NO2, O3, HCH2O, and SO2 every 80 second.
2 main parts to instrument – (1) sensor head and (2) spectrometer, TE cooler, electronics, computer contained with environmental housing case 23”x16”x39” or 8” rack mounted enclosure.
Can operate in DS‐, ZS‐ and MAX‐DOAS modes and potentially provide information on vertical profiles.
EPA and NASA are exploring deployment of Pandoras at PAMS as research instrument to provide improved characteriztion of emissions and serve as a U.S. ground‐based satelltie validation network
Pandora Ground-Based Spectrometer
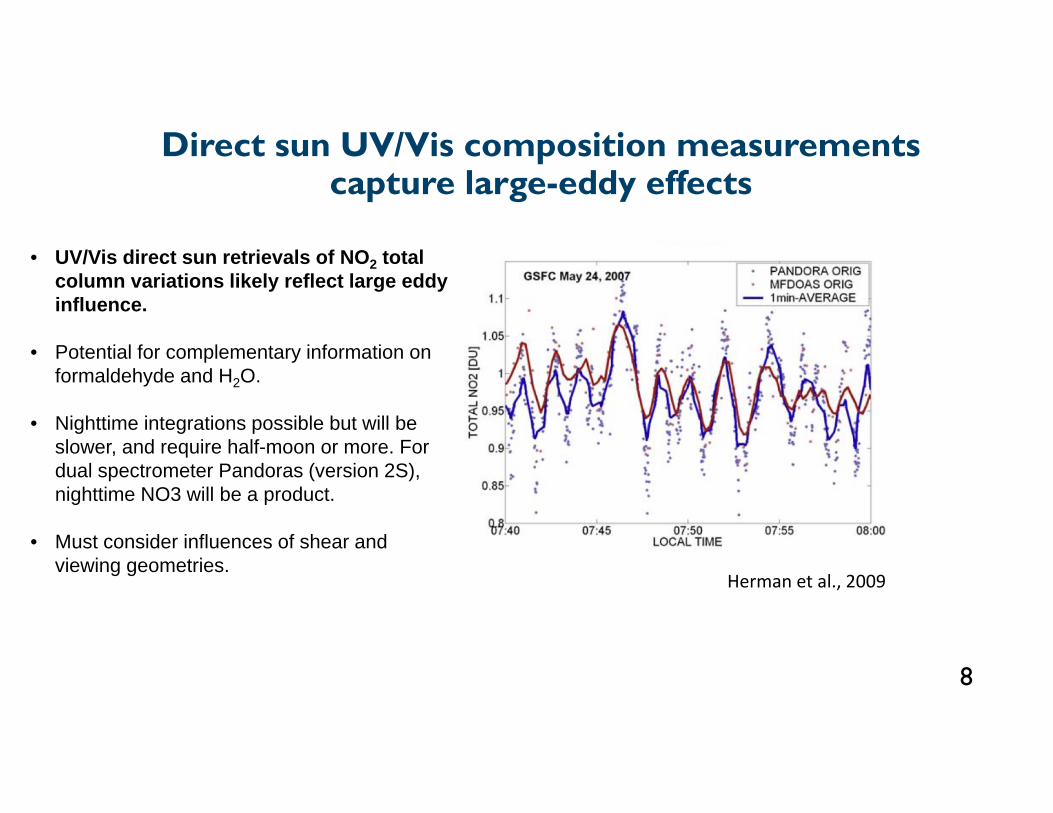
Direct sun UV/Vis composition measurements capture large-eddy effects
8
Herman et al., 2009
• UV/Vis direct sun retrievals of NO2 total column variations likely reflect large eddy influence.
• Potential for complementary information on formaldehyde and H2O.
• Nighttime integrations possible but will be slower, and require half-moon or more. For dual spectrometer Pandoras (version 2S), nighttime NO3 will be a product.
• Must consider influences of shear and viewing geometries.

Combining surface and column NO2 measurements reflects mixing depth
9
Before 11 AM1 ppb : 1e15 cm‐2
‐> Assume well mixed PBL:Height ≈ 0.5 km
After 1130 AM ~1 ppb : 3e15 cm‐2
‐> Assume well mixed PBLHeight ≈ 1.5 km
BAO Tower CL51
The observed relationship of NO2 column (molecule cm‐2) divided by surface concentration (molecule cm‐3) places a constraint on boundary layer dynamics ( units of cm )
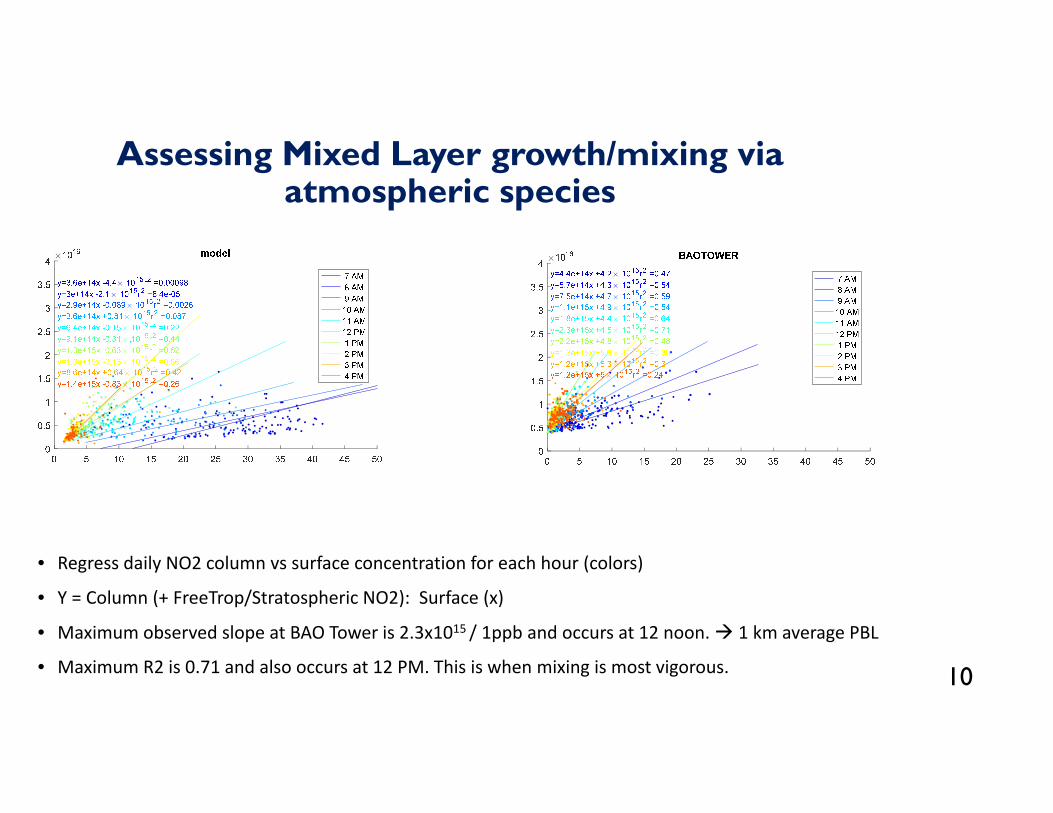
Assessing Mixed Layer growth/mixing via atmospheric species
10
• Regress daily NO2 column vs surface concentration for each hour (colors)
• Y = Column (+ FreeTrop/Stratospheric NO2): Surface (x)
• Maximum observed slope at BAO Tower is 2.3x10¹⁵ / 1ppb and occurs at 12 noon. 1 km average PBL
• Maximum R2 is 0.71 and also occurs at 12 PM. This is when mixing is most vigorous.
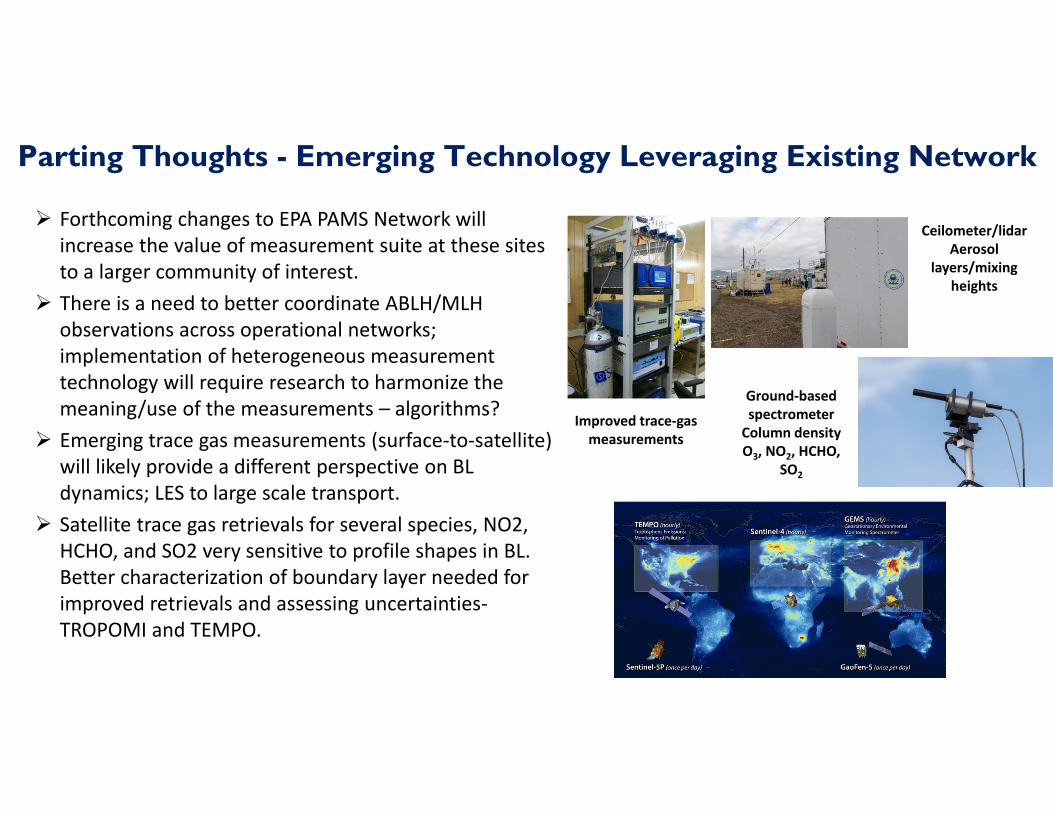
Forthcoming changes to EPA PAMS Network will increase the value of measurement suite at these sites to a larger community of interest.
There is a need to better coordinate ABLH/MLH observations across operational networks; implementation of heterogeneous measurement technology will require research to harmonize the meaning/use of the measurements – algorithms?
Emerging trace gas measurements (surface‐to‐satellite) will likely provide a different perspective on BL dynamics; LES to large scale transport.
Satellite trace gas retrievals for several species, NO2, HCHO, and SO2 very sensitive to profile shapes in BL. Better characterization of boundary layer needed for improved retrievals and assessing uncertainties‐TROPOMI and TEMPO.
Ceilometer/lidar Aerosol
layers/mixing heights
Ground‐based spectrometer Column density O3, NO2, HCHO,
SO2
Improved trace‐gas measurements
Parting Thoughts - Emerging Technology Leveraging Existing Network