leveraging a compound graph based dht for multi-attribute...
TRANSCRIPT

Leveraging a Compound Graph based DHT forMulti-Attribute Range Queries with Performance
AnalysisHaiying Shen, * Member, IEEE, Cheng-Zhong Xu, Member, Senior IEEE
F
Abstract—Resource discovery is critical to the usability and acces-sibility of grid computing systems. Distributed Hash Table (DHT) hasbeen applied to grid systems as a distributed mechanism for providingscalable range-query and multi-attribute resource discovery. Multi-DHT-based approaches depend on multiple DHT networks with each networkresponsible for a single attribute. Single-DHT-based approaches keepthe resource information of all attributes in a single node. Both classesof approaches lead to high overhead. In this paper, we propose a Low-Overhead Range-query Multi-attribute DHT-based resource discoveryapproach (LORM). Unlike other DHT-based approaches, LORM relieson a single compound graph based DHT network and distributesresource information among nodes in balance by taking advantageof the compound graph structure. Moreover, it has high capability tohandle the large-scale and dynamic characteristics of resources in grids.Experimental results demonstrate the efficiency of LORM in comparisonwith other resource discovery approaches. LORM dramatically reducesmaintenance and resource discovery overhead. In addition, it yieldssignificant improvements in resource location efficiency. We also ana-lyze the performance of the LORM approach rigorously by comparingit with other multi-DHT-based and single-DHT-based approaches withrespect to their overhead and efficiency. The analytical results areconsistent with experimental results, and prove the superiority of theLORM approach in theory.
Keywords: Multi-attribute range query, Distributed hash table,Peer-to-Peer, Resource discovery, Grids, Cycloid.
1 INTRODUCTION
Grid systems integrate computers, clusters, storage systemsand instruments to provide a highly available infrastructurefor large scientific computing centers. Scalable and efficientresource discovery is critical to providing usability and ac-cessibility in large-scale grid systems. The resources requiredby applications are often described by multi-attribute rangequeries. Such a query consists of a set of attributes such asavailable computing power and memory with a range for eachattribute. A fundamental service of resource discovery is tolocate resources according to the attribute inputs. Recently,
• * Corresponding Author. Email: [email protected].
• H. Shen is with the Department of Electrical and Computer Engineering,Clemson University, Clemson, SC, 29634. C. Xu is with the Departmentof Electrical and Computer Engineering, Wayne State University, Detroit,MI 48202.
Distributed Hash Table (DHT) architecture has been intro-duced to grid systems for large-scale and dynamic resourcediscovery due to its high scalability and dynamism-resiliencefeatures. DHT can efficiently route messages to the uniqueowner of any given object. Because of its single deterministicobject location, the object can be either a resource attribute or avalue. Therefore, it is a challenge to realize resource discoverywith both range-query and multi-attribute requirements.
According to how to leverage the deterministic objectlocation function of DHTs for multi-attribute range queriesin grids, most current pure DHT based approaches can beclassified into multi-DHT-based, single-DHT-based central-ized and single-DHT-based decentralized approaches. Multi-DHT-based approaches support multi-attribute range queriesby relying on multiple DHT networks with each networkresponsible for a single attribute [2, 5]. To locate resourcesspecified by several attributes and ranges, each query for aresource is presented to the appropriate DHT and then theresults are concatenated in a database-like join operation.However, maintaining multiple DHT networks generates ahigh cost, especially in a highly dynamic environment. Single-DHT-based centralized approaches [32] keep the resourceinformation of all values for a specific attribute in a singlenode. In order to discovery resources satisfying user specifiedconstraints, all nodes in the distributed system form a DHT andact as both resource servers and clients. The DHT server nodescollect the information of node resources, receive resourcequeries and send the requested resource information to thenodes. Though these approaches only need to maintain oneDHT, it leads to high resource discovery latency since rangesearching is conducted in a very large resource informationdirectory. Moreover, the centralized approach for an attributemay overload directory nodes by letting them maintain a highvolume of information and process resource queries. Single-DHT-based decentralized approach [7, 8] is based on oneDHT and provides range searching. It maps the attribute andvalue of a resource separately to one DHT, and processesa query by searching them separately. Though it incurs lessDHT maintenance overhead and searching latency, it doublesthe overhead for resource information maintenance, resourcereporting and resource searching. This is because it separateseach resource information piece to two parts in resource re-
2
porting and resource searching. In addition, it also accumulatesresource information of a specific attribute in a single node,overloading these nodes for query processing.
To reduce overhead and enhance efficiency of resourcediscovery in grids, we propose a DHT-based resource dis-covery approach with features of Low-Overhead, Range-queryand Multi-attribute (LORM) [40]. Unlike the aforementionedthree groups of DHT-based approaches, LORM is built on asingle DHT called Cycloid [41]. Instead of collecting resourceinformation of all values of an attribute in a single node orseparating each piece of resource information, LORM arrangeseach node to be responsible for the resource information of aspecific attribute within a value range by taking advantage ofthe compound graph structure of Cycloid, which connects clus-ters by a cycle. Specifically, the resource information of oneattribute is gathered in one cluster, and is further distributedamong the nodes in the cluster according to the resourcevalues. LORM achieves high efficiency through balanceddistribution of maintenance overhead and resource discoveryoperations. We demonstrate its effectiveness and efficiency viasimulation in comparison with other DHT-based approaches.We also analyze the performance of LORM rigorously andcompare it with multi-DHT-based and single-DHT-based ap-proaches with respect to their overhead and efficiency. Theanalytical results are consistent with the experimental results.The results prove the superiority of LORM through theory.
The proposed LORM approach can also be applied toother compound graph based overlays such as Kcube [18]and dBCube [10], in which clusters are connected by astructure such as Kautz digraph and de Bruijn graph. Then,for range-query and multi-attribute resource discovery, as inCycloid, LORM can collect the resource information of oneattribute in one cluster and further distribute the informationamong nodes in one cluster based on resource values.
The remainder of this paper is structured as follows. Sec-tion 2 describes a review of DHT-based resource discoveryapproaches for grid systems and methods for multidimensionaland (or) range queries. Section 3 describes LORM, focusingon its resource discovery framework and algorithms. Section 4presents the performance analysis of LORM in comparison toother representative DHT-based resource discovery methods.Section 5 analyzes the performance of LORM and otherapproaches with regards to the consistency between analyticalresults and experimental results in both a static environmentand a dynamic environment. Section 6 concludes the paperand provides remarks on possible future work.
2 RELATED WORK
Recently, numerous approaches have been proposed for re-source discovery in grid systems. DHT [46, 25, 19, 20, 37,58, 36, 41] has been widely adopted for resource discoveryin grids. Current pure DHT based approaches to achievemulti-attribute range query can be generally classified intothree groups: (1) Multi-DHT-based approach that adopts oneDHT for each attribute, and processes multi-attribute rangequeries in parallel in corresponding DHTs [2, 5]. In thisapproach, multiple DHTs for multiple attributes need to be
maintained, and the DHT key is used as the index for theresource value for range queries. However, the constructionand maintenance of multiple DHTs are costly, especially ina dynamic environment. For example, suppose that there arem types of resource attributes. Then, m DHTs are needed.Although one node does not necessarily have all attributes, itis a member in each of the m DHTs. The number of routingtables that a node maintains is m. Each routing table containslog n entries for a network with overall n nodes. Therefore,each node needs to maintain m× log n neighbors. (2) Single-DHT-based centralized approach that pools together resourceinformation of all values for a specific resource attribute ina single node [32]. In this approach, the key in the DHTfunctions as the index for the resource attribute. However, thisapproach overloads directory nodes for maintaining high vol-ume of resource information in their directories and resourcequery processing. In addition, a large directory size leadsto inefficiency in resource searching. (3) Single-DHT-baseddecentralized approach that separately maps the resourceattribute and value in the resource information to a single DHT,and processes a query by searching them separately [7, 8]. Itbrings about more overhead in resource reporting and search-ing, and produces more maintenance overhead for resourceinformation by doubling the information pieces. In addition,it accumulates resource information of a specific attribute ina single node, which may lead to overloaded nodes.
There are other resource discovery methods for grids. Theworks in [45, 39] focus on multi-attribute resource discoverywithout considering range. They represent server meta-data aspoints in a multidimensional space and then express queriesas predicates over these points. The works in [52, 47] leveragethe tree structure for queries in grids. The works in [13, 31, 26]are based on unstructured P2P networks. However, tree-basedapproaches are not resilient to network churn and searchingin unstructured networks generates a very high overhead.
There are many solutions to realize range queries andmultidimensional queries over existing P2P systems. Thesemethods can complement the pure DHT based approaches instructures, routing and data representation to achieve higherperformance. ZNet [44], Midas [30], ERQ [56], SCAN [48]and SONAR [38] are multi-attribute range querying methods.Many other methods [27, 57, 17, 59, 29, 22] rely on a treestructure for this purpose. Shen and Li [43] and Zhang etal. [53] proposed two-layered architecture to support mul-tidimensional range queries in P2P networks. Also, somemethods [54, 6] use an index service or structure for mul-tidimensional searching in P2P networks. Datta et al. [12]described how range queries can be supported in a structuredoverlay network that provides O(log n) search complexity ontop of a trie abstraction. Wu et al. [51] proposed Roogle, a de-centralized non-flooding P2P search engine that can efficientlysupport high-dimensional range queries in P2P systems. Gane-san et al. [16] showed how multidimensional queries maybe supported in a P2P system by adapting traditional spatialdatabase technologies (kd-trees and space-filling curves) withP2P routing networks and load-balancing algorithms. Chen etal. [11] exploited Bloom Filter for multi-keyword search overDHT P2P networks.
3
Also, there have been numerous studies on the problemof multidimensional or range queries in the database field.Early such works kd-tree [4], bdd-trees [3] and vp-tree [15].Papadias et al. [33] showed how a variety of three- orfour-dimensional queries that correspond to different relationscan be processed using spatial data structures. In order toreduce the computing cost in dimensionality reduction whileensuring high query precision, Ravi et al. [23] proposed atechnique that uses aggregate data from the existing indexrather than the entire data. Castelli et al. [9] observed thata fundamental underpinning of any Content-based routing(CBR) protocol is for messages and subscriptions to “meet”at some points in the network, and thus proposed theHyperCBR which enforces this topological property in amultidimensional space. Weng et al. [49] proposed strategiesto efficiently execute range queries on distributed machines,when partial replica optimization is employed.
LORM [40] is based on Cycloid [41]. It is advantageousover the three groups of DHT-based grid resource discoverymethods in that it only relies on a single DHT to realize multi-attribute range-query resource discovery with low overhead.Moreover, unlike most other multidimensional range queryingmethods, LORM uses a DHT without the need of building anadditional structure.
3 RANGE-QUERY AND MULTI-ATTRIBUTE RE-SOURCE DISCOVERY
3.1 An Overview of CycloidThis section provides an overview of DHT overlay networksfollowed by a high-level view of the Cycloid DHT. DHToverlays are a class of decentralized systems at the applicationlevel that partition ownership of a set of objects among partici-pating nodes, and can efficiently route messages to the uniqueowner of any given object. Each object or node is assignedwith an ID (i.e., key) that is the consistent hash value [24]of the object name or node IP address. The overlay networkprovides two main functions: Insert(key,object) andLookup(key) that store an object to a node and retrievethe object, respectively. The message for the two functions isforwarded from node to node, based on the routing algorithmthrough the overlay network, until it reaches the object’sowner. Each node maintains a routing table that records itsneighbors in the overlay network.
Early studies have resulted in numerous DHT overlaynetworks. Our previous study has analyzed these overlayswith various topologies and characteristics, and has designedthe Cycloid overlay [41], which is based on a compoundgraph of cube-connected cycles [34]. Cycloid distinguishesitself from other DHTs by its higher scalability since itsmaintenance overhead is constant regardless of network size.Cycloid’s low maintenance cost, balanced load distribution,and compound graph structure give LORM the capability ofhandling the challenges in resource discovery in grids. Wepresent an overview of Cycloid in below.
Cycloid is a constant-degree overlay with n=d·2d nodes,where d is DHT dimension. It achieves a time complexityof O(d) per lookup request by using O(1) neighbors
(x, 2047)
(x, 50)
a: (3, 200)d: (10, 200)
(x,1800)
b: (5, 200)(x, 1200)
a: (3, 200)
c: (8, 200)
d: (10, 200)
(x, 800)
(x,1000) (x, 500)
Fig. 1. Cycloid structure.
Cycloid DHT layer
Grid layer
Fig. 2. LORM architecture.
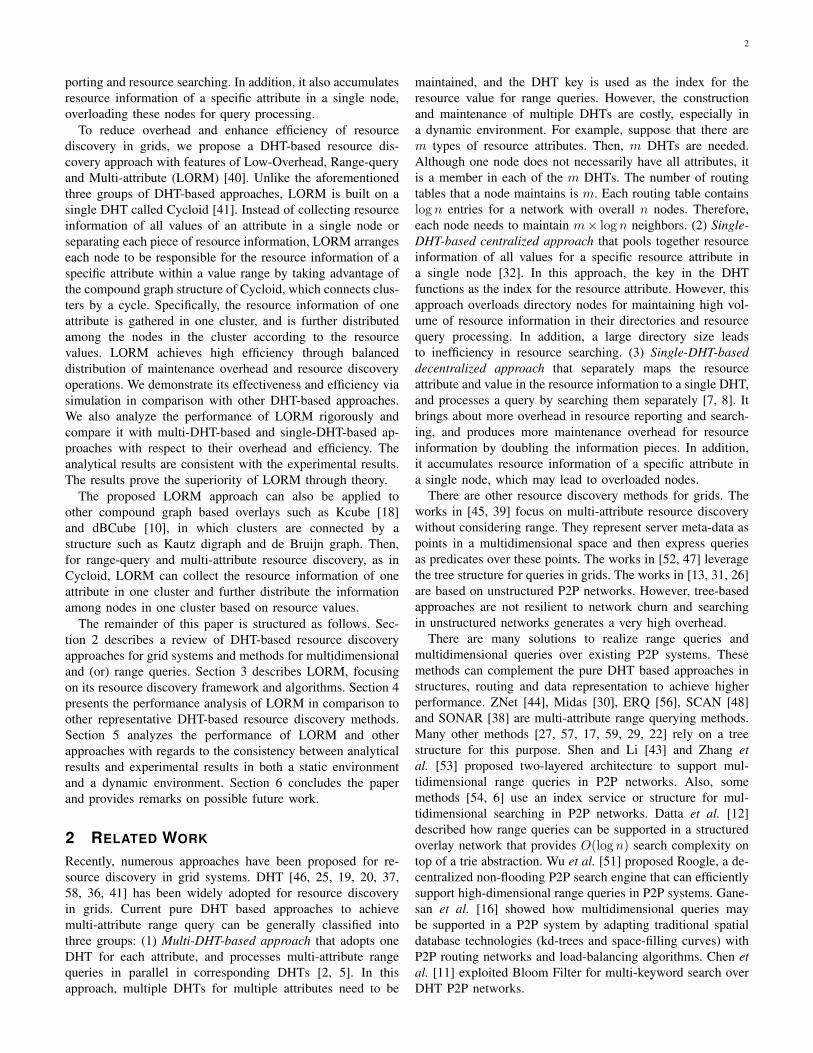
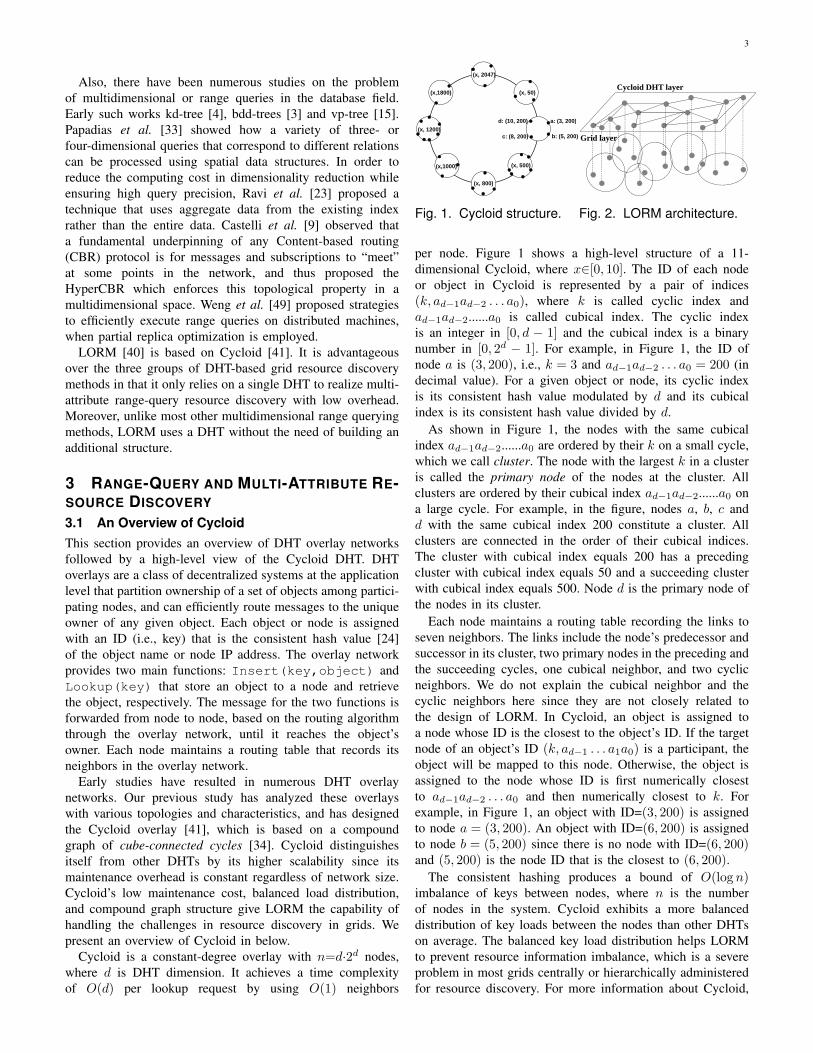
per node. Figure 1 shows a high-level structure of a 11-dimensional Cycloid, where x∈[0, 10]. The ID of each nodeor object in Cycloid is represented by a pair of indices(k, ad−1ad−2 . . . a0), where k is called cyclic index andad−1ad−2......a0 is called cubical index. The cyclic indexis an integer in [0, d − 1] and the cubical index is a binarynumber in [0, 2d − 1]. For example, in Figure 1, the ID ofnode a is (3, 200), i.e., k = 3 and ad−1ad−2 . . . a0 = 200 (indecimal value). For a given object or node, its cyclic indexis its consistent hash value modulated by d and its cubicalindex is its consistent hash value divided by d.
As shown in Figure 1, the nodes with the same cubicalindex ad−1ad−2......a0 are ordered by their k on a small cycle,which we call cluster. The node with the largest k in a clusteris called the primary node of the nodes at the cluster. Allclusters are ordered by their cubical index ad−1ad−2......a0 ona large cycle. For example, in the figure, nodes a, b, c andd with the same cubical index 200 constitute a cluster. Allclusters are connected in the order of their cubical indices.The cluster with cubical index equals 200 has a precedingcluster with cubical index equals 50 and a succeeding clusterwith cubical index equals 500. Node d is the primary node ofthe nodes in its cluster.
Each node maintains a routing table recording the links toseven neighbors. The links include the node’s predecessor andsuccessor in its cluster, two primary nodes in the preceding andthe succeeding cycles, one cubical neighbor, and two cyclicneighbors. We do not explain the cubical neighbor and thecyclic neighbors here since they are not closely related tothe design of LORM. In Cycloid, an object is assigned toa node whose ID is the closest to the object’s ID. If the targetnode of an object’s ID (k, ad−1 . . . a1a0) is a participant, theobject will be mapped to this node. Otherwise, the object isassigned to the node whose ID is first numerically closestto ad−1ad−2 . . . a0 and then numerically closest to k. Forexample, in Figure 1, an object with ID=(3, 200) is assignedto node a = (3, 200). An object with ID=(6, 200) is assignedto node b = (5, 200) since there is no node with ID=(6, 200)and (5, 200) is the node ID that is the closest to (6, 200).
The consistent hashing produces a bound of O(log n)imbalance of keys between nodes, where n is the numberof nodes in the system. Cycloid exhibits a more balanceddistribution of key loads between the nodes than other DHTson average. The balanced key load distribution helps LORMto prevent resource information imbalance, which is a severeproblem in most grids centrally or hierarchically administeredfor resource discovery. For more information about Cycloid,

4
please refer to [41]. Figure 2 shows a high level architecturefor the application of Cycloid to grids for resource discovery.LORM relies on a single Cycloid with constant maintenanceoverhead. The goal of LORM is to address multi-attribute andrange query resource discovery with low overhead and highefficiency.
3.2 LORM Framework and Algorithms
3.2.1 Resource Information Representation
Usually, the resources required by applications are describedby specifying a set of attributes such as available CPU time,memory, network bandwidth. It is a challenge to effectively lo-cate resources across widely dispersed domains based on a listof predefined attributes. Without loss of generality, we assumethat each resource is described by a set of attributes with glob-ally known types and values/ranges or string description. E.g.,“CPU=1000MHz”, “Free memory>2MB” or “OS=Linux”.We define resource information as information of availableresources and resource queries. We use πa to denote thevalue/range (e.g., “2”) or string description (e.g., “Linux”)of a particular attribute a (e.g., “Free memory” and “OS”).Resource information of a resource requester j is representedin a set of 3-tuple representation: < a, πa, ip addr(j) >,in which ip addr(j) denotes the IP address of node j. Theavailable resource information of node i is represented in theform of < a, δπa, ip addr(i) >, in which δπa is the πa of itsavailable resource.
3.2.2 Resource Information Mapping
Usually, the operation in resource discovery is to pool togetherthe information of available resources in a number of directorynodes, and direct resource requests to these nodes, which re-turn the resource owners of desired resources to the requesters.A directory node stores resource information in a directory.Recall that a Cycloid consists of a number of clusters, whichtogether constitute a large cycle. As shown in Figure 3, thebasic idea of LORM is to arrange each cluster to be respon-sible for the information of one attribute, and distributes theinformation among nodes within the cluster based on resourcevalue/range or string description. Towards this end, LORMassigns each resource a Cycloid ID (k, ad−1ad−2 . . . a0). Itscubical index ad−1ad−2 . . . a0 represents resource attribute a,and its cyclic index k represents resource value πa. Recallthat in a Cycloid ID, the cubical indices ad−1ad−2 . . . a0 dif-ferentiate clusters, and the cyclic indices k differentiate nodepositions in a cluster. As a result, the resource information isdistributed in the Cycloid structure as shown in Figure 3.
LORM can build all nodes in a grid system into a Cycloidstructure. For a grid system with m types of resource attributes,if m is smaller than the number of clusters in the Cycloid,some clusters will not be used. In this case, if m is fixed, inorder not to waste maintenance overhead, LORM can choosepartial relatively stable nodes to build a Cycloid with mclusters. If m is larger than the number of clusters in theCycloid, a cluster may be responsible for more than oneresource attribute. In this case, a directory node in the clustermaintains one directory for each attribute.
In the following, we present the details of the designof LORM by answering three questions: (1) how to createresource ID? (2) how nodes report their resource informationof available resources to their directory nodes? and (3) hownodes query resources from their directory nodes?
Resource HashCPU 50Free memory 200Disk 500External memory 800Software package 1000Web service 1200Bandwidth 1800Database 2047
TABLE 1Resources and their Hash
values.
CPU
Database
B d idth
e: (0.2]
CPU
Weba: (0,3]d: (8,10]
Bandwidth
M
f: (2,5]g: (5,10]
b: (3,5]
Software
Web service
c: (5,8]Memory
package Disk
External memory
2/27
Fig. 3. Resource informationdistribution in LORM.
3.2.3 Resource IDConsistent hash functions such as SHA-1 are widely used inDHT networks for node or file ID due to its collision resistantnature. Using such a hash function, it is computationallyinfeasible to find a message that corresponds to a givenhashed value, or find two different messages that producethe same message digest. The consistent hash function iseffective in clustering messages based on message keywordssuch as resource attributes or attribute string descriptions,but cannot guarantee that an ordered list of numerical valueswill have a list of hash values in the same order. Therefore,consistent hash function is effective for cubical index basedon resource attribute and for cyclic index based on attributestring description, whereas may not be appropriate for cyclicindex based on resource values. Locality preserving hashingfunction [7] helps to solve the problem. We use v to denote avalue, use H to denote a consistent hash function, and use Hto denote a locality preserving hashing function.
Definition 1 [7]. Hash function H is a locality preservinghashing function if it has the following property: Hvi
< Hvj
iff vi < vj , and if an interval [vi, vj ] is split into [vi, vk] and[vk, vj ], the corresponding interval [Hvi ,Hvj ] must be splitinto [Hvi
,Hvk] and [Hvk
,Hvj].
We assume that each resource represented by a value has aminimum value and a maximum value denoted by πmin andπmax, respectively. Since the ID length of a cluster is d− 1,we define a locality preserving hashing function to be
H = (π − πmin)× (d− 1)/(πmax − πmin),where π is a value for resource attribute a in the range[πmin, πmax]. As a result, each resource value of attribute ahas a H value within [0, d − 1]. Therefore, LORM assignseach piece of resource information a Cycloid ID denoted byrescID=(Hπa
,Ha), where
Hπa ={Hπa
πa is a valueHπa πa is a string.
That is, the cubical index Ha is the consistent hash functionvalue of the resource attribute, and the cyclic index Hπa
isthe locality preserving hashing value of resource value πa orthe consistent hash function value Hπa
of string description.

5
Thus, using the resource ID of a resource, a node can usethe Insert() and Lookup() APIs to report and requestresource information of the resource in a distributed manner.
3.2.4 Resource Information ReportingAlgorithm 1 shows the pseudocode for the different operationsof a node in the LORM resource discovery. The operationsinclude resource reporting and resource querying. In resourcereporting, each node periodically reports its available re-sources with multiple attributes to the system via interfaceInsert(rescID,rescInfo) for each attribute, whererescInfo=<a, δπa, ip addr(i)> is the resource information(Lines 2-6 in Algorithm 1). Based on the Cycloid key as-signment policy, in which a key is assigned to a node with theclosest ID to its ID, the information of the same attribute willbe mapped to the same cluster. Within each cluster, each nodeis responsible for the information of a resource whose cyclicindex falls into the key space range it supervises. That is, theinformation of a resource is stored in a node whose cyclicindex is the closest to the cyclic index in rescID. We call thenode or the ID of the node the root of the key or rescInfo.
For example, for the resources and their hashed valueslisted in Table 1, the resource information will be stored innodes in Figure 1 as illustrated in Figure 3. In the clustersresponsible for memory and CPU, each node is responsiblefor the resource information in its range. For instance, nodea supervises range (0,3] and node b supervises range (3,5]in their own cluster. The resource information of node i,<mem, 2G, ip addr(i)>, has rescID=(H2,Hmem)=(2,200),and it will be routed to and stored in node a via func-tion Insert((H2,Hmem),<mem,δπmem,ip_addr(i)>).Similarly, if node j has resource 1.8GHz CPU, the re-source information will be reported and stored in node e byInsert((H1.8,HCPU ),<CPU,δπCPU,ip_addr(j)>).
Proposition 3.1: In LORM, given a range query [π1, π2]for a resource where πmin 6 π1 6 π2 6 πmax, a node thatcontains attribute value π within [π1, π2] must have an ID thatsatisfies root(Hπ2 ,Ha) > ID > root(Hπ1 ,Ha).
Proof: In LORM with n=d·2d nodes, a node re-ports its resource information using the Cycloid interfaceInsert((Hδπa
,Ha),rescInfo). Attribute a with valueδπa will be stored in root(Hδπa
,Ha) whose ID is the closest to(Hδπa ,Ha). According to Definition 1, because π1 6 π 6 π2,the resource information of value v will be stored in node ithat satisfies root(H(π1)) 6 i 6 root(H(π2)).
3.2.5 Resource Information QueryingTo simplify the description of resource querying, we letAQ denote the set of attributes in a query Q. A multi-attribute query Q is composed of a set of sub-queries oneach attribute in AQ. For each sub-query, a node sends outLookup(rescID,<a, πa, ip_addr(i)>), where πa is thevalue or string description of the requested resource (Lines9-12 in Algorithm 1). The query is routed to the directorynode for the desired resource. All sub-queries are processed inparallel. For example, when node k needs a multiple-attributeresource, say 1.8GHz CPU and 2GB memory, it sends requestsLookup(H1.8,HCPU) and Lookup(H2,Hmem), which
will be resolved in parallel. In Figure 3, the queries will arriveat node a and node e, which reply to the requester node k withthe requested resource information<mem, δπmem, ip_addr(i)> where δπmem = 2 and<CPU, δπCPU , ip_addr(j)> where δπCPU = 1.8. Afterthe requester node receives all responses, it then concate-nates the results in a database-like “join” operation basedon ip addr (Lines 15-18 in Algorithm 1). The resultsare the nodes that have the resources queried by the re-quester. For range queries such as “Free memory>2GB”and “CPU>1.8GHz”, according to Proposition 3.1, in ad-dition to responding with satisfied resource information intheir own directories, nodes a and e forward the resourcequeries to their immediate successors in their own clusters.The successors check their own directories, respond satisfiedresource information to the requester, and forward the queriesto their immediate successors in their own clusters. Thisprocess is repeated until a successor has no satisfied resourceinformation. If the requested resource range is less than aspecified value, then the request receivers forward queriesto their predecessors. If a requester’s query has both lowerand upper bounds such as “1GB6memory62GB”, it can firstchoose the middle value in [lower bound, upper bound] forthe destination of resource query. The root which receives thequery will generate and forward two queries to its successorand predecessor, respectively. The queries will be forwarded inboth directions. A query receiver stops forwarding the queryif its resource information is outside of the bound range.
Algorithm 1 Pseudo-code for the operations of node i in theLORM resource discovery.
1: /*periodically report resource information of its available re-sources with attributes A={a1, a2 ... am}*/
2: for each a ∈ {a1, a2 ... am} do3: //Ha is the consistent hash values of attribute a. Hδπa =Hδπa
if πa is a value, and Hδπa =Hδπa if πa is a string4: rescID=(Hδπa ,Ha)5: Insert(rescID,<a, δπa, ip_addr(i)>)6: end for7:8: /*request resources using a multi-attribute range-query,
Q={(a1, πa1),(a2, πa2). . . (am, πam)}, AQ={a1,a2. . .am}*/9: for each a ∈ AQ do
10: rescID=(Hπa ,Ha)11: lookup(rescID,<a, πa, ip_addr(i)>)12: end for13: /*after receiving responses of resource request Q*/14: //IP addr(a) is a list of ip addr as the response for
lookup(rescID,<a, πa, ip_addr(i)>)15: IP addr(Q)=IP addr(a1)∩IP addr(a2)∩. . .∩IP addr(am)16: for each ip addr(j) ∈ IP addr(Q) do17: SendMsg(ip addr(j)) //request resource from node j18: end for
3.2.6 Comparative DiscussionThe multi-DHT-based approach and single-DHT-based decen-tralized approach need to probe all nodes in the system fora resource in a certain range in the worst case. Unlike theseapproaches, LORM reduces the probing scope for subsequentrange queries after the Lookup() operation from networksize n to cluster size d because all information about one

6
attribute for all resources is gathered in a single cluster ratherthan spreads all over the system. Reducing the system-wideprobing scope to cluster-wide scope significantly reduces theresource searching cost. To deal with the load imbalancecaused by the distribution of resource information, load bal-ancing methods [42] can be adopted into the LORM.
Proposition 3.2: With high probability1, in LORM withn = d · 2d nodes, the number of nodes that must be contactedto report resource information or to find a desired resource ofan m-attribute resource is O(md).
Proof: In a Cycloid DHT, the number of nodes that mustbe contacted for an object allocation or object owner usinginterface Insert() is O(d) w.h.p. As resource informationis allocated to nodes based on object allocation policy, theinformation reporting for one resource attribute also takesO(d) hops. Therefore, it takes O(md) for the informationreporting of an m-attribute resource. For a range query, dnodes in one cluster are needed to probe in the worst case.Therefore, the total number of nodes contacted for searchingan m-attribute resource is m(O(d) + d) = O(md).
The CAN DHT [36] has a m-torus topology based on a m-dimensional Cartesian coordinate space. Thus, it can supportmulti-attribute range queries in a natural manner by usingeach dimension to represent an attribute. A resource is thenrepresented by an m-dimensional CAN ID, in which the valuein a dimension represents the resource value/description of thecorresponding resource. Thus, for m resources in a grid, m-torus CAN should be built. In LORM, d · 2d = n, 2d = m,the average path length is d and the size of routing table is 7.In an m-torus CAN, the average routing path length is
(m/4)(n1/m) > m/4 = 2d/4 > d (when d > 4), (1)
and the routing table size is
2m = 2 · 2d = 2d+1 > 7 (when d ≥ 2). (2)
Therefore, in a large-scale system when d > 4, the averagepath length and routing table size (i.e., maintenance overhead)of the m-torus CAN are larger than those of LORM. Also,even though some nodes only possess or query for part of them resources, they still need to generate the resource ID andprocess the resource reporting and querying based on the mdimensions, which brings about unnecessary cost.
3.3 Dynamism-Resilient LORM
An effective resource discovery algorithm should work forgrid systems with dynamic node joins and departures. Cycloidhas a self-organization mechanism to maintain its structureand stored objects, which helps LORM to handle dynamism.When a node joins in the system, in addition to reporting itsresources using Insert(rescID,rescInfo), it receivesthe resource information in its responsible ID region fromits neighbors based on the Cycloid’s key assignment policy.For example, if node h with ID (2,150) joins the system inFigure 3, then the resource information in the range (2,3] istransferred from node a to the newly-joined node h. When
1. An event happens with high probability (w.h.p.) when it occurs withprobability 1−O(n−1).
a node departs from the system, it transfers its resourceinformation to its neighbors. For instance, if node a leaves,it transfers its resource information to node d or b based onthe ID closeness. That is, the information in the range (0,1] istransferred to node d, and the information in the range (1,3] istransferred to node b. If node a is the only node in its cluster,because the cluster ID of Memory 200 is closer to the clusterID of CPU 50 than the cluster ID of disk 500 as shown inFigure 1, it transfers its information to the CPU cluster.
For node failures or departures without warning, LORMresorts to the periodical resource information reporting bywhich the lost resource information will be recovered inits new root. Specifically, when a node receives a resourcerequest, if it cannot locate the requested resource, it assumesthat the old root of the resource information failed, and waitsfor a period of time T which is the resource informationreporting period. Within T , the lost resource information willbe reported to the node, and the request can be resolved.With this self-organization mechanism, instead of relying onspecific nodes, resource information is always stored in a noderesponsible for the ID region where the information ID locateseven in the dynamic situation, and the Lookup(rescID)requests will always be forwarded to the node that has therequired resource information.
Proposition 3.3: In a dynamic environment, in LORM,node joins and warned-departures will generate little adverseeffect on resource querying, and a query for a resource whoseroot failed or departed without warning can be resolved withinT that is the resource information reporting period.
Proof: In Cycloid, any node joining or leaving leads to filetransfer in order to maintain the consistency of file locationsbased on file assignment policy. A resource query is alwaysforwarded to the root of the resource, so the node joining andleaving will result in little adverse effect on resource querying.If a root cannot resolve a resource request due to node failureor departure without warning, the lost resource informationwill be reported to the root in the next T .
As indicated previously, when the number of resourceattributes in the system m is less than the number of clustersc = 2d in Cycloid when using all nodes to build the Cycloid,LORM can only choose stable nodes to form Cycloid inorder to achieve m = c. To make our analysis applicable toboth cases, in the analysis, we assume all resource discoverymethods use the existing n nodes in a grid system to buildDHT overlay(s) for resource discovery, and define
α ={
1 m ≤ cdm/ce m > c.
Proposition 3.4: In LORM with n = d · 2d nodes, withthe assumption that each resource attribute has k pieces ofresource information and the information is uniformly dis-tributed, w.h.p., when an (n + 1)st node joins or leaves thenetwork, if the node is the only node in its cluster, responsi-bility for O(k) pieces of resource information changes hands(and only to or from the joining or leaving node). OtherwiseO(k/d) pieces of resource information change hands.
Proof: Since each resource attribute has k pieces of

7
resource information and the information is uniformly dis-tributed, a cluster has αk pieces of resource informationand each node has O(αk/d)=O(k/d) pieces of resourceinformation when the cluster has d nodes. If a joining orleaving node is the only node in its cluster, it needs to handover O(αk)= O(k) pieces of resource information. Otherwise,O(αk/d)= O(k/d) pieces of information change hands.
4 COMPARATIVE STUDY AND ANALYSIS
There are mainly three classes of approaches dependent onDHTs for resource discovery in grids: multiple-DHT-based,single-DHT-based centralized and single-DHT-based decen-tralized. We use Mercury [5], SWORD [32] and MAAN [7]as representatives of multiple-DHT-based, single-DHT-basedcentralized and single-DHT-based decentralized classes, re-spectively. We analyze LORM in comparison with theseapproaches. LORM maps resource attribute and value or stringdescription to two levels of the compound graph based CycloidDHT. Mercury uses multiple DHTs with one DHT responsiblefor each attribute and maps resource value to each DHT.SWORD maps resource information including both attributeand value in a flat DHT, and MAAN maps attribute and valueseparately to a flat DHT. To be comparable, we use Chord forattribute hubs in Mercury, and we replace Bamboo DHT withChord in SWORD.
In Mercury, for higher efficiency of resource querying,a node within one of the hubs can hold the data recordwhile the other hubs can hold a pointer to the node. Thisstrategy can also be applied to other methods to improvethe efficiency. To make the different methods comparable,we don’t consider this strategy in the comparative study. Weanalyze their performance in terms of structure maintenanceoverhead, resource information maintenance overhead, andthe efficiency of resource discovery. In the analysis, we useattribute value to represent the locality preserving hash valueof both attribute value and attribute string description. We usedirectory size to represent the number of resource informationpieces in a directory.
4.1 Maintenance Overhead
Proposition 4.1: In a grid system with n nodes and m re-source attributes, LORM can reduce the structure maintenanceoverhead of multiple-DHT-based resource discovery methods(e.g. Mercury) by a factor of no less than m.
Proof: LORM is based on Cycloid, in which each nodeis responsible for maintaining 7 ≤ log(n) neighbors in alarge-scale system. In multiple-DHT-based methods such asMercury, each node is responsible for maintaining log(n)neighbors for each DHT of one resource. Therefore, each nodehas m log(n) neighbors. The structure maintenance overheadcan be saved by a factor of m log(n)
7 ≥ m log(n)log(n) = m.
Proposition 4.2: In a grid system, the total number ofresource information pieces in single-DHT-based decentralizedresource discovery methods (e.g. MAAN) is twice of those inLORM, single-DHT-based centralized methods (e.g. SWORD)and multi-DHT-based methods (e.g. Mercury).
Proof: For each piece of resource information, MAANsplits its a and πa, and stores the two pieces of informationseparately, while LORM, single-DHT-based centralized (e.g.SWORD) and multi-DHT-based methods (e.g. Mercury) onlystore one information piece. Therefore, the size of the totalresource information of MAAN is twice of others. Conse-quently, other methods generate half of the overhead for themaintenance of resource information in MAAN.
Proposition 4.3: In a grid system with n nodes and mresource attributes, with the assumption that each type ofresource attribute has k pieces of resource information andits values are uniformly distributed, LORM can reduce thenumber of resource information pieces in a directory node inthe single-DHT-based decentralized resource discovery meth-ods (e.g. MAAN) by a factor of d
α (1 + mn ).
Proof: For k pieces of resource information of a resourceattribute, MAAN splits the attribute and value. k pieces arestored in the same node, and the other k pieces are uniformlydistributed among the n nodes based on the value. A directorynode has a total of k + m · kn pieces. LORM does not splitthe information, and all resource information of a particularresource attribute is in a cluster with d nodes. With the uniformdistribution assumption, each directory node is responsiblefor at most αk/d pieces of resource information. Therefore,LORM can reduce the total size of resource information in adirectory node in MAAN by a factor of k+m· k
n
αk/d = dα (1 + m
n ).
Proposition 4.4: In a grid system with n nodes and mresource attributes, with the assumption that each type ofresource attribute has k pieces of resource information andits values are uniformly distributed, LORM can reduce theresource information size in a directory node in single-DHT-based centralized methods (e.g. SWORD) by a factor of d
α .Proof: In LORM, all resource information of a particular
resource attribute is in a cluster with d nodes. With theuniform distribution assumption, each directory node has atmost αk/d pieces of resource information. In SWORD, allresource information of a particular resource attribute is in asingle node. Thus, LORM can reduce the resource informationsize in a directory node in SWORD by a factor of k
αk/d = dα .
Proposition 4.5: For any set of n nodes and m resourceattributes, with the assumption that each type of resourceattribute has k pieces of resource information and its val-ues are uniformly distributed, multi-DHT-based methods (e.g.Mercury) can achieve more balanced resource informationdistribution than LORM by a factor of αn
dm .Proof: The proof of Proposition 4.4 shows that each
directory node is responsible for at most αk/d pieces ofresource information in LORM. In Mercury, for one attribute,a node is responsible for k
n pieces of resource information.Given m resource attributes, each node is responsible for mk
npieces of resource information. Thus, Mercury can achievemore balanced resource information distribution than LORMby a factor of αk/d
mkn
= αndm .
Proposition 4.6: Multi-DHT-based methods (e.g. Mercury)

8
and LORM (when m ≤ c) achieve more balanced resourceinformation distribution than the single-DHT-based decentral-ized resource discovery methods (e.g. MAAN) and single-DHT-based centralized methods (e.g. SWORD).
Proof: Propositions 4.3 and 4.4 show that LORMachieves more balanced resource information distribution thanthe single-DHT-based decentralized method (e.g. MAAN) andsingle-DHT-based centralized method (e.g. SWORD) whenm ≤ c. Proposition 4.5 shows that multi-DHT-based meth-ods (e.g. Mercury) achieves more balanced distribution thanLORM. Therefore, multi-DHT-based methods and LORMachieve more balanced resource information distribution thanthe single-DHT-based decentralized methods and single-DHT-based centralized methods.
4.2 Efficiency of Resource DiscoveryWe define the contacted nodes as the nodes that are involvedin resource discovery, which include query routing nodes anddirectory nodes receiving resource queries.
Proposition 4.7: To discover resources for an m-attributenon-range resource query in an n-node network, w.h.p.,LORM can reduce the total number of contacted nodes ofsingle-DHT-based decentralized resource discovery methods(e.g. MAAN) by a factor of logn
d .Proof: For each piece of resource information including
an attribute and value or string description, MAAN splitsthe attribute and value or string description and stores theinformation separately, while LORM only stores one pieceof resource information. For each non-range resource query,LORM needs one DHT lookup, while MAAN needs two DHTlookups for each attribute: attribute name and value. For anm-attribute resource query, LORM needs m DHT lookups,and MAAN needs 2m DHT lookups. Hence, for one resourcequery, the number of lookups in MAAN is 2m
m =2 times ofLORM. On the average case, one lookup needs log n/2 hopsin Chord [46] and d hops in Cycloid [41]. Thus, LORM canreduce the total number of contacted nodes of MAAN by afactor of 2 logn/2
d = lognd .
Proposition 4.8: To discover resources for an m-attributenon-range resource query in an n-node network, w.h.p., multi-DHT-based methods (e.g. Mercury) and single-DHT-basedcentralized methods (e.g. SWORD) can reduce the total num-ber of contacted nodes of single-DHT-based decentralizedresource discovery methods (e.g. MAAN) by a factor of 2.
Proof: For each non-range resource query, the multi-DHT-based methods (e.g. Mercury) and single-DHT-basedcentralized methods (e.g. SWORD) need one DHT lookup,while MAAN needs two DHT lookups for each attribute;attribute name and value. For an m-attribute resource query,the former methods need m DHT lookups, and MAAN needs2m DHT lookups. Hence, the former methods can reduce thenumber of contacted nodes in MAAN by a factor of 2.
When a range resource query is routed to its root, theroot node checks its directory for the range query. Then,in SWORD, the resource searching stops; in Mercury andMAAN, the node forwards the query to its successor or pre-decessor according to their closeness to the queried range; in
LORM, the node forwards the query to its successor or prede-cessor in its cluster according to their closeness to the queriedrange. The nodes receiving the query repeat the process. Wecall the nodes that receive a resource query and check their di-rectories for the queried resource visited nodes of the resourcequery. Visited nodes are included in the contacted nodes.
Proposition 4.9: In an n-node network, w.h.p., LORM canreduce at least m(n−d)
4 visited nodes to discover required re-source for an m-attribute range resource query in system-widerange resource discovery methods (e.g. MAAN and Mercury),and SWORD can reduce md
4 visited nodes in LORM, in theaverage case.
Proof: In Mercury, a range query needs n2 contacted
nodes in the worst case. Thus, on the average case, the totalnumber of visited nodes for an m-attribute resource rangequery on the average case is m(1 + n
4 ). MAAN has twolookups for each attribute query. m-attribute resource queryneeds m(2 + n
4 ) hops. In LORM, the nodes needed to bevisited for a resource query is m(1 + d
4 ) on the average case.Therefore, LORM can reduce at least m(1 + n
4 ) − m(1 +d4 ) = m(n−d)
4 visited nodes for an m-attribute resource queryin system-wide range resource discovery methods such asMAAN and Mercury, on the average case. Because SWORDdoesn’t need to forward query for range query, it reducesm(1 + d
4 )−m = md4 contacted nodes in LORM.
Proposition 4.10: In an n-node network, w.h.p., LORM canreduce at least mn contacted nodes to discover the requiredresource for an m-attribute resource range query in system-wide range resource discovery methods (e.g. MAAN andMercury), in the worst case.
Proof: Mercury uses one DHT for each attribute. For eachattribute in a resource requester, it needs log n hops for therequest to reach its root node [46]. After that, n nodes need tobe probed for the range query, in the worst case, because allresource information of the attribute spreads over the n nodes.Therefore, for each attribute query, log n+n hops are neededin the worst case. For a resource query with m attributes,Mercury needs to contact m(log n+n) nodes. MAAN has twolookups for each attribute query since it lookups attribute nameand value or string description separately. Only one lookupneeds system-wide probing on n nodes. Consequently, eachquery of an attribute needs (2 log n+n) hops, and m-attributeresource query needs m(2 log n+ n)> m(log n+ n) hops inMAAN. The number of nodes that need to be contacted inLORM for a resource query is m · d ≤ m · log n in the worstcase. Therefore, LORM can reduce at least m(log n + n) −m · log n = mn contacted nodes for an m-attribute resourcequery in system-wide range resource discovery methods suchas MAAN and Mercury, in the worse case.
5 PERFORMANCE COMPARISON
This section presents the performance evaluation of LORM inaverage case in comparison with Mercury [5], SWORD [32],MAAN [7]. We designed and implemented a simulator in Javafor the evaluation of LORM, Mercury, Sword and MAAN. Tobe comparable, we used Chord for Mercury and SWORD. In

9
the experiments, the dimension was set to 8 in Cycloid, and11 in Chord, and each DHT had 2048 nodes. We assumedthere were m = 200 resource attributes, and each attributehad k = 500 values. The size distribution of process CPUand memory requirements, and process lifetime fit a boundedPareto distribution [55, 35, 50, 21]. The bounded Paretodistribution was also used for node capacity [28]. Therefore,we used Bounded Pareto distribution function to generateresource values owned by a node and requested by a node.This distribution reflects real world where there are machineswith capacities that vary by different orders of magnitude. Theresource attributes in a node resource request were randomlygenerated.
5.1 Maintenance Overhead
In DHT overlays, each node needs to maintain a numberof neighbors (outlinks) in its routing table. Therefore, themaintenance of routing tables or the outlinks constitutes alarge part of the DHT overlay maintenance overhead. Proposi-tion 4.1 shows that LORM can reduce the DHT maintenanceoverhead of Mercury by a factor of no less than m. Thus,we use “Analysis−LORM” to represent the experiment resultsof Mercury divided by m = 200. Figure 4(a) plots thenumber of outlinks maintained by each node in Mercury,“Analysis−LORM” and LORM versus network size. Fromthe figure, we can see that the number of outlinks per nodein LORM is less than that of “Analysis−LORM”. Mercuryhas dramatically more outlinks per node than LORM. Theexperiment results are consistent with Proposition 4.1. Recallthat Mercury has multiple DHTs with each DHT responsiblefor one resource attribute, such that each node has a totalnumber of outlinks equals to the product of routing table sizeand the number of DHTs. It means that in Mercury, each nodeneeds much higher overhead to maintain its outlinks than inLORM.
In addition to the outlinks, a directory node also needs tomaintain resource information in its directory. It is desirableto distribute the information among nodes uniformly so thatthe information maintenance overhead as well as the resourcediscovery load can be distributed among nodes to avoidbottlenecks. The directory size is a metric for the balance ofthe resource information distribution. The average directorysize is the total number of resource information pieces dividedby the total number of nodes.
Proposition 4.2 proved that LORM can reduce the total(average) directory size of MAAN by half. Proposition 4.3proved that LORM can reduce the directory size of MAANby d(1 + m
n ). Figure 4(b) plots the experiment results of theaverage and the 1st and 99th percentiles of directory size pernode in MAAN and LORM. It also plots the analysis resultsof LORM based on MAAN according to Propositions 4.2and 4.3. That is, in the figure, the analysis results of the 1stand 99th percentiles are calculated as the experiment results ofMAAN divided by the factor of d(1+ m
n ) = 8× (1+ 2002048 ) =
8.78, and the analysis results of the average directory size arecalculated as the experiment results of MAAN divided by 2.We can see that the experiment results of the average directory
100120
ps
e
Mercury
SWORD
6080
100120
gic
al hops
attribute
e q
uery
Mercury
SWORD
Analysis-SWORD/MercuryMAAN
20406080
100120
rage logic
al hops
r m
ulti-attribute
esourc
e q
uery
Mercury
SWORD
Analysis-SWORD/MercuryMAAN
LORM
Analysis LORM020406080
100120
1 2 3 4 5 6 7 8 9 10Avera
ge logic
al hops
for
multi-attribute
re
sourc
e q
uery
Number of attributes per resource query
Mercury
SWORD
Analysis-SWORD/MercuryMAAN
LORM
Analysis-LORM020406080
100120
1 2 3 4 5 6 7 8 9 10Avera
ge logic
al hops
for
multi-attribute
re
sourc
e q
uery
Number of attributes per resource query
Mercury
SWORD
Analysis-SWORD/MercuryMAAN
LORM
Analysis-LORM020406080
100120
1 2 3 4 5 6 7 8 9 10Avera
ge logic
al hops
for
multi-attribute
re
sourc
e q
uery
Number of attributes per resource query
Mercury
SWORD
Analysis-SWORD/MercuryMAAN
LORM
Analysis-LORM
(a) Average number of contactednodes (Propositions 4.7 and 4.8)
100000120000
for
y
Mercury
SWORD
6000080000
100000120000
cal hops for
attribute
ce q
uery
Mercury
SWORD
Analysis-SWORD/MercuryMAAN
20000400006000080000
100000120000
al lo
gic
al hops for
multi-attribute
re
sourc
e q
uery
Mercury
SWORD
Analysis-SWORD/MercuryMAAN
LORM
A l i LORM020000400006000080000
100000120000
1 2 3 4 5 6 7 8 9 10
Tota
l lo
gic
al hops for
multi-attribute
re
sourc
e q
uery
Number of attributes per resource query
Mercury
SWORD
Analysis-SWORD/MercuryMAAN
LORM
Analysis-LORM020000400006000080000
100000120000
1 2 3 4 5 6 7 8 9 10
Tota
l lo
gic
al hops for
multi-attribute
re
sourc
e q
uery
Number of attributes per resource query
Mercury
SWORD
Analysis-SWORD/MercuryMAAN
LORM
Analysis-LORM020000400006000080000
100000120000
1 2 3 4 5 6 7 8 9 10
Tota
l lo
gic
al hops for
multi-attribute
re
sourc
e q
uery
Number of attributes per resource query
Mercury
SWORD
Analysis-SWORD/MercuryMAAN
LORM
Analysis-LORM
(b) Total number of contacted nodes(Propositions 4.7 and 4.8)
Fig. 5. The number of hops for query routing in differentresource discovery approaches.
size of LORM match the analytical results in Proposition 4.2.Recall that MAAN separates resource attribute and value orstring description of a piece of resource information, and storesthe information separately. Therefore, MAAN doubles the totalresource information size and needs information maintenanceoverhead twice as high as others. The experiment results ofthe 1st and 99th percentiles are close to the analytical results.The experimental results of the 99th percentile of LORM areslightly higher than the analytical results. This is because thatthe resource values are randomly chosen in the experimentand are not completely uniformly distributed. In addition, allresource information of the same attribute is collected in onecluster with only d=8 nodes. It is very likely that a node hasmuch more resource information than other nodes in the samecluster, resulting in slightly higher 99th percentile than thatwhen the values are uniformly distributed.
Proposition 4.4 proved that LORM can reduce the direc-tory size of SWORD by a factor of d. Figure 4(c) plotsthe experiment results of the average and the 1st and 99thpercentiles of directory size per node in SWORD and LORM.It also plots the analytical results of LORM based on theexperiment results of SWORD. The analytical results ofthe 1st and 99th percentiles are the experiment results ofSWORD divided by the factor of d. Proposition 4.2 impliesthat the average directory size of LORM equals to SWORD.Therefore, the analytical results of the average directory sizeof LORM in the figure equal to the experimental results ofSWORD. We can see that the experimental results of theaverage directory size of LORM match the analytical resultsas implied in Proposition 4.2. The experimental results of the99th percentile are only slightly higher than the analyticalresults in Proposition 4.4. This is because that the attributevalues are randomly distributed among d nodes, and somenodes have more resource information than others with randomdistribution.
Figure 4(d) plots the experimental results of the averageand the 1st and 99th percentiles of directory size per nodein Mercury and LORM. It also plots the analytical results ofLORM based on Mercury. Proposition 4.5 proved that Mercurycan achieve more balanced resource information distributionthan LORM by a factor of n
dm . Therefore, the analytical resultsof the 1st and 99th percentiles of LORM in the figure arecalculated as the experimental results of Mercury multipliedand divided by the factor of n
dm = 20488×200 = 1.28, respectively.
Proposition 4.2 implies that the average directory size ofLORM equals that of Mercury. Thus, the analytical results of

10
10000b
y
100
1000
10000nta
ined b
y
ode
MercuryAnalysis-LORMLORM
10
100
1000
10000ks m
ain
tain
ed b
y
each n
ode
MercuryAnalysis-LORMLORM
1
10
100
1000
10000
100 600 1100 1600 2100Outlin
ks m
ain
tain
ed b
y
each n
ode
Number of nodes
MercuryAnalysis-LORMLORM
1
10
100
1000
10000
100 600 1100 1600 2100Outlin
ks m
ain
tain
ed b
y
each n
ode
Number of nodes
MercuryAnalysis-LORMLORM
1
10
100
1000
10000
100 600 1100 1600 2100Outlin
ks m
ain
tain
ed b
y
each n
ode
Number of nodes
MercuryAnalysis-LORMLORM
(a) Average number of outlinks(Proposition 4.1)
600500600
e
MAANLORM
300400500600
ory
siz
e
MAANLORMAnalysis-LORM
100200300400500600
ire
cto
ry s
ize
MAANLORMAnalysis-LORM
0100200300400500600
100 200 300 400 500
Dir
ecto
ry s
ize
MAANLORMAnalysis-LORM
0100200300400500600
100 200 300 400 500
Dir
ecto
ry s
ize
Values per attribute
MAANLORMAnalysis-LORM
0100200300400500600
100 200 300 400 500
Dir
ecto
ry s
ize
Values per attribute
MAANLORMAnalysis-LORM
(b) MAAN versus LORM(Proposition 4.2 & Proposition 4.3)
600500600
e
SWORDLORM
300400500600
ory
siz
e
SWORDLORMAnalysis-LORM
100200300400500600
ire
cto
ry s
ize
SWORDLORMAnalysis-LORM
0100200300400500600
100 200 300 400 500
Dire
cto
ry s
ize
SWORDLORMAnalysis-LORM
0100200300400500600
100 200 300 400 500
Dire
cto
ry s
ize
Values per attribute
SWORDLORMAnalysis-LORM
0100200300400500600
100 200 300 400 500
Dire
cto
ry s
ize
Values per attribute
SWORDLORMAnalysis-LORM
(c) SWORD versus LORM(Proposition 4.4)
600500600
e
MercuryLORM
300400500600
ry s
ize
MercuryLORMAnalysis-LORM
100200300400500600
recto
ry s
ize
MercuryLORMAnalysis-LORM
0100200300400500600
100 200 300 400 500
Dire
cto
ry s
ize
MercuryLORMAnalysis-LORM
0100200300400500600
100 200 300 400 500
Dire
cto
ry s
ize
Values per attribute
MercuryLORMAnalysis-LORM
0100200300400500600
100 200 300 400 500
Dire
cto
ry s
ize
Values per attribute
MercuryLORMAnalysis-LORM
(d) Mercury versus LORM(Proposition 4.5)
Fig. 4. Overhead in different resource discovery approaches.
100000010000000
s
100010000
1000001000000
10000000
ed n
odes
10100
100010000
1000001000000
10000000
al vis
ited n
odes
MAAN Analysis-MAANMercury LORMAnal sis Merc r Anal sis LORM
110
1001000
10000100000
100000010000000
1 2 3 4 5 6 7 8 9 10
Tota
l vis
ited n
odes
Number of attributes per resource query
MAAN Analysis-MAANMercury LORMAnalysis-Mercury Analysis-LORM
110
1001000
10000100000
100000010000000
1 2 3 4 5 6 7 8 9 10
Tota
l vis
ited n
odes
Number of attributes per resource query
MAAN Analysis-MAANMercury LORMAnalysis-Mercury Analysis-LORM
110
1001000
10000100000
100000010000000
1 2 3 4 5 6 7 8 9 10
Tota
l vis
ited n
odes
Number of attributes per resource query
MAAN Analysis-MAANMercury LORMAnalysis-Mercury Analysis-LORM
(a) Visited nodes of MAAN/Mercuryand LORM (Proposition 4.9)
3000035000
es SWORD
LORM
1500020000250003000035000
ed n
odes SWORD
LORMAnalysis-SWORDAnalysis-LORM
5000100001500020000250003000035000
al vis
ited n
odes SWORD
LORMAnalysis-SWORDAnalysis-LORM
05000
100001500020000250003000035000
1 2 3 4 5 6 7 8 9 10
Tota
l vis
ited n
odes
Number of attributes per resource query
SWORDLORMAnalysis-SWORDAnalysis-LORM
05000
100001500020000250003000035000
1 2 3 4 5 6 7 8 9 10
Tota
l vis
ited n
odes
Number of attributes per resource query
SWORDLORMAnalysis-SWORDAnalysis-LORM
05000
100001500020000250003000035000
1 2 3 4 5 6 7 8 9 10
Tota
l vis
ited n
odes
Number of attributes per resource query
SWORDLORMAnalysis-SWORDAnalysis-LORM
(b) Visited nodes of SWORD andLORM (Proposition 4.9)
Fig. 6. Searching cost in different resource discoveryapproaches.
average directory size of LORM in the figure are calculatedas the experimental results of Mercury. We can see that theexperimental results of the average directory size of LORMmatch the analytical results as implied in Proposition 4.2.The experimental results of the 99th percentile are also onlyslightly higher than the analytical results due to the samereason observed in Figure 4(b) and (c). In addition, the resultsof the 1st percentile are lower than the analytical results inProposition 4.4. This is because when attribute values arerandomly selected, some values may not be chosen and hencesome nodes in a cluster in LORM may not be assignedresource information.
In general, the experimental results of LORM match theanalytical results. From Figures 4(b), (c) and (d), we canobserve that MAAN and SWORD exhibit significantly largervariance of directory size than Mercury and LORM. MAANand SWORD distribute resource information to directorynodes based on resource attribute. As there are 200 resourceattributes, the information is accumulated in 200 nodes among2048 nodes, leading to large variance of directory size. Onthe other hand, Mercury uses one DHT for each attribute, andclassifies resource information based on value in each DHT.The widespread information distribution helps to distributeresource information uniformly. LORM arranges different Cy-cloid clusters to be responsible for resource information basedon resource attribute and allocates information to a node basedon its range, leading to more balanced information distribution.Therefore, Mercury and LORM can achieve more balanceddistribution of load due to resource information maintenanceand resource discovery operation. This result is in agreementwith Proposition 4.6.
5.2 Efficiency of Resource Discovery
For a non-range query, Proposition 4.7 shows that LORM canreduce the total number of contacted nodes of MAAN by afactor of logn
d = 118 ; Proposition 4.8 shows that Mercury and
SWORD can reduce the total number of contacted nodes ofMAAN by a factor of 2. We conducted an experiment to eval-uate the efficiency of different resource discovery approaches.We varied the number of attributes in a query from 1 to 10with step size of 1. The logical hop metric is measured by thenumber of hops traversed during a search until a query for re-source information reaches its root (i.e., contacted nodes). Werandomly chose 100 nodes and let each node send 10 resourcequeries. Figure 5(a) and (b) show the experimental results ofthe average and total logical hops for multi-attribute resourcequeries versus the number of attributes in a resource queryin Mercury, SWORD, MAAN and LORM. The figures alsoplot the analytical results of LORM and SWORD/Mercurybased on the experimental results of MAAN denoted by“Analysis-LORM” and “Analysis-SWORD/Mercury”. That is,“Analysis-LORM” and “Analysis-SWORD/Mercury” are theexperimental results of MAAN divided by 11
8 and 2, re-spectively. Because the difference between Mercury, SWORDand “Analysis-SWORD/Mercury” is no more than 0.3 inFigure 5(a), and their difference is no more than 800 inFigure 5(b), these curves are completely overlapped. In orderto make the figure clear, we only draw the curve of Mer-cury and also use it to represent SWORD and “Analysis-SWORD/Mercury”. From the figure, we can see that the exper-imental results of LORM is very close to the analytical results,and the experimental results of SWORD/Mercury exactlymatch the the analytical results in Proposition 4.7 and 4.8.
Comparing the different methods, we can see thatMAAN generates the highest number of contacted hops andSWORD/Mercury produce the least number of contacted hops.This is because MAAN needs two lookups for resourceattribute and value, and others only need one lookup. Thereason that LORM has higher number of hops than Mercuryand SWORD is due to their time complexity of lookups. Chordhas a time complexity of O(log n) per query, and Cycloid hasa time complexity of O(d) per query due to its constant-degreefeature. Specifically, LORM is based on Cycloid which has aconstant 7 neighbors per node, whereas Mercury and SWORDhave log n = 12 neighbors each node. Due to the tradeoffbetween the number of neighbors per node and lookup pathlength, Cycloid has high lookup path length. These resultsare consistent with the file lookup path length in [41]. The

11
50000006000000
ing
MercurySWORD
3000000400000050000006000000
searc
hin
g
ost
MercurySWORDMAANLOWER
100000020000003000000400000050000006000000
rect
ory
searc
hin
g
cost
MercurySWORDMAANLOWER
0100000020000003000000400000050000006000000
1 2 3 4 5 6 7 8 9 10
Direct
ory
searc
hin
g
cost
Number of attributes
MercurySWORDMAANLOWER
0100000020000003000000400000050000006000000
1 2 3 4 5 6 7 8 9 10
Direct
ory
searc
hin
g
cost
Number of attributes
MercurySWORDMAANLOWER
0100000020000003000000400000050000006000000
1 2 3 4 5 6 7 8 9 10
Direct
ory
searc
hin
g
cost
Number of attributes
MercurySWORDMAANLOWER
(a) Directory searching cost
5000060000
ing SWORD
LOWER
30000400005000060000
sear
chin
g os
t
SWORDLOWER
100002000030000400005000060000
ecto
ry s
earc
hing
co
st
SWORDLOWER
0100002000030000400005000060000
1 2 3 4 5 6 7 8 9 10
Dire
ctor
y se
arch
ing
cost
SWORDLOWER
0100002000030000400005000060000
1 2 3 4 5 6 7 8 9 10
Dire
ctor
y se
arch
ing
cost
Number of attributes
SWORDLOWER
0100002000030000400005000060000
1 2 3 4 5 6 7 8 9 10
Dire
ctor
y se
arch
ing
cost
Number of attributes
SWORDLOWER
(b) Directory searching cost of LORM and SWORD
100000010000000
ing
100010000
1000001000000
10000000
pro
cess
ing
st
10100
100010000
1000001000000
10000000
query
pro
cess
ing
cost
Mercury SWORDMAAN LORM
110
1001000
10000100000
100000010000000
1 2 3 4 5 6 7 8 9 10Tota
l query
pro
cess
ing
cost
Number of attributes per query
Mercury SWORDMAAN LORM
110
1001000
10000100000
100000010000000
1 2 3 4 5 6 7 8 9 10Tota
l query
pro
cess
ing
cost
Number of attributes per query
Mercury SWORDMAAN LORM
110
1001000
10000100000
100000010000000
1 2 3 4 5 6 7 8 9 10Tota
l query
pro
cess
ing
cost
Number of attributes per query
Mercury SWORDMAAN LORM
(c) Total processing cost
Fig. 7. Searching cost in different resource discovery approaches.
35000004000000
n Routing+visited nodes
150000020000002500000300000035000004000000
ng tim
e in
y (
se
c.)
Routing+visited nodesDirectory seaching
5000001000000150000020000002500000300000035000004000000
ocessin
g tim
e in
Me
rcu
ry (
se
c.)
Routing+visited nodesDirectory seaching
0500000
1000000150000020000002500000300000035000004000000
1 2 3 4 5 6 7 8 9 10
Pro
cessin
g tim
e in
Me
rcu
ry (
se
c.)
Number of attributes
Routing+visited nodesDirectory seaching
0500000
1000000150000020000002500000300000035000004000000
1 2 3 4 5 6 7 8 9 10
Pro
cessin
g tim
e in
Me
rcu
ry (
se
c.)
Number of attributes
Routing+visited nodesDirectory seaching
0500000
1000000150000020000002500000300000035000004000000
1 2 3 4 5 6 7 8 9 10
Pro
cessin
g tim
e in
Me
rcu
ry (
se
c.)
Number of attributes
Routing+visited nodesDirectory seaching
(a) Mercury
6000070000
n Routing+visited nodes
Di t hi
3000040000500006000070000
ng tim
e in
D (
se
c.)
Routing+visited nodesDirectory seaching
10000200003000040000500006000070000
ocessin
g tim
e in
WO
RD
(se
c.)
Routing+visited nodesDirectory seaching
010000200003000040000500006000070000
1 2 3 4 5 6 7 8 9 10
Pro
cessin
g tim
e in
SW
OR
D (
se
c.)
Number of attributes
Routing+visited nodesDirectory seaching
010000200003000040000500006000070000
1 2 3 4 5 6 7 8 9 10
Pro
cessin
g tim
e in
SW
OR
D (
se
c.)
Number of attributes
Routing+visited nodesDirectory seaching
010000200003000040000500006000070000
1 2 3 4 5 6 7 8 9 10
Pro
cessin
g tim
e in
SW
OR
D (
se
c.)
Number of attributes
Routing+visited nodesDirectory seaching
(b) SWORD
60000007000000
n
Routing+visited nodesDirectory seaching
30000004000000500000060000007000000
g tim
e in
(se
c.)
Routing+visited nodesDirectory seaching
1000000200000030000004000000500000060000007000000
cessin
g tim
e in
MA
AN
(sec.)
Routing+visited nodesDirectory seaching
01000000200000030000004000000500000060000007000000
1 2 3 4 5 6 7 8 9 10
Pro
cessin
g tim
e in
MA
AN
(sec.)
Number of attributes
Routing+visited nodesDirectory seaching
01000000200000030000004000000500000060000007000000
1 2 3 4 5 6 7 8 9 10
Pro
cessin
g tim
e in
MA
AN
(sec.)
Number of attributes
Routing+visited nodesDirectory seaching
01000000200000030000004000000500000060000007000000
1 2 3 4 5 6 7 8 9 10
Pro
cessin
g tim
e in
MA
AN
(sec.)
Number of attributes
Routing+visited nodesDirectory seaching
(c) MAAN
400004500050000
n Routing+visited nodes
Di t hi
20000250003000035000400004500050000
ng tim
e in
(sec.)
Routing+visited nodesDirectory seaching
5000100001500020000250003000035000400004500050000
ocessin
g tim
e in
LO
RM
(sec.)
Routing+visited nodesDirectory seaching
05000
100001500020000250003000035000400004500050000
1 2 3 4 5 6 7 8 9 10
Pro
cessin
g tim
e in
LO
RM
(sec.)
Number of attributes
Routing+visited nodesDirectory seaching
05000
100001500020000250003000035000400004500050000
1 2 3 4 5 6 7 8 9 10
Pro
cessin
g tim
e in
LO
RM
(sec.)
Number of attributes
Routing+visited nodesDirectory seaching
05000
100001500020000250003000035000400004500050000
1 2 3 4 5 6 7 8 9 10
Pro
cessin
g tim
e in
LO
RM
(sec.)
Number of attributes
Routing+visited nodesDirectory seaching
(d) LORM
Fig. 8. Searching latency in different resource discovery approaches.
figures also show that the average number and total numberof logical hops increase as the number of attributes in eachresource request grows. It is because a node needs to sendout multiple queries for multiple attributes. This result is inagreement with the analytical result in Proposition 3.4 thatthe number of contacted nodes increases in proportion withthe number of attributes in a resource query.
For a range resource query, after the root node for theresource information is reached, the root node needs to probeother nodes for the requested resources in a range. We usethe number of visited nodes to represent resource searchingefficiency. More visited nodes imply less efficiency in resourcesearching. The proof in Proposition 4.9 shows that to queryan m-attribute resource with range requirement in an n-nodenetwork, the total number of visited nodes is m(1 + n
4 ) inMercury, m(2+ n
4 ) in MAAN, m(1+ d4 ) in LORM and m in
SWORD. Based on the analysis, we calculated the number ofvisited nodes for one query. It is m(1 + n
4 ) = 513m in Mer-cury, m(2+n
4 ) = 514m in MAAN, m(1+ d4 ) = 3m in LORM,
and m in SWORD. The total number of visited nodes for 1000queries is the product of the result and 1000. Figure 6(a)and Figure 6(b) plot the experiment results and analyticalresults of the number of visited nodes versus the numberof attributes per query. Figure 6(a) demonstrates the resultsof MAAN/Mercury and LORM, and Figure 6(b) shows theresults of SWORD and LORM. In Figure 6(a), the results ofMAAN, Mercury, “Analysis-MAAN” and “Analysis-Mercury”are completely overlapped because their values differ no morethan 70000. Therefore, for clarity, we only show the results ofMAAN to represent itself and the others. In the figure, the yaxis is shown in logarithmic scale and MAAN and Mercuryhave dramatically large results. Also, the experimental resultsand analytical results of LORM are completely overlapped.Actually, Figure 6(b) shows that the experimental results ofLORM are a little lower than its analytical results.
Except that the experiment results of LORM are marginallylower than its analysis results, The experimental results ofother methods are almost consistent with their analytical
600700
per
c.) Routing
Di hi
400500600700
ate
ncy p
er
ue
ry (
se
c.) Routing
Directory searching
100200300400500600700
ponse late
ncy p
er
urc
e q
uery
(sec.) Routing
Directory searching
0100200300400500600700
Mercury SWORD MAAN LORM
Response late
ncy p
er
resourc
e q
uery
(sec.) Routing
Directory searching
0100200300400500600700
Mercury SWORD MAAN LORM
Response late
ncy p
er
resourc
e q
uery
(sec.) Routing
Directory searching
0100200300400500600700
Mercury SWORD MAAN LORM
Response late
ncy p
er
resourc
e q
uery
(sec.) Routing
Directory searching
(a) Processing time
67
per
ec.) Routing
4567
late
ncy p
er
uery
(sec.) Routing
Directory searching
1234567
ponse late
ncy p
er
urc
e q
uery
(sec.) Routing
Directory searching
01234567
SWORD LORM
Response late
ncy p
er
resourc
e q
uery
(sec.) Routing
Directory searching
01234567
SWORD LORM
Response late
ncy p
er
resourc
e q
uery
(sec.) Routing
Directory searching
01234567
SWORD LORM
Response late
ncy p
er
resourc
e q
uery
(sec.) Routing
Directory searching
(b) Processing time of SWORD &LORM
Fig. 9. Efficiency of different resource discovery ap-proaches.
results. Mercury and MAAN visit tremendously more nodesthan SWORD and LORM. Recall that Mercury and MAANaccumulate resource information based on attribute value,which spreads along the entire DHT ID space. They need toprobe nodes along a very large ID space. In contrast, SWORDaccumulates resource information based on node attribute. Allinformation of a particular attribute is in one directory node,and no node needs to be probed. Therefore, a resource queryfor an m-attribute resource needs m visit nodes. SWORD’s ex-perimental results exactly match its analytical results. LORMstores resource information of a specific attribute name in acluster, and only the nodes in the cluster should be probed.This limits the node probing scope to a cluster rather than theentire system. As a result, SWORD and LORM incur muchless cost for a range query than Mercury and MAAN.
We note SWORD achieves efficiency at the cost of highinformation maintenance overhead in directory nodes, andhigh directory searching cost. To verify this, we record thedirectory size of each visited node, and use the sum of thesizes to represent the directory searching cost as shown inFigure 7(a). Since the results of LORM and SWORD areoverlapped, we show their results in Figure 7(b) for cleardemonstration. We can see that SWORD leads to higherdirectory searching cost than LORM due to its large directory.Although LORM needs to probe nodes in a cluster, because ofbalanced information distribution, it still has a lower directory

12
searching cost than SWORD. From Figure 7(a), we can alsofind that MAAN and Mercury generate significantly highercost, due to their large number of probed nodes. Also, MAANproduces higher cost than Mercury because of its doubleddirectory size. Considering that the number of visited nodesis significantly larger than the routing hops, we can concludethat LORM is the most efficient in terms of the total searchingcost for resource queries. Since a node communication costsmore than a directory entry search, we assume that each nodecontact consumes 0.2 unit cost, while each directory entry visitconsumes 0.01 unit cost. Figure 7(c) plots the total resourcequery processing cost. We can find that the results are almostthe same as the results in Figures 6(a) and (b) because thelatency of probing constitutes the main part of the latency.
Cost aside, resource querying latency is another importantmetric to measure the efficiency of a resource discoveryapproach. Since node communication takes longer time thandirectory searching at a node and directory searching latencyis based on the directory size, we assume that the time foreach node communication was 0.2 second, and the time foreach directory searching is the product of 0.01 second andthe directory size. Such assumption does not affect the rel-ative performance comparison between different approaches.Communication nodes include the nodes along the route forforwarding resource query and the visited nodes. Figure 8shows the breakdown of total resource querying latency intothe factors of node communication and directory searching. InMercury, SWORD and MAAN, directory searching constitutesthe major part. Mercury and MAAN need to probe nodes forrange query in the entire system, leading to high directorysearching delay. Though SWORD does not need to probenodes, it has all the information of one resource attribute in onenode. Therefore, all queries for the same resource attribute willreach a node which will become a bottleneck, resulting in highsearching delay. With limited probing scope within a clusterand more balanced resource information distribution, LORMhas much less directory searching delay. Although LORM haslonger path length for each lookup operation, its constraintprobing scope saves the latency for node communication.
To be comparable, we choose the results in the case ofone-attribute resource query and put them in one figure.Figure 9(a) and (b) show the average response latency for allresource queries. We can observe that Mercury and MAANtake dramatically longer response latency than SWORD andLORM, and the latency of MAAN is longer than Mercury.It is shown that Mercury and MAAN take approximatelythe same time for routing, and MAAN has longer directorysearching latency than Mercury. The reason that they havealmost the same routing latency is because all queries for allattributes are processed at the same time. However, MAANproduces larger directory size due to its doubled resourceinformation, leading to longer latency for directory searching.From Figure 9(b), we can see that LORM has a shorterresponse latency than SWORD, though it takes longer latencyfor routing. It is because Cycloid has a little longer queryrouting path length than Chord, and LORM needs to probenodes in a cluster for range queries while SWORD doesnot need to probe nodes. However, LORM introduces more
1012
hops
uery
Mercury
SWORD
68
1012
ogic
al hops
urc
e q
uery
Mercury
SWORD
MAAN
2468
1012
vera
ge logic
al hops
er
resourc
e q
uery
Mercury
SWORD
MAAN
LORM
02468
1012
0.05 0.15 0.25 0.35
Avera
ge logic
al hops
per
resourc
e q
uery
Mercury
SWORD
MAAN
LORM
Analysis-Mercury/SWORDAnalysis-LORM
02468
1012
0.05 0.15 0.25 0.35
Avera
ge logic
al hops
per
resourc
e q
uery
Node join/leave rate
Mercury
SWORD
MAAN
LORM
Analysis-Mercury/SWORDAnalysis-LORM
02468
1012
0.05 0.15 0.25 0.35
Avera
ge logic
al hops
per
resourc
e q
uery
Node join/leave rate
Mercury
SWORD
MAAN
LORM
Analysis-Mercury/SWORDAnalysis-LORM
(a) Average number of contactednodes (Propositions 3.3, 4.7, and 4.8)
1000
od
es
ery
Merc r LORM100
1000
ited n
odes
ce q
uery
Mercury LORMMAAN SWORDAnalysis-Mercury Analysis-LORM
1
10
100
1000
rage v
isited n
odes
r re
soru
ce q
uery
Mercury LORMMAAN SWORDAnalysis-Mercury Analysis-LORMAnalysis-MAAN Analysis-SWORD
1
10
100
1000
0.1 0.2 0.3 0.4Avera
ge v
isited n
odes
per
resoru
ce q
uery
Node join/leave rate
Mercury LORMMAAN SWORDAnalysis-Mercury Analysis-LORMAnalysis-MAAN Analysis-SWORD
1
10
100
1000
0.1 0.2 0.3 0.4Avera
ge v
isited n
odes
per
resoru
ce q
uery
Node join/leave rate
Mercury LORMMAAN SWORDAnalysis-Mercury Analysis-LORMAnalysis-MAAN Analysis-SWORD
1
10
100
1000
0.1 0.2 0.3 0.4Avera
ge v
isited n
odes
per
resoru
ce q
uery
Node join/leave rate
Mercury LORMMAAN SWORDAnalysis-Mercury Analysis-LORMAnalysis-MAAN Analysis-SWORD
(b) The number of visited nodes(Propositions 3.3, and 4.9)
Fig. 10. Efficiency of different resource discovery ap-proaches in churn.
balanced resource information distribution, while SWORDaccumulates information of a specific attribute to a single node,so LORM has less directory searching latency than SWORD.The results show that LORM is most efficient in resourcequery processing.
5.3 Performance in a Dynamic Environment
This section evaluates the efficiency of the LORM in a highlydynamic environment in comparison with other approacheswith the DHT stabilization mechanism. In this experiment,the resource join/departure rate R was modelled as a Poissonprocess as in [46]. For example, there is one resource joinand one resource departure every 2.5 seconds with R = 0.4.We varied R from 0.1 to 0.5, with step size of 0.1. We setthe number of total resource requests to 10000. Experimentresults show that there were no failures in all test cases.Figure 10(a) shows the experimental and analytical results ofthe average number of logical hops for a non-range resourcequery as R changes. The analytical results are drawn from theproof of Proposition 4.7 and 4.8. Compared with the logicalhop evaluation in Figure 5 in a static environment, we cansee that the measured number of hops in the presence ofnode joining and leaving is very close to that in a staticenvironment and does not change with the rate R. This isconsistent with Proposition 3.3 that node joins and departuresgenerate little adverse effect on resource querying. We canalso observe that the analytical results are slightly higher thanthe experiment results. This is because that the lookup pathis reduced sometimes due to the node departures. The resultsare also consistent with Proposition 4.7 and 4.8 in terms ofthe number of contacted hops for a resource query.
Figure 10(b) shows the analytical results and experimentalresults of the average visited nodes per range resource query.The results of Mercury, MAAN, “Analysis-Mercury” and“Analysis-Mercury” are overlapped since their results differ nomore than 30. Thus, we only draw the result of Mercury. Theanalytical results are drawn from the proof of Proposition 4.9.First, we can see that the experimental results are consistentwith the analytical results. Because Mercury and MAAN aresystem-wide range resource discovery methods that distributeresource information in all nodes based on attribute values,they incur much more node communication for a resourcequery due to system-wide probing. Second, the results areconsistent with the results in Figure 6 in the static situation.Thus, the results are in agreement with Proposition 3.3 that
13
dynamism generates little adverse effect on the efficiencyof resource querying. In conclusion, the experimental resultsconfirm that LORM can effectively resolve resource queriesin a dynamic environment.
5.4 Summary
In summary, LORM leads to superior performance over exist-ing multi-attribute range querying methods:• It generates lower structure maintenance overhead.• It produces more balanced load distribution among di-
rectory nodes for directory information maintenance andresource discovery.
• It is more efficient in querying with respects of thenumber of hops traversed in routing and the cost ofsearching the directory.
• It is more efficient in query response latency.• It is churn resilient.
6 CONCLUSIONS
Resource discovery is a critical issue for grid systems in whichapplications are composed of hardware and software resources.Previous resource discovery approaches either depend on mul-tiple DHTs with each DHT responsible for a resource or relyon one DHT by pooling resource information of an attributein a single node, leading to high maintenance overhead orinefficiency due to load imbalance. In this paper, we pro-pose a Low-Overhead Range-query Multi-resource discoveryapproach (LORM). Unlike most previous resource discoverymethods which depend on multiple DHTs with each DHTresponsible for a resource, LORM relies on a single DHTwith constant maintenance overhead to achieve range-querymulti-attribute resource discovery with low overhead. It avoidsbottlenecks by achieving a balanced distribution of load due toresource information maintenance as well as resource discov-ery operation itself. Furthermore, LORM is able to deal withdynamic node changes and variation of resource availability.We experimentally and analytically study the performance ofLORM in comparison with the previous resource discoverymethods with regards to their structure maintenance over-head, resource information maintenance overhead and resourcesearching efficiency. We show the consistency of the analyticalresults with the experimental results. Both simulation andanalytical results show the superiority of LORM in comparisonwith other representative approaches in terms of overheadcost and efficiency of range query and multi-attribute resourcediscovery. We plan to further explore and elaborate uponthe LORM design to discover resources based on semanticinformation.
ACKNOWLEDGEMENTS
This research was supported in part by U.S. NSF grants OCI-1064230, CNS-1049947, CNS-1025652, CNS-1025649, CNS-0917056, CNS-0702488, CNS-0914330, and CCF-1016966,Microsoft Research Faculty Fellowship 8300751, and SandiaNational Laboratories grant 10002282.
REFERENCES
[1] D. Abramson, J. Giddy, and L. Kotler. High performanceparametric modelling with Nimrod/G: killer application for theglobal grid? In Proc. of IPDPS, 2000.
[2] A. Andrzejak and Z. Xu. Scalable, efficient range queries forgrid information services. In Proc. of P2P, 2002.
[3] S. Arya, D. M. Mount, N. S. Netanyahu, R. Silverman, andA. Wu. An optimal algorithm for approximate nearest neighborsearching. In Proc. of SODA, 1994.
[4] J. L. Bentle, J. H. Friedman, and R. A. Finkel. An algorithmfor finding best matches in logarithmic expected time. ACMTransactions on Mathematical Software, 3(3):209–226, 1977.
[5] A. R. Bharambe, M. Agrawal, and S. Seshan. Mercury:Supporting scalable multi-attribute range queries. In Proc. ofACM SIGCOMM, pages 353–366, 2004.
[6] D. Boukhelef and H. Kitagawa. Efficient management ofmultidimensional data in structured peer-to-peer overlays. InProc. of VLDB, 2009.
[7] M. Cai, M. Frank, J. Chen, and P. Szekely. MAAN: A multi-attribute addressable network for grid information services.Journal of Grid Computing, 2004.
[8] M. Cai and K. Hwang. Distributed aggregation algorithms withload-balancing for scalable grid resource monitoring. In Proc.of IPDPS, 2007.
[9] S. Castelli, P. Costa, and G. P. Picco. Hypercbr: Large-scalecontent-based routing in a multidimensional space. In Proc. ofINFOCOM, 2008.
[10] C. Chen and D. Agrawal. dBCube: a new class of hierarchi-cal multiprocessor interconnection networks with area efficientlayout. TPDS, 4(12):1332 – 1344, 1993.
[11] H. Chen, H. Jin, J. Wang, L. Chen, Y. Liu, , and L. M. Ni.Efficient multi-keyword search over p2p web. In Proc. of WWW,2008.
[12] A. Datta, M. Hauswirth, R. John, R. Schmidt, and K. Aberer.Range queries in trie-structured overlays. In Proc. of P2P, 2005.
[13] C. Doulkeridis, A. Vlachou, K. Nrvg, Y. Kotidis, and M. Vazir-giannis. Multidimensional routing indices for efficient dis-tributed query processing. In Proc. of CIKM, 2009.
[14] J. Frey, T. Tannenbaum, I. Foster, M. Livny, and S. Tuecke.Condor-G: a computation management agent for multiinstitu-tional grids. In Proc. HPDC, 2001.
[15] A. Fu, P. M. S. Chan, Y. L.Cheung, and Y. S. Moon. Dynamicvp-tree indexing for n-nearest neighbor search given pair-wisedistances. VLDB Journal, 9(2):154–173, 2000.
[16] P. Ganesan, B. Yang, and H. Garcia-molina. One torus to rulethem all: Multi-dimensional queries in p2p systems. In Proc.of WebDB. ACM Press, 2004.
[17] J. Gao and P. Steenkiste. An adaptive protocol for efficientsupport of range queries in DHT-based systems. In Proc. ofICNP, 2004.
[18] D. Guo, H. Chen, Y. Hec, H. Jin, C. Chen, H. Chen, Z. Shu,and G. Huang. Kcube: A novel architecture for interconnectionnetworks. Information Processing Letters, 2010.
[19] D. Guo, Y. Liu, and X. Li. Bake: A balanced kautz tree structurefor peer-to-peer networks. In Proc. of INFOCOM, 2008.
[20] D. Guo, J. Wu, H. Chen, and X. Luo. Moore: An extendablepeer-to-peer network based on incomplete kautz digraph withconstant degree. In Proc. of INFOCOM, 2007.
[21] M. Harchol-Balter and A. Downey. Exploiting process lifetimedistributions for dynamic load balancing. TOCS, 1997.
[22] H. V. Jagadish. Vbi-tree: A peer-to-peer framework for sup-porting multi-dimensional indexing schemes. In Proc. of ICDE,page 34, 2006.
[23] K. V. R. Kanth, D. Agrawal, A. E. Abbadi, and A. Singh.Dimensionality reduction for similarity searching in dynamicdatabases. In Proc. of ACM SIGMOD, 1998.
[24] D. Karger, E. Lehman, T. Leighton, M. Levine, D. Lewin, andR. Panigrahy. Consistent hashing and random trees: Distributed

14
caching protocols for relieving hot spots on the World WideWeb. In Proc. of STOC, pages 654–663, 1997.
[25] D. Li, X. Lu, and J. Wu. FISSIONE: a scalable constant degreeand low congestion DHT scheme based on Kautz graphs. InProc. of INFOCOM, 2005.
[26] J. Li and S. Vuong. Grid resource discovery based on semanticp2p communities. In Proc. of ACM-SAC, 2006.
[27] M. Li, W.-C. Lee, and A. Sivasubramaniam. Dptree: A balancedtree based indexing framework for peer-to-peer systems. InProc. of ICNP, 2006.
[28] Q. Li, L. Feng, J. Pei, S. Wang, X. Zhou, and Q. Zhu. Advancesin Data and Web ManagementJoint International Conferences.Lecture Notes in Computer Science, 2009.
[29] B. Liu, W.-C. Lee, and D. L. Lee. Supporting complex multi-dimensional queries in p2p systems. In Proc. of ICDCS, 2005.
[30] V. March and Y. M. Teo. Multi-attribute range queries in read-only DHT. In Proc. of ICCCN, pages 419–424, 2005.
[31] M. Marzolla, M. Mordacchini, and S. Orlando. Peer-to-peersystems for discovering resources in a dynamic grid. ParallelComputing, 2006.
[32] D. Oppenheimer, J. Albrecht, D. Patterson, and A. Vahdat.Scalable wide-area resource discovery. Technical Report TRCSD04-1334, EECS Dept., Univ. of California, Berkeley, 2004.
[33] D. Papadias, Y. Theodoridis, and E. Stefanakis. Multidimen-sional range query processing with spatial relations. Geograph-ical Systems, 4:343–365, 1997.
[34] F. P. Preparata and J. Vuillemin. The cube-connected cycles: Aversatile network for parallel computation. CACM, 1981.
[35] K. Psounisa, P. M. Fernandezb, B. Prabhakarc, and F. Pa-padopoulosd. Systems with multiple servers under heavy-tailedworkloads. Performance Evaluation, 2005.
[36] S. Ratnasamy, P. Francis, M. Handley, R. Karp, and S. Shenker.A scalable content-addressable network. In Proc. of ACMSIGCOMM, pages 329–350, 2001.
[37] A. Rowstron and P. Druschel. Pastry: Scalable, decentralizedobject location and routing for large-scale peer-to-peer systems.In Proc. of Middleware, 2001.
[38] T. Schtt, F. Schintke, and A. Reinefeld. A structured overlay formulti-dimensional range queries. In Proc. of Euro-Par, 2007.
[39] H. Shen. A p2p-based intelligent resource discovery mechanismin internet-based distributed systems. JPDC, 2008.
[40] H. Shen, A. Apon, and C. Xu. LORM: Supporting low-overhead p2p-based range-query and multi-attribute resourcemanagement in grids. In Proc. of ICPADS, 2007.
[41] H. Shen, C. Xu, and G. Chen. Cycloid: A scalableconstant-degree P2P overlay network. Performance Evaluation,63(3):195–216, 2006.
[42] H. Shen and C.-Z. Xu. Hash-based proximity clustering forefficient load balancing in heterogeneous dht networks. JPDC,2008.
[43] X. Shen and Z. Li. Multi-dimensional queries in dht-basedpeer-to-peer systems. In Proc. of SKG, 2009.
[44] Y. Shu, B. C. Ooi, K.-L. Tan, and A. Zhou. Supporting multi-dimensional range queries in peer-to-peer systems. In Proc. ofP2P, 2005.
[45] D. Spence and T. Harris. XenoSearch: Distributed resourcediscovery in the XenoServer open platform. In Proc. of HPDC,pages 216–225, 2003.
[46] I. Stoica, R. Morris, D. Liben-Nowell, D. R. Karger, M. F.Kaashoek, F. Dabek, and H. Balakrishnan. Chord: A scal-able peer-to-peer lookup protocol for Internet applications.IEEE/ACM TON, 11(1):17–32, 2003.
[47] H. Sun, J. Huais, Y. Liu, and R. Buyya. RCT: A distributedtree for supporting efficient range and multi-attribute queries ingrid computing. Future Generation Computer Systems, 2008.
[48] X. Sun. SCAN: A small-world structured p2p overlay for multi-dimensional queries. In Proc. of WWW, 2007.
[49] L. Weng, U. Catalyurek, T. Kurc, G. Agrawal, and J. Saltz.Optimizing multiple queries on scientific datasets with partial
replicas. In Proc. of Grid Computing, 2007.[50] W. Willinger, M. S. Taqqu, R. Sherman, and D. V. Wilson.
Self-similarity through high-variability: statistical analysis ofethernet lan traffic at the source level. TON, 1997.
[51] D. Wu, Y. Tian, and K.-W. Ng. Roogle: Supporting efficienthigh-dimensional range queries in P2P systems. In Proc. ofEuro-Par, 2006.
[52] P. Yalagandula and M. Dahlin. A scalable distributed informa-tion management system. In Proc. of ACM SIGCOMM, 2004.
[53] L. Zhang, Z. Wang, and D. Feng. Two-level indexing for high-dimensional range queries in peer-to-peer networks. In Proc. ofMMSP, 2009.
[54] M. Zhang and J. Q. Yang. A multi-dimensional query schemein structured overlays. Key Engineering Materials, 2010.
[55] X. Zhang, Y. Qu, and L. Xiao. Improving distributed workloadperformance by sharing both cpu and memory resources. InProc. of ICDCS, pages 233–241, 2000.
[56] Y. Zhang, L. Liu, D. Li, and X. Lu. DHT-based range queryprocessing for web service discovery. In Proc. of ICWS, 2009.
[57] Z. Zhang, S.-M. Shi, and J. Zhu. SOMO: Self-organizedmetadata overlay for resource management in P2P DHT. InProc. of IPTPS, 2003.
[58] B. Y. Zhao, L. Huang, J. Stribling, S. C. Rhea, A. D. Joseph,and J. Kubiatowicz. Tapestry: An infrastructure for fault-tolerantwide-area location and routing. J-SAC, 12(1):41–53, 2004.
[59] C. Zheng, G. Shen, S. Li, and S. Shenker. Distributed segmenttree: Support of range query and cover query over DHT. InProc. of IPTPS, 2006.
Haiying Shen received the BS degree in Computer Science and Engineering from Tongji University, China in 2000, and the MS and Ph.D. degrees in Computer Engineering from Wayne State University in 2004 and 2006, respectively. She is currently an Assistant Professor in the Holcombe Department of Electrical and Computer Engineering at Clemson University. Her research interests include distributed and parallel computer systems and computer networks, with an emphasis on peer-to-peer and content delivery networks, mobile computing, wireless sensor networks, and grid and cloud computing. She was the Program Co-Chair for a number of international conferences and member of the Program Committees of many leading conferences. She is a Microsoft Faculty Fellow of 2010 and a member of the IEEE and ACM.
Cheng-Zhong Xu received B.S. and M.S. degrees from Nanjing University in 1986 and 1989, respectively, and a Ph.D. degree in Computer Science from the University of Hong Kong in 1993. He is currently a Professor in the Department of Electrical and Computer Engineering of Wayne State University and the Director of Sun’s Center of Excellence in Open Source Computing and Applications. His research interests are mainly in distributed and parallel systems, particularly in scalable and secure Internet services, autonomic cloud management, energy-aware task scheduling in wireless embedded systems, and high performance cluster and grid computing. He has published more than 160 articles in peer-reviewed journals and conferences in these areas. He is the author of Scalable and Secure Internet Services and Architecture (Chapman & Hall/CRC Press, 2005) and a co-author of Load Balancing in Parallel Computers: Theory and Practice
Haiying Shen Haiying Shen received the BSdegree in Computer Science and Engineeringfrom Tongji University, China in 2000, and theMS and Ph.D. degrees in Computer Engineeringfrom Wayne State University in 2004 and 2006,respectively. She is currently an Assistant Pro-fessor in the Holcombe Department of Electricaland Computer Engineering at Clemson Univer-sity. Her research interests include distributedand parallel computer systems and computernetworks, with an emphasis on peer-to-peer and
content delivery networks, mobile computing, wireless sensor networks,and grid and cloud computing. She was the Program Co-Chair fora number of international conferences and member of the ProgramCommittees of many leading conferences. She is a Microsoft FacultyFellow of 2010 and a member of the IEEE and ACM.-0.2in
Haiying Shen received the BS degree in Computer Science and Engineering from Tongji University, China in 2000, and the MS and Ph.D. degrees in Computer Engineering from Wayne State University in 2004 and 2006, respectively. She is currently an Assistant Professor in the Holcombe Department of Electrical and Computer Engineering at Clemson University. Her research interests include distributed and parallel computer systems and computer networks, with an emphasis on peer-to-peer and content delivery networks, mobile computing, wireless sensor networks, and grid and cloud computing. She was the Program Co-Chair for a number of international conferences and member of the Program Committees of many leading conferences. She is a Microsoft Faculty Fellow of 2010 and a member of the IEEE and ACM.
Cheng-Zhong Xu received B.S. and M.S. degrees from Nanjing University in 1986 and 1989, respectively, and a Ph.D. degree in Computer Science from the University of Hong Kong in 1993. He is currently a Professor in the Department of Electrical and Computer Engineering of Wayne State University and the Director of Sun’s Center of Excellence in Open Source Computing and Applications. His research interests are mainly in distributed and parallel systems, particularly in scalable and secure Internet services, autonomic cloud management, energy-aware task scheduling in wireless embedded systems, and high performance cluster and grid computing. He has published more than 160 articles in peer-reviewed journals and conferences in these areas. He is the author of Scalable and Secure Internet Services and Architecture (Chapman & Hall/CRC Press, 2005) and a co-author of Load Balancing in Parallel Computers: Theory and Practice
Cheng-Zhong Xu Cheng-Zhong Xu receivedB.S. and M.S. degrees from Nanjing Universityin 1986 and 1989, respectively, and a Ph.D.degree in Computer Science from the Universityof Hong Kong in 1993. He is currently a Profes-sor in the Department of Electrical and Com-puter Engineering of Wayne State Universityand the Director of Sun’s Center of Excellencein Open Source Computing and Applications.His research interests are mainly in distributedand parallel systems, particularly in scalable and
secure Internet services, autonomic cloud management, energy-awaretask scheduling in wireless embedded systems, and high performancecluster and grid computing. He has published more than 160 articles inpeer-reviewed journals and conferences in these areas. He is the authorof Scalable and Secure Internet Services and Architecture (Chapman &Hall/CRC Press, 2005) and a co-author of Load Balancing in ParallelComputers: Theory and Practice (Kluwer Academic/Springer, 1997).He serves on five journal editorial boards including IEEE TPDS andJPDC. He was a program chair or general chair of a number of con-ferences, including Infoscale’08, EUC’08, and GCC’07. He is a recipientof the Faculty Research Award of Wayne State University in 2000, thePresident’s Award for Excellence in Teaching in 2002, and the CareerDevelopment Chair Award in 2003. He is a senior member of the IEEE.