levels & trends in report 2015 child - home | unicef · pdf file ·...
TRANSCRIPT

Levels & Trends in
Child Mortality
Report 2015Estimates Developed by the UN Inter-agency Group for Child Mortality Estimation
United Nations
Levels & Trends in
Child Mortality
Report 2014Estimates Developed by the UN Inter-agency Group for Child Mortality Estimation
United Nations

This report was prepared at UNICEF headquarters by Danzhen You, Lucia Hug, Simon Ejdemyr and Jan Beise, with the support of Priscilla Idele, on behalf of the United Nations Inter-agency Group for Child Mortality Estimation (UN IGME).
Organizations and individuals involved in generating country-speci!c estimates of child mortality
United Nations Children’s FundDanzhen You, Lucia Hug, Simon Ejdemyr, Jan Beise, Priscilla Idele
World Health OrganizationColin Mathers, Ties Boerma, Daniel Hogan, Jessica Ho, Wahyu Retno Mahanani
The World BankEmi Suzuki
United Nations, Department of Economic and Social Affairs, Population DivisionPatrick Gerland, Francois Pelletier, Lina Bassarsky, Victor Gaigbe-Togbe, Danan Gu, Vladimira Kantorova, Nan Li, Cheryl Sawyer, Thomas Spoorenberg
United Nations Economic Commission for Latin America and the Caribbean, Population DivisionGuiomar Bay
Special thanks to the Technical Advisory Group of the UN IGME for providing technical guidance on methods for child mortality estimation
Robert Black (Chair), Johns Hopkins UniversityLeontine Alkema, University of Massachusetts, AmherstSimon Cousens, London School of Hygiene and Tropical MedicineTrevor Croft, The DHS Program, ICF InternationalMichel Guillot, University of Pennsylvania
Special thanks to the United States Agency for International Development for supporting UNICEF’s child mortality estimation work. Thanks also go to the Joint United Nations Programme on HIV/AIDS for sharing estimates of AIDS mortality. Further thanks go to Monica Alexander and Jin Rou New from the University of California, Berkeley and Fengqing Chao from the National University of Singapore for their assistance in preparing the UN IGME estimates as well as Jing Liu from Fafo for preparing the underlying data. And special thanks to Lijuan Kang, Colleen Murray and Khin Wityee Oo from UNICEF for fact-checking and proofreading. Thanks also go to Jeffrey O’Malley (Director, Division of Data, Research, and Policy), George Laryea-Adjei (Deputy Director, Division of Data, Research, and Policy), Tessa Wardlaw, Attila Hancioglu, Holly Newby, Agbessi Amouzou, Robert Bain, Nassim Benali, Ivana Bjelic, Lili-ana Carvajal, Yadigar Coskun, Emily Garin, Shane Mohammed Khan, Julia Krasevec, Karoline Hassfurter, Claes Johansson, Melinda Murray, Rada Noeva, Bo Pedersen, Tom Slaymaker, Turgay Unalan, Daniel Vadnais and Upasana Young from UNICEF, Cynthia Boschi Pinto, Bernadette Daelmans, Matthews Mathai and Marta Seoane from the World Health Organization, and Mohamed Mahmoud Ali from the World Health Organization Regional Of!ce of the Eastern Mediterranean for their support.
Natalie Leston edited the report.Era Porth laid out the report.
Copyright © 2015by the United Nations Children’s Fund
The Inter-agency Group for Child Mortality Estimation (UN IGME) constitutes representatives of the United Nations Children’s Fund, the World Health Organization, the World Bank and the United Nations Population Division. The child mortality estimates presented in this report have been reviewed by UN IGME members. As new information becomes available, estimates will be updated by the UN IGME. Differences between the estimates presented in this report and those in forthcoming publications by UN IGME members may arise because of differences in reporting periods or in the availability of data during the production process of each publication and other evidence.
The designations employed and the presentation of the material in this publication do not imply the expression of any opinion what-soever on the part of UNICEF, the World Health Organization, the World Bank or the United Nations Population Division concerning the legal status of any country, territory, city or area or of its authorities, or concerning the delimitation of its frontiers or boundaries. Dotted lines on maps represent approximate border lines for which there may not yet be full agreement.
United Nations Children’s Fund3 UN Plaza, New York, New York, 10017 USA
The World Bank1818 H Street, NW, Washington, DC, 20433 USA
World Health OrganizationAvenue Appia 20, 1211 Geneva 27, Switzerland
United Nations Population Division2 UN Plaza, New York, New York, 10017 USA
Bruno Masquelier, University of LouvainKenneth Hill, Harvard University Jon Pedersen, FafoNeff Walker, Johns Hopkins University
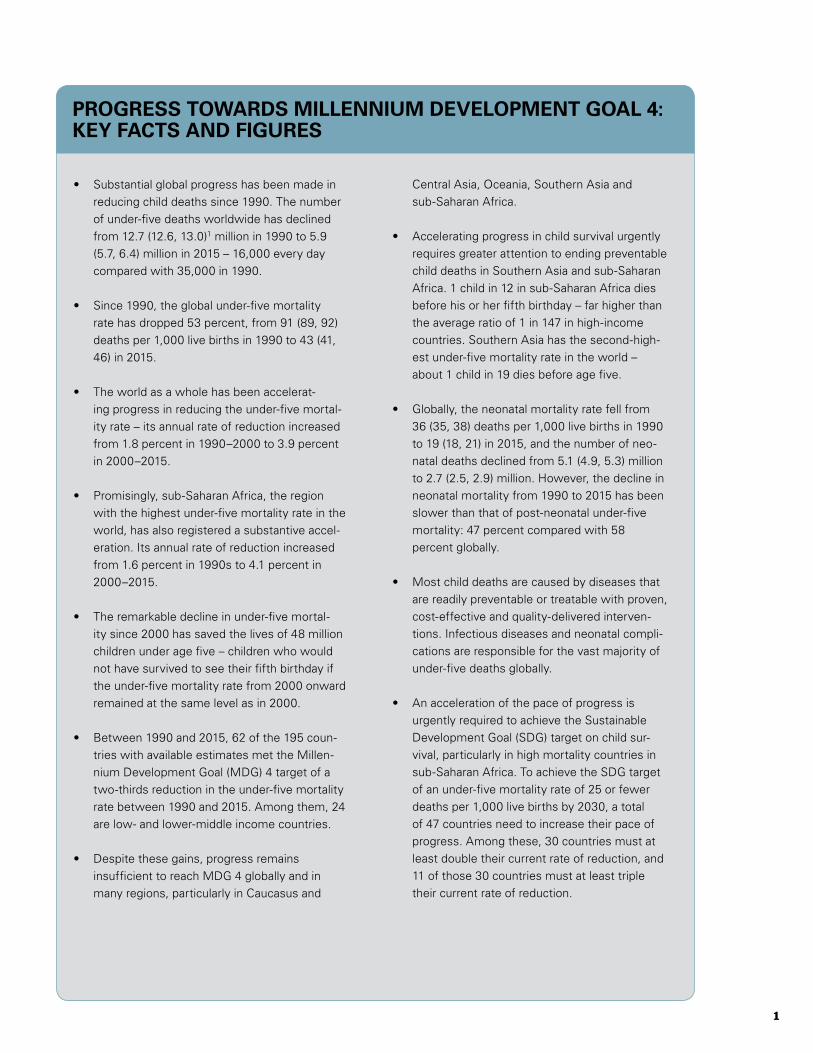
PROGRESS TOWARDS MILLENNIUM DEVELOPMENT GOAL 4: KEY FACTS AND FIGURES
1

IntroductionChild mortality is a core indicator for child health and well-being. In 2000, world leaders agreed on the Millennium Development Goals (MDGs) and called for reducing the under-!ve mortality rate by two thirds between 1990 and 2015 – known as the MDG 4 target. In recent years, the Global Strategy for Women’s and Children’s Health launched by United Nations Secretary-General Ban Ki-moon and the Every Woman Every Child movement boosted global momentum in improving newborn and child survival as well as maternal health. In June 2012, world leaders renewed their commitment during the global launch of Committing to Child Survival: A Promise Renewed, aiming for a continued post-2015 focus to end preventable child deaths. With the end of the MDG era, the international community is in the process of agreeing on a new framework – the Sustainable Development Goals (SDGs). The proposed SDG target for child mortality represents a renewed commitment to the world’s children: By 2030, end preventable deaths of newborns and children under !ve years of age, with all countries aiming to reduce neonatal mortality to at least as low as 12 deaths per 1,000 live births and under-!ve mortality to at least as low as 25 deaths per 1,000 live births.
In the concluding year of the MDGs, it is time to take stock of what has been achieved so far, to
consider whether the promises made to children worldwide have been ful!lled, and to share success stories or, conversely, learn lessons from failures. As the SDGs are endorsed in New York in September this year, the United Nations Secretary-General will launch a renewed Global Strategy for Women’s, Children’s and Adolescents’ Health. The strategy is a road map to achieving the ambitious SDG goal on health: “Ensure healthy lives and promote well-being for all at all ages,” including to end preventable deaths of newborns and children. It is time to look beyond, to the post-2015 SDGs, to identify potential challenges to ending preventable deaths of newborns and children under age !ve.
Evidence-based estimation of child mortality is a cornerstone for tracking progress towards child survival goals and for planning national and global health strategies, policies and interventions on child health and well-being. The United Nations Inter-agency Group for Child Mortality Estimation (UN IGME) updates child mortality estimates annually. This report presents the group’s latest estimates of under-!ve, infant and neonatal mortality up to the year 2015, and assesses progress at the country, regional and global levels. The report also provides an overview on the estimation methods used for child mortality indicators.
2

Levels and Trends in Child!Mortality
Progress in the MDG eraMajor progress has been made in reducing child mortality throughout the world. Encouragingly, this progress has been accelerating in recent years and has saved millions of lives of children under age !ve. Yet, despite substantial gains, progress is insuf!cient to achieve the MDG 4 target.
Remarkable progress: The world has made substantial progress in improving child survival in the past 25 years. The global under-!ve mortality rate dropped 53 (50, 55) percent, from 91 (89, 92) deaths per 1,000 live births in 1990 to 43 (41, 46) in 2015 (Table 1). Over the same period, the annual number of under-!ve deaths dropped from 12.7 million to 5.9 million (Table 2).
At the regional level, all MDG regions except Oceania have more than halved the under-!ve
mortality rate. Eastern Asia, Latin America and the Caribbean, and Northern Africa have reduced the under-!ve mortality rate by two thirds or more since 1990 (Table 1 and Figure 1). At the country level, about a third of countries (62) have reduced their under-!ve mortality by two thirds or more and achieved the MDG 4 target set in 2000. Among them are 12 low-income countries (Cambodia, Ethiopia, Eritrea, Liberia, Madagascar, Malawi, Mozambique, Nepal, Niger, Rwanda, Uganda, and United Republic of Tanzania) another dozen are lower-middle income countries (Armenia, Bangladesh, Bhutan, Bolivia (Plurinational State of), Egypt, El Salvador, Georgia, Indonesia, Kyrgyzstan, Nicaragua, Timor-Leste and Yemen). An additional 74 countries reduced their under-!ve mortality rates by at least half, and another 41 countries by at least 30 percent.
TABLE 1 Levels and trends in the under-five mortality rate, by Millenium Development Goal region,
1990-2015
Region
Under-five mortality rate (deaths per 1,000 live births)
Decline (percent)
1990–2015
Annual rate of reduction (percent)
1990 1995 2000 2005 2010 2015
MDG target 2015
1990–2015
1990–2000
2000–2015
Developed regions 15 11 10 8 7 6 5 60 3.7 3.9 3.5Developing regions 100 94 83 69 57 47 33 54 3.1 1.8 3.9
Northern Africa 73 57 44 35 28 24 24 67 4.4 5.0 4.1Sub-Saharan Africa 180 172 154 127 101 83 60 54 3.1 1.6 4.1Latin America and the Caribbean 54 42 32 25 24 18 18 67 4.4 5.2 3.9Caucasus and Central Asia 73 74 63 49 39 32 24 56 3.3 1.4 4.6Eastern Asia 53 46 37 24 16 11 18 79 6.3 3.7 8.1
Eastern Asia excluding China 27 33 30 19 16 14 9 49 2.7 -1.1 5.3Southern Asia 126 109 92 76 62 51 42 59 3.6 3.2 3.9
Southern Asia excluding India 126 109 93 79 68 59 42 53 3.0 3.0 3.1South-eastern Asia 72 59 49 40 33 27 24 62 3.9 3.9 3.9Western Asia 66 54 43 35 27 22 22 66 4.3 4.3 4.3Oceania 74 70 67 64 57 51 25 32 1.5 1.1 1.9
World 91 85 76 63 52 43 30 53 3.0 1.8 3.9
Note: All calculations are based on unrounded numbers.
3

Acceleration in progress: Encouragingly, progress in improving child survival has been accelerated in the 2000–2015 period compared with the 1990s. Globally, the annual rate of reduction in the under-!ve mortality rate has increased from 1.8 (1.6, 1.9) percent in 1990–2000 to 3.9 (3.4, 4.1) percent in 2000–2015. Especially promising, sub-Saharan Africa, the region with the highest under-!ve mortality rate in the world (Map 1), has also registered an acceleration in reducing under-!ve mortality. Its annual rate of reduction increased from 1.6 (1.4, 1.7) percent in the 1990s to 4.1 (3.4, 4.6) percent in 2000–2015. Of the 49 sub-Saharan African countries, all but 5 had a higher annual rate of reduction in the 2000–2015 period as compared with the 1990s (Map 2). Also, 21 sub-Saharan African countries have at least tripled their annual rates of reduction from the 1990s or reversed an increasing mortality trend in 2000–2015 compared with the 1990s: Angola, Botswana, Burkina Faso, Burundi, Cameroon, Central African Republic, Congo, Côte d’Ivoire, Gabon, Kenya, Lesotho, Mauritania, Namibia, Rwanda, Senegal, Sierra Leone, Somalia, South Africa, Swaziland, Zambia and Zimbabwe.
FIGURE 1
Under-five mortality declined in all regions between 1990 and 2015
TABLE 2 Levels and trends in the number of deaths of children under age five, by Millennium Development Goal region,
1990-2015
Region
Under-five deaths (thousands) Decline (percent)
1990–2015
Share of global under-five deaths (percent)
1990 1995 2000 2005 2010 2015 1990 2015
Developed regions 223 154 129 111 96 80 64 1.7 1.3
Developing regions 12,526 10,840 9,654 8,189 6,917 5,865 53 98.3 98.7
Northern Africa 280 194 142 121 111 114 59 2.2 1.9
Sub-Saharan Africa 3,871 4,079 4,114 3,748 3,292 2,947 24 30.4 49.6
Latin America and the Caribbean 632 494 378 280 258 196 69 5.0 3.3
Caucasus and Central Asia 145 120 88 72 68 62 58 1.1 1.0
Eastern Asia 1,662 851 615 424 266 194 88 13.0 3.3
Eastern Asia excluding China 28 42 30 18 15 12 55 0.2 0.2
Southern Asia 4,796 4,154 3,566 2,916 2,398 1,891 61 37.6 31.8
Southern Asia excluding India 1,439 1,215 1,053 872 803 690 52 11.3 11.6
South-eastern Asia 856 702 542 457 371 331 61 6.7 5.6
Western Asia 270 231 192 156 136 117 57 2.1 2.0
Oceania 14 15 16 16 15 13 6 0.1 0.2
World 12,749 10,994 9,783 8,299 7,013 5,945 53 100.0 100.0
Note: All calculations are based on unrounded numbers.
0
50
100
150
200
Sub-
Saha
ran
Afr
ica
Sout
hern
Asi
a
Oce
ania
Cau
casu
s an
d C
entr
al A
sia
Sout
h-ea
ster
n A
sia
Wes
tern
Asi
a
Nor
ther
n A
fric
a
Latin
Am
eric
a an
d th
e C
arib
bean
East
ern
Asi
a
Dev
elop
ed re
gion
s
Dev
elop
ing
regi
ons
Wor
ld
2015 !1990 MDG target for 2015
180
83
126
51
74
51
7324
7332
7227
6622
5418
5311 15
610
047
9143
4

MAP 1
Children in sub-Saharan Africa and Southern Asia face a higher risk of dying before their fifth birthday
MAP 2
A total of 21 sub-Saharan African countries have at least tripled their rate of progress in recent years or reversed an increasing mortality trend in 2000–2015 compared with the 1990s
Notes: The classification is based on unrounded numbers. This map does not reflect a position by UN IGME agencies on the legal status of any country or territory or the delimitation of any frontiers.
Notes: The classification is based on unrounded numbers. This map does not reflect a position by UN IGME agencies on the legal status of any country or territory or the delimitation of any frontiers.
5
Lives saved: The remarkable improvements in child survival since 2000 have saved the lives of 48 million children under age !ve – children who survived as the under-!ve mortality rate has fallen from 2000 onward. These children would have died had mortality remained at the same level as in 2000 in each country. Accelerated progress since 2000 has saved the lives of about 18 million children globally, accounting for nearly 40 percent of the 48 million children saved. In other words, 18 million children would not have survived to see their !fth birthday had the under-!ve mortality rate declined at the same pace it did in the 1990s.2
Un!nished business: Yet, despite substantial gains in improving child survival, progress has been insuf!cient to achieve MDG 4 worldwide. The 53 percent decline in the under-!ve mortality rate globally is far from the two-thirds reduction required to meet the MDG 4 target. If current trends continue, the world as a whole would reach the MDG 4 target in 2026 – more than 10 years behind schedule. The toll of under-!ve deaths over the past two decades is staggering: between 1990 and 2015, 236 (234, 240) million children worldwide died before their !fth birthday – more than today’s population of Brazil, the world’s !fth-most populous country. Had the necessary steady progress been made since 2000 to achieve MDG 4, 14 million more children would have survived to age !ve since 2000.
The work that remains in the SDG eraChild survival remains an urgent concern. It is unacceptable that about 16,000 children still die every single day – equivalent to 11 deaths occurring every minute. Without any further acceleration to the current pace of reduction in under-!ve mortality, a projected 69 million children – more than the current population of Thailand – will die before they reach their !fth birthday between now and 2030, the SDG target year, with 3.6 million of these lives lost in the year 2030 alone. These numbers are still unacceptably high. A concerted effort is needed to further accelerate the pace of progress, and countries and the international community must invest further to end preventable child deaths.
Which areas to focus on: Sub-Saharan Africa remains the region with the highest under-!ve mortality rate in all regions in the world, with 1 child in 12 dying before his or her !fth
birthday – far higher than the average ratio of 1 in 147 in high-income countries. The region is home to most of the highest mortality countries in the world (Map 1). The seven countries with an under-!ve mortality rate above 100 are all located in sub-Saharan Africa. Moreover, extended efforts are needed to provide the necessary services and interventions given the expected growing number of births and child populations in this region – with a 95 percent probability the number of children under age !ve in sub-Saharan Africa will grow by an extra 26–57 million (with a median of 42 million), from 157 million in 2015 to between 183 and 214 million in 2030.3 The region may face unique challenges in reducing the number of child deaths: the number of under-!ve deaths in sub-Saharan Africa may increase or stagnate even with a declining under-!ve mortality rate if the decline in the mortality rate does not outpace the increase in population, as observed during the 1990s.
Southern Asia is another region where acceleration in reducing child mortality is urgently required. The under-!ve mortality rate in this region is still high – 51 deaths per 1,000 live births in 2015. Three in 10 global under-!ve deaths occur in Southern Asia.
Which age group to focus on: The !rst 28 days of life – the neonatal period – are the most vulnerable time for a child’s survival. Neonatal mortality is becoming increasingly important not only because the share of under-!ve deaths occurring during the neonatal period has been increasing, but also because the health interventions needed to address the major causes of neonatal deaths generally differ from those needed to address other under-!ve deaths, and are closely linked to those that are necessary to protect maternal health.
Globally, the neonatal mortality rate fell from 36 (35, 38) deaths per 1,000 live births in 1990 to 19 (18, 21) in 2015, and the number of neonatal deaths declined from 5.1 (4.9, 5.3) million to 2.7 (2.5, 2.9) million (Table 3). However, the decline in neonatal mortality over 1990–2015 has been slower than that of post-neonatal under-!ve mortality (1-59 months): 47 percent, compared with 58 percent globally. This pattern applies to most low- and middle-income countries (Figure 2).
6

TABLE 3 Neonatal mortality rate, number of neonatal deaths and neonatal deaths as a share of under-five deaths, by
Millennium Development Goal region, 1990 and 2015
Neonatal mortality rate (deaths per 1,000 live births)
Number of neonatal deaths (thousands)
Neonatal deaths as a share of under-five deaths (percent)
Region 1990 2015
Decline (percent) 1990–2015 1990 2015 1990 2015
Relative increase (percent)
1990–2015
Developed regions 8 3 58 116 44 52 55 5
Developing regions 40 21 47 4,990 2,639 40 45 13
Northern Africa 31 14 56 117 66 42 58 38
Sub-Saharan Africa 46 29 38 994 1,027 26 35 36
Latin America and the Caribbean 22 9 58 255 102 40 52 29
Caucasus and Central Asia 29 16 44 57 31 40 51 29
Eastern Asia 29 6 81 939 100 57 52 -9
Eastern Asia excluding China 12 7 38 11 7 41 53 30
Southern Asia 57 29 49 2,179 1,078 45 57 26
Southern Asia excluding India 56 32 42 642 382 45 55 24
South-eastern Asia 28 13 52 326 165 38 50 31
Western Asia 29 12 57 117 64 43 55 27
Oceania 28 22 22 5 6 37 43 15
World 36 19 47 5,106 2,682 40 45 13
FIGURE 2
Progress in reducing neonatal mortality rate is slower than for the post-neonatal under-five mortality rate in the majority of countries
Our projections indicate that if current trends continue, around half of the 69 million child deaths between 2016 and 2030 will occur during the neonatal period. The share of neonatal deaths is projected to increase from 45 percent of under-!ve deaths in 2015 to 52 percent in 2030. Moreover, 63 countries need to accelerate progress to reach the SDG target of a neonatal mortality rate of 12 deaths per 1,000 live births by 2030 – more than the 47 countries for the under-!ve mortality target.
For too many babies, their day of birth is also their day of death: almost 1 million neonatal deaths occur on the day of birth, and close to 2 million die in the !rst week of life. In order to continue to accelerate progress, it is critical to ensure that every pregnant woman and every newborn has access to and receives good quality care and life-saving interventions. The vast majority of maternal and newborn deaths can be prevented by relatively straightforward effective interventions. Quality of care in delivering these interventions along the continuum of care during pre-pregnancy, antenatal, intra-partum, childbirth and post-natal periods is paramount to ensure progress.2
Note: All calculations are based on unrounded numbers.
4
2
0
3
1
-1
-1 0 1 2 3 4
Ann
ual r
ate
of r
educ
tion
of p
ost-
neon
atal
und
er-fi
ve
mor
talit
y ra
te in
199
0-20
15 (p
erce
nt)
Annual rate of reduction of neonatal mortality rate in 1990-2015 (percent)
7

While focus is needed to prevent neonatal deaths, continued preventive and curative life-saving interventions need to be provided to children beyond the neonatal period in countries where the post-neonatal under-!ve mortality rate is still high, in particular in 29 sub-Saharan African countries, where post-neonatal under-!ve deaths account for at least 60 percent of under-!ve deaths.
Which conditions to focus on: Understanding the causes of child mortality provides important public health insights. Renewing the promise of survival for children relies on tracking and addressing the leading causes of deaths. Infectious diseases (such as pneumonia and diarrhoea) and neonatal complications are responsible for the vast majority of under-!ve deaths globally. According to the latest estimates by WHO and the Maternal and Child Epidemiology Estimation Group4 of the 5.9 million deaths in children under !ve that occurred in 2015, about half were caused by infectious diseases and conditions such as pneumonia, diarrhoea, malaria, meningitis, tetanus, HIV and measles. The main killers of children under age !ve in 2015 include
pneumonia (17 percent), preterm birth complications (16 percent), neonatal intra-partum-related complications (11 percent), diarrhoea (8 percent), neonatal sepsis (7 percent) and malaria (5 percent). Importantly, almost half of all under-!ve deaths are attributable to undernutrition,5 while more than 80 percent of neonatal deaths occur among newborn infants of low birth weight in the highest burden settings.6 In summary, most child deaths are caused by diseases that are readily preventable or treatable with proven, cost-effective interventions. Action must be taken immediately to save children’s lives by expanding effective preventive and curative interventions.
Acceleration urgently required to achieve SDG target: Currently, 79 countries have an under-!ve mortality rate above 25, and 47 of them will not meet the proposed SDG target of 25 deaths per 1,000 live births by 2030 if they continue their current trends in reducing under-!ve mortality. The acceleration needed to reach the goals in those 47 countries is substantial – 30 countries must at least double their current rate of reduction, and 11 of those 30 countries must at least triple their current rate of reduction.
MAP 3
Current progress must be accelerated to reach the SDG target
Notes: The classification is based on unrounded numbers. This map does not reflect a position by UN IGME agencies on the legal status of any country or territory or the delimitation of any frontiers.
8

Among these 47 countries, 34 are in sub-Saharan Africa. If current trends continue, many of these countries are not expected to meet the SDG target until after 2050 (Map 3). If all countries meet the SDG target by 2030, a total of 56 million children would die – 38 million less than the 94 million children under the age of 5 who would die between 2016 and 2030 if under-!ve mortality rates remain at today’s levels.
The challenge of meeting the SDG target of a neonatal mortality rate of 12 or fewer deaths per 1,000 live births is more substantial. To reach that target, 63 countries will need to accelerate their current rates of reduction.
Focus for low mortality countries: Of the 195 countries with available estimates, 116 have already achieved the SDG target with an under-!ve mortality rate of 25 or fewer deaths per 1,000 live births. Of these low-mortality countries, a third have an under-!ve mortality rate that is below 5, and 16 are still above 20. If current trends continue, 44 of these low-mortality countries are not expected to meet today’s under-!ve mortality rate of the high-income countries of 6.8 deaths per 1,000 live births by 2030, and around 6 million children would die in these 116 countries between 2016 and 2030. By contrast, if all these countries, by 2016, reduced their under-!ve mortality rate to the current lowest level of 2·3 deaths per 1,000 live births observed among countries with more than 10,000 live births in 2015, an additional 3.5 million children would be saved between 2016 and 2030. This means that there is still work to be done in improving child survival even within this group of countries.
Wide gaps in child mortality across sub-groups or areas within countries have been documented in this group of nations, warranting a call for an equity-focused approach to reducing child mortality. For example, Brazil is one of the countries that succeeded in signi!cantly reducing child mortality. The country as a whole has met MDG 4 – the under-!ve mortality rate in Brazil declined from 61 in 1990 to 16 in 2015,
a 73 percent reduction. Although Brazil has also managed to reduce regional inequities in child mortality in the past 25 years, disparities still persist in the country. Out of roughly 5,500 municipalities, more than 1,000 municipalities had an under-!ve mortality rate below 5 deaths per 1,000 live births in 2013, but in 32 municipalities, the rate exceeded 80 deaths per 1,000 live births. In addition, indigenous children are twice as likely to die before reaching their !rst birthday as other Brazilian children. These examples illustrate that even for countries with relatively low levels of mortality, greater efforts to reduce disparities at the sub-national level and across different groups are required to achieve equity in child survival and lower mortality levels overall. Therefore, much work remains to give every child a fair chance of survival even in low-mortality countries.
The substantial progress in reducing child mortality over the past 25 years provides a clear message: with the right commitments, concerted efforts and political will, bold and ambitious goals are within reach. Despite limited resources, 24 out of 81 low-income and lower-middle-income countries have met the MDG target for reducing under-!ve mortality by two thirds. Nearly 70 percent of all countries have at least halved their rates of child mortality. The 48 million children whose lives have been saved since 2000 are living evidence of the power of global commitments. Despite the substantial progress, the un!nished business of child survival looms large. Some 69 million children are at risk of dying before their !fth birthday in the next 15 years if current trends continue without acceleration. Every single child death represents the loss of a unique human being. Countries and the international community must take immediate action to further accelerate the pace of progress to ful!l the promise to children. Without intensi!ed efforts to reduce child mortality, particularly in the highest mortality areas and in contexts of persistent inequities, the SDG targets will be unattainable. Child survival must remain at the heart of the post-2015 SDG agenda.
9

10

The United Nations Inter-agency Group for Child Mortality Estimation (UN IGME) was established in 2004 to harmonize child mortality estimates within the United Nations system for reporting on progress towards child survival goals, to improve methods for child mortality estimation and to enhance country capacity to produce timely and properly assessed estimates of child mortality. UN IGME includes UNICEF, WHO, the World Bank and the Population Division of the United Nations Department of Economic and Social Affairs as full members.
UN IGME’s Technical Advisory Group, comprising leading academic scholars and independent experts in demography and biostatistics, provides guidance on estimation methods, technical issues and strategies for data analysis and data quality assessment.
UN IGME updates its child mortality estimates annually after reviewing newly available data and assessing data quality. These estimates are widely used in UNICEF’s "agship publications, the United Nations Secretary-General’s MDG report, and publications by other United Nations agencies, governments and donors.
In this chapter, we summarize the methods that UN IGME uses to generate child mortality estimates.
Overview To minimize the errors for each estimate of child mortality, as well as harmonize trends over time and produce up-to-date and properly assessed estimates, UN IGME follows a broad strategy that includes:
1. Compiling all available nationally representative data relevant to the estimation of child mortality, including data from vital registration systems, population censuses, household surveys and sample registration systems;
2. Assessing data quality, recalculating data inputs and, if necessary, making adjustments by applying standard methods; and
3. Fitting a statistical model to these data to generate a smooth trend curve that averages over possibly disparate estimates from the different data sources for a country, and extrapolating the model to a target year, in this case 2015.
To increase the transparency of the estimation process, UN IGME has developed a child mortality database that is available publicly on the web portal CME Info (<www.childmortality.org>). The database includes all available data and shows estimates for every country. It is updated whenever new estimates are generated and !nalized.
Data Sources If each country had a single source of high-quality data covering the past few decades, reporting on child mortality levels and trends would be straightforward. But few countries do, and the limited availability of high-quality data over time for many countries makes generating accurate estimates of child mortality a considerable challenge.
Nationally representative estimates of child mortality can be derived from a number of different sources, including civil registration and sample surveys. Demographic surveillance sites and hospital data are excluded, as they are rarely representative. The preferred source of data is a civil registration system, which records births and deaths on a continuous basis. If registration is complete and the system functions ef!ciently, the resulting estimates will be accurate and timely.
Most low- and middle-income countries, however, do not have well-functioning vital registration systems. In such cases, household surveys, such as the UNICEF-supported Multiple Indicator
Estimating Child Mortality
11

Cluster Surveys (MICS), the United States Agency for International Development-supported Demographic and Health Surveys (DHS) and periodic population censuses have become the primary source of data on child mortality. These surveys, which ask women about the survival of their children, provide the basis of child mortality estimates for a majority of low- and middle-income countries. The data from such surveys, however, are often subject to sampling or/and non-sampling errors, which might be substantial.
The !rst step in the process of arriving at estimates of levels and recent trends of the under-!ve, infant and neonatal mortality rates involves compiling all newly available empirical data. The full set of empirical data used in this analysis is publicly available from the UN IGME web portal (<http://childmortality.org/> under ‘Underlying data’). The 2015 update to the UN IGME database included about 5,700 new or updated country-year data points on child mortality under age !ve from more than 130 data series. As of July 2015, the database contains 17,000 country-year data points from more than 1,500 data series across 195 countries from 1990 (or earlier) to 2015. The increased availability of empirical data has substantially changed the estimates generated by UN IGME for some countries from previous editions, partly because the !tted trend line is based on the entire time series of data available for each country. The estimates presented in this report may differ from and are not necessarily comparable with previous sets of UN IGME estimates or underlying country data.
Data from civil registration systemsCivil registration data are the preferred data source for under-!ve, infant and neonatal mortality estimation. The calculation of the under-!ve mortality rates (U5MR) and infant mortality rates (IMR) from civil registration data is derived from a standard period abridged life table. For civil registration data (with available data on the number of deaths and mid-year populations), annual observations were initially constructed for all observation years in a country. For country-years in which the coef!cient of variation exceeded 10 percent, deaths and mid-year populations were pooled over longer periods, starting from more recent years and combining those with adjacent previous years, to reduce
spurious "uctuations in countries where small numbers of births and deaths were observed.
The coef!cient of variation is de!ned to be the stochastic standard error of the 5q0 (5q0=U5MR/1,000) or 1q0 (1q0=IMR/1,000) observation divided by the value of the 5q0 or 1q0 observation. The stochastic standard error of the observation is calculated using a Poisson approximation using live birth numbers from the World Population Prospects, given by sqrt(5q0 /lb) (or similarly sqrt(1q0 /lb), where lb is the number of live births in the year of the observation.7 After this recalculation of the civil registration data is done, the standard errors are set to a minimum of 2.5 percent for input into the model.
Survey dataThe majority of survey data comes in one of two forms: the full birth history, which asks women for the date of birth of each of their children, whether the children are still alive and, if not, the age at death; and the summary birth history, which asks women only about the number of children they have given birth to and the number that have died (or equivalently the number still alive).
Full birth history data, collected by all DHS surveys and increasingly also MICS surveys, allow the calculation of child mortality indicators for speci!c time periods in the past.8 This allows DHS and MICS to publish child mortality estimates for three 5-year periods before the survey, that is, 0 to 4, 5 to 9 and 10 to 14. UN IGME has recalculated estimates for calendar year periods, using single calendar years for periods shortly before the survey, and gradually increasing the number of years for periods further in the past to cover a 25-year period prior to the survey, whenever survey microdata are available. The cut-off points for a given survey for shifting from estimates for single calendar years to two years, or two years to three, etc., are based on the estimates’ coef!cients of variation (a measure of sampling uncertainty).9
In general, summary birth history data, collected by censuses and many household surveys, use the age of the woman as an indicator of the age of her children and their exposure time to the risk of dying, and employ models to estimate
12

mortality indicators for periods in the past for women ages 25–29 through ages 45–49. This method is well known, but has several shortcomings. In 2014, UN IGME changed the method of estimating summary birth histories to one based on classi!cation of women by the time that has passed since their !rst birth.
The main bene!ts of this new method over the previous one are that: First, it generally has lower sampling errors. Second, it avoids the problematic assumption that the estimates derived for each age group adequately represent the mortality of the whole population, and thus is less susceptible to the selection effect of young women who give birth early, since all women who give birth necessarily must have a !rst birth and therefore are not selected for. Third, the method tends to show less "uctuation over time, in particular in countries with relatively low fertility and mortality.10 UN IGME considers the improvements in the estimates based on time since !rst birth worthwhile when compared with the estimates derived from the classi!cation by age of mother. In cases where the information on time since !rst birth is available, UN IGME has reanalysed the data using the new method and only uses this version of estimates.
Moreover, following advice from UN IGME’s Technical Advisory Group, child mortality estimates from a summary birth history were not included when estimates from a full birth history in the same survey were available.11
Adjustment for missing mothers in high HIV prevalence settingsIn populations severely affected by HIV and AIDS, HIV-positive children will be more likely to die than other children, and will also be less likely to be reported because their mothers will have been more likely to die also, without scaling up antiretroviral therapy. Child mortality estimates will thus be biased downward. The magnitude of the bias will depend on the extent to which the elevated under-!ve mortality of HIV-positive children is not reported because of the deaths of their mothers. UN IGME’s Technical Advisory Group developed a method to adjust AIDS-related mortality for each survey data observation from full birth histories during HIV and AIDS epidemics (1980–present), by adopting a set of simpli!ed but reasonable
assumptions about the distribution of births to HIV-positive women, primarily relating to the duration of their infection, vertical transmission rates, and survival times of both mothers and children from the time of the birth.12 This method was applied to all World Fertility Surveys, as well as the DHS and MICS surveys with full birth histories.
Adjustment for under-reporting of infant deathsEarly infant mortality data from civil registration is incomplete in some European countries. A European report on perinatal indicators, for example, noted a wide variation on how European countries de!ne infant mortality, due to differences in birth and death registration practices (that is, differences in the cut-off points for acceptable weight or estimated gestation period to be registered as a birth and subsequent death).13,14 These discrepancies can lead to under-reporting of infant deaths by some countries, particularly when compared with countries that use a broader de!nition for live birth. The international discrepancies in data may have existed for some time, but had been overlooked due to much higher infant mortality rates in the past. Now that rates are so much lower, however, differences in registration may be more important in explaining inter-country differences in infant mortality.15
Therefore, child mortality was !rst adjusted before running the regression model. UN IGME examined the strong evidence that early neonatal deaths are under-reported for the Russian Federation and agreed that an adjustment of the order of 25 percent should be made to the Russian estimates of infant mortality based on the published analyses. This problem was also known to be present for some other Eastern European countries.16 UN IGME carried out an analysis of the ratio of early neonatal (under 7 days) deaths to total neonatal deaths. The average value of this ratio for Western European countries was 0.77, with few values below 0.70. A statistical analysis of this ratio for available country-years found that the ratio was signi!cantly lower than the Western European average for the following countries: Belarus, Bulgaria, Czech Republic, Estonia, Greece, Hungary, Latvia, Lithuania, Romania, Russian Federation, Slovakia and Spain. In only four countries did this ratio change signi!cantly over
13

time, and in all cases it was decreasing not increasing.
Based on this analysis, it was decided to apply a 10 percent upward adjustment to under-!ve mortality for Belarus, Hungary and Lithuania; and a 20 percent adjustment for the other countries, including the Russian Federation. In all cases, a single country-speci!c correction factor was applied to the entire time series, except for Estonia, from 1992 onward.
Systematic and random measurement errorData from different sources require different calculation methods and may suffer from different errors, such as random errors in sample surveys or systematic errors due to misreporting. As a result, different surveys often yield widely different estimates of under-!ve mortality rates (U5MR, the probability of dying before age !ve) for a given time period as illustrated in Figure 3. In order to reconcile these differences and take better account of the systematic biases associated with the various types of data inputs, UN IGME’s Technical Advisory Group has developed an estimation method to !t a smoothed trend
FIGURE 3
Empirical data of under-five mortality rate in Nigeria
curve to a set of observations and to extrapolate that trend to a de!ned time point, in this case 2015. This method is described in the following section.
Exclusion of data sourcesWhatever the method used to derive the estimates, data quality is critical. UN IGME assesses data quality and does not include data sources with substantial non-sampling errors or omissions as underlying empirical data in its statistical model to derive UN IGME estimates.
Estimation of under-five mortality ratesU5MR estimates were produced using the Bayesian B-spline Bias-reduction model, referred to as the B3 model.7,17 The model was developed, validated and used to produce previous rounds of the UN IGME child mortality estimates published in 201318 and 2014.19
In the B3 model, log(U5MR) is estimated with a "exible splines regression model. The spline regression model is !tted to all U5MR observations (i.e., country-year data points) in the country. An observed value for U5MR is considered to be the true value for U5MR multiplied by an error factor, i.e., observed U5MR = true U5MR * error, or on the log-scale, log(observed U5MR) = log(true U5MR) + log(error), where error refers to the relative difference between an observation and the true value. While estimating the true U5MR, properties of the errors that provide information about the quality of the observation, or in other words, the extent of error that is expected, are taken into account. These properties include: the standard error of the observation (due to sampling) or its stochastic error (for vital registration data to capture the uncertainty in outcomes of random events); the type of data source (e.g., DHS versus census); the type of data collection method (e.g., full or summary birth histories); the difference between the observation reference date and the survey time; and if the observation is part of a speci!c data series (and how consistent the data series is with other series with overlapping observation periods). These properties are summarized in the so-called data model. When estimating the U5MR, the data model accounts for the errors in empirical data, including the average systematic biases associated with different types of data sources, using
1960
0
100
150
50
200
250
300
350
1970 1980
Year
Und
er-fi
ve m
orta
lity
rate
(dea
ths
per
1,00
0 liv
e bi
rths
)
1990 2000 2010
Note: All data available for the country are shown as coloured points, with observations from the same data series joined by lines. Grey bands in the left plot represent the standard errors of the observations where available. Series considered, but not included into the statistical modelling due to substantial non-sampling errors or omissions, appear with dashed lines.
14
information on data quality for different types of data sources from every country.
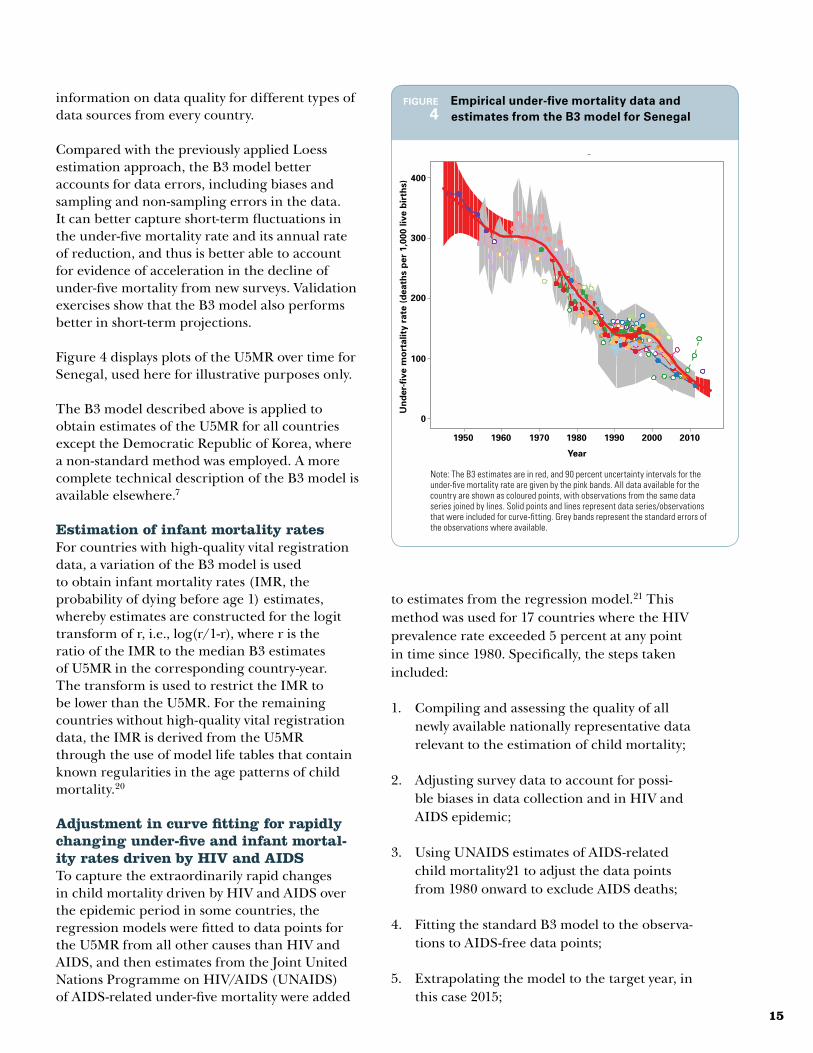
Compared with the previously applied Loess estimation approach, the B3 model better accounts for data errors, including biases and sampling and non-sampling errors in the data. It can better capture short-term "uctuations in the under-!ve mortality rate and its annual rate of reduction, and thus is better able to account for evidence of acceleration in the decline of under-!ve mortality from new surveys. Validation exercises show that the B3 model also performs better in short-term projections.
Figure 4 displays plots of the U5MR over time for Senegal, used here for illustrative purposes only.
The B3 model described above is applied to obtain estimates of the U5MR for all countries except the Democratic Republic of Korea, where a non-standard method was employed. A more complete technical description of the B3 model is available elsewhere.7
Estimation of infant mortality ratesFor countries with high-quality vital registration data, a variation of the B3 model is used to obtain infant mortality rates (IMR, the probability of dying before age 1) estimates, whereby estimates are constructed for the logit transform of r, i.e., log(r/1-r), where r is the ratio of the IMR to the median B3 estimates of U5MR in the corresponding country-year. The transform is used to restrict the IMR to be lower than the U5MR. For the remaining countries without high-quality vital registration data, the IMR is derived from the U5MR through the use of model life tables that contain known regularities in the age patterns of child mortality.20
Adjustment in curve fitting for rapidly changing under-five and infant mortal-ity rates driven by HIV and AIDSTo capture the extraordinarily rapid changes in child mortality driven by HIV and AIDS over the epidemic period in some countries, the regression models were !tted to data points for the U5MR from all other causes than HIV and AIDS, and then estimates from the Joint United Nations Programme on HIV/AIDS (UNAIDS) of AIDS-related under-!ve mortality were added
to estimates from the regression model.21 This method was used for 17 countries where the HIV prevalence rate exceeded 5 percent at any point in time since 1980. Speci!cally, the steps taken included:
1. Compiling and assessing the quality of all newly available nationally representative data relevant to the estimation of child mortality;
2. Adjusting survey data to account for possi-ble biases in data collection and in HIV and AIDS epidemic;
3. Using UNAIDS estimates of AIDS-related child mortality21 to adjust the data points from 1980 onward to exclude AIDS deaths;
4. Fitting the standard B3 model to the observa-tions to AIDS-free data points;
5. Extrapolating the model to the target year, in this case 2015;
FIGURE 4
Empirical under-five mortality data and estimates from the B3 model for Senegal
Senegal
U5M
R
1950 1960
0
100
200
300
400
1970 1980
Year
1990 2000 2010
Und
er-fi
ve m
orta
lity
rate
(dea
ths
per
1,00
0 liv
e bi
rths
)
Note: The B3 estimates are in red, and 90 percent uncertainty intervals for the under-five mortality rate are given by the pink bands. All data available for the country are shown as coloured points, with observations from the same data series joined by lines. Solid points and lines represent data series/observations that were included for curve-fitting. Grey bands represent the standard errors of the observations where available.
15

6. Adding back estimates of deaths due to AIDS (from UNAIDS); and
7. For the epidemic period, a non-AIDS curve of IMR is derived from U5MR using model life tables and then the UNAIDS estimates of AIDS deaths for children under age 1 are added to generate the !nal IMR estimates.
Estimation of under-five and infant mor-tality rates due to conflict and natural disastersDeaths caused by major humanitarian crises are dif!cult to capture in household surveys or cen-suses. Estimated deaths for major humanitarian crises were derived from various data sources from 1990 to present. Data of natural disasters were obtained from the International Disaster Database of the Centre for Research on the Epi-demiology of Disasters,22 with under-!ve pro-portions estimated as described elsewhere23 and con"ict deaths were taken from the datasets of the Uppsala Con"ict Data Project and the Peace Research Institute Oslo, as well as reports pre-pared by the United Nations and other orga-nizations. Estimated child deaths due to major humanitarian crises were included if they met the following criteria:
1. The humanitarian crisis was isolated to a few years; and
2. Under-!ve humanitarian crisis deaths were >10% of under-!ve non-humanitarian crisis deaths; and
3. Humanitarian crisis U5MR > 0.2 per 1,000; and
4. Number of under-!ve humanitarian crisis deaths >10 deaths;
or
5. High-quality vital registration data are avail-able and should not be smoothed by the B3 model.
These criteria resulted in 16 different humanitar-ian crises being explicitly incorporated into the IGME estimates. Humanitarian crisis deaths were included in the under-!ve mortality estimates by !rst excluding data points from humanitarian
crisis years, !tting the B3 model to the remaining data, and then adding the humanitarian crisis-speci!c death rate to the !tted B3 curve. Human-itarian crisis death estimates are uncertain, but presently no uncertainty around these deaths is included in the U5MR uncertainty intervals; instead, it is assumed that the relative uncer-tainty in the adjusted U5MR is equal to the rela-tive uncertainty in the non-adjusted U5MR. This assumption will be revisited in future years based on further research and upon improved histori-cal data availability on natural disasters and cri-ses-affected populations.
UN IGME also reviewed recent humanitarian crises, namely the Ebola virus disease outbreak in West Africa and the Nepal 2015 earthquake. Based on currently available data, neither of these crises appear to have led directly to under-!ve deaths greater than 10 percent of non-crisis under-!ve deaths and were therefore not explic-itly included in these estimates. However, it is noted that the broader impact of these disasters on health systems could lead to a greater number of child deaths than is currently estimated, and UN IGME will review new data, if available, in the next estimation round.
Estimation of under-five and infant mor-tality rates by sex In 2012, UN IGME started producing estimates of U5MR for males and females separately.24 In many countries, fewer sources have provided data by sex; instead, the data are for both sexes combined. For this reason, rather than esti-mate U5MR trends by sex directly from reported mortality levels by sex, UN IGME uses the avail-able data by sex to estimate a time trend in the sex ratio (male/female ratio) of U5MR instead. Bayesian methods for the UN IGME estimation of sex ratios with a focus on the estimation and identi!cation of countries with outlying levels or trends were used. A more complete technical description of the model is available elsewhere.25
Estimation of neonatal mortalityThe neonatal mortality rate is de!ned as the probability of dying before 28 days per 1,000 live births. In 2015, UN IGME’s method for estimat-ing such rates was updated. The new Bayesian methodology is similar to that used to estimate U5MR and estimates by sex. It has the advantage that, compared with the previous model, it can
16

capture empirical data trends in neonatal mor-tality rates within countries and over time for all countries. A more complete technical description of the new model is available elsewhere.26
For neonatal mortality in HIV-affected and humanitarian crisis-affected populations, the ratio is estimated initially for non-AIDS and non-crisis deaths. After estimation, humanitarian crisis neonatal deaths are added back on to the neonatal deaths to compute the total estimated neonatal death rate. No AIDS deaths are added back to the neonatal mortality rate, because it is assumed that AIDS-related deaths only affect child mortality after the !rst month of life.
Estimation of uncertainty intervalsGiven the inherent uncertainty in child mortal-ity estimates, 90 percent uncertainty intervals are used by the UN IGME instead of the more con-ventional 95 percent ones: While reporting inter-vals that are based on higher levels of uncertainty (i.e., 95 percent instead of 90 percent) would have the advantage that the chance of not having included the true value in the interval is smaller, the disadvantage of choosing higher uncertainty levels is that intervals lose their utility to pres-ent meaningful summaries of a range of likely outcomes if the indicator of interest is highly uncertain. Given this trade-off and the substan-tial uncertainty associated with child mortality estimates, UN IGME chose to report 90 percent uncertainty intervals, or, in other words, intervals for which there is a 90 percent chance that they contain the true value, to encourage wider use and interpretation of the uncertainly intervals.
Country consultationIn 2015, WHO and UNICEF undertook joint country consultations to give each country’s min-istry of health and national statistics of!ce the opportunity to review all data inputs and the draft estimates for its country. The objective was to identify relevant data not included in the UN IGME database, and to allow countries to review and provide feedback on estimates. It was not a country clearance process. In 2015, 88 of 195 countries sent responses, and 45 of those pro-vided comments or additional data. After the consultations, the UN IGME draft estimates were revised for 33 countries using new data.
Notes1. Values in parentheses indicate 90 percent uncertainty intervals for the estimates.
2. United Nations Children’s Fund, Committing to Child Survival: A Promise Renewed progress report 2015, UNICEF, New York, 2015.
3. United Nations, Department of Economic and Social Affairs, Population Division, ‘World Population Prospects: The 2015 revision’, United Nations, New York, 2015, avail-able at <http://esa.un.org/unpd/wpp/> (accessed 29 July 2015).
4. World Health Organization and Maternal and Child Epidemiology Estimation Group, provisional estimates, 2015.
5. Black, Robert E., et al., ‘Maternal and Child Undernutrition and Overweight in Low-Income and Middle-Income Countries’, The Lancet, vol. 382, no. 9890, 2013, pp. 427–451.
6. Lawn Joy E., et al., ‘Every Newborn: Progress, priorities and potential beyond sur-vival’, The Lancet, vol. 384, no. 9938, 12–18 July 2014, pp. 189–205.
7. Alkema, Leontine, and Jin Rou New, ‘Global Estimation of Child Mortality Using a Bayesian B-Spline Bias-Reduction Method’, Annals of Applied Statistics, vol. 8, no. 4, 2014, pp. 2122–2149.
8. Hill, Kenneth, ‘Direct Estimation of Child Mortality from Birth Histories’, in Tools for Demographic Estimation, edited by Tom Moultrie et al., International Union for the Scien-ti!c Study of Population, Paris, available at <http://demographicestimation.iussp.org/content/direct-estimation-child-mortality-birth-histories> (accessed 31 July 2015).
9. Pedersen, Jon, and Jing Liu, ‘Child Mortality Estimation: Appropriate time periods for child mortality estimates from full birth histories’, PLoS Medicine, vol. 9, no. 8, 2012, e1001289.
10. Hill, Kenneth, ‘Indirect Estimation of Child Mortality’, in Tools for Demographic Esti-mation, edited by Tom Moultrie et al., International Union for the Scienti!c Study of Population, Paris, available at <http://demographicestimation.iussp.org/content/intro-duction-child-mortality-analysis> (accessed 31 July 2015).
11. Silva, Romesh, ‘Child Mortality Estimation: Consistency of under-!ve mortality rate estimates using full birth histories and summary birth Histories’, PLoS Medicine, vol. 9, no. 8, 2012, e1001296.
12. Walker, Neff, Kenneth Hill and Fengmin Zhao, ‘Child Mortality Estimation: Meth-ods used to adjust for bias due to AIDS in estimating trends in under-!ve mortality’, PLoS Medicine, vol. 9, no. 8, 2012, e1001298.
13. Zeitlin, Jennifer, and Katherine Wildman, ‘Indicators for Monitoring and Evaluating Perinatal Health in Europe’, European Union Health Monitoring Programme, 2000.
14. Graafmans, Wilco C., et al., ‘Comparability of Published Perinatal Mortality Rates in Western Europe: The quantitative impact of differences in gestational age and birth-weight criteria’, British Journal of Obstetrics and Gynaecology, vol. 108, no. 12, 2001, pp. 1237–1245.
15. Kramer, Michael S., et al., ‘Registration Artifacts in International Comparisons of Infant Mortality’, Paediatric and Perinatal Epidemiology, vol. 16, no. 1, 2002, pp. 16–22.
16. Kingkade, W. Ward, and Cheryl Chriss Sawyer, ‘Infant Mortality in Eastern Europe and the Former Soviet Union Before and After the Breakup’, US Bureau of the Census, Population Division, Washington, D.C., 2001, available at <http://archive.iussp.org/Brazil2001/s40/S44_02_kingkade.pdf> (accessed 31 July 2015).
17. Alkema, Leontine, et al., on behalf of the members of the UN Inter-agency Group for Child Mortality Estimation and its Technical Advisory Group, ‘Child Mortality Estima-tion 2013: An overview of updates in estimation methods by the United Nations Inter-agency Group for Child Mortality Estimation’, PLoS ONE, vol. 9, no. 7, 2014, e101112.
18. United Nations Inter-agency Group for Child Mortality Estimation, ‘Levels & Trends in Child Mortality: Report 2013’, United Nations Children’s Fund, New York, 2013, avail-able at <http://www.childinfo.org/!les/Child_Mortality_Report_2013.pdf> (accessed 31 July 2015).
19. United Nations Inter-agency Group for Child Mortality Estimation, ‘Levels & trends in child mortality: Report 2014’, United Nations Children’s Fund, New York, 2014, avail-able at <www.childmortality.org/!les_v19/download/unicef-2013-child-mortality-report-LR-10_31_14_195.pdf> (accessed 31 July 2015).
20. Guillot, Michel, et al., ‘Child Mortality Estimation: A global overview of infant and child mortality age patterns in light of new empirical data’, PLoS Medicine, vol. 9, no. 8, 2012, e1001299.
21. Joint United Nations Programme on HIV/AIDS, How AIDS Changed Everything, UNAIDS, Geneva, 2015, available at <www.unaids.org/sites/default/!les/media_asset/MDG6Report_en.pdf> (accessed 31 July 2015).
22. Centre for Research on the Epidemiology of Disasters, ‘EM-DAT: The CRED Inter-national Disaster Database’, Université Catholique de Louvain, Belgium, 2012.
23. World Health Organization, ‘WHO Methods and Data Sources for Global Causes of Death 2000–2012’, Global Health Estimates Technical Paper WHO/HIS/HSI/GHE/2014.7, WHO, Geneva, 2014, available at <www.who.int/healthinfo/global_burden_disease/GlobalCOD_method_2000_2012.pdf?ua=1>, (accessed 31 July 2015).
24. Sawyer, Cheryl Chriss, ‘Child Mortality Estimation: Estimating sex differences in childhood mortality since the 1970s’, PLoS Medicine, vol. 9, no. 8, 2012.
25. Alkema, Leontine, ‘National, Regional, and Global Sex Ratios of Infant, Child, and under-5 Mortality and Identi!cation of Countries with Outlying Ratios: A systematic assessment’, The Lancet Global Health, vol. 2, no. 9, 2014, pp. e521–e530.
26. Alexander, Monica, and Leontine Alkema, ‘Estimating Neonatal Mortality’, Annual Meeting of the Population Association of America, 2015, available at <http://paa2015.princeton.edu/uploads/151676> (accessed 31 July 2015).
17

Country
Under-five mortality rate (U5MR) with 90 percent uncertainty interval (deaths per 1,000 live births)
1990 2000 2015Millennium
Development Goal
target!for 2015
Annual rate of reduction (ARR) (percent)
1990–2015
U5MRLower bound
Upper bound U5MR
Lower bound
Upper bound U5MR
Lower bound
Upper bound ARR
Lower bound
Upper bound
Afghanistan 181 163 202 137 126 150 91 70 119 60 2.7 1.6 3.9
Albania 41 36 46 26 23 31 14 8 25 14 4.3 1.9 6.6
Algeria 47 44 50 40 39 41 26 24 27 16 2.4 2.1 2.8
Andorra 9 5 14 5 4 6 3 2 5 3 4.4 1.2 7.5
Angola 226 202 255 217 190 247 157 95 254 75 1.5 -0.4 3.4
Antigua and Barbuda 26 18 36 16 14 17 8 6 12 9 4.6 2.6 6.7
Argentina 28 27 28 20 20 21 13 11 14 9 3.2 2.7 3.6
Armenia 50 45 55 30 27 33 14 11 18 17 5.0 3.9 6.2
Australia 9 9 9 6 6 6 4 4 4 3 3.5 3.2 3.9
Austria 10 9 10 6 5 6 4 3 4 3 4.0 3.6 4.4
Azerbaijan 95 86 105 74 66 83 32 20 52 32 4.4 2.3 6.3
Bahamas 24 22 25 16 15 17 12 9 16 8 2.7 1.5 3.8
Bahrain 23 22 24 13 12 13 6 5 7 8 5.2 4.7 5.8
Bangladesh 144 140 148 88 85 91 38 32 44 48 5.4 4.8 6.0
Barbados 18 17 19 16 15 18 13 10 17 6 1.3 0.2 2.4
Belarus 17 16 17 14 14 15 5 4 5 6 5.1 4.8 5.6
Belgium 10 10 10 6 6 6 4 4 5 3 3.6 3.1 3.9
Belize 40 35 45 25 24 27 17 14 20 13 3.5 2.6 4.4
Benin 180 168 191 145 135 156 100 78 127 60 2.4 1.4 3.3
Bhutan 134 118 152 80 72 88 33 24 45 45 5.6 4.3 7.0
Bolivia (Plurinational State of) 124 118 131 80 75 86 38 28 52 41 4.7 3.5 6.0
Bosnia and Herzegovina 18 18 19 9 9 10 5 5 6 6 4.9 4.3 5.5
Botswana 54 47 62 83 66 100 44 22 79 18 0.9 -1.6 3.7
Brazil 61 56 66 32 29 35 16 16 17 20 5.2 4.9 5.6
Brunei Darussalam 12 12 13 9 9 10 10 9 12 4 0.7 0.1 1.3
Bulgaria 22 22 23 21 20 22 10 10 11 7 3.0 2.6 3.4
Burkina Faso 202 189 215 186 172 200 89 65 119 67 3.3 2.1 4.5
Burundi 172 155 190 152 135 172 82 50 130 57 3.0 1.1 5.0
Cabo Verde 63 61 65 36 34 37 25 22 28 21 3.8 3.3 4.3
Cambodia 117 109 126 108 100 118 29 20 41 39 5.6 4.1 7.2
Cameroon 138 128 148 150 138 164 88 50 148 46 1.8 -0.3 4.0
Canada 8 8 8 6 6 6 5 4 6 3 2.1 1.5 2.7
Central African Republic 177 160 195 175 157 195 130 87 197 59 1.2 -0.5 2.9
Chad 215 199 232 190 175 206 139 94 203 72 1.7 0.2 3.3
Chile 19 19 20 11 11 11 8 7 10 6 3.4 2.7 4.3
China 54 50 59 37 35 39 11 9 13 18 6.5 5.7 7.2
Colombia 35 33 38 25 23 27 16 11 24 12 3.2 1.6 4.7
Comoros 125 111 140 101 81 119 74 39 145 42 2.1 -0.6 4.6
Congo 94 82 106 122 110 135 45 30 67 31 2.9 1.3 4.6
Cook Islands 24 22 27 17 15 19 8 5 12 8 4.4 2.7 6.1
Costa Rica 17 17 17 13 13 13 10 8 12 6 2.2 1.3 3.1
Côte d'Ivoire 153 142 164 146 134 159 93 72 119 51 2.0 1.0 3.0
Croatia 13 13 13 8 8 9 4 4 5 4 4.4 3.8 4.9
Cuba 13 13 14 8 8 9 6 5 6 4 3.5 3.1 4.0
STATISTICAL TABLE
Country, regional and global estimates of under-five, infant and neonatal mortality
18

STATISTICAL TABLE (CONTINUED)
Country, regional and global estimates of under-five, infant and neonatal mortality
Country
Number of under-five deaths with 90 percent uncertainty interval
(thousands)Sex-specific under-five
mortality!rate (deaths per
1,000 live births)
Infant mortality
rate (deaths per 1,000 live
births)
Number of infant deaths
(thousands)
Neonatal mortality rate
(deaths per 1,000 live
births)
Number of neonatal deaths
(thousands)1990 2015
Under-five
deathsLower bound
Upper bound
Under-five
deathsLower bound
Upper bound
1990 2015Male Female Male Female 1990 2015 1990 2015 1990 2015 1990 2015
Afghanistan 100 90 113 94 71 125 186 176 95 87 123 66 69 67 53 36 30 36
Albania 3 3 4 1 0 1 45 37 15 13 35 13 3 1 13 6 1 0
Algeria 39 36 42 24 23 26 51 43 27 24 40 22 33 21 22 16 18 15
Andorra 0 0 0 0 0 0 9 8 3 3 8 2 0 0 4 1 0 0
Angola 122 108 141 169 99 292 236 215 165 149 134 96 74 104 59 49 33 53
Antigua and Barbuda 0 0 0 0 0 0 28 23 9 7 24 6 0 0 15 5 0 0
Argentina 20 20 21 10 8 11 31 25 14 11 24 11 18 8 15 6 11 5
Armenia 4 4 4 1 0 1 55 45 16 13 43 13 3 1 23 7 2 0
Australia 2 2 2 1 1 1 10 8 4 3 8 3 2 1 5 2 1 1
Austria 1 1 1 0 0 0 11 8 4 3 8 3 1 0 5 2 0 0
Azerbaijan 20 18 22 7 4 12 103 87 34 29 76 28 16 7 36 18 7 4
Bahamas 0 0 0 0 0 0 25 22 13 11 20 10 0 0 14 7 0 0
Bahrain 0 0 0 0 0 0 24 22 6 6 20 5 0 0 15 1 0 0
Bangladesh 528 511 545 119 103 139 147 141 40 35 100 31 363 97 63 23 234 74
Barbados 0 0 0 0 0 0 20 16 14 12 16 12 0 0 12 8 0 0
Belarus 2 2 3 1 1 1 19 14 5 4 14 3 2 0 9 2 1 0
Belgium 1 1 1 1 0 1 11 9 5 4 8 3 1 0 5 2 1 0
Belize 0 0 0 0 0 0 44 36 18 15 32 14 0 0 19 8 0 0
Benin 39 36 42 37 29 48 187 172 104 95 108 64 24 24 46 32 10 12
Bhutan 3 2 3 0 0 1 140 127 36 30 93 27 2 0 44 18 1 0
Bolivia (Plurinational State of) 29 27 31 9 7 13 131 118 42 35 86 31 20 8 42 20 10 5
Bosnia and Herzegovina 1 1 1 0 0 0 20 16 6 5 16 5 1 0 11 4 1 0
Botswana 2 2 3 2 1 5 58 50 47 40 42 35 2 2 26 22 1 1
Brazil 219 202 237 52 50 55 66 55 18 15 51 15 181 47 24 9 86 29
Brunei Darussalam 0 0 0 0 0 0 13 11 11 9 9 9 0 0 6 4 0 0
Bulgaria 3 2 3 1 1 1 25 19 12 9 18 9 2 1 12 6 1 0
Burkina Faso 79 73 85 60 44 82 210 194 94 83 103 61 40 42 46 27 18 18
Burundi 46 41 51 37 22 61 182 162 88 76 104 54 28 25 42 29 11 13
Cabo Verde 1 1 1 0 0 0 67 58 27 22 48 21 1 0 22 12 0 0
Cambodia 41 38 45 10 7 15 125 109 32 25 85 25 29 9 41 15 14 5
Cameroon 71 65 76 71 40 124 146 130 94 82 86 57 44 47 41 26 21 21
Canada 3 3 3 2 2 2 9 7 5 5 7 4 3 2 4 3 2 1
Central African Republic 21 19 23 21 14 33 184 169 137 123 115 92 14 15 51 43 6 7
Chad 61 56 66 83 55 125 224 205 146 131 116 85 33 51 54 39 16 24
Chile 6 5 6 2 2 2 21 17 9 7 16 7 5 2 9 5 3 1
China 1,634 1,503 1,790 182 152 216 56 52 11 10 42 9 1,319 156 30 6 928 93
Colombia 31 29 33 12 8 18 39 31 18 14 29 14 26 10 18 9 16 6
Comoros 2 2 2 2 1 4 132 117 79 68 88 55 2 1 50 34 1 1
Congo 8 7 9 7 5 11 99 88 49 41 61 33 5 5 29 18 3 3
Cook Islands 0 0 0 0 0 0 27 22 9 7 21 7 0 0 13 4 0 0
Costa Rica 1 1 1 1 1 1 19 15 11 9 14 9 1 1 9 6 1 0
Côte d'Ivoire 76 70 82 75 58 98 164 140 101 84 105 67 53 55 51 38 26 31
Croatia 1 1 1 0 0 0 14 11 5 4 11 4 1 0 8 3 0 0
Cuba 2 2 3 1 1 1 15 12 6 5 11 4 2 0 7 2 1 0
19

STATISTICAL TABLE (CONTINUED)
Country, regional and global estimates of under-five, infant and neonatal mortality
Country
Under-five mortality rate (U5MR) with 90 percent uncertainty interval (deaths per 1,000 live births)
1990 2000 2015Millennium
Development Goal
target!for 2015
Annual rate of reduction (ARR) (percent)
1990–2015
U5MRLower bound
Upper bound U5MR
Lower bound
Upper bound U5MR
Lower bound
Upper bound ARR
Lower bound
Upper bound
Cyprus 11 11 12 7 6 7 3 2 4 4 5.7 4.6 6.7
Czech Republic 15 14 15 7 6 7 3 3 4 5 5.8 5.4 6.2
Democratic People's Republic of Korea 43 34 56 60 47 77 25 20 32 14 2.2 2.2 2.2
Democratic Republic of the Congo 187 169 205 161 147 178 98 71 130 62 2.6 1.4 3.9
Denmark 9 9 9 6 5 6 4 3 4 3 3.7 3.0 4.4
Djibouti 119 103 138 101 87 119 65 44 95 40 2.4 0.8 4.1
Dominica 17 16 19 15 14 17 21 17 28 6 -0.9 -2.0 0.2
Dominican Republic 60 57 64 41 38 45 31 24 40 20 2.7 1.6 3.7
Ecuador 57 51 63 34 30 39 22 14 35 19 3.9 1.9 5.8
Egypt 86 82 90 47 44 50 24 19 30 29 5.1 4.2 6.0
El Salvador 59 54 65 32 29 36 17 12 23 20 5.1 3.7 6.5
Equatorial Guinea 190 163 222 152 136 173 94 65 133 63 2.8 1.3 4.4
Eritrea 151 138 166 89 81 98 47 31 71 50 4.7 3.0 6.4
Estonia 20 20 21 11 11 12 3 3 4 7 7.8 7.0 8.4
Ethiopia 205 190 221 145 134 157 59 41 83 68 5.0 3.6 6.5
Fiji 30 25 35 25 23 26 22 19 26 10 1.1 0.3 2.0
Finland 7 7 7 4 4 5 2 2 3 2 4.3 3.7 4.9
France 9 9 9 5 5 6 4 4 5 3 3.0 2.4 3.4
Gabon 93 81 108 85 74 100 51 36 70 31 2.4 1.0 4.0
Gambia 170 152 191 119 105 135 69 45 104 57 3.6 1.9 5.4
Georgia 48 43 53 36 32 40 12 10 15 16 5.6 4.5 6.4
Germany 9 8 9 5 5 6 4 4 4 3 3.3 3.0 3.6
Ghana 127 121 135 101 95 107 62 48 78 42 2.9 1.9 3.9
Greece 13 12 13 8 8 8 5 4 5 4 4.0 3.5 4.5
Grenada 23 22 25 16 15 17 12 9 16 8 2.7 1.6 3.9
Guatemala 81 76 87 51 46 56 29 19 44 27 4.1 2.4 5.8
Guinea 238 223 255 170 159 183 94 72 122 79 3.7 2.7 4.8
Guinea-Bissau 229 204 257 178 160 197 93 69 121 76 3.6 2.5 4.9
Guyana 60 55 67 47 42 52 39 29 54 20 1.7 0.4 3.0
Haiti 146 137 156 105 97 113 69 56 88 49 3.0 2.1 3.9
Holy See - - - - - - - - - - - - -
Honduras 58 54 63 37 34 41 20 16 27 19 4.2 3.1 5.3
Hungary 19 19 20 11 11 12 6 5 7 6 4.7 4.3 5.1
Iceland 6 6 7 4 4 5 2 1 3 2 4.7 3.1 6.2
India 126 122 130 91 88 95 48 42 53 42 3.9 3.4 4.4
Indonesia 85 81 89 52 50 55 27 23 33 28 4.5 3.8 5.3
Iran (Islamic Republic of) 58 53 63 35 32 38 16 12 21 19 5.2 4.0 6.5
Iraq 54 50 59 45 41 49 32 25 42 18 2.1 1.0 3.2
Ireland 9 9 10 7 7 7 4 3 4 3 3.8 3.1 4.3
Israel 12 11 12 7 7 7 4 4 5 4 4.3 3.7 4.9
Italy 10 10 10 6 5 6 4 3 4 3 4.1 3.6 4.6
Jamaica 31 26 36 22 19 25 16 10 24 10 2.7 0.8 4.4
20

STATISTICAL TABLE (CONTINUED)
Country, regional and global estimates of under-five, infant and neonatal mortality
Country
Number of under-five deaths with 90 percent uncertainty interval
(thousands)Sex-specific under-five
mortality!rate (deaths per
1,000 live births)
Infant mortality
rate (deaths per 1,000 live
births)
Number of infant deaths
(thousands)
Neonatal mortality rate
(deaths per 1,000 live
births)
Number of neonatal deaths
(thousands)1990 2015
Under-five
deathsLower bound
Upper bound
Under-five
deathsLower bound
Upper bound
1990 2015Male Female Male Female 1990 2015 1990 2015 1990 2015 1990 2015
Cyprus 0 0 0 0 0 0 12 10 3 3 10 3 0 0 6 2 0 0
Czech Republic 2 2 2 0 0 0 17 13 4 3 13 3 2 0 10 2 2 0
Democratic People's Republic of Korea 16 12 20 9 7 12 47 39 28 22 33 20 12 7 22 14 8 5
Democratic Republic of the Congo 294 264 326 305 218 408 195 178 105 91 120 75 192 233 42 30 66 94
Denmark 1 1 1 0 0 0 10 8 4 3 7 3 0 0 4 3 0 0
Djibouti 3 3 4 1 1 2 128 110 71 59 93 54 3 1 50 33 1 1
Dominica 0 0 0 0 0 0 18 16 23 20 14 20 0 0 11 16 0 0
Dominican Republic 13 12 13 7 5 9 65 55 34 28 47 26 10 6 25 22 5 5
Ecuador 17 16 19 7 4 11 62 52 24 19 44 18 14 6 24 11 7 4
Egypt 167 159 175 66 52 83 86 86 25 23 63 20 123 57 33 13 65 36
El Salvador 9 9 10 2 1 2 64 54 19 15 46 14 7 2 23 8 4 1
Equatorial Guinea 3 3 4 3 2 4 199 179 101 88 128 68 2 2 51 33 1 1
Eritrea 20 18 22 8 5 12 162 140 51 41 93 34 12 6 34 18 4 3
Estonia 0 0 1 0 0 0 23 18 3 3 17 2 0 0 14 2 0 0
Ethiopia 446 411 486 184 125 261 217 192 65 54 122 41 268 130 61 28 135 87
Fiji 1 1 1 0 0 0 32 27 24 20 25 19 1 0 17 10 0 0
Finland 0 0 0 0 0 0 7 6 3 2 6 2 0 0 4 1 0 0
France 7 6 7 3 3 4 10 8 5 4 7 4 5 3 4 2 3 2
Gabon 3 3 4 3 2 4 100 86 55 46 61 36 2 2 32 23 1 1
Gambia 7 6 8 6 4 8 178 163 74 64 80 48 3 4 51 30 2 2
Georgia 4 4 5 1 1 1 53 42 13 11 41 11 4 1 25 7 2 0
Germany 7 7 7 3 2 3 10 7 4 3 7 3 6 2 3 2 3 1
Ghana 70 66 74 54 42 69 135 120 67 56 80 43 44 38 42 28 24 25
Greece 1 1 1 0 0 1 14 12 5 4 11 4 1 0 10 3 1 0
Grenada 0 0 0 0 0 0 25 22 13 11 18 11 0 0 13 6 0 0
Guatemala 27 25 29 13 8 20 86 76 32 26 60 24 20 11 29 13 10 6
Guinea 63 58 68 42 32 56 246 230 99 88 141 61 37 28 63 31 17 14
Guinea-Bissau 10 9 12 6 4 8 245 213 100 85 136 60 6 4 65 40 3 3
Guyana 1 1 1 1 0 1 67 53 44 34 47 32 1 1 30 23 1 0
Haiti 37 34 40 18 14 23 154 137 75 63 101 52 25 13 39 25 10 7
Holy See - - - - - - - - - - - - - - - - -
Honduras 11 10 11 3 3 4 63 53 23 18 45 17 8 3 22 11 4 2
Hungary 3 3 3 1 0 1 21 17 6 5 17 5 3 0 14 4 2 0
Iceland 0 0 0 0 0 0 7 6 2 2 5 2 0 0 4 1 0 0
India 3,357 3,236 3,481 1,201 1,063 1,348 122 130 46 49 88 38 2,338 946 57 28 1,537 696
Indonesia 395 376 414 147 121 178 91 78 30 24 62 23 286 125 30 14 138 74
Iran (Islamic Republic of) 110 101 120 21 16 29 58 57 16 15 45 13 84 18 27 10 50 13
Iraq 35 32 39 39 29 51 58 50 35 29 42 27 28 32 27 18 18 22
Ireland 0 0 0 0 0 0 10 8 4 3 8 3 0 0 5 2 0 0
Israel 1 1 1 1 1 1 12 11 4 4 10 3 1 1 6 2 1 0
Italy 6 5 6 2 1 2 11 9 4 3 8 3 5 1 6 2 4 1
Jamaica 2 2 2 1 0 1 34 27 18 14 25 14 1 1 21 12 1 0
21

STATISTICAL TABLE (CONTINUED)
Country, regional and global estimates of under-five, infant and neonatal mortality
Country
Under-five mortality rate (U5MR) with 90 percent uncertainty interval (deaths per 1,000 live births)
1990 2000 2015Millennium
Development Goal
target!for 2015
Annual rate of reduction (ARR) (percent)
1990–2015
U5MRLower bound
Upper bound U5MR
Lower bound
Upper bound U5MR
Lower bound
Upper bound ARR
Lower bound
Upper bound
Japan 6 6 6 5 4 5 3 3 3 2 3.4 3.1 3.6
Jordan 37 34 39 28 26 30 18 13 24 12 2.9 1.6 4.1
Kazakhstan 53 48 58 44 40 47 14 12 16 18 5.3 4.6 6.0
Kenya 102 96 109 108 100 117 49 38 64 34 2.9 1.8 4.0
Kiribati 96 84 111 71 62 80 56 37 84 32 2.2 0.4 3.9
Kuwait 18 17 19 13 12 13 9 8 9 6 2.9 2.5 3.3
Kyrgyzstan 65 57 74 49 43 54 21 19 24 22 4.5 3.7 5.1
Lao People's Democratic Republic 162 148 179 118 105 132 67 49 90 54 3.6 2.4 4.8
Latvia 20 20 21 17 16 18 8 6 11 7 3.8 2.5 5.0
Lebanon 33 29 36 20 17 24 8 5 14 11 5.5 3.3 7.8
Lesotho 88 80 96 117 108 126 90 70 115 29 -0.1 -1.1 0.9
Liberia 255 234 278 182 168 198 70 54 92 85 5.2 4.1 6.2
Libya 42 36 48 28 27 30 13 10 18 14 4.5 3.1 6.0
Liechtenstein - - - - - - - - - - - - -
Lithuania 17 16 17 12 11 12 5 4 6 6 4.6 3.9 5.4
Luxembourg 9 8 10 5 4 5 2 1 3 3 6.1 4.8 7.6
Madagascar 161 150 172 109 100 119 50 32 75 54 4.7 3.0 6.4
Malawi 242 229 257 174 164 186 64 47 91 81 5.3 3.9 6.6
Malaysia 17 16 17 10 10 10 7 6 8 6 3.5 3.0 3.9
Maldives 94 85 103 44 40 49 9 7 11 31 9.6 8.6 10.4
Mali 254 238 271 220 203 237 115 73 176 85 3.2 1.5 5.0
Malta 11 11 12 8 7 9 6 5 8 4 2.3 1.3 3.3
Marshall Islands 50 43 59 41 35 49 36 26 50 17 1.3 -0.2 2.9
Mauritania 118 106 131 114 101 127 85 49 144 39 1.3 -0.8 3.6
Mauritius 23 22 24 19 18 19 14 10 18 8 2.1 1.0 3.3
Mexico 47 43 51 26 24 28 13 12 15 16 5.0 4.5 5.6
Micronesia (Federated States of) 56 45 68 54 38 77 35 16 78 19 1.9 -1.2 4.9
Monaco 8 7 9 5 5 6 4 3 4 3 3.2 2.2 4.1
Mongolia 108 100 117 63 57 69 22 16 30 36 6.3 5.1 7.6
Montenegro 17 16 18 14 13 15 5 4 6 6 5.0 4.1 6.0
Morocco 80 75 86 50 46 55 28 21 37 27 4.3 3.1 5.4
Mozambique 240 222 259 171 159 185 79 62 101 80 4.5 3.5 5.5
Myanmar 110 101 121 82 76 90 50 38 65 37 3.2 2.0 4.4
Namibia 74 67 80 76 69 83 45 33 63 25 1.9 0.6 3.2
Nauru 57 35 92 41 35 48 35 22 56 19 1.9 -1.0 4.8
Nepal 141 132 150 81 75 86 36 28 46 47 5.5 4.5 6.5
Netherlands 8 8 9 6 6 6 4 3 4 3 3.1 2.7 3.6
New Zealand 11 11 12 7 7 8 6 5 7 4 2.7 2.0 3.4
Nicaragua 67 62 72 40 37 44 22 14 36 22 4.4 2.4 6.4
Niger 328 309 349 227 212 245 96 71 128 109 4.9 3.8 6.2
Nigeria 213 199 226 187 175 199 109 83 140 71 2.7 1.7 3.7
Niue 14 9 20 23 15 35 23 10 50 5 -2.0 -5.6 1.5
Norway 9 8 9 5 5 5 3 2 3 3 4.8 4.1 5.4
22

STATISTICAL TABLE (CONTINUED)
Country, regional and global estimates of under-five, infant and neonatal mortality
Country
Number of under-five deaths with 90 percent uncertainty interval
(thousands)Sex-specific under-five
mortality!rate (deaths per
1,000 live births)
Infant mortality
rate (deaths per 1,000 live
births)
Number of infant deaths
(thousands)
Neonatal mortality rate
(deaths per 1,000 live
births)
Number of neonatal deaths
(thousands)1990 2015
Under-five
deathsLower bound
Upper bound
Under-five
deathsLower bound
Upper bound
1990 2015Male Female Male Female 1990 2015 1990 2015 1990 2015 1990 2015
Japan 8 8 8 3 3 3 7 6 3 3 5 2 5 2 3 1 3 1
Jordan 4 4 4 4 3 5 38 35 19 17 30 15 3 3 20 11 2 2
Kazakhstan 21 19 23 6 5 6 59 46 16 12 45 13 18 5 22 7 9 3
Kenya 100 93 107 74 57 97 108 97 53 45 66 36 65 54 27 22 27 34
Kiribati 0 0 0 0 0 0 102 89 61 51 69 44 0 0 36 24 0 0
Kuwait 1 1 1 1 1 1 19 16 9 8 15 7 1 1 10 3 0 0
Kyrgyzstan 9 8 10 4 3 4 71 59 24 19 54 19 7 3 25 12 3 2
Lao People's Democratic Republic 29 26 32 12 8 16 172 152 73 61 111 51 20 9 55 30 10 5
Latvia 1 1 1 0 0 0 23 18 9 7 17 7 1 0 12 5 1 0
Lebanon 2 2 2 1 0 1 34 31 9 8 27 7 2 1 21 5 1 0
Lesotho 5 4 5 6 4 7 95 81 97 83 71 69 4 4 40 33 2 2
Liberia 23 21 26 11 8 14 268 242 75 65 170 53 15 8 57 24 5 4
Libya 6 5 7 2 1 2 45 38 15 12 36 11 5 1 21 7 3 1
Liechtenstein - - - - - - - - - - - - - - - - -
Lithuania 1 1 1 0 0 0 18 15 6 5 13 3 1 0 10 3 1 0
Luxembourg 0 0 0 0 0 0 10 8 2 2 7 2 0 0 4 1 0 0
Madagascar 82 76 88 40 26 61 168 153 54 45 98 36 52 29 40 20 21 16
Malawi 106 99 113 40 29 58 252 232 68 60 143 43 63 27 49 22 21 14
Malaysia 8 8 8 4 3 4 19 15 8 6 14 6 7 3 9 4 4 2
Maldives 1 1 1 0 0 0 100 88 9 8 68 7 1 0 43 5 0 0
Mali 98 91 106 83 52 131 264 245 120 108 131 75 50 54 73 38 28 27
Malta 0 0 0 0 0 0 12 10 7 6 10 5 0 0 8 4 0 0
Marshall Islands 0 0 0 0 0 0 55 46 40 32 40 30 0 0 20 17 0 0
Mauritania 9 8 10 11 6 19 127 109 96 80 78 65 6 9 46 36 4 5
Mauritius 0 0 0 0 0 0 26 20 15 12 20 12 0 0 15 8 0 0
Mexico 115 105 126 31 28 35 50 43 14 12 37 11 92 27 21 7 51 17
Micronesia (Federated States of) 0 0 0 0 0 0 60 51 38 31 43 29 0 0 26 19 0 0
Monaco 0 0 0 0 0 0 9 7 4 3 6 3 0 0 4 2 0 0
Mongolia 8 7 9 2 1 2 123 92 27 18 77 19 6 1 32 11 2 1
Montenegro 0 0 0 0 0 0 18 16 5 4 15 4 0 0 11 3 0 0
Morocco 56 52 60 20 15 26 85 75 30 25 63 24 43 17 37 18 25 13
Mozambique 140 128 154 82 64 107 249 230 83 74 160 57 93 60 62 27 36 29
Myanmar 121 110 134 46 35 61 118 102 55 45 78 40 83 36 47 26 50 24
Namibia 4 3 4 3 2 5 79 68 49 41 50 33 3 2 28 16 1 1
Nauru 0 0 0 0 0 0 61 52 39 32 44 29 0 0 29 23 0 0
Nepal 98 92 105 20 16 25 141 140 38 34 98 29 68 16 59 22 41 12
Netherlands 2 2 2 1 1 1 9 7 4 3 7 3 1 1 5 2 1 0
New Zealand 1 1 1 0 0 0 13 10 6 5 9 5 1 0 4 3 0 0
Nicaragua 10 9 11 3 2 4 72 61 25 20 51 19 7 2 24 10 3 1
Niger 133 123 143 88 65 119 332 324 100 91 138 57 56 54 55 27 22 25
Nigeria 849 789 912 750 567 980 223 202 115 102 126 69 502 484 50 34 201 240
Niue 0 0 0 0 0 0 15 12 25 20 12 20 0 0 8 13 0 0
Norway 1 0 1 0 0 0 10 8 3 2 7 2 0 0 4 2 0 0
23

STATISTICAL TABLE (CONTINUED)
Country, regional and global estimates of under-five, infant and neonatal mortality
Country
Under-five mortality rate (U5MR) with 90 percent uncertainty interval (deaths per 1,000 live births)
1990 2000 2015Millennium
Development Goal
target!for 2015
Annual rate of reduction (ARR) (percent)
1990–2015
U5MRLower bound
Upper bound U5MR
Lower bound
Upper bound U5MR
Lower bound
Upper bound ARR
Lower bound
Upper bound
Oman 39 35 45 17 15 19 12 11 13 13 4.9 4.3 5.6
Pakistan 139 134 144 112 108 117 81 65 102 46 2.1 1.2 3.1
Palau 36 31 42 27 23 31 16 9 30 12 3.2 0.6 5.7
Panama 31 27 35 26 22 30 17 11 28 10 2.4 0.4 4.4
Papua New Guinea 89 80 99 79 67 91 57 35 96 30 1.8 -0.3 3.8
Paraguay 47 42 51 34 29 39 21 13 32 16 3.3 1.4 5.1
Peru 80 76 84 39 36 41 17 14 21 27 6.2 5.3 7.1
Philippines 58 54 62 40 37 43 28 21 37 19 2.9 1.8 4.1
Poland 17 17 18 9 9 10 5 5 6 6 4.8 4.3 5.3
Portugal 15 14 15 7 7 7 4 3 4 5 5.6 4.8 6.3
Qatar 21 19 22 12 12 13 8 7 9 7 3.8 3.3 4.3
Republic of Korea 7 7 7 6 6 6 3 3 4 2 2.9 2.6 3.2
Republic of Moldova 33 28 39 31 26 37 16 11 23 11 3.0 1.3 4.5
Romania 38 37 38 27 26 28 11 10 13 13 4.9 4.4 5.4
Russian Federation 26 26 27 23 23 24 10 8 11 9 4.0 3.4 4.6
Rwanda 152 143 161 184 170 199 42 30 58 51 5.2 3.8 6.5
Saint Kitts and Nevis 28 26 31 19 17 21 11 8 15 9 4.0 2.5 5.4
Saint Lucia 23 21 24 18 17 19 14 11 18 8 1.8 0.8 2.9
Saint Vincent and the Grenadines 25 23 26 22 21 24 18 15 23 8 1.2 0.2 2.1
Samoa 31 27 35 22 19 25 18 12 24 10 2.3 0.9 3.9
San Marino 11 9 14 6 4 8 3 1 6 4 5.3 2.2 8.3
Sao Tome and Principe 111 98 126 89 76 105 47 28 81 37 3.4 1.3 5.6
Saudi Arabia 44 36 55 23 20 26 15 9 26 15 4.5 2.0 6.8
Senegal 140 133 148 135 127 144 47 34 65 47 4.4 3.1 5.6
Serbia 28 28 29 13 12 13 7 6 8 9 5.8 5.1 6.5
Seychelles 17 15 18 14 13 16 14 11 17 6 0.8 -0.3 1.8
Sierra Leone 264 243 286 236 219 254 120 98 145 88 3.1 2.4 4.0
Singapore 8 7 8 4 4 4 3 2 3 3 4.2 3.3 5.1
Slovakia 18 17 18 12 11 12 7 7 8 6 3.5 3.2 3.8
Slovenia 10 10 11 6 5 6 3 2 3 3 5.5 4.9 6.2
Solomon Islands 40 34 46 33 29 38 28 17 45 13 1.4 -0.6 3.4
Somalia 180 151 220 174 138 225 137 80 242 60 1.1 -0.9 3.0
South Africa 60 52 68 75 67 86 41 31 53 20 1.6 0.3 2.8
South Sudan 253 211 298 182 156 213 93 58 143 84 4.0 2.1 6.0
Spain 11 11 11 7 6 7 4 3 5 4 3.9 3.2 4.7
Sri Lanka 21 21 22 16 16 17 10 9 11 7 3.1 2.8 3.4
State of Palestine 44 41 48 30 27 32 21 16 28 15 3.0 1.8 4.1
Sudan 128 119 137 106 98 115 70 57 86 43 2.4 1.5 3.3
Suriname 48 41 56 34 27 44 21 11 42 16 3.2 0.5 6.0
Swaziland 75 64 86 128 116 142 61 43 86 25 0.8 -0.6 2.2
Sweden 7 7 7 4 4 4 3 3 3 2 3.3 2.8 3.8
Switzerland 8 8 8 6 6 6 4 3 5 3 3.0 2.3 3.6
Syrian Arab Republic 37 34 40 23 22 25 13 9 18 12 4.2 2.8 5.6
24

STATISTICAL TABLE (CONTINUED)
Country, regional and global estimates of under-five, infant and neonatal mortality
Country
Number of under-five deaths with 90 percent uncertainty interval
(thousands)Sex-specific under-five
mortality!rate (deaths per
1,000 live births)
Infant mortality
rate (deaths per 1,000 live
births)
Number of infant deaths
(thousands)
Neonatal mortality rate
(deaths per 1,000 live
births)
Number of neonatal deaths
(thousands)1990 2015
Under-five
deathsLower bound
Upper bound
Under-five
deathsLower bound
Upper bound
1990 2015Male Female Male Female 1990 2015 1990 2015 1990 2015 1990 2015
Oman 3 2 3 1 1 1 43 36 13 10 32 10 2 1 17 5 1 0
Pakistan 593 570 618 432 341 551 141 136 85 77 106 66 459 351 64 46 281 245
Palau 0 0 0 0 0 0 40 32 18 15 31 14 0 0 19 9 0 0
Panama 2 2 2 1 1 2 34 28 19 15 26 15 2 1 17 10 1 1
Papua New Guinea 12 11 14 12 7 20 95 84 62 53 65 45 9 9 32 25 4 5
Paraguay 6 6 7 3 2 4 50 43 23 18 37 18 5 2 23 11 3 1
Peru 53 50 56 10 8 13 84 75 18 15 56 13 38 8 28 8 18 5
Philippines 118 110 126 66 49 87 64 53 31 25 41 22 84 52 20 13 40 30
Poland 9 9 10 2 2 2 19 15 6 5 15 5 8 2 11 3 6 1
Portugal 2 2 2 0 0 0 16 13 4 3 12 3 1 0 7 2 1 0
Qatar 0 0 0 0 0 0 23 19 9 7 18 7 0 0 11 4 0 0
Republic of Korea 4 4 4 2 1 2 7 7 4 3 6 3 3 1 3 2 2 1
Republic of Moldova 3 2 3 1 0 1 37 29 18 14 27 14 2 1 19 12 2 1
Romania 15 15 15 2 2 2 42 34 12 10 31 10 12 2 14 6 5 1
Russian Federation 59 58 60 19 16 22 30 22 11 8 22 8 49 16 14 5 31 10
Rwanda 50 47 54 14 10 20 160 143 45 38 93 31 31 10 41 19 14 6
Saint Kitts and Nevis 0 0 0 0 0 0 31 26 11 10 23 8 0 0 18 7 0 0
Saint Lucia 0 0 0 0 0 0 25 20 16 13 19 13 0 0 13 9 0 0
Saint Vincent and the Grenadines 0 0 0 0 0 0 27 22 20 17 20 17 0 0 13 12 0 0
Samoa 0 0 0 0 0 0 34 28 19 16 26 15 0 0 17 10 0 0
San Marino 0 0 0 0 0 0 12 10 3 3 10 3 0 0 7 1 0 0
Sao Tome and Principe 1 0 1 0 0 1 117 104 52 43 71 35 0 0 28 17 0 0
Saudi Arabia 25 20 31 9 5 16 47 42 16 14 36 13 20 8 22 8 13 5
Senegal 44 41 46 27 20 37 147 134 54 44 70 42 22 24 40 21 13 12
Serbia 4 4 4 1 1 1 30 27 7 6 25 6 4 1 18 4 3 0
Seychelles 0 0 0 0 0 0 18 15 15 12 14 12 0 0 11 9 0 0
Sierra Leone 46 42 51 26 21 32 276 252 127 113 157 87 27 19 54 35 9 8
Singapore 0 0 0 0 0 0 8 7 3 3 6 2 0 0 4 1 0 0
Slovakia 1 1 2 0 0 0 20 15 8 7 16 6 1 0 13 4 1 0
Slovenia 0 0 0 0 0 0 12 9 3 2 9 2 0 0 6 1 0 0
Solomon Islands 0 0 1 0 0 1 43 36 31 26 32 24 0 0 16 12 0 0
Somalia 51 42 63 61 34 115 188 172 143 130 108 85 31 38 45 40 13 18
South Africa 64 56 73 42 31 57 66 54 47 37 47 34 51 34 20 11 22 11
South Sudan 66 54 81 39 24 63 263 243 98 87 150 60 40 26 67 39 18 17
Spain 5 5 5 2 1 2 12 10 4 4 9 4 4 1 7 3 3 1
Sri Lanka 7 7 7 3 3 3 23 19 11 9 18 8 6 3 14 5 5 2
State of Palestine 4 4 4 3 2 4 47 42 23 19 36 18 3 3 22 12 2 2
Sudan 100 93 108 89 72 111 134 120 75 65 80 48 64 61 41 30 33 39
Suriname 1 0 1 0 0 0 52 43 24 19 41 19 0 0 23 12 0 0
Swaziland 3 2 3 2 2 3 80 69 65 56 56 45 2 2 22 14 1 1
Sweden 1 1 1 0 0 0 8 6 3 3 6 2 1 0 4 2 0 0
Switzerland 1 1 1 0 0 0 9 7 4 4 7 3 1 0 4 3 0 0
Syrian Arab Republic 17 15 18 6 4 8 40 34 14 12 30 11 14 5 17 7 7 3
25

STATISTICAL TABLE (CONTINUED)
Country, regional and global estimates of under-five, infant and neonatal mortality
Country
Under-five mortality rate (U5MR) with 90 percent uncertainty interval (deaths per 1,000 live births)
1990 2000 2015Millennium
Development Goal
target!for 2015
Annual rate of reduction (ARR) (percent)
1990–2015
U5MRLower bound
Upper bound U5MR
Lower bound
Upper bound U5MR
Lower bound
Upper bound ARR
Lower bound
Upper bound
Tajikistan 108 98 120 93 81 106 45 29 72 36 3.5 1.6 5.3
Thailand 37 34 40 23 20 26 12 8 20 12 4.4 2.4 6.3
The former Yugoslav Republic of Macedonia 37 35 38 16 15 17 6 3 8 12 7.6 6.0 9.8
Timor-Leste 176 159 195 110 100 121 53 36 76 59 4.8 3.3 6.4
Togo 146 136 157 121 112 130 78 65 94 49 2.5 1.8 3.2
Tonga 22 18 26 18 15 21 17 11 26 7 1.1 -0.8 3.0
Trinidad and Tobago 31 26 36 29 22 40 20 10 44 10 1.6 -1.6 4.4
Tunisia 57 50 65 32 27 37 14 11 19 19 5.6 4.3 6.9
Turkey 75 70 80 40 36 43 14 13 15 25 6.8 6.4 7.2
Turkmenistan 91 78 104 82 69 96 51 26 95 30 2.3 -0.2 4.9
Tuvalu 57 49 68 43 38 48 27 16 45 19 3.0 0.8 5.1
Uganda 187 177 199 148 139 158 55 41 74 62 4.9 3.7 6.1
Ukraine 20 18 22 19 17 21 9 8 10 7 3.1 2.5 3.8
United Arab Emirates 17 14 19 11 11 12 7 6 8 6 3.5 2.7 4.3
United Kingdom 9 9 10 7 6 7 4 4 5 3 3.2 2.5 3.8
United Republic of Tanzania 165 156 175 131 122 140 49 34 70 55 4.9 3.4 6.4
United States 11 11 11 8 8 9 7 5 8 4 2.2 1.5 2.9
Uruguay 23 23 24 17 16 17 10 9 11 8 3.3 2.8 3.7
Uzbekistan 72 63 81 63 54 74 39 19 80 24 2.4 -0.4 5.2
Vanuatu 36 30 42 29 24 33 28 19 41 12 1.0 -0.7 2.7
Venezuela (Bolivarian Republic of) 30 29 30 22 21 22 15 12 19 10 2.7 1.7 3.7
Viet Nam 51 47 55 34 31 37 22 21 23 17 3.4 3.1 3.8
Yemen 126 119 134 95 88 103 42 32 54 42 4.4 3.4 5.5
Zambia 191 179 202 163 152 175 64 49 81 64 4.4 3.4 5.4
Zimbabwe 76 70 82 106 96 116 71 51 98 25 0.3 -1.0 1.6
Estimates of under-five, infant and neonatal mortality by Millennium Development Goal regiona
Developed regions 15 14 15 10 10 10 6 6 6 5 3.7 3.3 3.9
Developing regions 100 99 102 83 82 85 47 45 50 33 3.1 2.8 3.2
Northern Africa 73 71 75 44 43 46 24 21 28 24 4.4 3.8 5.0
Sub-Saharan Africa 180 177 184 154 151 158 83 78 93 60 3.1 2.6 3.4Latin America & Caribbean 54 52 56 32 31 33 18 17 19 18 4.4 4.1 4.6
Caucasus & Central Asia 73 69 77 63 59 68 32 25 47 24 3.3 1.7 4.4
Eastern Asia 53 49 58 37 35 39 11 9 13 18 6.3 5.6 7.1
Excluding China 27 24 32 30 25 37 14 12 17 9 2.7 2.5 3.0
Southern Asia 126 123 129 92 89 94 51 47 56 42 3.6 3.2 4.0
Excluding India 126 123 128 93 90 95 59 51 69 42 3.0 2.4 3.6
South-eastern Asia 72 70 74 49 47 50 27 25 31 24 3.9 3.4 4.3
Western Asia 66 63 69 43 41 45 22 20 26 22 4.3 3.7 4.8
Oceania 74 68 82 67 59 77 51 33 81 25 1.5 -0.3 3.2
World 91 89 92 76 75 77 43 41 46 30 3.0 2.7 3.2
26

STATISTICAL TABLE (CONTINUED)
Country, regional and global estimates of under-five, infant and neonatal mortality
Country
Number of under-five deaths with 90 percent uncertainty interval
(thousands)Sex-specific under-five
mortality!rate (deaths per
1,000 live births)
Infant mortality
rate (deaths per 1,000 live
births)
Number of infant deaths
(thousands)
Neonatal mortality rate
(deaths per 1,000 live
births)
Number of neonatal deaths
(thousands)1990 2015
Under-five
deathsLower bound
Upper bound
Under-five
deathsLower bound
Upper bound
1990 2015Male Female Male Female 1990 2015 1990 2015 1990 2015 1990 2015
Tajikistan 24 21 26 12 8 19 117 99 50 40 85 39 19 10 32 21 7 5
Thailand 40 37 43 9 6 15 42 32 14 11 30 11 33 8 20 7 22 5
The former Yugoslav Republic of Macedonia 1 1 1 0 0 0 38 35 6 5 33 5 1 0 17 4 1 0
Timor-Leste 5 4 5 3 2 4 183 168 57 48 132 45 4 2 56 22 2 1
Togo 23 21 25 20 16 24 155 137 84 72 90 52 14 13 43 27 7 7
Tonga 0 0 0 0 0 0 20 24 15 18 19 14 0 0 10 7 0 0
Trinidad and Tobago 1 1 1 0 0 1 33 28 22 18 27 18 1 0 20 13 0 0
Tunisia 13 11 14 3 2 4 61 53 15 13 44 12 10 3 28 8 6 2
Turkey 104 97 112 19 18 20 78 71 15 12 56 12 77 16 33 7 45 10
Turkmenistan 12 10 14 6 3 11 102 79 59 44 73 44 10 5 30 23 4 3
Tuvalu 0 0 0 0 0 0 60 54 30 25 44 23 0 0 30 18 0 0
Uganda 151 142 162 85 63 117 200 174 60 49 111 38 92 60 39 19 32 30
Ukraine 12 11 14 4 4 4 22 17 10 8 17 8 10 3 12 6 7 2
United Arab Emirates 1 1 1 1 1 1 18 15 8 6 14 6 1 1 8 4 0 0
United Kingdom 7 7 7 3 3 4 11 8 5 4 8 4 6 3 5 2 3 2
United Republic of Tanzania 178 166 189 98 68 143 172 158 52 45 100 35 109 72 40 19 43 39
United States 43 43 44 25 21 30 13 10 7 6 9 6 36 21 6 4 22 14
Uruguay 1 1 1 0 0 1 26 21 11 9 20 9 1 0 12 5 1 0
Uzbekistan 52 45 59 26 13 55 80 63 44 34 59 34 43 23 31 20 22 14
Vanuatu 0 0 0 0 0 0 39 33 30 25 29 23 0 0 16 12 0 0
Venezuela (Bolivarian Republic of) 17 17 18 9 7 12 33 26 17 13 25 13 15 8 13 9 8 5
Viet Nam 99 91 107 34 33 36 57 45 25 19 37 17 71 27 24 11 46 18
Yemen 75 70 80 34 26 45 132 121 46 38 89 34 54 28 44 22 27 18
Zambia 70 65 75 39 30 50 199 182 69 59 113 43 42 27 36 21 13 13
Zimbabwe 29 26 31 38 27 53 82 69 76 65 51 47 19 25 22 24 8 13
Estimates of under-five, infant and neonatal mortality by Millennium Development Goal regiona (continued)Developed regions 223 221 225 80 75 86 16 13 6 5 12 5 186 67 8 3 116 44
Developing regions 12,526 12,331 12,761 5,865 5,626 6,315 102 98 49 44 69 35 8,738 4,383 40 21 4,990 2,639
Northern Africa 280 270 290 114 100 133 75 71 26 22 56 21 214 99 31 14 117 66
Sub-Saharan Africa 3,871 3,789 3,966 2,947 2,740 3,314 189 171 89 77 108 56 2,343 2,018 46 29 994 1,027Latin America & Caribbean 632 612 654 196 187 211 58 49 20 16 43 15 500 167 22 9 255 102
Caucasus & Central Asia 145 138 154 62 47 93 80 65 36 28 59 28 120 54 29 16 57 31
Eastern Asia 1,662 1,531 1,817 194 164 229 55 51 12 10 42 9 1,339 167 29 6 939 100
Excluding China 28 24 33 12 10 15 29 25 15 12 21 11 21 10 12 7 11 7
Southern Asia 4,796 4,673 4,926 1,891 1,726 2,087 124 128 51 51 89 41 3,390 1,499 57 29 2,179 1,078
Excluding India 1,439 1,408 1,475 690 596 816 128 123 62 55 92 47 1,052 553 56 32 642 382
South-eastern Asia 856 832 883 331 298 373 77 65 30 24 52 22 617 272 28 13 326 165
Western Asia 270 260 282 117 104 136 69 62 24 20 50 19 204 98 29 12 117 64
Oceania 14 13 16 13 9 22 79 70 55 46 55 40 11 11 28 22 5 6
World 12749 12554 12984 5945 5707 6395 93 88 44 41 63 32 8924 4450 36 19 5106 2682
27

STATISTICAL TABLE (CONTINUED)
Country, regional and global estimates of under-five, infant and neonatal mortality
Estimates of under-five, infant and neonatal mortality by UNICEF regiona
Region
Under-five mortality rate (U5MR) with 90 percent uncertainty interval (deaths per 1,000 live births)
1990 2000 2015Millennium
Development Goal
target!for 2015
Annual rate of reduction (ARR) (percent)
1990-2015
U5MRLower bound
Upper bound U5MR
Lower bound
Upper bound U5MR
Lower bound
Upper bound ARR
Lower bound
Upper bound
Africa 164 161 168 142 140 146 76 71 85 55 3.1 2.6 3.3
Sub-Saharan Africa 180 177 184 154 151 158 83 78 93 60 3.1 2.6 3.4
Eastern and Southern Africa 167 162 171 140 136 144 67 60 78 56 3.7 3.0 4.1
West and Central Africa 198 193 205 172 167 178 99 88 114 66 2.8 2.2 3.2
Middle East and North Africa 71 69 73 50 49 52 29 27 32 24 3.6 3.2 4.0
Asia 90 88 93 71 69 72 36 34 40 30 3.6 3.3 3.9
South Asia 129 126 133 94 91 96 53 48 58 43 3.6 3.2 4.0
East Asia and Pacific 58 55 62 42 40 43 18 16 20 19 4.7 4.3 5.2
Latin America and Caribbean 54 52 56 32 31 33 18 17 19 18 4.4 4.1 4.6
Central and Eastern Europe/Commonwealth of Independent States 48 46 49 37 36 39 17 15 22 16 4.1 3.1 4.7
World 91 89 92 76 75 77 43 41 46 30 3.0 2.7 3.2
Estimates of under-five, infant and neonatal mortality by World Health Organization regiona
Region
Under-five mortality rate (U5MR) with 90 percent uncertainty interval (deaths per 1,000 live births)
1990 2000 2015Millennium
Development Goal
target!for 2015
Annual rate of reduction (ARR) (percent)
1990-2015
U5MRLower bound
Upper bound U5MR
Lower bound
Upper bound U5MR
Lower bound
Upper bound ARR
Lower bound
Upper bound
Africa 177 174 181 153 150 157 81 76 91 59 3.1 2.7 3.4
Americas 43 41 44 26 25 27 15 14 16 14 4.2 3.9 4.5
Eastern Mediterranean 100 98 103 80 77 82 52 47 61 33 2.6 2.0 3.1
Europe 32 31 33 22 22 23 11 10 14 11 4.2 3.3 4.6
South-East Asia 118 115 121 84 81 86 43 39 47 39 4.1 3.7 4.5
Western Pacific 52 49 56 35 34 37 14 12 15 17 5.4 4.8 5.9
World 91 89 92 76 75 77 43 41 46 30 3.0 2.7 3.2
28
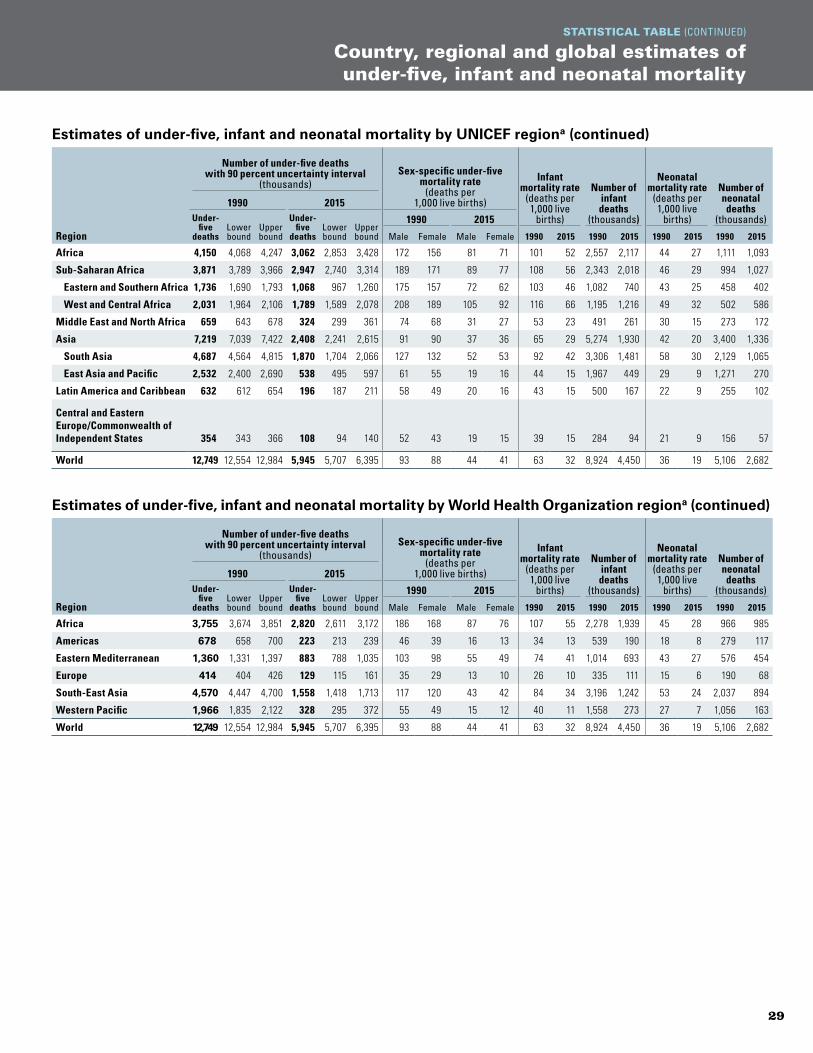
STATISTICAL TABLE (CONTINUED)
Country, regional and global estimates of under-five, infant and neonatal mortality
Estimates of under-five, infant and neonatal mortality by UNICEF regiona (continued)
Region
Number of under-five deaths with 90 percent uncertainty interval
(thousands)Sex-specific under-five
mortality!rate (deaths per
1,000 live births)
Infant mortality rate
(deaths per 1,000 live
births)
Number of infant deaths
(thousands)
Neonatal mortality rate
(deaths per 1,000 live
births)
Number of neonatal deaths
(thousands)1990 2015
Under-five
deathsLower bound
Upper bound
Under-five
deathsLower bound
Upper bound
1990 2015Male Female Male Female 1990 2015 1990 2015 1990 2015 1990 2015
Africa 4,150 4,068 4,247 3,062 2,853 3,428 172 156 81 71 101 52 2,557 2,117 44 27 1,111 1,093
Sub-Saharan Africa 3,871 3,789 3,966 2,947 2,740 3,314 189 171 89 77 108 56 2,343 2,018 46 29 994 1,027
Eastern and Southern Africa 1,736 1,690 1,793 1,068 967 1,260 175 157 72 62 103 46 1,082 740 43 25 458 402
West and Central Africa 2,031 1,964 2,106 1,789 1,589 2,078 208 189 105 92 116 66 1,195 1,216 49 32 502 586
Middle East and North Africa 659 643 678 324 299 361 74 68 31 27 53 23 491 261 30 15 273 172
Asia 7,219 7,039 7,422 2,408 2,241 2,615 91 90 37 36 65 29 5,274 1,930 42 20 3,400 1,336
South Asia 4,687 4,564 4,815 1,870 1,704 2,066 127 132 52 53 92 42 3,306 1,481 58 30 2,129 1,065
East Asia and Pacific 2,532 2,400 2,690 538 495 597 61 55 19 16 44 15 1,967 449 29 9 1,271 270
Latin America and Caribbean 632 612 654 196 187 211 58 49 20 16 43 15 500 167 22 9 255 102
Central and Eastern Europe/Commonwealth of Independent States 354 343 366 108 94 140 52 43 19 15 39 15 284 94 21 9 156 57
World 12,749 12,554 12,984 5,945 5,707 6,395 93 88 44 41 63 32 8,924 4,450 36 19 5,106 2,682
Estimates of under-five, infant and neonatal mortality by World Health Organization regiona (continued)
Region
Number of under-five deaths with 90 percent uncertainty interval
(thousands)Sex-specific under-five
mortality!rate (deaths per
1,000 live births)
Infant mortality rate
(deaths per 1,000 live
births)
Number of infant deaths
(thousands)
Neonatal mortality rate
(deaths per 1,000 live
births)
Number of neonatal deaths
(thousands)1990 2015
Under-five
deathsLower bound
Upper bound
Under-five
deathsLower bound
Upper bound
1990 2015Male Female Male Female 1990 2015 1990 2015 1990 2015 1990 2015
Africa 3,755 3,674 3,851 2,820 2,611 3,172 186 168 87 76 107 55 2,278 1,939 45 28 966 985
Americas 678 658 700 223 213 239 46 39 16 13 34 13 539 190 18 8 279 117
Eastern Mediterranean 1,360 1,331 1,397 883 788 1,035 103 98 55 49 74 41 1,014 693 43 27 576 454
Europe 414 404 426 129 115 161 35 29 13 10 26 10 335 111 15 6 190 68
South-East Asia 4,570 4,447 4,700 1,558 1,418 1,713 117 120 43 42 84 34 3,196 1,242 53 24 2,037 894
Western Pacific 1,966 1,835 2,122 328 295 372 55 49 15 12 40 11 1,558 273 27 7 1,056 163
World 12,749 12,554 12,984 5,945 5,707 6,395 93 88 44 41 63 32 8,924 4,450 36 19 5,106 2,682
29
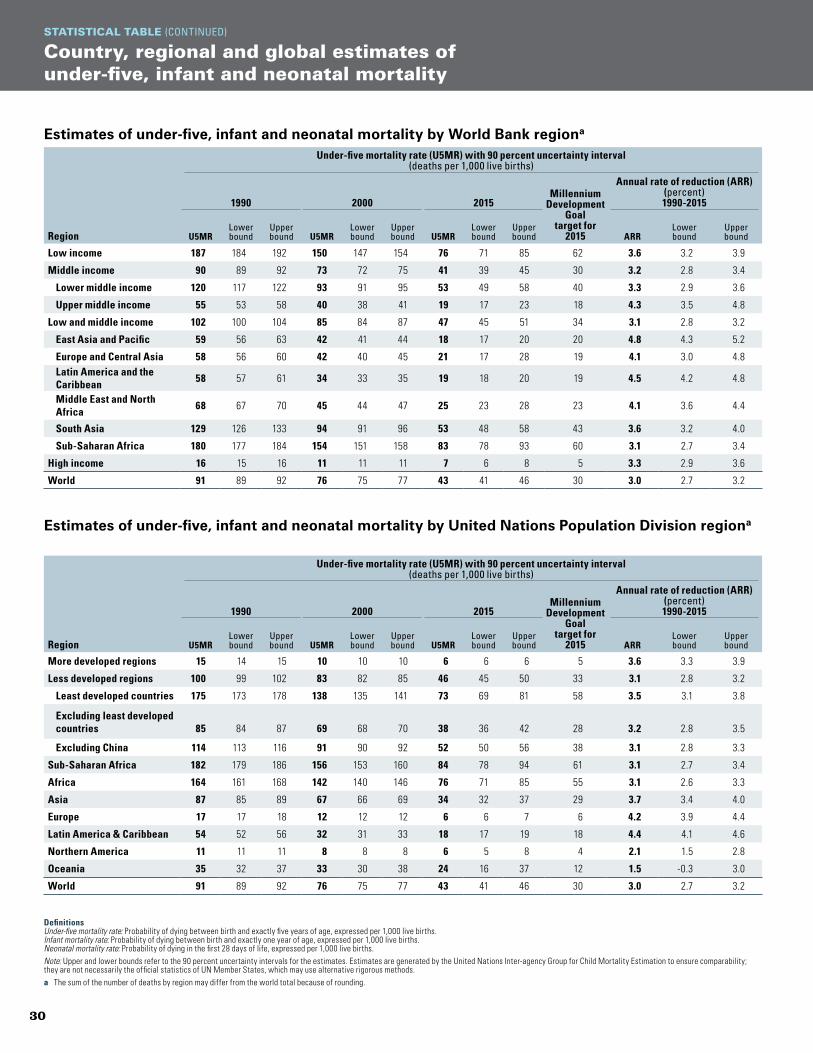
STATISTICAL TABLE (CONTINUED)
Country, regional and global estimates of under-five, infant and neonatal mortality
Estimates of under-five, infant and neonatal mortality by World Bank regiona
Region
Under-five mortality rate (U5MR) with 90 percent uncertainty interval (deaths per 1,000 live births)
1990 2000 2015Millennium
Development Goal
target!for 2015
Annual rate of reduction (ARR) (percent) 1990-2015
U5MRLower bound
Upper bound U5MR
Lower bound
Upper bound U5MR
Lower bound
Upper bound ARR
Lower bound
Upper bound
Low income 187 184 192 150 147 154 76 71 85 62 3.6 3.2 3.9
Middle income 90 89 92 73 72 75 41 39 45 30 3.2 2.8 3.4
Lower middle income 120 117 122 93 91 95 53 49 58 40 3.3 2.9 3.6
Upper middle income 55 53 58 40 38 41 19 17 23 18 4.3 3.5 4.8
Low and middle income 102 100 104 85 84 87 47 45 51 34 3.1 2.8 3.2
East Asia and Pacific 59 56 63 42 41 44 18 17 20 20 4.8 4.3 5.2
Europe and Central Asia 58 56 60 42 40 45 21 17 28 19 4.1 3.0 4.8Latin America and the Caribbean 58 57 61 34 33 35 19 18 20 19 4.5 4.2 4.8
Middle East and North Africa 68 67 70 45 44 47 25 23 28 23 4.1 3.6 4.4
South Asia 129 126 133 94 91 96 53 48 58 43 3.6 3.2 4.0
Sub-Saharan Africa 180 177 184 154 151 158 83 78 93 60 3.1 2.7 3.4
High income 16 15 16 11 11 11 7 6 8 5 3.3 2.9 3.6
World 91 89 92 76 75 77 43 41 46 30 3.0 2.7 3.2
Estimates of under-five, infant and neonatal mortality by United Nations Population Division regiona
Region
Under-five mortality rate (U5MR) with 90 percent uncertainty interval (deaths per 1,000 live births)
1990 2000 2015Millennium
Development Goal
target!for 2015
Annual rate of reduction (ARR) (percent) 1990-2015
U5MRLower bound
Upper bound U5MR
Lower bound
Upper bound U5MR
Lower bound
Upper bound ARR
Lower bound
Upper bound
More developed regions 15 14 15 10 10 10 6 6 6 5 3.6 3.3 3.9
Less developed regions 100 99 102 83 82 85 46 45 50 33 3.1 2.8 3.2
Least developed countries 175 173 178 138 135 141 73 69 81 58 3.5 3.1 3.8
Excluding least developed countries 85 84 87 69 68 70 38 36 42 28 3.2 2.8 3.5
Excluding China 114 113 116 91 90 92 52 50 56 38 3.1 2.8 3.3
Sub-Saharan Africa 182 179 186 156 153 160 84 78 94 61 3.1 2.7 3.4
Africa 164 161 168 142 140 146 76 71 85 55 3.1 2.6 3.3
Asia 87 85 89 67 66 69 34 32 37 29 3.7 3.4 4.0
Europe 17 17 18 12 12 12 6 6 7 6 4.2 3.9 4.4
Latin America & Caribbean 54 52 56 32 31 33 18 17 19 18 4.4 4.1 4.6
Northern America 11 11 11 8 8 8 6 5 8 4 2.1 1.5 2.8
Oceania 35 32 37 33 30 38 24 16 37 12 1.5 -0.3 3.0
World 91 89 92 76 75 77 43 41 46 30 3.0 2.7 3.2
DefinitionsUnder-five mortality rate: Probability of dying between birth and exactly five years of age, expressed per 1,000 live births.Infant mortality rate: Probability of dying between birth and exactly one year of age, expressed per 1,000 live births.Neonatal mortality rate: Probability of dying in the first 28 days of life, expressed per 1,000 live births.Note: Upper and lower bounds refer to the 90!percent uncertainty intervals for the estimates. Estimates are generated by the United Nations Inter-agency Group for Child Mortality Estimation to ensure comparability; they are not necessarily the official statistics of UN Member States, which may use alternative rigorous methods.a The sum of the number of deaths by region may differ from the world total because of rounding.
30
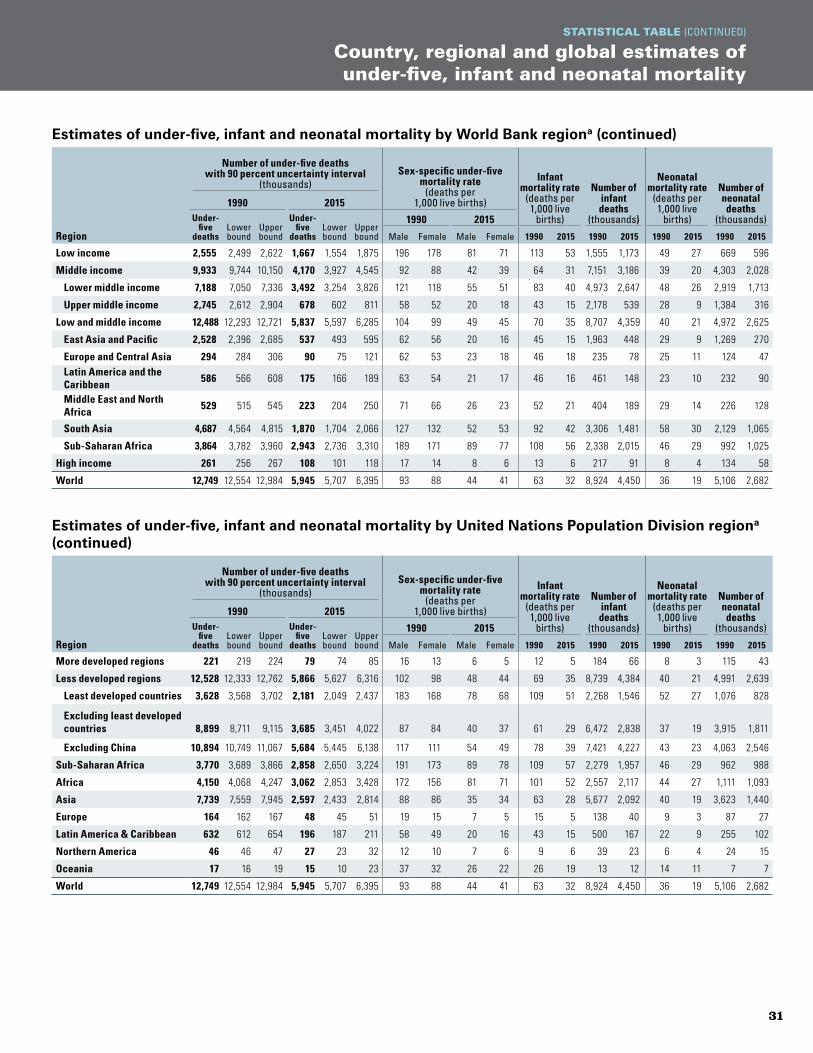
STATISTICAL TABLE (CONTINUED)
Country, regional and global estimates of under-five, infant and neonatal mortality
Estimates of under-five, infant and neonatal mortality by World Bank regiona (continued)
Region
Number of under-five deaths with 90 percent uncertainty interval
(thousands)Sex-specific under-five
mortality!rate (deaths per
1,000 live births)
Infant mortality rate
(deaths per 1,000 live
births)
Number of infant deaths
(thousands)
Neonatal mortality rate
(deaths per 1,000 live
births)
Number of neonatal deaths
(thousands)1990 2015
Under-five
deathsLower bound
Upper bound
Under-five
deathsLower bound
Upper bound
1990 2015Male Female Male Female 1990 2015 1990 2015 1990 2015 1990 2015
Low income 2,555 2,499 2,622 1,667 1,554 1,875 196 178 81 71 113 53 1,555 1,173 49 27 669 596
Middle income 9,933 9,744 10,150 4,170 3,927 4,545 92 88 42 39 64 31 7,151 3,186 39 20 4,303 2,028
Lower middle income 7,188 7,050 7,336 3,492 3,254 3,826 121 118 55 51 83 40 4,973 2,647 48 26 2,919 1,713
Upper middle income 2,745 2,612 2,904 678 602 811 58 52 20 18 43 15 2,178 539 28 9 1,384 316
Low and middle income 12,488 12,293 12,721 5,837 5,597 6,285 104 99 49 45 70 35 8,707 4,359 40 21 4,972 2,625
East Asia and Pacific 2,528 2,396 2,685 537 493 595 62 56 20 16 45 15 1,963 448 29 9 1,269 270
Europe and Central Asia 294 284 306 90 75 121 62 53 23 18 46 18 235 78 25 11 124 47Latin America and the Caribbean 586 566 608 175 166 189 63 54 21 17 46 16 461 148 23 10 232 90
Middle East and North Africa 529 515 545 223 204 250 71 66 26 23 52 21 404 189 29 14 226 128
South Asia 4,687 4,564 4,815 1,870 1,704 2,066 127 132 52 53 92 42 3,306 1,481 58 30 2,129 1,065
Sub-Saharan Africa 3,864 3,782 3,960 2,943 2,736 3,310 189 171 89 77 108 56 2,338 2,015 46 29 992 1,025
High income 261 256 267 108 101 118 17 14 8 6 13 6 217 91 8 4 134 58
World 12,749 12,554 12,984 5,945 5,707 6,395 93 88 44 41 63 32 8,924 4,450 36 19 5,106 2,682
Estimates of under-five, infant and neonatal mortality by United Nations Population Division regiona (continued)
Region
Number of under-five deaths with 90 percent uncertainty interval
(thousands)Sex-specific under-five
mortality!rate (deaths per
1,000 live births)
Infant mortality rate
(deaths per 1,000 live
births)
Number of infant deaths
(thousands)
Neonatal mortality rate
(deaths per 1,000 live
births)
Number of neonatal deaths
(thousands)1990 2015
Under-five
deathsLower bound
Upper bound
Under-five
deathsLower bound
Upper bound
1990 2015Male Female Male Female 1990 2015 1990 2015 1990 2015 1990 2015
More developed regions 221 219 224 79 74 85 16 13 6 5 12 5 184 66 8 3 115 43
Less developed regions 12,528 12,333 12,762 5,866 5,627 6,316 102 98 48 44 69 35 8,739 4,384 40 21 4,991 2,639
Least developed countries 3,628 3,568 3,702 2,181 2,049 2,437 183 168 78 68 109 51 2,268 1,546 52 27 1,076 828
Excluding least developed countries 8,899 8,711 9,115 3,685 3,451 4,022 87 84 40 37 61 29 6,472 2,838 37 19 3,915 1,811
Excluding China 10,894 10,749 11,067 5,684 5,445 6,138 117 111 54 49 78 39 7,421 4,227 43 23 4,063 2,546
Sub-Saharan Africa 3,770 3,689 3,866 2,858 2,650 3,224 191 173 89 78 109 57 2,279 1,957 46 29 962 988
Africa 4,150 4,068 4,247 3,062 2,853 3,428 172 156 81 71 101 52 2,557 2,117 44 27 1,111 1,093
Asia 7,739 7,559 7,945 2,597 2,433 2,814 88 86 35 34 63 28 5,677 2,092 40 19 3,623 1,440
Europe 164 162 167 48 45 51 19 15 7 5 15 5 138 40 9 3 87 27
Latin America & Caribbean 632 612 654 196 187 211 58 49 20 16 43 15 500 167 22 9 255 102
Northern America 46 46 47 27 23 32 12 10 7 6 9 6 39 23 6 4 24 15
Oceania 17 16 19 15 10 23 37 32 26 22 26 19 13 12 14 11 7 7
World 12,749 12,554 12,984 5,945 5,707 6,395 93 88 44 41 63 32 8,924 4,450 36 19 5,106 2,682
31

Regional Classifications
The regional classi!cations that are referred to in the report and for which aggregate data are provided in the statistical table are Millennium Development Goal regions (see below). Aggregates presented for member organizations of the Inter-agency Group for Child Mortality Estimation may differ. Regions with the same names in different agencies may include different countries.
Developed regionsAlbania, Andorra, Australia, Austria, Belarus, Bel-gium, Bosnia and Herzegovina, Bulgaria, Canada, Croatia, Cyprus, Czech Republic, Denmark, Estonia, Finland, France, Germany, Greece, Hungary, Iceland, Ireland, Israel, Italy, Japan, Latvia, Liechtenstein, Lithuania, Luxembourg, Malta, Monaco, Montenegro, Netherlands, New Zealand, Norway, Poland, Portugal, Republic of Moldova, Romania, Russian Federation, San Marino, Serbia, Slovakia, Slovenia, Spain, Sweden, Switzerland, The former Yugoslav Republic of Mace-donia, Ukraine, United Kingdom, United States
Developing regionsCaucasus and Central AsiaArmenia, Azerbaijan, Georgia, Kazakhstan, Kyrgyz-stan, Tajikistan, Turkmenistan, Uzbekistan
Eastern Asia China, Democratic People’s Republic of Korea, Mongolia, Republic of Korea
Latin America and the CaribbeanAntigua and Barbuda, Argentina, Bahamas, Barba-dos, Belize, Bolivia (Plurinational State of), Brazil, Chile, Colombia, Costa Rica, Cuba, Dominica, Domin-ican Republic, Ecuador, El Salvador, Grenada, Gua-temala, Guyana, Haiti, Honduras, Jamaica, Mexico, Nicaragua, Panama, Paraguay, Peru, Saint Kitts and Nevis, Saint Lucia, Saint Vincent and the Grenadines, Suriname, Trinidad and Tobago, Uruguay, Venezuela (Bolivarian Republic of)
Northern AfricaAlgeria, Egypt, Libya, Morocco, Tunisia
OceaniaCook Islands, Fiji, Kiribati, Marshall Islands, Micronesia (Federated States of), Nauru, Niue, Palau, Papua New Guinea, Samoa, Solomon Islands, Tonga, Tuvalu, Vanuatu
South-eastern AsiaBrunei Darussalam, Cambodia, Indonesia, Lao People’s Democratic Republic, Malaysia, Myanmar, Philippines, Singapore, Thailand, Timor-Leste, Viet Nam
Southern AsiaAfghanistan, Bangladesh, Bhutan, India, Iran (Islamic Republic of), Maldives, Nepal, Pakistan, Sri Lanka
Sub-Saharan AfricaAngola, Benin, Botswana, Burkina Faso, Burundi, Cabo Verde, Cameroon, Central African Republic, Chad, Comoros, Congo, Côte d’Ivoire, Democratic Republic of the Congo, Djibouti, Equatorial Guinea, Eritrea, Ethiopia, Gabon, Gambia, Ghana, Guinea, Guinea-Bissau, Kenya, Lesotho, Liberia, Madagascar, Malawi, Mali, Mauritania, Mauritius, Mozambique, Namibia, Niger, Nigeria, Rwanda, Sao Tome and Principe, Senegal, Seychelles, Sierra Leone, Soma-lia, South Africa, South Sudan, Sudan, Swaziland, Togo, Uganda, United Republic of Tanzania, Zambia, Zimbabwe
Western AsiaBahrain, Iraq, Jordan, Kuwait, Lebanon, Oman, Qatar, Saudi Arabia, State of Palestine, Syrian Arab Republic, Turkey, United Arab Emirates, Yemen
32

Cover photo: © UNICEF/NYHQ2010-2371/AsselinPhoto on page 2: © UNICEF/UKLA2014 - 1115/LovellPhoto on page 10: © UNICEF/NYHQ2014-3622/Pirozzi

The UN Inter-agency Group for Child Mortality Estimation
The United Nations Inter-agency Group for Child Mortality Estimation (UN IGME) was formed in 2004 to share data on child mortality, harmonize estimates within the United Nations system, improve methods for child mortality estimation, report on progress towards the Millennium Development Goals and enhance country capacity to produce timely and properly assessed estimates of child mortality. The UN IGME includes the United Nations Children’s Fund, the World Health Organization, the World Bank and the United Nations Population Division of the Department of Economic and Social Affairs as full members.
UN IGME’s independent Technical Advisory Group, comprising eminent scholars and independent experts in demography, provides technical guidance on estimation methods, technical issues and strategies for data analysis and data quality assessment.
UN IGME updates its child mortality estimates annually after reviewing newly available data and assessing data quality. This report contains the latest UN IGME estimates of child mortality at the country, regional and global levels. Country-specific estimates and the data used to derive them are available at <www.childmortality.org>.
For more information on child mortality estimates and the work of UN IGME, contact <[email protected]>.
United Nations
Levels & Trends in
Child Mortality
Report 2014Estimates Developed by the UN Inter-agency Group for Child Mortality Estimation
United Nations