level 4, 1-3 smail street melbourne it ltd (asx: … sachs...goldman sachs eighth annual small &...
TRANSCRIPT
Melbourne IT Ltd ABN 21 073 716 793 ACN 073 716 793 Level 4, 1-3 Smail Street Ultimo NSW 2007 Australia www.melbourneit.info
27 April 2017
MELBOURNE IT LTD (ASX: MLB)
Goldman Sachs Eighth Annual Small & Mid-Cap Conference Presentation
Attached is a copy of the presentation to be delivered by Melbourne IT’s CEO & Managing Director, Martin Mercer, at the Goldman Sachs Eighth Annual Small and Mid-Cap Conference today in Sydney.
For any enquiries, contact:
Martin Mercer Chief Executive Officer Tel. No. (02) 9934 0555
ENDS.
About Melbourne IT
Melbourne IT Group is a publicly listed company with offices in Melbourne, Sydney, Brisbane, Auckland and Canberra. Melbourne IT’s purpose is to “fuel our customers’ success through the smart use of technology”. By 2020 we aim to have fuelled the success of over one million businesses. Our customers will love us, our people will be our most passionate advocates, and our investors will be rewarded.
Melbourne IT operates two businesses marketed under 7 brands.
The Small and Medium Business Division (SMB) is Australia’s largest domains and hosting business with revenues of approximately $100m. The SMB business operates under the Melbourne IT, WebCentral, Netregistry and TPP brands.
The Enterprise Services Business (ES) is Australia’s leading cloud enabled software and services business with revenues of approximately $70m. ES is based in Sydney, Melbourne and Brisbane and has a blue chip customer base. It operates under three brands, Melbourne IT, Infoready and Outware.
Visit: www.melbourneit.com.au

Transforming Melbourne ITGoldman Sachs Small & Mid Cap ConferenceApril 2017

Purpose and Vision
• We fuel our customers’ success through the smart use of technology.
• We aspire to be Australia’s most impactful digital technology partner.
2

3
Priority Status Comment
Return SMB to Growth
We have repaired the legacy domains and hosting business and succeeded in developing a new “managed marketing solutions” business. Solutions revenue now accounts for 20% of total SMB revenue and is growing at 56%pa. SMB enters 2017 growing at the top and bottom lines.
Accelerate the Transformation of ES
ES is well on its way to becoming Australia’s most impactful digital technology partner for the enterprise market. Over the past three years ES has tripled in size. In 2016 revenue grew 73% while EBITDA grew 87%. ES expects to enjoy strong growth in 2017.
Realise Synergy Savings
The acquisitions of Netregistry (Feb 2014) and Uber Global (April 2015) were expected to deliver combined synergy savings of $10M ($5M by the end of 2015, another $2.5M in 2016, and the final $2.5M in 2017). At the end of 2016 we had realised $8.5M of savings ($1.0M more than originally targeted) and have clear line of sight to the remaining $1.5M.
We have achieved the three priorities that underpinned our turnaround. The future is all about growth.
Priorities: mission accomplished

Growth: consistently strong growth
4Underlying financial information presented adjusts for one-off and non-recurring costs and the pro forma impacts of acquisitions and divestments made in the financial period as outlined in the previous slides.
3.7 3.6 5.2 11.2 2.1
9.2 11.3
17.0
0
10
20
30
2013 2014 2015 2016
Reported EBITDA ($m)
5.8
12.816.5
28.2
3.7 6.1 10.0 10.6 2.1
10.2
12.0 17.8
0
10
20
30
2013 2014 2015 2016
Underlying EBITDA ($m)
5.8
16.3
22.0
28.4
3.9 3.1 4.6 4.6 2.3 5.8
6.0 9.7
0
10
20
2013 2014 2015 2016
Underlying NPAT ($m)
6.28.9
10.7
14.3
4.7 3.3 5.0 4.6
2.8 6.2 6.5 9.6
0
10
20
2013 2014 2015 2016
Underlying EPS (cents)
7.59.5
11.5
14.2
H1H2
3YR CAGR 69%
3YR CAGR 70%
3YR CAGR 24%
3YR CAGR 32%

FY 2017 Outlook: strong growth to continue
5
Measure Range ⇳ %1 Comment
Underlying EBITDA $31M - $34M 15%/20%2
Includes investment of $1.7M in 2017 to support the growth of the business, including $400K in new roles in Shared Services to keep up with the growth in the business, $300K in data analytics to support growth in SMB, $1M to ensure sustainable growth in the rapidly growing ES business.
Underlying EPS $0.15 - $0.17 13%
Dividend 55% - 75% N/A Dividends in FY 2017 will be determined by reference to a payout ratio in the range of 55% to 75% of reported NPAT.
Organic growth will drive another strong year in 2017
1. Change on last year calculated from the mid-point of the guidance range and last year’s actual result2. 20% growth after adjusting for $1.7M incremental investmentNB. Figures throughout this document may not be exact due to rounding and include non-IFRS financial information that is relevant for users understanding the underlying performance.

6
98%
2%
SMB
Revenue: high quality revenue with faster growing solutions business
42%
48% 10%
ES
75%
20%5%
Group
RecurringRepeatableOne Off
Definitions: 1. recurring revenue is contracted annuity income, 2. repeatable projects are instances where we have been consistently billing the same customer for 2 or more years, 3. one-off project revenue is where we do a piece of work for a customer and there is no follow on business

ES: strategy and execution
7
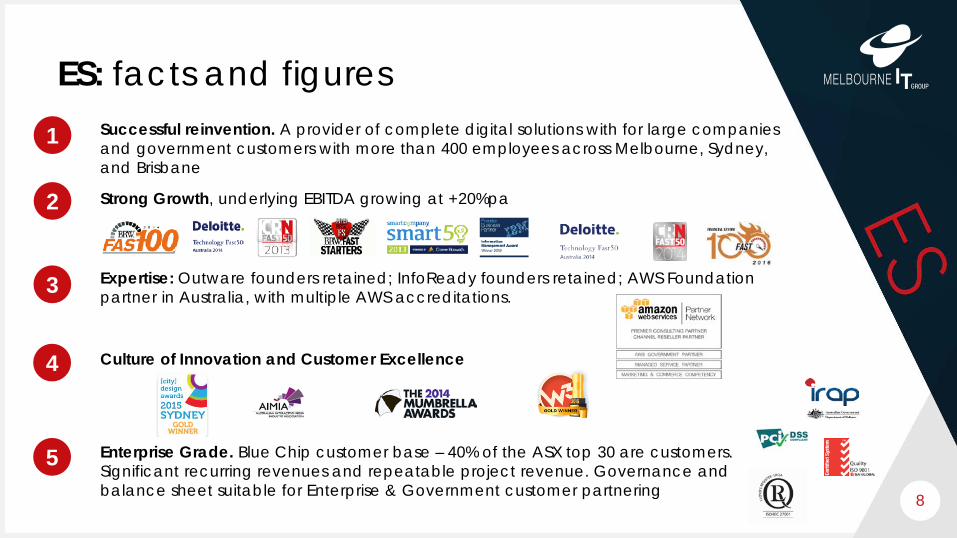
ES: facts and figures
8
Successful reinvention. A provider of complete digital solutions with for large companies and government customers with more than 400 employees across Melbourne, Sydney, and Brisbane
Strong Growth, underlying EBITDA growing at +20%pa
Expertise: Outware founders retained; InfoReady founders retained; AWS Foundation partner in Australia, with multiple AWS accreditations.
Culture of Innovation and Customer Excellence
Enterprise Grade. Blue Chip customer base – 40% of the ASX top 30 are customers. Significant recurring revenues and repeatable project revenue. Governance and balance sheet suitable for Enterprise & Government customer partnering
1
2
3
4
5

9
Digital Solutions: an attractive and strongly growing market
Annual Growth Rate 2015Key: Source: IBM 2015
$1.4b Market$6.5b Market
+
Complete Digital Solutions

Execution: capturing revenue synergies
10
Data & Analytics(Infoready)
Mobile(Outware Mobile)
Cloud & Managed Services
June2016 Dec
2016
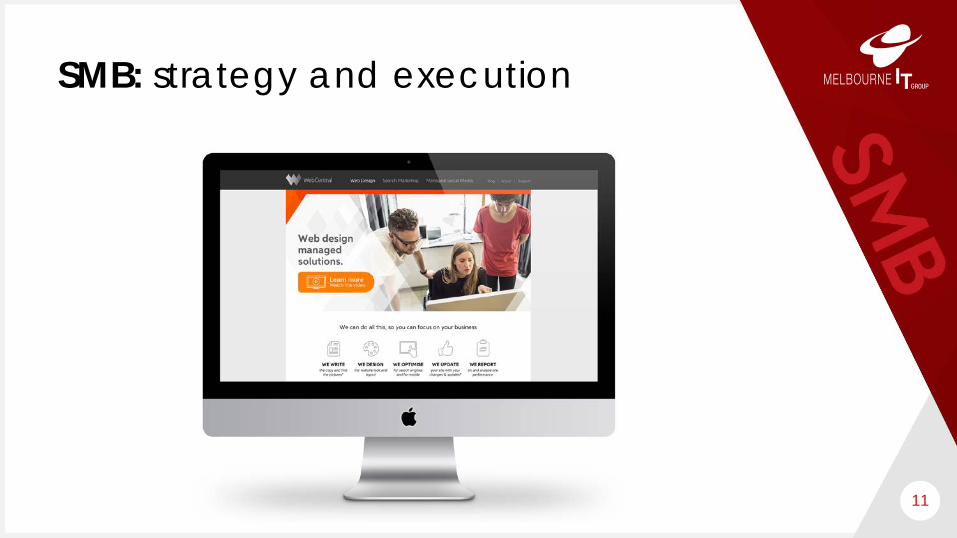
SMB: strategy and execution
11

SMB: facts and figures
12
More than 300 employees with offices in Melbourne, Sydney, Brisbane and Canberra
Largest Australian domain name and web hosting provider, with more than 40% market share
We have helped fuel the success of more than 600,000 Australian SMB customers
A portfolio of SMB brands:
Growing web solutions business – the key to revenue growth and value creation
1
2
3
4
5Solutions Revenue (20%) – managed marketing services comprising web design and digital marketing
Components Revenue (80%) – domain names, web hosting and email

Customer Journeys: the key to value creation
131. IPSOS: Melbourne IT Customer Web Journey Study2. IPSOS report 3. IPSOS report
4. IPSOS report

14
Execution: revenue growth
85%
15%
80%
20%
2015
REVENUE SPLIT BY SEGMENT
SOLUTIONSCOMPONENTS
20160
2
4
6
8
10
12
14
16
18
2014Q1
2014Q2
2014Q3
2014Q4
2015Q1
2015Q2
2015Q3
2015Q4
2016Q1
2016Q2
2016Q3
2016Q4
$M
Direct Revenue - Components vs Solutions
Solutions Components
Acquisition of Uber Global
Acquisition of Netregistry

Execution: stable domain name revenue and volumes
15
-80%
-70%
-60%
-50%
-40%
-30%
-20%
-10%
0%
10%
20%
0
10
20
30
40
50
60
70
2007
Q1
2007
Q2
2007
Q3
2007
Q4
2008
Q1
2008
Q2
2008
Q3
2008
Q4
2009
Q1
2009
Q2
2009
Q3
2009
Q4
2010
Q1
2010
Q2
2010
Q3
2010
Q4
2011
Q1
2011
Q2
2011
Q3
2011
Q4
2012
Q1
2012
Q2
2012
Q3
2012
Q4
2013
Q1
2013
Q2
2013
Q3
2013
Q4
2014
Q1
2014
Q2
2014
Q3
2014
Q4
2015
Q1
2015
Q2
2015
Q3
2015
Q4
2016
Q1
2016
Q2
2016
Q3
2016
Q4
Pric
e In
dex
Units
('00
0)
Direct .AU Domain Names
Commoditised
Premium Priced
Price Index - Direct
Total Units PCP
CrazyDomainsenters market GoDaddy
enters market
Netregistry acquired. Average price drops due to mix change.
Stable price despite
progressive mix change
Seasonal pattern and consistent growth on PcP
Summary
16
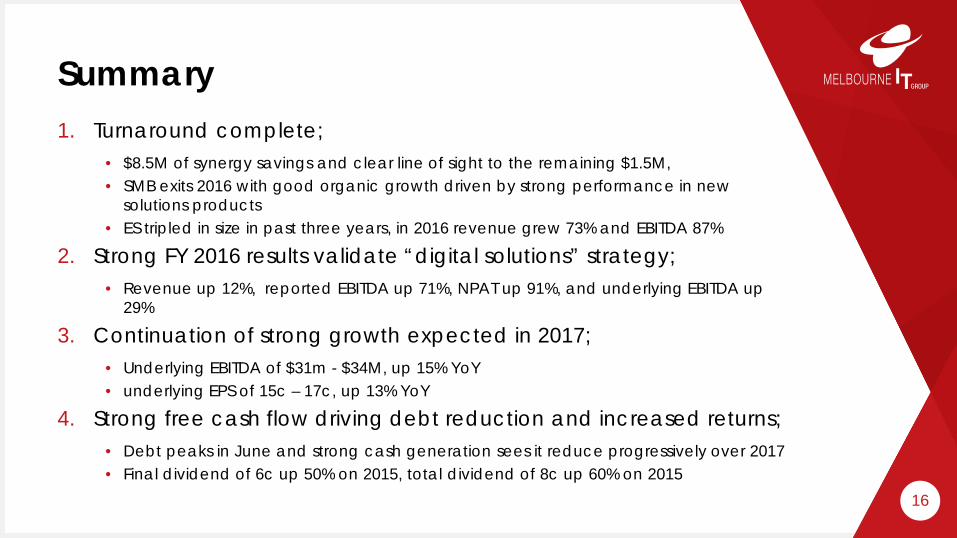
1. Turnaround complete;• $8.5M of synergy savings and clear line of sight to the remaining $1.5M,• SMB exits 2016 with good organic growth driven by strong performance in new
solutions products• ES tripled in size in past three years, in 2016 revenue grew 73% and EBITDA 87%
2. Strong FY 2016 results validate “digital solutions” strategy;• Revenue up 12%, reported EBITDA up 71%, NPAT up 91%, and underlying EBITDA up
29%
3. Continuation of strong growth expected in 2017;• Underlying EBITDA of $31m - $34M, up 15% YoY• underlying EPS of 15c – 17c, up 13% YoY
4. Strong free cash flow driving debt reduction and increased returns;• Debt peaks in June and strong cash generation sees it reduce progressively over 2017• Final dividend of 6c up 50% on 2015, total dividend of 8c up 60% on 2015