letters to the editor • cycling of antibiotics for the
TRANSCRIPT

PO Box 2345, Beijing 100023, China World J Gastroenterol 2005;11(41):6407-6408www.wjgnet.com World Journal of Gastroenterology ISSN [email protected] © 2005 The WJG Press and Elsevier Inc. All rights reserved.E L S E V I E R
• LETTERS TO THE EDITOR •
Cycling of antibiotics for the prophylaxis of recurrent spontaneous bacterial peritonitis in a cirrhotic patient
N Assy, S Schlesinger, D Miron, O Hussein
N Assy, S Schlesinger, D Miron, O Hussein, Department of Internal Medicine A, Sieff Government Hospital, Safed, Israel, Technion Institute, Haifa, IsraelCorrespondence to: Liver Unit, Sieff Government Hospital, Safed, Israel, Technion Institute, Haifa, Israel. [email protected]: 2004-11-21 Accepted: 2005-01-01
© 2005 The WJG Press and Elsevier Inc. All rights reserved.
Assy N, Schlesinger S, Miron D, Hussein O. Cycling of antibiotics for the prophylaxis of recurrent spontaneous bacter ia l per i tonit is in a c irrhot ic pat ient. World J Gastroenterol 2005; 11(41): 6407-6408http://www.wjgnet.com/1007-9327/11/6407.asp
To T��� ����To�T��� ����To� ����To�More than 80% of cirrhotic patients who have been treat-ed successfully for spontaneous bacterial peritonitis (SBP) experience a recurrence[1,2]. Long-term prophylaxis with single daily oral antibiotic has been shown to be cost ef-fective in delaying a recurrence but only for a short time[3]. What has never been tested in this population is the cy-cling of antibiotics. We report the beneficial use of anti-biotic cycling for 36 weeks in a 74-year-old woman with cryptogenic cirrhosis and recurrent SBP.
The patient was admitted because of abdominal pain. Physical examination revealed a malnourished woman with mild jaundice. Blood pressure was 100/60 mmHg, pulse 110 beats /min and temperature 37.4 °C. There was mod-erate ascites, splenomegaly and multiple signs of chronic
liver disease. Plasma levels of urea, creatinine, and electro-lytes were within normal limits. Blood platelets were 80 000 per mm³; prothrombin time by international normalized ratio (INR) was1.4; serum albumin, 3.0 g per deciliter;
bilirubin, 2.5 mg per deciliter; alanine aminotransferase, 28 U per liter, ascitic protein, 1.0 gr per deciliter and ascitic white blood cells 1500 cell per mm³ with 75% neurophils. Ascitic culture was positive for Escherichia coli bacteria. Blood culture was negative. Abdominal ultrasonography revealed signs of portal hypertension. The patient was on prophylactic therapy with trimethoprim-sulphamethoxa-zole 160/800 mg daily during the last 3 mo. On admission the patient was treated with intravenous ceftriaxone 1 gr bid
for 5 d with good response (ascitic neurophil decreased bellow 200 cell /mm3). The patient was discharged with a recommendation to be on a prophylactic oral cefuroxime 500 mg qd for 6 wk followed by oral ofloxacin 200 mg qd for 6 wk, followed further by amoxicillin-clavulanic acid 875/125 mg qd for another 6 wk and finally trimethoprim-sulphamethoxazole 160/800 mg for an additional 6 wk (four cycles). The regimen was repeated. Gradually the patient’s condition improved, the number of SBP episodes decreased and her ascitic neutrophil count returned to baseline levels (<100 cell/mm3). Repeated ascitic cultures during follow up of 36 wk was negative for bacteria.
Several strategies have been suggested to prevent or reduce bacterial resistance to antimicrobials, including cy-cling[4]. This strategy has been studied recently in intensive care units and has resulted in fewer infections and in lower mortality[5]. The basic principle of cycling antibiotics is that a bacterium that becomes resistant (by plasmids, bacterio-phages, transposons or integrons) to the first course of treatment would remain susceptible to the second regimen. If it is resistant to the second regimen, the third regimen should cope with the resistance. The selection of antibi-otic cycling schedule in this case was arbitrary. Amoxicillin-clavulanic acid eliminates both aerobic and the anaerobic bacteria which could contribute to the development of multi-resistant organism. However, repeated ascites and blood culture were negative for bacteria, so the antibiotic resistance profile and the molecular evidence of bacterial translocation were not performed. Our report suggests the need for a randomized, prospective study of cycling of antibiotic prophylaxis in patients with recurrent SBP. The timing, number and order of cycles directed to prevent selection pressure of bacterial resistance remain to be de-termined.
���F�����NC��S 1 Bleichner G, Boulanger R, Squara P, Sollet JP, Parent A. Fre-
quency of infections in cirrhotic patients presenting with acute gastrointestinal haemorrhage. Br J Surg 1986; 73: 724-726
2 Titó L, Rimola A, Ginès P, Llach J, Arroyo V, Rodés J. Recur-rence of spontaneous bacterial peritonitis in cirrhosis: frequen-cy and predictive factors. Hepatology 1988; 8: 27-31
3 Ginés P, Rimola A, Planas R, Vargas V, Marco F, Almela M, Forné M, Miranda ML, Llach J, Salmerón JM. Norfloxacin pre-vents spontaneous bacterial peritonitis recurrence in cirrhosis: results of a double blind, placebo-controlled trial. Hepatology 1990; 12: 716-724716-724
4 Shlaes DM, Gerding DN, John JF Jr, Craig WA, Bornstein DL, Duncan RA, Eckman MR, Farrer WE, Greene WH, Lorian

6408 ISSN 1007-9327 CN 14-1219/ R World J Gastroenterol November 7, 2005 Volume 11 Number 41
V, Levy S, McGowan JE Jr, Paul SM, Ruskin J, Tenover FC, Watanakunakorn C. Society for Healthcare Epidemiology of America and Infectious Diseases Society of America Joint Committee on the Prevention of Antimicrobial Resistance: guidelines for the prevention of antimicrobial resistance in
hospitals. Infect Control Hosp Epidemiol 1997; 18: 275-291275-29129191 5 Raymond DP, Pelletier SJ, Crabtree TD, Gleason TG, Hamm
LL, Pruett TL, Sawyer RG. Impact of a rotating empiric antibi-otic schedule on infectious mortality in an intensive care unit. Crit Care Med 2001; 29: 1101-11081101-1108
Science Editor Li WZ Language Editor ELsevier HK

PO Box 2345, Beijing 100023, China World J Gastroenterol 2005;11(41):6409www.wjgnet.com World Journal of Gastroenterology ISSN [email protected] © 2005 The WJG Press and Elsevier Inc. All rights reserved.E L S E V I E R
• �������� ��� ��� ������� •�������� ��� ��� ������� ••
Is there an association of microscopic colitis and irritable bowel syndrome-A subgroup analysis of placebo-controlled trials
Ahmed Madisch, Birgit Bethke, Manfred Stolte, Stephan Miehlke
Ahmed Madisch, Stephan Miehlke, Medical Department I, Technical University Hospital Dresden;Birgit Bethke, Manfred Stolte, Institute for Pathology, Klinikum Bayreuth, Bayreuth, GermanyCorrespondence to: �hmed Madisch, MD, Medical Department�hmed Madisch, MD, Medical Department I, Technical University Hospital, Fetscherstr. 74, 01307 Dresden, Germany. [email protected]: +49-351-458-4780 Fax: +49-351-458-4394Received: 2005-06-27 Accepted: 2005-07-14
©2005 The WJG Press and Elsevier Inc. All rights reserved.
Key words: Microscopic colitis�� Collageno�s colitis��Microscopic colitis�� Collageno�s colitis��icroscopic colitis�� Collageno�s colitis��Collageno�s colitis��ollageno�s colitis�� L�mphoc�tic colitis�� Irrita�le �o�el s�ndrome�mphoc�tic colitis�� Irrita�le �o�el s�ndromeIrrita�le �o�el s�ndromerrita�le �o�el s�ndrome
Madisch A, Bethke B, Stolte M, Miehlke S. Is there an association of microscopic colitis and irrita�le �o�el s�ndrome-A s��gro�p anal�sis of place�o-controlled trials.World J Gastroenterol 2005�� 11(41): 6409http://���.�jgnet.com/1007-9327/11/6409.asp
T�� T��� ����T����� T��� ����T��� T��� ����T������ ����T�������T�����T���With great interest we read the recent retrospectice study by Barta et al (1) dealing with the clinical presentation of patients with microscopic colitis. They investigated in a cohort of 53 patients with microscopic colitis (46 with collagenous colitis, 7 with lymphocytic colitis) the relationship between microscopic colitis and both constipation and diarrhea. One of their mean finding was that abdominal pain, diarrhea and constipation was a common symptom complex of patients with microscopic colitis, thus the face of microcopic colitis resembles the subgroups of irritable bowel syndrome (IBS).
Irritable bowel syndrome is highly prevalent disorder. Consensus diagnostic criteria (Rome II) based on symptoms have been established to aid the diagnosis of IBS. Microscopic colitis, encompassing collagenous and lymphocytic colitis, is diagnosed by histologic criteria. Since symptoms of microscopic colitis and both diarrhea predominant irritable bowel syndrome or functional diarrhea are similar, a considerable number of patients with micoscopic colitis may be misdiagnosed as IBS or functional diarrhea or a disease overlap could be present in a subgroup of patients.
We would like to confirm the data by Barta et al[1] presenting a subgroup analysis of placebo-controlled trials, in which we evaluate the possible symptom overlap between microscopic colitis and IBS. We aimed to assess the proportion of patients with histologically confirmed
microscopic colitis who fulfill the Rom-II-criteria for IBS and functional diarrhea[2] .
We selected a large patient cohort with histologically confirmed symptomatic microscopic col i t is, who participated in placebo-controlled trials of our group. Baseline gastrointestinal symptoms were assessed by standardized questionnaires and ascertained consistent with Rome-II-criteria (chronic abdominal pain and/or stool abnormalities for at least 12 wk in the preceding 12 mo, no alarm symptoms such as weight loss, no findings in the routine procedures including colonoscopy).
E igh ty - two cases o f mic roscop ic co l i t i s (74 collagenous, 8 lymphocytic) were included in this analysis. The mean age was 57 years (30-80). Seventy-three % were women. The mean stool frequency per day was 6 (range 3-15). The duration of symptoms prior to histological diagnosis of microscopic colitis ranged between 1 and 156 mo with a mean of 28 mo. Forty-seven patients (57.3%) had concomitant abdominal pain.
Twenty-three patients (28.1%) met the Rome-II-criteria for diarrhea-predominant IBS. Six patients (7.3%) fulfilled the criteria for functional diarrhea. If the criteria for duration of symptoms were excluded from our analysis, the corresponding rates were 65% and 13.4%, respectively These data clearly demonstrate that a considerable group of patients with microscopic colitis have diarrhea-predominant IBS- or functional diarrhea-like symptoms. Thus, patients with microscopic colitis could be misdiagnosed as IBS or functional diarrhea. Additionally, because of the high frequency of IBS, a disease overlap could be present in a subgroup of patients as it was shown between IBS and celiac disease[3]. We conclude that the clinical symptom-based criteria of IBS are not specific enough to rule out the diagnosis of microscopic colitis. Therefore, patients with diarrhea-predominance of IBS-like symptoms should undergo matrix biopsies from the entire colon to investigate for possible microscopic colitis especially biopsies from the right colon are of importance because the left colon sometimes is less involved.
���F�����NC��S1 Barta Z, Mekkel G, Csípo I, Tóth L, Szakáll S, Szabó GG, Bakó G,
Szegedi G, Zeher M. Microscopic colitis: a retrospective study of clinical presentation in 53 patients. World J Gastroenterol 2005; 11: 1351-1355
2 Thompson WG, Longstreth GF, Drossman DA, Heaton KW, Irvine EJ, Müller-Lissner SA. Functional bowel disorders and functional abdominal pain. Gut 1999; 45 Suppl 2: II43-II47
3 Wahnschaffe U, Ullrich R, Riecken EO, Schulzke JD. CeliacCeliac disease-like abnormalities in a subgroup of patients with irri-table bowel syndrome. Gastroenterology 2001; 121: 1329-1338
Science Editor Guo SY Language Editor Elsevier HK

PO Box 2345, Beijing 100023, China World J Gastroenterol 2005;11(41):6410-6415www.wjgnet.com World Journal of Gastroenterology ISSN [email protected] © 2005 The WJG Press and Elsevier Inc. All rights reserved.E L S E V I E R
•������ ���������� •������ ���������� • •
Kei Fujiwara, Etsuro Orito, Tomoyoshi Ohno, Kanji Sugihara, Izumi Hasegawa, Mayumi Sakurai, Kiyoaki Ito, Atsushi Ozasa, Ryuzo Ueda, Department of Internal Medicine and Molecular Science, Nagoya City University Graduate School of Medical Sciences, Nagoya, JapanYasuhito Tanaka, Takanobu Kato, Masashi Mizokami, Department of Clinical Molecular Informative Medicine, Nagoya City University Graduate School of Medical Sciences, Nagoya, JapanYuko Sakamoto, Namiko Yoshihara, AIDS Research Center, National Institute of Infectious Disease, Tokyo, JapanIsao Arita, Agency for Cooperation in International Health, Kumamoto, JapanAhmed El-Gohary, Clinical Pathology Department, Faculty of Medicine, Suez Canal University, Ismailia, EgyptAgossou Benoit, Central National Blood Transfusion Center, Cotonou, BeninSophie I Ogoundele-Akplogan, Hematology Lab-CNHUC, Cotonou, BeninCorrespondence to: Dr Masashi Mizokami, Department of Clinical Molecular Informative Medicine, Nagoya City University Graduate School of Medical Sciences, 1 Kawasumi, Mizuho, Nagoya 467-8601, Japan. [email protected]: +81-52-853-8292 Fax: +81-52-842-0021Received: 2005-02-15 Accepted: 2005-03-23
AbstractAIM: To determine the distribution of Hepatitis B virus (HBV) genotypes in Benin, and to clarify the virological characteristics of the dominant genotype.
METHODS: Among 500 blood donors in Benin, 21 HBsAg-positive donors were enrolled in the study. HBV genotypes were determined by enzyme immunoassay and restriction fragment length polymorphism. Complete genome sequences were determined by PCR and direct sequencing.
RESULTS: HBV genotype E (HBV/E) was detected in 20/21 (95.2%), and HBV/A in 1/21 (4.8%). From the age-specific prevalence of HBeAg to anti-HBe seroconversion (SC) in 19 HBV/E subjects, SC was estimated to occur frequently in late teens in HBV/E. The comparison of four complete HBV/E genomes from HBeAg-positive subjects in this study and five HBV/E sequences recruited from the database revealed that
HBV/E was distributed throughout West Africa with very low genetic diversity (nucleotide homology 96.7-99.2%). Based on the sequences in the basic core promoter (BCP) to precore region of the nine HBV/E isolates compared to those of the other genotypes, a nucleotide substitution in the BCP, G1757A, was observed in HBV/E.
CONCLUSION: HBV/E is predominant in the Republic of Benin, and SC is estimated to occur in late teens in HBV/E. The specific nucleotide substitution G1757A in BCP, which might influence the virological characteristics, is observed in HBV/E.
©2005 The WJG Press and Elsevier Inc. All rights reserved.
Key words: HBV genotype; West Africa; Basic core promoter
Fujiwara K, Tanaka Y, Orito E, Ohno T, Kato T, Sugihara K, Hasegawa I, Sakurai M, Ito K, Ozasa A, Sakamoto Y, Arita I, El-Gohary A, Benoit A, Ogoundele-Akplogan SI, Yoshihara N, Ueda R, Mizokami M. Distribution of HBV genotypes among HBV carriers in Benin: Phylogenetic analysis and virological characteristic of HBV genotype E. World J Gastroenterol 2005; 11(41):6410-6415http://www.wjgnet.com/1007-9327/11/6410.asp
INTRODUCTIONHepatitis B virus(HBV) is a member of the family Hepadnaviridae. This virus is a small DNA virus with a partially double-stranded 3.2-kb genome. HBV has been classified into seven genotypes based on the sequence divergence over the entire genome exceeding 8%[1,2]. The seven genotypes show a distinctive geographical distribution. HBV genotype A (HBV/A) is prevalent in Northwestern Europe, North America, and Africa[3]. HBV/B and HBV/C are characteristics of Asia. HBV/D is predominant in the Mediterranean area, HBV/E in West Africa, and HBV/F in South America.
Recently, virological and clinical differences in genotypes have been reported[4,5]. In addition, subtypes of HBV/B, HBV/Ba, ‘a’ indicating Asia, and HBV/Bj, ‘j’ indicating Japan, have been reported[6]. The former has
Kei Fujiwara, Yasuhito Tanaka, Etsuro Orito, Tomoyoshi Ohno, Takanobu Kato, Kanji Sugihara, Izumi Hasegawa, Mayumi Sakurai, Kiyoaki Ito, Atsushi Ozasa, Yuko Sakamoto, Isao Arita, Ahmed El-Gohary, Agossou Benoit, Sophie I Ogoundele-Akplogan, Namiko Yoshihara, Ryuzo Ueda, Masashi Mizokami
Distribution of HBV genotypes among HBV carriers in Benin:phylogenetic analysis and virological characteristics of HBV genotype E

recombination with HBV/C, but the latter does not, and clinical differences have been shown between them[7]. Furthermore, HBV/A is phylogenetically classified into subtypes, namely HBV/Aa, ‘a’ indicating Asia/Africa, which is distributed in Asia and Africa, and HBV/Ae, ‘e’ indicating Europe, which is distributed in Europe[8].
It is now recognized that mutations in basic core promoter (BCP) and precore region regulate hepatitis B e antigen (HBeAg) expression. It was shown in an in vitro study that the double mutations in BCP, A1762T and G1764A, downregulate precore mRNA and slightly increase the efficiency of pregenome mRNA and core mRNA[9]. Additionally, the mechanism of HBeAg reduction through subtype-specific nucleotide substitutions just prior to the start of the precore open reading frame (ORF), known as “Kozak sequence” in the African subtype of HBV/A, has been shown in an in vitro study[10].
In Africa, the distribution of HBV genotypes is HBV/A in the South, HBV/D in the North, and HBV/E in the West. For HBV/E, only four human HBV/E full genomes have been reported so far, and the virological and clinical characteristics have not yet been sufficiently clarified.
In this study, the distribution of HBV genotypes in the Republic of Benin was investigated for the first time, and the virological and clinical characteristics of the dominant genotype were analyzed.
MATERIALS AND METHODS
PatientsFive hundred blood donors, who visited the National Blood Transfusion Center in the Republic of Benin in 2002, were screened for hepatitis B surface antigen (HBsAg). Twenty-four were positive for HBsAg (4.8%). Sera from 21 donors were available in this study (17 males, 3 females, unknown in 1; mean age, 23.1±6.7 years). All the donors were negative for the antibody to HIV-1 (anti-HIV) and the antibody to human adult leukemia virus 1 (anti-HTLV-1). The antibody to hepatitis C virus (anti-HCV) was positive in one donor. Informed consent was obtained from each patient.
Serological testingHBsAg, ant i -HCV, and ant i -HTLV-1 were tested by counting immunoassay (PAMIA, Sysmex, Kobe, Japan). HBeAg and the antibody to HBeAg (anti-HBe) were determined using a commercially available chemiluminescent enzyme immunoassay (EIA, Lumipulse f, Fujirebio Inc., Tokyo, Japan). Aspartate aminotransferase (AST), alanine aminotransferase (ALT), and total bilirubin (T-Bil) were measured in all the samples.
GenotypingThe HBV genotypes were determined in the sera using an EIA with pre-S2 specific mAb[12,13]. When the result of the EIA method was indeterminate, HBV genotypes were detected by restriction fragment length polymorphism, as previously described[14].
PCR amplification and sequencing of HBVThe serum samples were stored at -80 °C until use. Total DNA was extracted from 100 µL of serum using microspin columns (QIAamp Blood kit, Qiagen KK, Tokyo, Japan). Purified DNA was resuspended in 80 µLof distilled water. PCR was carried out by the same protocol as described previously[15]. Nucleotide sequences of the amplified products were determined directly by the dideoxy method, using the ABI Prism BigDye Terminator Cycle Sequencing Ready Reaction kit with a fluorescent 3100 DNA Sequencer (Applied Biosystems, Foster City, CA, USA). Real-time detection polymerase chain reaction (RTD-PCR) serum HBV DNA was quanti tat ively detected by RTD-PCR based on Taqman chemistry as reported previously[16]. Amplification was performed using primers corresponding to conserved sequences of the surface region. A 10-µL aliquot of DNA solution was used for RTD-PCR. A portion of the HBV surface region was amplified using primers: a forward primer HBSF2 (5’-CTTCATCCTGCTGCTATGCCT-3’, nucleotide position (nt) 406-426) and a reverse primer HBSR2 (5’-AAAGCCCAGGATGGGAT-3’, nt 646-627). A taqman probe was designed as HBSP2 (5’-ATGTTGCCCTTTGTCCTCCTCTAATTCCAG-3’, nt 461-488), with an additional G at the 3’-end of HBSP2 in the original method, the detection limit of this system was as low as five DNA copies/assay, and linear standard curve was obtained from 5 to 106 DNA copies/assay.
Phylogenetic analysisComplete sequences of 21 HBV isolates were aligned with the CLUSTAL W software program[17], and the alignment was confirmed by visual inspection. Genetic distances were estimated by the six-parameter method, and phylogenetic trees were constructed by the neighbor-joining method using ODEN program of the National Institutes of Genetics (Mishima, Japan)[18]. To confirm the reliability of the phylogenetic trees, bootstrap resampling tests were performed 1 000 times.
RESULTSHBV genotypesDistribution of HBV genotypes among 21 HBV carriers in the Republic of Benin was 20/21 (95.2%) for HBV/E, and 1/21 (4.8%) for HBV/A. HBV/B, C, D, F, and G were not found. HBV/E was the predominant genotype in the Republic of Benin.
Clinical characteristics of asymptomatic HBV carriers in the Republic of BeninHBeAg was positive for 4/21 (19.0%) subjects, and anti-HBe was positive for 17/21 (81.0%) subjects. The titers of four HBeAg-positive subjects were beyond the upper detection limit. In order to clarify the clinical characteristics of asymptomatic HBV carriers in this country, the clinical and laboratory data between HBeAg-positive patients
Fujiwara K et al . HBV genotype E prevalent in Benin 6411

and anti-HBe-positive patients were compared (Table 1).The mean age of the HBeAg-positive group was not lower than that of the anti-HBe-positive group. As a matter of course, the difference in the mean HBV DNA titer between the two groups was statistically significant (P<0.0005). HBV DNA titers in anti-HBe-positive subjects were quite low. To examine the correlation between age and HBeAg/anti-HBe status in detail, the age-specific prevalence of the HBeAg/anti-HBe status in 19 HBV/E subjects was analyzed. Seroconversion (SC) during the late teens occurred in 7 of 19 subjects (36.8%, Figure 1). This was the reason why the comparison of age between the two groups was not statistically significant.
Phylogenetic analysis of four strainsHBV full genomes of four HBeAg-positive patients were determined to have a nucleotide length of 3 212 bp. Phylogenetic analysis of the complete genome sequences of these four strains compared to those of 22 HBV strains from the DDBJ/GenBank/EMBL database showed that four strains clustered with five other HBV/E strains (accession numbers: X75657, X75664[2]; and AB032431[19]; AB091255, AB091256[11]) (Figure 2). The nucleotide homology within the HBV/E cluster ranged from 96.7% to 99.2%. In addition, the phylogenetic analysis of four ORFs showed no recombination of HBV/E strains in the Republic of Benin (Figure 3). Genetic diversity among HBV/E strains was very low compared to the
other genotypes, excluding HBV/G. The nucleotide sequence data reported in this article will appear in the DDBJ/GenBank/EMBL nucleotide sequence databases with the accession numbers AB201287-90.
Characteristics of nucleotide substitutions in BCP and precore regionIn order to find out the HBV/E-specific nucleotide substitution associated with HBe protein production, the BCP to the precore region of nine HBV/E strains and the strains of six genotypes were compared (Figure 4). The representative nucleotide sequences of HBV/A (Aa- Ae), B, C, D, F, and G were determined by aligning five sequences of each genotype, and the consensus nucleotide was deduced, if the identical nucleotide was detected in 60% or more of the sequences. In the BCP, the nucleotide substitution at A1757 was observed in all the strains of HBV/E. This substitution was not found in HBV/A-C, HBV/F, and HBV/G, but was found in more than half of HBV/D[20]. BCP double mutation (T1762/A1764) was not found in the HBV/E strains; however, T1772C substitution was found in all the HBV/E strains as well
Table 1 Comparison of clinical characteristics between HBeAg-positive and anti-HBe-positive subjects
HBeAg-positive (n = 4) Anti-HBe-positive (n = 17) P
Age (yr) 21.25 ± 2.21 23.5 ± 7.421 NS2
Sex (M/F) 2/2 1/151 NS3
Genotype (A/E) 0/4 1/16 NS3
AST (IU/L) 25.8 ± 8.3 18.0 ± 5.4 NS2
ALT (IU/L) 11.5 ± 10.3 5.7 ± 1.5 NS2
T-Bil (mg/dL) 0.50 ± 0.35 0.57 ± 0.41 NS2
HBV DNA 7.76 ± 0.29 < 2.6 < 0.00052
(log (copies/mL)
1Sex and age unknown in one subject. 2P values were calculated by Welch’s t-test. 3P values were calculated by Fisher’s exact test. AST, aspartate aminotransferase; ALT, alanine aminotransferase; T-Bil, total bilirubin.
16-20 21-25 26-30Age (yr)
HBeAg positive
Anti-HBe positive
Number
Figure 1 Age-specific prevalence of HBeAg/anti-HBe status in 19 HBV genotype E strains.
WMHBVV00866
AB0335554
D00331
M54923
D50517
D50520
X14193AB048702X72702
X65259
BENIN 11/ Benin
BENIN 269/ BeninBENIN 293/ Benin
AB032431/ Chimpfrom Sierra Leone
AB091255/ Cote D'Ivoire
BENIN 89/ Benin
AB091255/ Cote D'IvoireX75657/ Senegal
X75664/ FranceAF160501
AB036905
AB036920
AB036915
A
C
B
D
F
E
G
93
90
10099
100
0.050.1 0.0
Figure 2 Phylogenetic tree constructed on complete nucleotide sequences of 26 HBV isolates. The nine HBV genotype E isolates were compared along with 16 HBV isolates representative of the other six genotypes (A–D, F and G), along with woolly monkey hepatitis virus (WMHBV) as an outgroup. The four HBV genotype E isolates determined in this study are indicated in boldface, and the other 22 HBV isolates are specified by accession numbers. The country of origin is indicated after the slash for each HBV isolate of genotype E.
Z72478
X70185
6412 ISSN 1007-9327 CN 14-1219/ R World J Gastroenterol November 7, 2005 Volume 11 Number 41
5

as in HBV/B, C and F. Other sequences in the BCP were conserved irrespective of genotypes, except for the above mutations. One HBV/E isolate had T1809 substitution prior to the start of precore ORF, which is recognized as the Kozak sequence frequently found in HBV/Aa. Precore stop mutation (A1896) was not found in the HBV/E.
DISCUSSIONIn this study, the distribution of HBV genotypes among blood donors in the Republic of Benin was analyzed for the first time. In Africa, HBV/D is dominant in the Northern region[21], with HBV/A found in South Africa. HBV/E is the major genotype in the Republic of Benin. This agrees with previous reports that HBV/E is prevalent mainly in West Africa[2,11,22]. In addition, the distribution of HBV/E is restricted to West Africa, unlike other genotypes. Though slaves have migrated from West Africa to North America, HBV/E is not found in USA, suggesting that genotype E emerged from the mid to late
19th century[22,23].East Asia and Sub-Saharan Africa are the two most
HBV endemic areas; however, clinical differences have been shown between the two areas. Vertical transmission is the main route in Asia, whereas horizontal transmission is the main route in Africa, and SC occurs much earlier in Africa than in Asia[24,25]. It is important to examine the clinical characteristics of asymptomatic HBV carriers in Benin, which reflect the characteristics of HBV/E, because there are only a few reports concerning the clinical characteristics of HBV/E. As shown in Figure 1, SC is thought to occur at a young age in subjects with HBV/E in Benin. These data might explain one of the reasons why vertical transmission does not occur in West Africa. Recently, the difference in SC between HBV/B and HBV/C in Taiwan was reported[5]. SC occurs a decade earlier in HBV/B patients[26,27] and the mean SC age in HBV/B is approximately 30 years. In comparison with HBV/B, the mean SC age in HBV/E occurs even earlier. These data lead us to speculate that HBV/E has a better prognosis than other genotypes in terms of chronic liver disease.
V00866
D50520
X65259
AB32431/ Chimp from Sierra Leone
BENNIN 11/ Benin
AB091255/ Cote D'Ivoire
AB091256/ Cote D'Ivoire
X75657/ Senegal
X75664/ France
BENIN293/ Benin
BENIN89/ Benin
AF160501
AB036905
WMHBV
A
B
C
E
D
F
G
99
100
91 80
0.1 0.00.05
BENIN269/ Benin
100
A
D23678
B
D50520
X65259
AB032431/ Chimp from Sierra Leone
X75664/France
AB091255/ Cote D'Ivoire
BENIN11/Benin
BENIN269/BeninX75657/Senegal
BENIN293/ Benin
WMHBV
V00866A
B
C
E
D
F
G
92
100
80
0.1 0.00.05
AB036905
AF160501
D23678
100
AB091256/ Cote D'Ivoire
BENIN89/ Benin
Figure 3 Phylogenetic trees representing the large S gene (A), and precore region plus core gene (B) along with the strains of the other six genotypes and WMHBV.
Fujiwara K et al . HBV genotype E prevalent in Benin 6413

Genotype Ae
Genotype Aa
Genotype C
Genotype E
Genotype GGenotype FGenotype D
Genotype B
AB032431
AB091255AB091256X75664
BENIN293BENIN269
BENIN89BENIN11
X75667
TAGGTTAAAGGCTTTGTATTAGGAGGCTG CAGCACCATGC TTTGGGGCAT
AAAAAAAAA
A
T
T
T
A
A
CCCCCCCCC
T
C
CTCT
A
A
T
T
A
1759 1762 1764 1809 1812 1896
Figure 4 Nucleotide sequences constituting parts of the BCP to the precore of nine HBV genotype E isolates with the consensus sequences of the other six genotypes. The four Benin isolates determined in this study are shaded in gray.
Regarding hepatocellular carcinoma (HCC), a report from Gambia, where HBV/E is the most prevalent, revealed that chronic HBV infection is associated with HCC development at a younger age[28]. Infection with HBV/B is associated with HCC development at a young age in Taiwan[5]. In this sense, HBV/E in West Africa is clinically more similar to HBV/B than HBV/C, and virologically, HBV/E and HBV/B have a high frequency of a precore mutation, G1896A, in common[11,29]. Further information about the clinical characteristics of HBV genotypes might reveal the reason why the age of SC and the age-related HCC incidence differ among genotypes.
So far, only five complete genomes of HBV/E (one from a chimpanzee) have been reported. By adding the four complete genomes reported here, phylogenetic analyses of the full genome and ORFs show much more clearly that HBV/E has a low genetic diversity, as previously reported[11,22,23]. Although subtypes of HBV/B, which have recombination in the BCP to the core region[7] and subtypes of HBV/A[8,30] have been reported, the analysis of nine HBV/E genomes shows neither the possibility of subtypes nor the possibility of recombination.
As mentioned above, HBV/A is divided into two subtypes: HBV/Aa, ‘Aa’ indicates Asia and Africa, and HBV/Ae, ‘Ae’ indicates Europe[8,30]. Subtype HBV/Aa has subtype-specific substitutions just before precore start codons, known as the “Kozak sequence”. Substitutions reduce the HBeAg expression[10,31]. Hence, genotype- and subtype-specific nucleotide substitutions in the BCP region are crucial, not only in viral replication but also in HBe SC. In this study, we identified the mutation in the BCP, A1757, in HBV/E. Other genotypes have G1757
except for HBV/D, in which A1757 is observed in about 70%[20]. BCP has been identified as a sequence that regulates both precore and pregenomic messages[32]. The core promoter A1762T and G1764A double mutation is known to downregulate precore mRNA but does not seriously affect pregenome mRNA[33]. The double mutation (1762/1764) occurs over time, as the viral load and HBeAg/anti-HBe status change, and the sequences
around the double mutations are conserved irrespective of the genotype so far. However, HBV/E seems to possess 1757A from the early stage of the infection, similar to Kozak sequence substitutions in genotype Aa. Thus, the different functions in relation to nuclear receptor binding between 1757G and 1757A was shown in an in vitro study, when the mechanism of suppression of HBV precore RNA transcription by core promoter double mutation was sought. The double mutation in 1762 and 1764 changes the nucleotide sequences of the nuclear-factor binding site of BCP. When the mutation occurs, the nuclear factor known as COUP TF I cannot bind to BCP. Instead, a different nuclear factor, HNF1, binds, and this alters the efficiency of precore and core mRNA transcription. The artificial mutation was created with the intention to create a sequence that neither COUP TF I nor HNF-1 can bind. This mutation is G1757A, and the mutation abolishes both the nuclear factors (COUP TFI and HNF1) binding to BCP in the in vitro experiment[34]. This unique mutation and its alteration of nuclear factor binding capacity to the BCP region might influence the clinical characteristics of HBV/E. Further studies, including in vitro studies, are expected.
REFERENCES1 Okamoto H, Tsuda F, Sakugawa H, Sastrosoewignjo RI, Imai
M, Miyakawa Y, Mayumi M. Typing hepatitis B virus by homology in nucleotide sequence: comparison of surface antigen subtypes. J Gen Virol 1988; 69 (pt 10): 2575-2583
2 Norder H, Couroucé AM, Magnius LO. Complete genomes, phylogenetic relatedness, and structural proteins of six strains of the hepatitis B virus, four of which represent two new genotypes. Virology 1994; 198: 489-503
3 Norder H, Couroucé AM, Magnius LO. Complete nucleotide sequences of six hepatitis B viral genomes encoding the surface antigen subtypes ayw4, adw4q-, and adrq- and their phylogenetic classification. Arch Virol Suppl 1993; 8: 189-199.
4 Orito E, Ichida T, Sakugawa H, Sata M, Horiike N, Hino K,Okita K, Okanoue T, Iino S, Tanaka E, Suzuki K, Watanabe H, Hige S, Mizokami M. Geographic distribution of hepatitis B virus(HBV) genotype in patients with chronic HBV infection in Japan. Hepatology 2001; 34: 590-594
6414 ISSN 1007-9327 CN 14-1219/ R World J Gastroenterol November 7, 2005 Volume 11 Number 41

5 Kao JH, Chen PJ, Lai MY, Chen DS. Hepatitis B genotypes correlate with clinical outcomes in patients with chronic hepatitis B. Gastroenterology 2000; 118: 554-559
6 Sugauchi F, Orito E, Ichida T, Kato H, Sakugawa H, Kakumu S, Ishida T, Chutaputti A, Lai CL, Ueda R, Miyakawa Y, Mizokami M. Hepatitis B virus of genotype B with or without recombination with genotype C over the precore region plus the core gene. J Virol 2002; 76: 5985-5992
7 Sugauchi F, Orito E, Ichida T, Kato H, Sakugawa H, Kakumu S, Ishida T, Chutaputti A, Lai CL, Gish RG, Ueda R, Miyakawa Y, Mizokami M. Epidemiologic and virologic characteristics of hepatitis B virus genotype B having the recombination with genotype C. Gastroenterology 2003; 124: 925-932
8 Sugauchi F, Kumada H, Acharya SA, Shrestha SM, Gamutan MT, Khan M, Gish RG, Tanaka Y, Kato T, Orito E, Ueda R, Miyakawa Y, Mizokami M. Epidemiological and sequence differences between two subtypes (Ae and Aa) of hepatitis B virus genotype A. J Gen Virol 2004; 85: 811-820.
9 Buckwold VE, Xu Z, Chen M, Yen TS, Ou JH. Effects of a naturally occurring mutation in the hepatitis B virus basal core promoter on precore gene expression and viral replication. J Virol 1996; 70: 5845-585
10 Ahn SH, Kramvis A, Kawai S, Spangenberg H, Li J, Kimbi G, Kew MC, Wands J, Tong S. Sequence variation upstream of precore translation initiation codon reduces hepatitis B virus e antigen production. Gastroenterology 2003; 125: 1370-1378
11 Suzuki S, Sugauchi F, Orito E, Kato H, Usuda S, Siransy L, Arita I, Sakamoto Y, Yoshihara N, El-Gohary A, Ueda R, Mizokami M. Distribution of hepatitis B virus (HBV) genotypes among HBV carriers in the Cote d'Ivoire: complete genome sequence and phylogenetic relatedness of HBV genotype E. J Med Virol 2003; 69: 459-465
12 Usuda S, Okamoto H, Iwanari H, Baba K, Tsuda F, Miyakawa Y, Mayumi M. Serological detection of hepatitis B virus genotypes by ELISA with monoclonal antibodies to type-specific epitopes in the preS2-region product. J Virol Methods 1999; 80: 97-112
13 Usuda S, Okamoto H, Tanaka T, Kidd-Ljunggren K, Holland PV, Miyakawa Y, Mayumi M. Differentiation of hepatitis B virus genotypes D and E by ELISA using monoclonal antibodies to epitopes on the preS2-region product. J Virol Methods 2000; 87: 81-89
14 Mizokami M, Nakano T, Orito E, Tanaka Y, Sakugawa H, Mukaide M, Robertson BH. Hepatitis B virus genotype assignment using restriction fragment length polymorphism patterns. FEBS Lett 1999; 450: 66-71
15 Sugauchi F, Mizokami M, Orito E, Ohno T, Kato H, Suzuki S, Kimura Y, Ueda R, Butterworth LA, Cooksley WG. A novel variant genotype C of hepatitis B virus identified in isolates from Australian Aborigines: complete genome sequence and phylogenetic relatedness. J Gen Virol 2001; 82: 883-892
16 Abe A, Inoue K, Tanaka T, Kato J, Kajiyama N, Kawaguchi R, Tanaka S, Yoshiba M, Kohara M. Quantitation of hepatitis B virus genomic DNA by real-time detection PCR. J Clin Microbiol 1999; 37: 2899-2903
17 Thompson JD, Higgins DG, Gibson TJ. CLUSTAL W: improving the sensitivity of progressive multiple sequence alignment through sequence weighting, position-specific gap
penalties and weight matrix choice. Nucleic Acids Res 1994; 22: 4673-4680
18 Ina Y. ODEN: a program package for molecular evolutionary analysis and database search of DNA and amino acid sequences. Comput Appl Biosci 1994; 10: 11-12
19 Takahashi K, Brotman B, Usuda S, Mishiro S, Prince AM. Full-
genome sequence analyses of hepatitis B virus (HBV) strains recovered from chimpanzees infected in the wild: implications for an origin of HBV. Virology 2000; 267: 58-64
20 Kidd-Ljunggren K, Oberg M, Kidd AH. Hepatitis B virus X gene 1751 to 1764 mutations: implications for HBeAg status and disease. J Gen Virol 1997; 78 ( Pt 6): 1469-78
21 Saudy N, Sugauchi F, Tanaka Y, Suzuki S, Aal AA, Zaid MA, Agha S, Mizokami M. Genotypes and phylogenetic characterization of hepatitis B and delta viruses in Egypt. J Med Virol 2003; 70: 529-536
22 Odemuyiwa SO, Mulders MN, Oyedele OI, Ola SO, Odaibo GN, Olaleye DO, Muller CP. Phylogenetic analysis of new hepatitis B virus isolates from Nigeria supports endemicity of genotype E in West Africa. J Med Virol 2001; 65: 463-469
23 Mulders MN, Venard V, Njayou M, Edorh AP, Bola Oyefolu AO, Kehinde MO, Muyembe Tamfum JJ, Nebie YK, Maiga I, Ammerlaan W, Fack F, Omilabu SA, Le Faou A, Muller CP. Low genetic diversity despite hyperendemicity of hepatitis B virus genotype E throughout West Africa. J Infect Dis 2004; 190: 400-408
24 Stevens CE, Beasley RP, Tsui J, Lee WC. Vertical transmission of hepatitis B antigen in Taiwan. N Engl J Med 1975; 292: 771-774
25 Botha JF, Ritchie MJ, Dusheiko GM, Mouton HW, Kew MC. Hepatitis B virus carrier state in black children in Ovamboland: role of perinatal and horizontal infection. Lancet 1984; 1: 1210-1212
26 Chu CJ, Hussain M, Lok AS. Hepatitis B virus genotype B is associated with earlier HBeAg seroconversion compared with hepatitis B virus genotype C. Gastroenterology 2002; 122: 1756-1762
27 Kao JH, Chen PJ, Lai MY, Chen DS. Hepatitis B virus g e n o t y p e s a n d s p o n t a n e o u s h e p a t i t i s B e a n t i g e n seroconversion in Taiwanese hepatitis B carriers. J Med Virol 2004; 72: 363-369.
28 Kirk GD, Lesi OA, Mendy M, Akano AO, Sam O, Goedert JJ, Hainaut P, Hall AJ, Whittle H, Montesano R. The Gambia Liver Cancer Study: Infection with hepatitis B and C and the risk of hepatocellular carcinoma in West Africa. Hepatology 2004; 39: 211-219
29 Orito E, Mizokami M, Sakugawa H, Michitaka K, Ishikawa K, Ichida T, Okanoue T, Yotsuyanagi H, Iino S. A case-control study for clinical and molecular biological differences between hepatitis B viruses of genotypes B and C. Japan HBV Genotype Research Group. Hepatology 2001; 33: 218-223
30 Hasegawa I, Tanaka Y, Kramvis A, Kato T, Sugauchi F, Acharya SK, Orito E, Ueda R, Kew MC, Mizokami M. Novel hepatitis B virus genotype a subtyping assay that distinguishes subtype Aa from Ae and its application in epidemiological studies. J Virol 2004; 78: 7575-7581
31 Tanaka Y, Hasegawa I, Kato T, Orito E, Hirashima N, Acharya SK, Gish RG, Kramvis A, Kew MC, Yoshihara N, Shrestha SM, Khan M, Miyakawa Y, Mizokami M. A case-control study for differences among hepatitis B virus infections of genotypes A (subtypes Aa and Ae) and D. Hepatology 2004; 40: 747-755
32 Yuh CH, Chang YL, Ting LP. Transcriptional regulation of precore and pregenomic RNAs of hepatitis B virus. J Virol 1992; 66: 4073-4084
33 Okamoto H, Tsuda F, Akahane Y, Sugai Y, Yoshiba M, Moriyama K, Tanaka T, Miyakawa Y, Mayumi M. Hepatitis B virus with mutations in the core promoter for an e antigen-negative phenotype in carriers with antibody to e antigen. J Virol 1994; 68: 8102-8110
34 Li J , Buckwold VE, Hon MW, Ou JH. Mechanism of suppression of hepatitis B virus precore RNA transcription by a frequent double mutation. J Virol 1999; 73: 1239-1244
Science Editor Wang XL and Guo SY Language Editor Elsevier HK
Fujiwara K et al . HBV genotype E prevalent in Benin 6415

PO Box 2345, Beijing 100023, China World J Gastroenterol 2005;11(41):6416-6421www.wjgnet.com World Journal of Gastroenterology ISSN [email protected] © 2005 The WJG Press and Elsevier Inc. All rights reserved.
E L S E V I E R
• VIRAL HEPATITIS•
Gerald C Kimbi, Anna Kramvis, Michael C Kew, MRC/University Molecular Hepatology Research Unit, Department of Medicine, University of the Witwatersrand, Parktown 2193, Johannesburg, South AfricaSupported by grants from the Poliomyelitis Research Foundation of South African and the HE Griffin Cancer TrustCorrespondence to: Professor, MC Kew, Department of Medicine, University of the Witwatersrand Medical School, 7 York Road, Parktown 2193, Johannesburg, South Africa. [email protected]: +27-11-488-3628 Fax: +27-11-643-4318Received: 2004-08-26 Accepted: 2004-10-06
AbstractAIM: To examine the serum from black African patients with acute hepatitis B to ascertain if integrants of viral DNA can be detected in fragments of cellular DNA leaking from damaged hepatocytes into the circulation.
METHODS: DNA was extracted from the sera of five patients with uncomplicated acute hepatitis B and one with fulminant disease. Two subgenomic PCRs designed to amplify the complete genome of HBV were used and the resulting amplicons were cloned and sequenced.
RESULTS: HBV and chromosomal DNA were amplified from the sera of all the patients. In one patient with uncomplicated disease, HBV DNA was integrated into host chromosome 7 q11.23 in the WBSCR1 gene. The viral DNA comprised 200 nucleotides covering the S and X genes in opposite orientation, with a 1 169 nucleotide deletion. The right virus/host junction was situated at nucleotide 1 774 in the cohesive overlap region of the viral genome, at a preferred topoisomerase I cleavage motif. The chromosomal DNA was not rearranged. The patient made a full recovery and seroconverted to anti-HBs- and anti-HBe-positivity. Neither HBV nor chromosomal DNA could be amplified from his serum at that time.
CONCLUSION: Integration of viral DNA into chromosomal DNA may occur rarely during acute hepatitis B and, with clonal propagation of the integrant, might play a role in hepatocarcinogenesis.
© 2005 The WJG Press and Elsevier Inc. All rights reserved.
Key words: Hepatocellular; Chronic hepatitis B infection; Clonal propagation
Integration of hepatitis B virus DNA into chromosomal DNA during acute hepatitis B
Gerald C Kimbi, Anna Kramvis, Michael C Kew
Kimbi GC, Kramvis A, Kew MC. Integration of hepatitis B virus DNA into chromosomal DNA during acute hepatitis B. World J Gastroenterol 2005; 11(41):6416-6421http://www.wjgnet.com/1007-9327/11/6416.asp
INTRODUCTIONHepati t is B Virus (HBV), the prototype member of the family Hepadnaviridae, belongs to the genus Orthohepadnavirus. Compelling evidence supports a causal role for chronic HBV infection in hepatocellular carcinoma (HCC)[1,2]. Less certain is the pathogenesis of HBV-induced HCC. Direct and indirect carcinogenic mechanisms have been implicated, the latter mainly by the frequency with which this tumor co-exists with cirrhosis[3,4]. Evidence for a direct effect is provided by the development of HCC in an otherwise normal liver (in as many as 40% or more of black African patients[5]) and by observations in a variety of animal models. The latter include the development of HCC in the absence of cirrhosis, both in animals that were chronically infected with other members of the family Hepadnaviridae[6-8] and in transgenic mice with HBV DNA incorporated into the germline[9]. Further support comes from the finding of integrated hepadnaviral DNA in cellular DNA in HCCs in animal and human hosts[10-14]. The latter does not, however, prove that insertion of viral DNA is essential for hepatocarcinogenesis. If clonal expansion of integrated HBV DNA proves to be a pivotal step in hepatocarcinogenesis, the timing of integration becomes important. Because HCC typically develops in patients chronically infected with HBV, it has been assumed that DNA insertion occurs at some point during persistent infection. Integration during the short period of viral replication in acute hepatitis B had not been conclusively demonstrated[15-17]. However, in a recent study, integration of HBV DNA was demonstrated in 3 of 19 liver specimens from patients with acute hepatitis B, one of whom had subacute fulminant hepatitis[18]. Moreover, a study in acutely infected ducks showed that insertion of duck HBV (DHBV) DNA into host DNA may occur as early as d 6 after the infection[12]. HCC does not, however, develop in ducks chronically infected with DHBV. The time at which integration occurred was studied in the liver tissue and a similar study could not, for obvious ethical reasons, be performed in human beings with acute hepatitis B. In a previous study, primers used to amplify the complete genome of HBV were found to amplify

Kimbiet GC et al. HBV DNA integrant in acute hepatitis B 6417
chromosomal DNA also. Taking advantage of this phenomenon and the leakage into the bloodstream of fragments of cellular DNA from damaged hepatocytes during acute liver injury[19,20], we examined the serum of patients with acute hepatitis B for integrated HBV DNA.
MATERIALS AND METHODSPatients studiedBlood samples were drawn, with informed consent, from six South African blacks suffering from acute hepatitis B during the peak of the disease or shortly thereafter. Permission to undertake this study was given by the Human Ethics Committee of the University of Witwatersrand. In five patients, the il lness was uncomplicated, and all recovered completely; the remaining patient had fulminant hepatitis B and died of liver failure. Alanine aminotransferase levels in the early stages of the illness ranged between 799 and 4 747 IU/L. The patients varied in age from 18 to 32 years: 3 were males and 3 females. Serum known to be HBsAg-positive and HBsAg-negative was used as positive- and negative-extraction controls, respectively. The sera were stored at -70 °C until analyzed.
DNA extraction, amplification, cloning, and sequencingTotal DNA was extracted from the sera using the QIAamp DNA Mini Kit (QIAGEN GmbH, Hilden, Germany), according to the manufacturer’s instructions. Two subgenomic PCRs designed to amplify the complete genome of HBV were used and the resulting amplicons were cloned and sequenced. A modification of the method of Takahashi K et al[21] was used, which involved the amplification of two overlapping fragments of HBV, fragment A (1.35 kb) and fragment B (2.2 kb). However, this amplification designed for amplification of viral DNA also fortuitously, randomly recognized chromosomal DNA, leading to the amplification of genomic DNA in addition to HBV DNA. The sequence of the primers is given in Table 1. The reaction mix for the amplification consisted of 2.25 μL 10× Ex Taq buffer with 20 mmol/L MgCl2 set as subscript, 2 μL 2.5 mmol/L dNTP mix, 1.25 μL each of the appropriate primers (Table 1), 2.5 μL DNA, made up to 22.5 μL with water (SABAX water for injection, Adcock Ingram, Johannesburg, South Africa).
The enzyme mix was made up of 1.875 μL water, 0.25 μL 10× Ex Taq and 0.375 μL TaKaRa Ex Taq polymerase [TaKaRa Biotechnology (Dalian) Co., Ltd., Shiga, Japan]. The 22.5μL reaction mix was preheated to 94 °C for 2 min and 2.25 μL TaKaRa Ex Taq enzyme mix was added at the first annealing step. This was followed by 40 cycles of amplification with the cycling profile shown in Table 1. Both HBV-positive and HBV-negative controls were included. The latter consisted of water instead of DNA in the PCR mixture. To avoid cross-contamination and false-positive results, the precautions and procedures suggested by Kwok and Higuchi[22] were strictly adhered to. DNA extraction, PCR amplification, and electrophoresis were performed in physically separated venues. Amplicons were cloned into a pPCR-ScriptTM Amp SK+ vector (Stratagene, La Jolla, CA, USA) according to the protocol provided by the manufacturer. The positive clones containing either inserts of the correct or shorter size were prepared for direct sequencing using the BigDye Terminator v3.0 Cycle Sequencing Ready Reaction Kit (Applied Biosystems, Foster City, USA) and sequenced on a 377 DNA automated sequencer (Applied Biosystems, Inc.) using primers T3 (5’-AATTAACCCTCACTAAAGGG-3’) and T7 (5’-GTAATACGACTCACTATAGGGC-3’). All sequences were analyzed in both forward and reverse directions.
RESULTSIn addition to yielding amplicons of the expected size, i.e., 1.35 kb for fragment A and 2.2 kb for fragment B, the two subgenomic PCRs designed to amplify the complete genome of HBV gave rise to smaller amplicons ranging in size from 100 to 750 bp. These amplicons were successfully cloned into a pPCR-ScriptTM Amp SK+ vector (Figure 1) and a number of clones from each of the six patients were sequenced (Table 2). The majority of the clones contained HBV DNA only and the detailed analysis of these sequences will be published elsewhere. Fortuitously, the primers designed for the amplification of viral DNA amplified Chromosomal DNA was amplified in 5 patients using primers designed to amplify fragment A (Table 1) and in the remaining patient with primers designed to amplify fragment B. As shownin Table 2, the chromosome number and the lengths
Table 1 Oligonucleotide primers and PCR cycling profiles used in the study
Fragment Primer Position1 Sequence Denaturation Annealing Extension Size2
A 455(+) 455-474 5’-CAAGGTATGTTGCCCGTTTG-3 1 345 1 800(–) 1 800-1 773 5’-AGACCAATTTATGCCTACAGCCTCCTA-3’ 94 °C 30 s 62 °C 30 s 72 °C 90 s B 1 687(+) 1 687-1 708 5’-CGACCGACCTTGAGGCATAC-3’ 685(-) 704-685 5’-CGAACCACTGAACAAATGGC-3’ 94 °C 30 s 63 °C 30 s 72 °C 30 S 2 198
(+) sense (–) anti-sense. 1Denotes the nucleotide position of HBV adw genome (GenBank accession no. V00866) where the EcoRI cleavage site is position 12. Size of the amplicons in base pairs.

6418 ISSN 1007-9327 CN 14-1219/R World J Gastroenterol November 7, 2005 Volume 11 Number 41
Table 2 Summary of cloning and sequencing results
Patient details PCR Number of clones Chromosome number fragment1 and length
No. Sex Age Sequenced With vector With HBV WithHBV/ chromosomal With chromosomal
(yr2) DNA DNA only DNA DNA only
355 F 18 B 5 1 3 0 1 7 (117 bp)8225 M 23 A 3 0 2 0 1 1 (278 bp) B 4 0 4 0 0 –28 M 26 A 4 0 2 0 2 4 (512 bp) 16 (140 bp) B 4 0 4 0 0 –4038 F 27 A 6 0 5 0 1 1 (97 bp) B 4 0 4 0 0 –52833 F 32 A 12 2 6 0 4 4 (456 bp) 10 (235 bp) 10 (330 bp) 2 (422 bp) B 4 0 4 0 0 –0962 M 27 A 8 0 4 1 3 1 (300 bp) 14 (410 bp) 17 (410 bp) B 5 0 5 0 0 –
1Fragment A amplified with primers 455 (+) and 1 800 (–); fragment B amplified with primers 1 687 (+) and 685 (–).2 yr, years; bp, base pairs; 3Patient with fulminant hepatitis.
Figure 1 Ethidium bromide stained with 1% agarose gel showing pPCR-Script Amp SK(+) plasmid containing amplicons restricted with PvuII. In panel A, the fragments cloned were amplified with primers 455(+) and 1 800(–). Lanes 1-4, 8, and 10 show the expected size insert of -1.8 kb for fragment A amplicon (1.3 kb) whereas lanes 5-7, 9, and 11-16 show shorter inserts ranging in size 0.6-1.1 kb. In panel B, the fragments cloned were amplified with primers 1 687(+) and 685(–). Lanes 3-6 and 9 show the expected size insert of -2.65 kb for fragment B amplicon (2.2 kb), lane 7 is vector alone and lanes 1, 2, 8-11 show shorter inserts ranging in size 0.5-1.2 kb. M: Promega 1 kb molecular weight marker, V: vector, I: insert of expected size (A and B).
1 2 3 4 5 6 7 8 9 10 11 12 13 14 16 M
1.0 kb
3.0 kb2.0 kbV (2.5 kb)
I (1.8 kb)
A
I (2.65 kb)
V (2.5 kb)
1 2 3 4 5 6 M 7 8 9 10 11
1.0 kb
3.0 kb
2.0 kb
B
of the fragments varied, although in three cases the fragment amplified corresponded to the sequences from chromosome 1.
In one patient with uncomplicated hepatitis B, HBV DNA was found to be integrated into host chromosome 7q11.23 in the WBSCR1 gene using primers for fragment A. WBSCR1 corresponds to the eukaryotic initiation factor 4H identified in rabbits[23,24] and is within the region encompassing the elastin gene. This region is commonly deleted in patients with Williams–Beuren syndrome, giving rise to loss of heterozygosity[24,25]. The viral DNA comprised 200 nucleotides covering the S and X genes in opposite orientation, with an 1 169 nucleotide deletion (Figure 2). The right virus/host junction was situated at nucleotide 1 774 in the cohesive overlap region of the viral genome, at a preferred topoisomerase I cleavage motif (TAA). The left virus/host junction of the integrant was not identified and, therefore, the length of the integrant could not be determined. Following phylogenetic analysis of the 175 nucleotides of the S region (nucleotides 4-630), the sequence clustered with subgenotype A1 of genotype A, which is the predominant genotype in southern Africa[26-28] . When the 175 nucleotides of the insert covering the S region were translated, starting at nucleotide 3 of the fragment, the amino acid at position 122 was K, which is characteristic of serotype ad. Amino acid 160, which encodes for the w/r determinant, was not included in this fragment and, therefore, we cannot conclusively determine the serotype, although we can probably assume that the determinant is w because the predominant serotype in southern Africa is adw. The nucleotide sequence of the chromosomal DNA (262 bp) was completely conserved and not rearranged. The 3’ end was amplified by primer 1 800 (-) (Table 1). A BLAST search[29] revealed that in addition to binding to chromosome 7, the primer 1 800 (–)

Kimbiet GC et al. HBV DNA integrant in acute hepatitis B 6419
Figure 2 Schematic representation of the HBV DNA integrant amplified from the serum of acute hepatitis patient (#0962) using primers 455 (+) and 1 800 (–) and cloned into pPCR-Script Amp SK (+) plasmid relative to the HBV genome. The lower part of the figure represents the genetic organization of the four open reading frames of HBV, preC/C: precore/core, P: polymerase gene, S: surface gene and X: X gene. Numbering according to nucleotide position of HBV GenBank accession no. V00866 where the EcoRI cleavage site is position 1.
(Table 1) has identical sequences on human chromosomes 2, 3, 12, 13, 20, 22, and Y. The sequence of the integrated HBV DNA and flanking the chromosomal DNA has been deposited in GenBank (accession no. AY223548). The patient with the integrant was a 27-year-old Xhosa gold-mine laborer, who was previously healthy and presented with the typical clinical features of uncomplicated acute viral hepatitis. When he was first tested, the tests of liver function showed a serum bilirubin concentration of 257 μmol/L (conjugated bilirubin 228 μmol/L), alkaline phosphatase 91 IU/L, γ-glutamyl transferase 94 IU/L, alanine aminotransferase 3 238 IU/L, aspartate aminotransferase 2 781 IU/L, and albumin 4 g/L. HBV surface antigen, e antigen, and IgM core antibody were present in the serum. The patient made an uneventful and complete recovery, with return of biochemical tests to normal and disappearance of surface and e antigens and the appearance of IgG core antibody and antibody to surface and e antigens in his serum. HBV DNA could not be detected in the serum. after he had recovered and cloning and whole genome sequencing were not attempted at that time.
DISCUSSIONUnlike retroviruses, in which insertion of viral DNA into host DNA is integral to the replication cycle, integration does not occur during normal hepadnaviral replication. Integ rat ion of hepadnaviral DNA may, however, take place as a result of an illegitimate recombination mechanism mediated by cellular enzymes[12,30]. Clonally propagated integrations have been detected in the majority of HCCs that develop in the presence of chronic hepadnaviral infection[6-10] and have been incriminated in the hepatocarcinogenesis that often complicates persistent infection. HBV DNA insertions are found at random sites
in human cellular DNA, although some chromosomes are affected more often than others[31]. In the present study, we detected an integrant in chromosome 7 of an acute hepatitis B patient. Although we cannot exclude the possibility that the HBV integrant amplified was the result of a PCR artefact, there are a number of observations that argue against this interpretation and support our conviction that this integrant was authentic. Firstly, the site of integration in chromosome 7q11.23 is within the WBSCR1 gene. This gene corresponds to the eukaryotic initiation factor 4H identified in rabbits[23,24]
and the integrant is within the region commonly deleted in patients with Williams-Beuren syndrome, giving rise to loss of heterozygosity[24,25]. Moreover, the WBSCR1 gene contains a high abundance of Alu repeats[24], repetitive elements that have been shown to be the preferred sites for recombination and for HBV DNA insertion[32]. Analogously the sites of integration in the three patients with acute hepatit is B reported by Murakami and coworkers[18] were the intronic sequence of the tumor necrosis factor-induced protein gene and a repetitive sequence in the two patients with a single integrant; and the intronic sequence of a hypothetical protein gene (LOC 169443) and a repetitive sequence in the patient with two integrants. Secondly, the region of HBV integrated (position 1 7 7 4-1 799 from EcoRI site) is a highly preferred site of integration of hepadnaviral DNA, that is, close to the 11-bp direct repeat sequence DR1 (position 1 824-1 834) and within the cohesive overlap region between DR1 and DR2[33]. Thirdly, the one viral DNA/chromosomal DNA junction in the single integrant detected in our patient with acute hepatitis B was located at nucleotide 1 774 of the viral genome, a highly preferred topoisomerase I cleavage motif. Linear hepadnaviral DNA is the primary substrate for integration[12,30], and the circular DNA must first be linearized before integration can take place. Insertion is then accomplished by strand invasion of cellular DNA. Thus, integration of viral DNA into chromosomal DNA requires that the linear DNA be imported into the nucleus of the infected cell[30,34,35]. Wang and Rogler[30]
have produced experimental evidence for a key role for the cellular enzyme topoisomerase I in the illegitimate recombination between hepadnaviral and host DNA. A role for this enzyme in illegitimate recombination is supported both by the finding of highly preferred topoisomerase I cleavage motifs in the immediate vicinity of almost all crossover sites in mammalian DNA, and by the observation that integrants in WHV-induced HCC in woodchucks occurred at preferred topoisomerase I cleavage sites[30].Fourthly, the integrated HBV DNA covered the S and X regions, the open reading frames most commonly integrated into chromosomal DNA[36]. Finally, the integrant detected in the serum of our patient with acute hepatitis B conformed in general to the integrants described in HCC developing in the
1813
T7T3
clone
455+
HBV
455
preC/C1814 2455
2307
2884
3200/0 P
s1621
833
1374
primers
Deleted HBV DNA
pPCR-Script Amp SK(+)plasmid
Integrated HBV DNA
Chromosomal DNA
1814 1836
X
1799 1774
630
1800-
X

6420 ISSN 1007-9327 CN 14-1219/R World J Gastroenterol November 7, 2005 Volume 11 Number 41
presence of chronic HBV infection[31]. It contained a long deletion (1 169 nucleotides in length), and the viral DNA between the right end of the deletion and the right virus/chromosome junction was inverted X sequence (Figure 1). One or more deletions or other more complex rearrangements are invariably found in inserted hepadnaviral DNA[10,31], indicating that specific mechanisms for integration of functional viral DNA into chromosomal DNA are not encoded by the virus. Simple microdeletions are most common, probably because the single-stranded ends of viral DNA resulting from topoisomerase I cleavage are sensitive to cellular nucleases. The larger deletions and complex rearrangements of the viral DNA are generally believed to occur after the integration[37], although WHV with extensive rearrangements of DNA has been described in hepatocyte nuclei in woodchucks[38] and there is some evidence in these animals that DNA rearranged in this way may be preferentially integrated[39]. Similarly, Yaginuma et al[40] observed features of HBV integration to be common to HCC and patients with chronic active hepatitis and an analogous integrant to the one detected in this study has been described in a 9-year-old child with HCC[41]. Integration of hepadnaviral DNA into host DNA is normally rare, perhaps because recycling of viral DNA into the nucleus is at a low level during productive infection[12]. The frequency of integration of DHBV in experimentally infected ducklings was estimated to be one viral genome per 103-104 cells by 6 d after the infection[12]. It is not known if these recombination events occurred in many cells or if a few cells produced many such events. In keeping with the belief that insertion events are uncommon, we found only a single integrant among many clones in only one of 6 patients with acute hepatitis B. Our finding, and that of others[12,18], of integrated viral DNA in early infection is in accordance with the observation, that importation of linear DNA into the nucleus is necessary for insertion of viral DNA into chromosomal DNA, and that such importation is known to occur in the phase of cccDNA amplification during the initiation of infection[42].Opportunities for viral integration beyond the early phase of infection would require continued importation of viral DNA into the nucleus, depend on new rounds of infection or loss and replacement of cccDNA by cell turnover[12]. Thus, insertion of linear forms of viral DNA may occur preferentially during early phases of infection or during periods of extensive hepatocyte turnover and/or re-infection, at times when linear viral DNA is imported into the nuclei. Integration may be enhanced during these periods by the availability of DNA ends resulting from DNA replication or damage[43]. Alternatively, interference with the normal replication cycle at some stage in chronic infection may result in the accumulation of linear forms of DNA, and there is some evidence for defective replication of HBV and accumulation of replicative intermediates in patients with HBV-associated HCC[44]. The clinical, biochemical, and serological features of the acute hepatitis B in the patient with the integrant did not differ obviously from those in the other patients with
uncomplicated disease. He made a complete clinical and biochemical recovery, and seroconverted to anti-HBs and IgG anti-HBc. At this stage, HBV DNA could no longer be detected in his serum by PCR amplification and further cloning was not attempted. Even if the integrated HBV DNA was still present in hepatocytes, it would not be detected in peripheral blood once healing of hepatocyte cell membranes had taken place. Thus, persistence of the integrated HBV DNA could only have been detected by analysis of liver tissue, and a liver biopsy was not felt to be justified. Although sources other than the liver for the chromosomal DNA amplified in the peripheral blood of the six patients with acute hepatitis B (including the one with fulminant hepatitis) are possible (for example, peripheral blood mononuclear cells), the finding of viral DNA integrated into host DNA in one of the patients favors leakage of chromosomal DNA fragments from damaged hepatocytes during the acute liver injury. Our finding of an integrant in a patient with acute hepatitis B may have no significance in relation to subsequent HCC development. Clonal expansion of an integrant is required for tumor formation, and the finding of a viral insertion in a tumor may simply reflect the fact that the clonal progenitor of the tumor happened to carry a viral integration[10]. Moreover, integrants may be lost from successive generations of cells[45]. Nevertheless, it is in accordance with the observation made in ducks that hepadnaviral DNA insertion may occur at a very early stage of infection, and raises the possibility that in certain circumstances early integration of HBV DNA might play a role in HBV-induced hepatocarcinogenesis.
ACKNOWLEDGMENTSThe authors are grateful to Dr. Jesse Summers and Dr. Charles Rogler for helpful discussions.
REFERENCES1 Kew MC. Hepatitis B virus in the etiology of hepatocellular
carcinoma. In: Tabor E, ed. Viruses and iver cancer. Amsterdam: Elsevier, 2002: 17-30
2 Feitelson MA. Hepatitis B virus in hepatocarcinogenesis. J Cell Physiol 1999; 181: 188-202
3 Kew MC, Popper H. Relationship between hepatocellular carcinoma and cirrhosis. Semin Liver Dis 1984; 4: 136-146
4 Shikata T. Primary liver carcinoma and cirrhosis. In: Okuda K PR, ed. Hepatocellular carcinoma. New York: John Wiley, 1987: 53-68
5 Paterson AC, Kew MC, Herman AA, Becker PJ, Hodkinson J, Isaacson C. Liver morphology in southern African blacks with hepatocellular carcinoma: a study within the urban environment. Hepatology 1985; 5: 72-78
6 Popper H, Sh ih JW, Ger in JL , Wong DC, Hoyer BH, London WT, Sly DL, Purcell RH. Woodchuck hepatitis and hepatocellular carcinoma: correlation of histologic with virologic observations. Hepatology 1981; 1: 91-98
7 Marion PL, Knight SS, Salazar FH, Popper H, Robinson WS. Ground squirrel hepatitis virus infection. Hepatology 1983; 3: 519-527
8 Marion PL, Knight SS, Ho BK, Guo YY, Robinson WS, Popper H. Liver disease associated with duck hepatitis B virus infection of domestic ducks. Proc Natl Acad Sci U S A 1984; 81: 898-902

Kimbiet GC et al. HBV DNA integrant in acute hepatitis B 6421
9 Kim CM, Koike K, Saito I, Miyamura T, Jay G. HBx gene of hepatitis B virus induces liver cancer in transgenic mice. Nature 1991;351: 317-320
10 Ogston CW, Jonak GJ, Rogler CE, Astrin SM, Summers J. Cloning and structural analysis of integrated woodchuck hepatitis virus sequences from hepatocellular carcinomas of woodchucks. Cell 1982; 29: 385-394
11 Marion PL, Van Davelaar MJ, Knight SS, Salazar FH, Garcia G, Popper H, Robinson WS. Hepatocellular carcinoma in ground squirrels persistently infected with ground squirrel hepatitis virus. Proc Natl Acad Sci USA 1986; 83: 4543-4546
12 Yang W, Summers J. Integration of hepadnavirus DNA in infected liver: evidence for a linear precursor. J Virol 1999; 73: 9710-9717
13 Bréchot C, Hadchouel M, Scotto J, Fonck M, Potet F, Vyas GN, Tiollais P. State of hepatitis B virus DNA in hepatocytes of patients with hepatitis B surface antigen-positive and -negative liver diseases. Proc Natl Acad Sci U S A 1981; 78: 3906-3910
14 Shafritz DA, Kew MC. Identification of integrated hepatitis B virus DNA sequences in human hepatocellular carcinomas. Hepatology 1981; 1: 1-8
15 Marconi M, Scotto J, Laliam M, Hadchouel M, Dazza MC, Larouzé B. A study of liver HBV DNA during follow-up of acute viral hepatitis in children. J Pediatr Gastroenterol Nutr 1988; 7: 507-510
16 Lugassy C, Bernuau J, Thiers V, Krosgaard K, Degott C, Wantzin P, Schalm SW, Rueff B, Benhamou JP, Tiollais P. Sequences of hepatitis B virus DNA in the serum and liver of patients with acute benign and fulminant hepatitis. J Infect Dis 1987; 155: 64-71
17 Yoffe B, Burns DK, Bhatt HS, Combes B. Extrahepatic hepatitis B virus DNA sequences in patients with acute hepatitis B infection. Hepatology 1990; 12: 187-192
18 Murakami Y, Minami M, Daimon Y, Okanoue T. Hepatitis B virus DNA in liver, serum, and peripheral blood mononuclear cells after the clearance of serum hepatitis B virus surface antigen. J Med Virol 2004; 72: 203-214
19 Tan EM, Schur PH, Carr RI, Kunkel HG. Deoxybonucleic acid (DNA) and antibodies to DNA in the serum of patients with systemic lupus erythematosus. J Clin Invest 1966; 45: 1732-1740
20 Jahr S, Hentze H, Englisch S, Hardt D, Fackelmayer FO, Hesch RD, Knippers R. DNA fragments in the blood plasma of cancer patients:quantitations and evidence for their origin from apoptotic and necrotic cells. Cancer Res 2001; 61: 1659-1665
21 Takahashi K, Akahane Y, Hino K, Ohta Y, Mishiro S. Hepatitis B virus genomic sequence in the circulation of hepatocellular carcinoma patients: comparative analysis of 40 full-length isolates. Arch Virol 1998; 143: 2313-2326
22 Kwok S, Higuchi R. Avoiding false positives with PCR. Nature 1989; 339: 237-238
23 Richter-Cook NJ, Dever TE, Hensold JO, Merrick WC. Purification and characterization of a new eukaryotic protein translation factor. Eukaryotic initiation factor 4H. J Biol Chem 1998; 273: 7579-7587
24 Martindale DW, Wilson MD, Wang D, Burke RD, Chen X, Duronio V, Koop BF. Comparative genomic sequence analysis of the Williams syndrome region (LIMK1-RFC2) of human chromosome 7q11.23. Mamm Genome 2000; 11: 890-898
25 Osborne LR, Martindale D, Scherer SW, Shi XM, Huizenga J, Heng HH, Costa T, Pober B, Lew L, Brinkman J, Rommens J, Koop B, Tsui LC. Identification of genes from a 500-kb region at 7q11.23 that is commonly deleted in Williams syndrome patients. Genomics 1996; 36: 328-336
26 Bowyer SM, van Staden L, Kew MC, Sim JG. A unique segment of the hepatitis B virus group A genotype identified in isolates from South Africa. J Gen Virol 1997; 78 ( Pt 7): 1719-1729
27 Kramvis A, Weitzmann L, Owiredu WK, Kew MC. Analysis of the complete genome of subgroup A' hepatitis B virus isolates from South Africa. J Gen Virol 2002; 83: 835-839
28 Kimbi GC, Kramvis A, Kew MC. Distinctive sequence characteristics of subgenotype A1 isolates of hepatitis B virus from South Africa. J Gen Virol 2004; 85: 1211-1220
29 Altschul SF, Madden TL, Schäffer AA, Zhang J, Zhang Z, Miller W, Lipman DJ. Gapped BLAST and PSI-BLAST: a new generation of protein database search programs. Nucleic Acids Res 1997; 25: 3389-3402
30 Wang HP, Rogler CE. Topoisomerase I-mediated integration of hepadnavirus DNA in vitro. J Virol 1991; 65: 2381-2392
31 S l a g l e B L , L e e T H , B u t e l J S . H e p a t i t i s B v i r u s a n d hepatocellular carcinoma. Prog Med Virol 1992; 39:167-203
32 Shaul Y, Garcia PD, Schonberg S, Rutter WJ. Integration of hepatitis B virus DNA in chromosome-specific satellite sequences. J Virol 1986; 59: 731-734
33 Shih C, Burke K, Chou MJ, Zeldis JB, Yang CS, Lee CS, Isselbacher KJ, Wands JR, Goodman HM. Tight clustering of human hepatitis B virus integration sites in hepatomas near a triple-stranded region. J Virol 1987; 61: 3491-3498
34 Gong SS, Jensen AD, Wang H, Rogler CE. Duck hepatitis B virus integrations in LMH chicken hepatoma cel ls : identification and characterization of new episomally derived integrations. J Virol 1995; 69: 8102-8108
35 Gong SS, Jensen AD, Chang CJ, Rogler CE. Double-stranded linear duck hepatitis B virus (DHBV) stably integrates at a higher frequency than wild-type DHBV in LMH chicken hepatoma cells. J Virol 1999; 73: 1492-1502
36 Unsal H, Yakicier C, Marçais C, Kew M, Volkmann M, Zentgraf H, Isselbacher KJ, Ozturk M. Genetic heterogeneity of hepatocellular carcinoma. Proc Natl Acad Sci USA 1994; 91: 822-826
37 Rogler CE, Summers J. Novel forms of woodchuck hepatitis virus DNA isolated from chronically infected woodchuck liver nuclei. J Virol 1982; 44: 852-863
38 Rogler CE, Summers J. Cloning and structural analysis of integrated woodchuck hepatitis virus sequences from a chronically infected liver. J Virol 1984; 50: 832-837
39 Kew MC, Miller RH, Chen HS, Tennant BC, Purcell RH. Mutant woodchuck hepatitis virus genomes from virions resemble rearranged hepadnaviral integrants in hepatocellular carcinoma. Proc Natl Acad Sci U S A 1993; 90: 10211-10215
40 Yaginuma K, Kobayashi H, Kobayashi M, Morishima T, Matsuyama K, Koike K. Multiple integration site of hepatitis B virus DNA in hepatocellular carcinoma and chronic active hepatitis tissues from children. J Virol 1987; 61: 1808-1813
41 Tsuei DJ, Hsu TY, Chen JY, Chang MH, Hsu HC, Yang CS. Analysis of integrated hepatitis B virus DNA and flanking cellular sequences in a childhood hepatocellular carcinoma. J Med Virol 1994; 42: 287-293
42 Tuttleman JS, Pourcel C, Summers J. Formation of the pool of covalently closed circular viral DNA in hepadnavirus-infected cells. Cell 1986; 47: 451-460
43 Petersen J, Dandri M, Bürkle A, Zhang L, Rogler CE. Increase in the frequency of hepadnavirus DNA integrations by oxidative DNA damage and inhibition of DNA repair. J Virol 1997; 71: 5455-5463
44 R a i m o n d o G , B u r k R D , L i e b e r m a n H M , M u s c h e l J , Hadziyannis SJ, Will H, Kew MC, Dusheiko GM, Shafritz DA. Interrupted replication of hepatitis B virus in liver tissue of HBsAg carriers with hepatocellular carcinoma. Virology 1988; 166: 103-112
45 Gong SS, Jensen AD, Rogler CE. Loss and acquisition of duck hepatitis B virus integrations in lineages of LMH-D2 chicken hepatoma cells. J Virol 1996; 70: 2000-2007
Science Editor Wang XL and Li WZ Language Editor Elsevier HK

PO Box 2345, Beijing 100023, China World J Gastroenterol 2005;11(41):6422-6428www.wjgnet.com World Journal of Gastroenterology ISSN [email protected] © 2005 The WJG Press and Elsevier Inc. All rights reserved.E L S E V I E R
• ������ ���������� •������ ���������� • •
Changes in lipid metabolism in chronic hepatitis C
Katalin Jármay, Gizella Karácsony, András Nagy, Zsuzsa Schaff
© 2005 The WJG Press and Elsevier Inc. All rights reserved.
Katalin Jármay, Gizella Karácsony, First Department of Internal Medicine, Albert Szent-Györgyi Medical University, Szeged, HungaryAndrás Nagy, County Hospital, Department of Cardiology, Kecskemét, HungaryZsuzsa Schaff, 2nd Department of Pathology, Semmelweis University, Budapest, HungarySupported by the grant from the Hungarian Ministry of Education, No.NKFP-1A/0023/2002 National Research Development Projects and grant from the Hungarian National Scientific Research Fund, No.OTKA T037838Correspondence to: Dr. Katalin Jármay, First Department of Internal Medicine, Albert Szent-Györgyi Medical University, Szeged, PO Box 469, H-6701, Hungary. [email protected]: +36-62-545-189 Fax: +36-62-545-185Received: 2004-10-29 Accepted: 2004-11-19
AbstractAIM: To investigate the relationship between certain biochemical parameters of lipid metabolism in the serum and steatosis in the liver.
METHODS: The grade of steatosis (0-3) and histological activity index (HAI, 0-18) in liver biopsy specimens were correlated with serum alanine aminotransferase (ALT), total cholesterol and triglyceride levels in 142 patients with chronic hepatitis C (CH-C), and 28 patients with non-alcoholic fatty liver disease (NAFLD) without hepatitis C virus (HCV) infection. The serum parameters were further correlated with 1 797 age and sex matched control patients without any liver diseases.
RESULTS: Steatosis was detected in 90 out of 142 specimens (63%) with CH-C. The ALT levels correlated with the grade of steatosis, both in patients with CH-C and NAFLD (P <0.01). Inserting the score values of steatosis as part of the HAI, correlation with the ALT level (P <0.00001) was found. The triglyceride and cholesterol levels were significantly lower in patients with CH-C (with and without steatosis), compared to the NAFLD group and to the virus-free control groups.
CONCLUSION: Our study confirms the importance of liver steatosis in CH-C which correlates with lower lipid levels in the sera. Inclusion of the score of steatosis into HAI, in case of CH-C might reflect the alterations in the liver tissue more precisely, while correlating with the ALT enzyme elevation.
Key words: Lipid metabolism; Chronic hepatitis C; NAFLD
Jármay K, Karácsony G, Nagy A, Schaff Z. Changes in lipid metabolism in chronic hepatitis C. World J Gastroenterol 2005; 11(41):6422-6428http://www.wjgnet.com/1007-9327/11/6422.asp
INTRODUCTIONHepatic steatosis is a frequent and characterist ic histological finding in patients with chronic hepatitis C (CH-C) in addition to bile duct damage and lymphoid follicles[1-5]. Fat accumulation in hepatocytes has been reported in 30-70% of liver biopsy specimens obtained from patients infected with hepatitis C virus (HCV)[1-4]. Whether steatosis is mainly related to host factors or to the viral cytopathic effect is still uncertain and a matter of dispute[6-15]. The pathogenesis of development of steatosis in CH-C is complex; host factors including alcohol consumption, exposure to other hepatotoxins, obesity, insulin resistance, type 2 diabetes mellitus, hypertriglyceridaemia, hypobetalipoproteinemia have all been identified as determinants[8,12,16-18].
The most important question concerning the clinical significance of steatosis in CH-C is whether l ipid accumulation influences the liver disease progression, affects treatment, or is solely an innocent bystander[5,19]. A role of steatosis in the progression of CH-C is suggested by the finding that the severity of fat accumulation correlates with the stage of fibrosis[20,21] and liver cell apoptosis[5]. Treatment with peginterferon or IFNα-2b and ribavirin has been found to reduce steatosis in HCV genotype 3 patients[1]. On the other hand, no significant association between the stage of fibrosis and liver steatosis has been found by others[22]. In vitro studies and transgenic mouse model have both shown the HCV core protein to be capable of inducing steatosis by itself[23,24], which suggests a direct effect of specific viral sequences in the pathogenesis of lipid accumulation. An association of nonstructural protein 5A (NS5A) with lipid droplets and apoA1 has also been observed[11].
The aim of the present work was to study the changes in certain parameters of lipid metabolism in patients with CH-C and compare the findings with the accumulation of fat in liver biopsy specimens and with the histology activity index (HAI). For this reason the serum cholesterol and triglyceride levels of CH-C patients were examined. Patients were selected on the basis of the presence or absence of steatosis in their liver biopsy specimens, as well
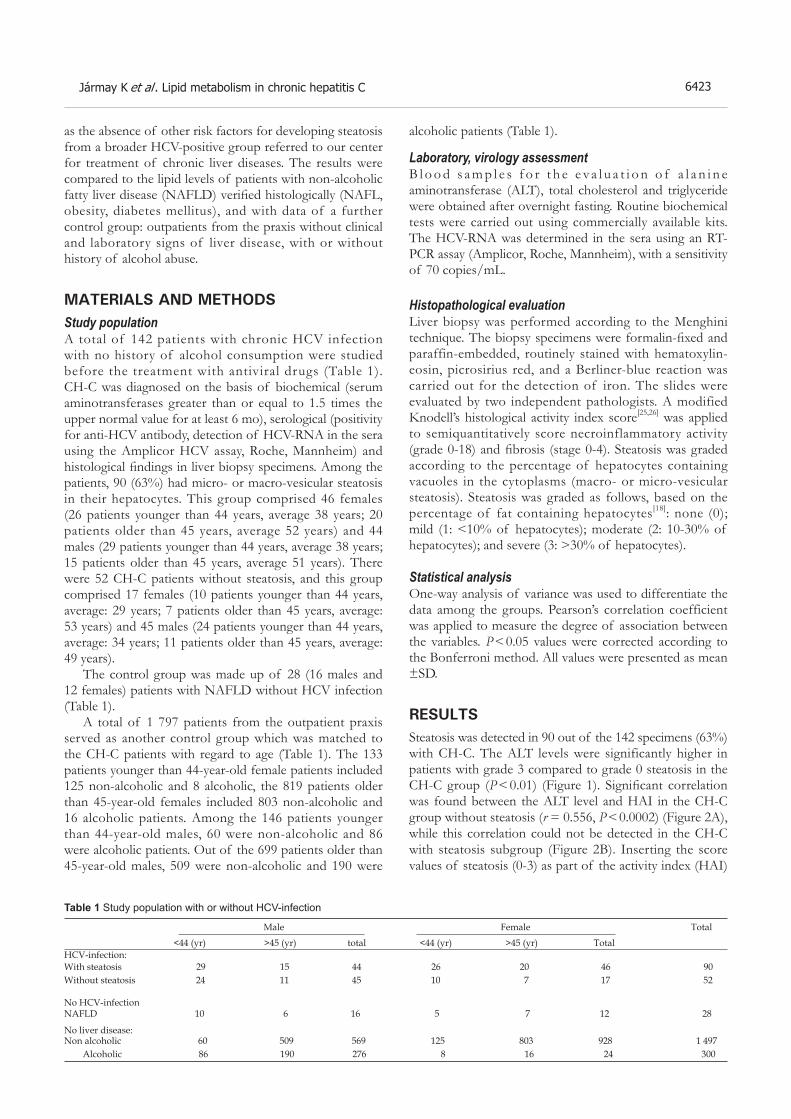
as the absence of other risk factors for developing steatosis from a broader HCV-positive group referred to our center for treatment of chronic liver diseases. The results were compared to the lipid levels of patients with non-alcoholic fatty liver disease (NAFLD) verified histologically (NAFL, obesity, diabetes mellitus), and with data of a further control group: outpatients from the praxis without clinical and laboratory signs of liver disease, with or without history of alcohol abuse.
MATERIALS AND METHODSStudy populationA total of 142 patients with chronic HCV infection with no history of alcohol consumption were studied before the treatment with antiviral drugs (Table 1). CH-C was diagnosed on the basis of biochemical (serum aminotransferases greater than or equal to 1.5 times the upper normal value for at least 6 mo), serological (positivity for anti-HCV antibody, detection of HCV-RNA in the sera using the Amplicor HCV assay, Roche, Mannheim) and histological findings in liver biopsy specimens. Among the patients, 90 (63%) had micro- or macro-vesicular steatosis in their hepatocytes. This group comprised 46 females (26 patients younger than 44 years, average 38 years; 20 patients older than 45 years, average 52 years) and 44 males (29 patients younger than 44 years, average 38 years; 15 patients older than 45 years, average 51 years). There were 52 CH-C patients without steatosis, and this group comprised 17 females (10 patients younger than 44 years, average: 29 years; 7 patients older than 45 years, average: 53 years) and 45 males (24 patients younger than 44 years, average: 34 years; 11 patients older than 45 years, average: 49 years).
The control group was made up of 28 (16 males and 12 females) patients with NAFLD without HCV infection (Table 1).
A total of 1 797 patients from the outpatient praxis served as another control group which was matched to the CH-C patients with regard to age (Table 1). The 133 patients younger than 44-year-old female patients included 125 non-alcoholic and 8 alcoholic, the 819 patients older than 45-year-old females included 803 non-alcoholic and 16 alcoholic patients. Among the 146 patients younger than 44-year-old males, 60 were non-alcoholic and 86 were alcoholic patients. Out of the 699 patients older than 45-year-old males, 509 were non-alcoholic and 190 were
alcoholic patients (Table 1).
Laboratory, virology assessmentB l o o d s a m p l e s f o r t h e e va l u a t i o n o f a l a n i n e aminotransferase (ALT), total cholesterol and triglyceride were obtained after overnight fasting. Routine biochemical tests were carried out using commercially available kits. The HCV-RNA was determined in the sera using an RT-PCR assay (Amplicor, Roche, Mannheim), with a sensitivity of 70 copies/mL.
Histopathological evaluationLiver biopsy was performed according to the Menghini technique. The biopsy specimens were formalin-fixed and paraffin-embedded, routinely stained with hematoxylin-eosin, picrosirius red, and a Berliner-blue reaction was carried out for the detection of iron. The slides were evaluated by two independent pathologists. A modified Knodell’s histological activity index score[25,26] was applied to semiquantitatively score necroinflammatory activity (grade 0-18) and fibrosis (stage 0-4). Steatosis was graded according to the percentage of hepatocytes containing vacuoles in the cytoplasms (macro- or micro-vesicular steatosis). Steatosis was graded as follows, based on the percentage of fat containing hepatocytes[18]: none (0); mild (1: <10% of hepatocytes); moderate (2: 10-30% of hepatocytes); and severe (3: >30% of hepatocytes).
Statistical analysisOne-way analysis of variance was used to differentiate the data among the groups. Pearson’s correlation coefficient was applied to measure the degree of association between the variables. P < 0.05 values were corrected according to the Bonferroni method. All values were presented as mean±SD.
RESULTSSteatosis was detected in 90 out of the 142 specimens (63%) with CH-C. The ALT levels were significantly higher in patients with grade 3 compared to grade 0 steatosis in the CH-C group (P < 0.01) (Figure 1). Significant correlation was found between the ALT level and HAI in the CH-C group without steatosis (r = 0.556, P < 0.0002) (Figure 2A), while this correlation could not be detected in the CH-C with steatosis subgroup (Figure 2B). Inserting the score values of steatosis (0-3) as part of the activity index (HAI)
Male Female Total
<44 (yr) >45 (yr) total <44 (yr) >45 (yr) Total HCV-infection:With steatosis 29 15 44 26 20 46 90Without steatosis 24 11 45 10 7 17 52
No HCV-infectionNAFLD 10 6 16 5 7 12 28
No liver disease:Non alcoholic 60 509 569 125 803 928 1 497 Alcoholic 86 190 276 8 16 24 300
Table 1 Study population with or without HCV-infection
Jármay K et al . Lipid metabolism in chronic hepatitis C 6423

Figure 1 Differences of ALT levels in CH-C patients without steatosis (n = 52, grade 0) and with severe steatosis (n = 28, grade 3) (P < 0.01).
600
500
400
300
200
100
0
grade 0 grade 3Grade of steatosis
ALT
(U/L
)
Among the same groups, the cholesterol levels showed the same pattern as noted for the triglyceride levels. The only difference was that the young steatotic HCV infected male patients failed to show higher cholesterol levels, as was the case in relation to triglyceride (Figures 7A and B; 8A and B).
DISCUSSIONLiver steatosis is an important hallmark of CH-C[1-4,8,10,13,27-29]. The mechanism of HCV-related steatosis, however, is not exactly clear. Both metabolic[8,16-18,29,30] and viral cytopathic effects[7,10,11,13,24] have been suggested to play a role in the pathogenesis. The HCV viral components, especially the HCV-core protein, have been found in association with steatosis. Lipid droplets on which the core accumulated have been found in HCV-core-transfected cell lines strongly expressing this protein[24]. Hepatic overexpression of the HCV-core protein has been shown to interfere with the hepatic assembly and secretion of triglyceride-rich very low density lipoproteins (VLDL)[31]. Fatty change was detected in vivo in core-expressing transgenic mice too[23]. Chimpanzees chronically infected with HCV developed steatosis similarly to human beings[24]. The degree of steatosis in chimpanzees correlated with the amount of viral load and ALT[32].
More recently the NS5A of HCV has been shown in association with lipid droplets and apoA1, suggesting that NS5A may contribute to the pathogenesis of steatosis commonly observed in HCV-infected livers[11]. It has, however, been demonstrated that neither HCV viral load nor HCV genotype is associated with the severity of steatosis in certain studies[29,33].
HCV is a lipid-containing virus which binds to low density lipoprotein, VLDL, IgG and to a minor degree to IgM and high density lipoprotein[34]. This is in correlation with the finding that HCV infection is associated with hypo-β-lipoproteinemia, which occurs in the early stages of HCV infection before the development of cirrhosis[16,35]. The correlation between apo B levels and HCV viral load confirms the interaction between HCV infection and β-lipoprotein metabolism. This suggests that β-lipoproteins competitively inhibit HCV infection, because both HCV and β-lipoprotein use the same LDL receptor[16].
of chronic hepatitis, the correlation between the ALT level and histological scores of inflammatory activity grade was confirmed again in the 142 CH-C patients (r = 0.41, P<0.00001) (Figure 2C). The ALT level also correlated with grade of steatosis in patients without HCV infection (r = 0.533, P<0.005) (Figure 3), similarly to the CH-C patients. Upon comparing the ALT levels in patients with and without steatosis and with steatosis only, the highest ALT level was found in the steatotic CH-C group (Figure 4).
Triglyceride and cholesterol levels of CH-C patients were subgrouped according to age and sex, with and without steatosis. The lipid values of the CH-C groups were compared to the l ipid values of the virus-free steatotic patients. The data of these subgroups were further compared based on their average age with the same age and sex group, as well as with the population from the outpatient praxis concerning drinking habits. The lipid levels of CH-C patients with liver steatosis were compared to the levels noted in the drinking outpatients, while these data involving the CH-C patients without liver steatosis were related to the non-drinking outpatients (Figures 5A and B; 6A and B; 7A and B; 8A and B)
The triglyceride levels were low in all the eight separated subgroups with CH-C (with and without steatosis, female, male, young, and elderly patients) (Figures 5A and B; 6A and B). These levels were conspicuously lower compared to the same values of the CH-C virus-free steatotic patients as well as to the drinker or nondrinker population.
1816141210 8 6 4 2 0
0 100 200 300 400 500 600
HA
I + g
rade
of s
teat
osis
ALT(U/L)
C14
12
10
8
6
4
2
00 100 200 300 400 500 600
HA
I
ALT (U/L)
B16
14
12
10
8
6
4
2
00 50 100 150 200 250 300
HA
I
ALT (U/L)
A
Figure 2 Correlation between ALT levels and HAI/HAI+steatosis in CH-C patients. A: without steatosis (n = 52, r = 0.556, P < 0.00002); B: with steatosis (n = 90, NS); C: in CH-C patients (n = 142, r = 0.41, P < 0.00001).
6424 ISSN 1007-9327 CN 14-1219/ R World J Gastroenterol November 7, 2005 Volume 11 Number 41

Figure 5 Triglyceride levels in CH-C female patients. A: With steatosis compared to outpatients with alcoholic habits; Bar 1: CH-C young female patients with steatosis (n = 26, average age 38 years); Bar 2: CH-C elderly female patients with steatosis (n = 20, average age 52 years);Bar 3: Female patients with liver steatosis (n = 12); Bar 4: outpatientswith alcoholic habits (n = 8, age 38 years); Bar 5: outpatients with alcoholic habits(n = 16, age 52 years). Bar 1 Ns vs Bar 2. Bar 1 and 2 NS vs Bar 3. Bar1 and 2 P<0.004 vs Bar 4. B: Without steatosis compared to outpatients without alcoholic habits.
4.0
3.5
3.0
2.5
2.0
1.5
1.0
0.50 100 200 300 400
Gra
de o
f ste
atos
is
ALT(U/L)
Figure 3 Correlation between ALT levels and grade of steatosis in patients without CH-C (n = 28, r = 0.533, P<0.005).
Figure 4 ALT levels in CH-C patients without and with steatosis and in patients with steatosis without CH-C. Bar 1: CH-C patients without steatosis(n = 52). Bar 2: CH-C patients with steatosis (n = 90). Bar 3: Patients with liver steatosis without CH-C (n = 28) Bar 1 P<0.02 vs Bar 2. Bar 2 P<0.02 vs Bar 3.
250
200
150
100
50
00 1 2 3 4
ALT
(U/L
)7
6
5
4
3
2
1
00 1 2 3 4 5 6
Trig
lyce
ride
mm
ol/L
A 4
3
2
1
00 1 2 3 4 5 6
BTr
igly
cerid
e m
mol
/L
Jármay K et al . Lipid metabolism in chronic hepatitis C 6425
8
6
4
2
00 1 2 3 4 5 6
A
Trig
lyce
ride
mm
ol/L
7
6
5
4
3
2
1
00 1 2 3 4 5 6
Trig
lyce
ride
mm
ol/L
B
Figure 6 Triglyceride levels in CH-C male patients. A: Steatosis compared to outpatients with alcoholic habits; Bar 1: CH-C young male patients with steatosis(n = 29, average age 37 years); Bar 2: CH-C elderly male patients with steatosis (n = 15, average age 52 years); Bar 3: Male patients with liver steatosis (n = 16); Bar 4: Male outpatients with alcoholic habits (n = 86, age 37 years); Bar 5: Male outpatients with alcoholic habits (n = 190, age 52 years). Bar 1 P<0.0001 vs Bar 4. Bar 2 P<0.0001 vs Bar 4. Bar 4 P<0.0001 vs Bar 5. B: Without steatosis compared to outpatients without alcoholic habits. Bar 1: CH-C young male patients without steatosis (n = 24, age 37 years); Bar2: CH-C elderly male patients without steatosis (n = 11, average age 49 years); Bar 3: Male patients with liver steatosis (n = 16); Bar 4: Male outpatients without alcoholic habits (n = 60, age 37 years); Bar 5: Male outpatients without alcoholic habits (n = 509, age 49 years). Bar 1 and 2 P<0.0005 vs Bar 3. Bar 3 P<0.0005 vs Bar 4.

10
8
6
4
2
00 1 2 3 4 5 6
Cho
lest
erol
mm
ol/L
A 10
8
6
4
2
00 1 2 3 4 5 6
Cho
lest
erol
mm
ol/L
B
Figure 7 Cholesterol levels in CH-C female patients. A: With steatosis compared to outpatients with alcoholic habits; Bar 1: CH-C young female patients with steatosis (n = 26, average age 38 years); Bar 2: CH-C elderly female patients with steatosis (n = 20,average age 52 years); Bar 3: female patients with liver steatosis (n = 12); Bar 4: female outpatients with alcoholic habits (n = 8, age 38 years); Bar 5: female outpatients with alcoholic habits (n = 16, age 52 years). Bar 1 NS vs Bar 2. Bar 1 and 2 P<0.0001 vs Bar 3. Bar 1 P<0.0001 vs Bar 4. Bar 1 and 2 P<0.0001 vs Bar 5. B: Without steatosis compared to outpatients without alcoholic habits. Bar 1: CH-C young female patients without steatosis (n = 10, average age 29 years); Bar 2: CH-C elderly female patients without steatosis (n = 7, average age 53 years); Bar 3: female patients with liver steatosis (n = 12); Bar 4: female outpatients without alcoholic habits (n = 125, age 29 years); Bar 5: female outpatients without alcoholic habits (n = 803, age 53 years). Bar 1 NS vs Bar 2. Bar 1 P < 0.0001 vs Bar 3. Bar 1 P<0.0001 vs Bar 5. Bar 3 P < 0.0001 vs Bar 4.
6426 ISSN 1007-9327 CN 14-1219/ R World J Gastroenterol November 7, 2005 Volume 11 Number 41
10
8
6
4
2
00 1 2 3 4 5 6
Cho
lest
erol
mm
ol/L
A 8
6
4
2
00 1 2 3 4 5 6
Cho
lest
erol
mm
ol/L
B
Figure 8 Cholesterol levels in CH-C male patients. A: With steatosis compared to outpatients with alcoholic habits; Bar 1: CH-C young male patients with steatosis(n = 29, average age 37 years); Bar 2: CH-C elderly male patients with steatosis (n = 15, average age 51 years); Bar 3: male patients with liver steatosis (n = 16); Bar 4: male outpatients with alcoholic habits (n = 86, age 37 years); Bar 5: male outpatients with alcohollic habits (n = 190, age 51 years). Bar 1NS vs Bar 2. Bar 1 and 2 P<0.0001 vs Bar 3. Bar 1 and 2 P<0.0001 vs Bar 4. B: Without steatosis compared to outpatients without alcoholic habits. Bar 1: CH-C young male patients without steatosis (n = 24, average age 34 years); Bar 2: CH-C elderly male patients without steatosis (n = 11, average age 49 years); Bar 3: male patients with liver steatosis (n = 16); Bar 4: male outpatients without alcoholic habits (n = 60, age 34 years); Bar 5:Male outpatients without alcoholic habits (n = 509, age 49 years). Bar1NS vs Bar 2. Bar 1 and 2 P<0.001 vs Bar 3. Bar 1 and 2 P<0.001 vs Bar 5. Bar 3 P<0.001 vs Bar 4.
In certain studies, steatosis was found to accelerate the progression of liver disease and correlate with specific HCV genotype[36]. In our study steatosis was detected in 63% of CH-C patients. The ALT-levels were statistically in correlation with the grade of steatosis. Comparing the HAI and ALT levels, a significant correlation was found in the CH-C cases without steatosis, while no difference was found in the group with steatosis. Inserting the score values of steatosis (0-3) into the score of the grade of necroinflammation, a significant correlation was detected for HAI and ALT levels. This suggests that inclusion of the score of steatosis into the grade, for measuring the necroinflammatory reaction in CH-C, might better reflect the alteration in the liver tissue and correlate with ALT enzyme elevation. Our data strongly suggest the importance of steatosis in the virus related
necroinflammatory process. Worsening of steatosis was found as an independent factor in fibrosis progression in CH-C[37].
Regarding the different patient subgroups, the triglyceride levels revealed a marked low degree in the C virus-infected patients in comparison to the levels seen in the non-viral steatotic patients and in the relatively large number of outpatients without clinical signs of liver diseases. This detected phenomenon was observable in relation to the age, sex, and drinking habits of the outpatients of the praxis, too.
The behavior of cholesterol levels was the same as in case of the triglyceride levels, while the young steatotic virus-infected male patients failed to show higher elevated levels.
In conclusion, a recent study has found an association

Jármay K et al . Lipid metabolism in chronic hepatitis C 6427
between liver cell apoptosis and steatosis in CH-C patients, which might contribute to the progression of liver injury and fibrosis in CH-C[5]. Our study confirms the importance of the presence of steatosis, which is associated with higher ALT- and lower lipid levels on the periphery in CH-C patients with steatosis. The peripheral lipid levels, however, do not reflect the severity of steatosis or liver damages. Our study suggests that the grade of steatosis in the liver is a substantial part of the determination of the grade of necroinflammation and should be incorporated into the evaluation of liver biopsy materials in CH-C patients.
REFERENCES 1 Poynard T, Ratziu V, McHutchison J, Manns M, Goodman Z,
Zeuzem S, Younossi Z, Albrecht J. Effect of treatment with peginterferon or interferon alfa-2b and ribavirin on steatosis in patients infected with hepatitis C. Hepatology 2003; 38: 75-85
2 Lefkowitch JH, Schiff ER, Davis GL, Perrillo RP, Lindsay K, Bodenheimer HC Jr, Balart LA, Ortego TJ, Payne J, Dienstag JL, Gibas A, Jakobson IM, Tamburro CH, Carey W, O’Brien C, Sampliner R, Thiel DH, Feit D, Albrecht J, Meschievitz I, Sanghvi B, Vaugham RD. Pathological diagnosis of chronic hepatitis C: A multicenter comparative study with chronic hepatitis B. Gastroenterol 1993; 104: 595-603
3 Giannini E, Ceppa P, Botta F, Fasoli A, Romagnoli P, Cresta E, Venturino V, Risso D, Celle G, Testa R. Steatosis and bile duct damage in chronic hepatitis C: distribution and relationships in a group of Northern Italian patients. Liver 1999; 19: 432-437
4 Scheuer PJ, Ashrafzadeh P, Sherlock S, Brown D, Dusheiko GM. The pathology of hepatitis C. Hepatology 1992; 15: 567-571
5 Walsh MJ, Vanags DM, Clouston AD, Richardson MM, Purdie DM, Jonsson JR, Powell EE. Steatosis and liver cell apoptosis in chronic hepatitis C: Amechanism for increased liver injury. Hepatology 2004; 39: 1230-1238
6 Fiore G, Fera G, Napoli N, Vella F, Schiraldi O. Liver steatosis and chronic hepatitis C: a spurious association? Eur J Gastroenterol Hepatol 1996; 8: 125-129
7 Hui JM, Kench J, Farrell GC, Lin R, Samarasinghe D, Liddle C, Byth K, George J. Genotype-specific mechanisms for hepatic steatosis in chronic hepatitis C infection. J Gastroenterol Hepatol 2002; 17: 873-881
8 Sanyal AJ, Contos MJ, Sterling RK, Luketic VA, Shiffman ML, Stravitz RT, Mills AS. Nonalcoholic fatty liver disease in patients with hepatitis C is associated with features of the metabolic syndrome. Am J Gastroent 2003; 98: 2064-2071
9 Friedenberg F, Pungpapong S, Zaeri N, Braitman LE. The impact of diabetes and obesity on liver histology in patients with hepatitis C. Diabetes Obesity and Metabolism 2003; 5: 150-155
10 Gochee PA, Jonsson JR, Clouston AD, Pandeya N, Purdie DM, Powell EE. Steatosis in chronic hepatitis C: association with increased messenger RNA expression of collagen I, tumor necrosis factor-alpha and cytochrome P450 2E1. J Gastroenterol Hepatol 2003; 18: 386-392
11 Shi ST, Polyak SJ, Tu H, Taylor DR, Gretch DR, Lai MM. Hepatitis C virus NS5A colocalizes with the core protein on lipid droplets and interacts with apolipoproteins. Virology 2002; 292: 198-210
12 Monto A. Hepatitis C and steatosis. Semin Gastrointest Dis 2002; 13: 40-46
13 Kumar D, Farrell GC, Fung C, George J. Hepatitis C virus genotype 3 is cytopathic to hepatocytes: Reversal of hepatic
steatosis after sustained therapeutic response. Hepatology 2002; 36: 1266-1272
14 Negro, F. Hepatitis C virus and liver steatosis: Is it the virus? Yes it is, but not always. Hepatology 2002; 36: 1050-1052
15 Ramalho F. Hepatitis C virus infection and liver steatosis. Antiviral Res 2003; 60: 125-127
16 Petit JM, Bour JB, Galland-Jos C, Minello A, Verges B, Guiguet M, Brun JM, Hillon P. Risk factors for diabetes mellitus and early insulin resistance in chronic hepatitis C. J Hepatol 2001; 35: 279-283
17 Ratziu V, Trabut JB, Poynard T. Fat, diabetes, and liver injury in chronic hepatitis C. Current Gastroenterology Reports 2004; 6: 22-29
18 Serfaty L, Poujol-Robert A, Carbonell N, Chazouillères O, Poupon RE, Poupon R. Effect of the interaction between steatosis and alcohol intake on liver fibrosis progression in chronic hepatitis C. Am J Gastroent 2002; 97: 1807-1812
19 Bjoro K, Bell H, Hellum KB, Skaug K, Raknerud N, Sandvei P, Doskeland B, Maeland A, Lund-Tonnesen S, Myrvang B. Effect of combined interferon-alpha induction therapy and ribavirin on chronic hepatitis C virus infection: a randomized multicentre study. Scand J Gastroenterol 2002; 37: 226-232
20 Hourigan LF, Macdonald GA, Purdie D, Whitehall VH, Shorthouse C, Clouston A, Powell EE. Fibrosis in chronic hepatitis C correlates significantly with body mass index and steatosis. Hepatology 1999; 29: 1215-1219
21 Westin J, Nordlinder H, Lagging M, Norkrans G, Wejstål R. Steatosis accelerates fibrosis development over time in hepatitis C virus genotype 3 infected patients. J Hepatol 2002; 37: 837-842
22 Asselah T, Boyer N, Guimont MC, Cazals-Hatem D, Tubach F, Nahon K, Daïkha H, Vidaud D, Martinot M, Vidaud M, Degott C, Valla D, Marcellin P. Liver fibrosis is not associated with steatosis but with necroinflammation in French patients with chronic hepatitis C. Gut 2003; 52: 1638-1643
23 Moriya K, Yotsuyanagi H, Shintani Y, Fujie H, Ishibashi K, Matsuura Y, Miyamura T, Koike K. Hepatitis C virus core protein induces hepatic steatosis in transgenic mice. J Gen Virol 1997; 78: 1527-1531
24 Barba G, Harper F, Harada T, Kohara M, Goulinet S, Matsuura Y, Eder G, Schaff Z, Chapman MJ, Miyamura T, Bréchot C. Hepatitis C virus core protein shows a cytoplasmic localization and associates to cellular lipid storage droplets. Proc Natl Acad Sci USA 1997; 94: 1200-1205
25 Desmet VJ , Knodel l RG , I shak KG, Black WC, Chen T S , C r a i g R , K a p l o w i t z N , K i e r n a n T W , W o l l m a n J . F o r m u l a t i o n a n d a p p l i c a t i o n o f a n u m e r i c a l s c o r i n g s y s t e m f o r a s s e s s i n g h i s t o l o g i c a l a c t i v i t y
in asymptomatic chronic active hepatitis. Hepatology 1981; 1: 431-435 26 Ishak K, Baptista A, Bianchi L, Callea F, De Groote J, Gudat
F, Denk H, Desmet V, Korb G, MacSween RN. Histological grading and staging of chronic hepatitis. J Hepatol 1995; 22: 696-699
27 Rubbia-Brandt L, Quadri R, Abid K, Giostra E, Malé PJ, Mentha G, Spahr L, Zarski JP, Borisch B, Hadengue A, Negro F. Hepatocyte steatosis is a cytopathic effect of hepatitis C virus genotype 3. J Hepatol 2000; 33: 106-115
28 Rubbia-Brandt L, Leandro G, Spahr L, Giostra E, Quadri R, Malé PJ, Negro F. Liver steatosis in chronic hepatitis C: a morphological sign suggesting infection with HCV genotype 3. Histopathology 2001; 39: 119-124
29 Giannini E, Ceppa P, Botta F, Mastracci L, Romagnoli P, Comino I, Pasini A, Risso D, Lantieri PB, Icardi G, Barreca T, Testa R. Leptin has no role in determining severity of steatosis and fibrosis in patients with chronic hepatitis C. Am J Gastroenterol 2000; 95: 3211-3217
30 Monto A, Alonzo J, Watson JJ, Grunfeld C, Wright TL. Steatosis in chronic hepatitis C: Relative contributions of obesity, diabetes mellitus, and alcohol. Hepatology 2002; 36: 729-736
31 Perlemuter G, Sabile A, Letteron P, Vona G , Topilco A, Chrétien Y, Koike K, Pessayre D, Chapman J, Barba G, Bréchot C.

6428 ISSN 1007-9327 CN 14-1219/ R World J Gastroenterol November 07, 2005 Volume 11 Number 41
Hepatitis C virus core protein inhibits microsomal triglyceride transfer protein activity and very low density lipoprotein secretion: a model of viral-related steatosis. FASEB J 2002; 16: 185-194
32 Eder G, Sárosi I, Schaff Zs. Safety testing of blood products in chimpanzees. In: Eder G, Kaiser E, King FA, eds. The role of the chimpanzeein research. Basel: Karger S, 1994: 156-166
33 Fujie H, Yotsuyanagi H, Moriya K, Shintani Y, Tsutsumi T, Takayama T, Makuuchi M, Matsuura Y, Miyamura T, Kimura S, Koike K. Steatosis and intrahepatic hepatitis C virus in chronic hepatitis. J Med Virol 1999; 59: 141-145
34 Thomssen R, Bonk S, Thiele A. Density heterogeneities of hepatitis C virus in human sera due to the binding of beta-lipoproteins and immunoglobulins. Med Microbiol Immunol 1993; 182: 329-334
35 Serfaty L, Andreani T, Giral P, Carbonell N, Chazouillères O, Poupon R.Hepatitis C virus induced hypobetalipoproteinemia: a possible mechanism for steatosis in chronic hepatitis C. J Hepatol 2001; 34: 428-434
36 Adinolfi LE, Gambardella M, Andreana A, Tripodi MF, Utili R, Ruggiero G. Steatosis accelerates the progression of liver damage of chronic hepatitis C patients and correlates with specific HCV genotype and visceral obesity. Hepatology 2001; 33: 1358-1364
37 Castéra L, Hézode C, Roudot-Thoraval F, Bastie A, Zafrani ES, Pawlotsky JM, Dhumeaux D. Worsening of steatosis is an independent factor of fibrosis progression in untreated patients with chronic hepatitis C and paired liver biopsies. Gut 2003; 52: 288-292
Science Editor Guo SY Language Editor Elsevier HK

PO Box 2345, Beijing 100023, China world J Gastroenterol 2005;11(41):6429-6432www.wjgnet.com World Journal of Gastroenterology [email protected] © 2005 The WJG Press and Elsevier Inc. All rights reserved. E L S E V I E R
• VIRAL HEPATITIS •
VP22 fusion protein-based dominant negative mutant can inhibit hepatitis B virus replication
Jun Yi, Ling Wang, Rui Ling, Jiang-Hao Chen, Jun Yun, Department of General Surgery, Xijing Hospital, Fourth Military Medical University, Xi’an 710033, Shaanxi Province, ChinaWei-Dong Gong, Oncology Center, Zhujiang Hospital, Southern Medical University, Guangzhou 510282, Guangdong Province, ChinaSupported by the National Natural Science Foundation of China, No. 30400380Correspondence to: Wei-Dong Gong, Oncology Center, Zhujiang Hospital, Southern Medical University, Guangzhou 510282, Guangdong Province, China. [email protected]: +86-20-83373939Received: 2004-12-02 Accepted: 2005-02-18
AbstractAIM: To investigate the inhibitory effect of VP22 fusion protein-based dominant negative (DN) mutant on Hepatitis Bvrus (HBV) replication.
METHODS: Full-length or truncated fragment of VP22 was fused to C terminal of HBV core protein (HBc), and subcloned into pcDNA3.1 (-) vector, yielding eukaryotic expression plasmids of DN mutant. After transfection into HepG2.2.15 cells, the expression of DN mutant was identified by immunofluorescence staining. The inhibitory effect of DN mutant on HBV replication was indexed as the supernatant HBsAg concentration determined by RIA and HBV-DNA content by fluorescent quantification-PCR (FQ-PCR). Meanwhile, metabolism of HepG2.2.15 cells was evaluated by MTT colorimetry.
RESULTS: VP22-based DN mutants and its truncated fragment were expressed in HepG2.2.15 cells, and had no toxic effect on host cells. DN mutants could inhibit HBV replication and the transduction ability of mutant-bearing protein had a stronger inhibitory effect on HBV replication. DN mutants with full length of VP22 had the strongest inhibitory effect on HBV replication, reducing the HBsAg concentration by 81.94%, and the HBV-DNA content by 72.30%. MTT assay suggested that there were no significant differences in cell metabolic activity between the groups.
CONCLUSION: VP22-based DN mutant can inhibit HBV replication effectively. © 2005 The WJG Press and Elsevier Inc. All rights reserved.
Key words: Hepatitis B virus; Dominant negative mutant; VP22
Yi J, Gong WD, Wang L, Ling R, Chen JH, Yun J. VP22 fusion protein-based dominant negative mutant can inhibit hepatitis B virus replication. World J Gastroenterol 2005; 11(41):6429-6432http://www.wjgnet.com/1007-9327/11/6429.asp
INTRODUCTIONAt present, about 3.5 hundred million people are infected with HBV, and about 1 million people die of HepatitisHepatitis Bvrus (HBV)� infection or related diseases each �ear, infection or related diseases each �ear, ranking 9th in disease deaths[1-4]. There are no effective therapies for HBV infection. Although about 40% HBV-infected patients responded to interferon, patients in our countr� have a poorer response to it. Other antiviral agents, such as nucleoside/nucleotide analogs[5], are quite effective inhibitors of HBV replication[6-9]. However, the rapid development of drug resistance remains a growing concern. Gene therap� provides a novel idea for the treatment of HBV infection, can inhibit replication of HBV at gene level and remove HBV from host cells[10-12]. Expression of dominant negative (DN)� mutant in liver cells is one of the most important strategies[13-17].
In 1997, Elliott and O’Hare[18] found that VP22, a structural protein (and its fusion protein)� of herpes simplex virus t�pe-1 (HSV-1)�, can enter into the cells from the medium, and translocate between cells in a contact-independent manner. Here, VP22 was fused to HBV core protein (HBc)� and a fusion DN mutant was constructed to enhance the antiviral effect of the DN mutant b� utilizing the transduction abilit� of VP22 protein.
MATERIALS AND METHODSMaterialsPlasmids pVP22/myc-His2 and pcDNA3.1(-)� were purchased from Invitrogen Co. EBO-HBV, in which 1.3-folds of HBV genome was cloned, and stored in our laborator�. Restriction enz�mes and ligations were purchased from TaKaRa Biotech Co., Ltd; mouse anti-HBc or c-m�c antibodies were purchased from Santa Cruz Co. FITC-labeled sheep anti-mouse IgG was purchased from BioStar Biotech Co., Ltd. DMEM, fetal bovine serum, and Lipofectamine 2000 were purchased from GIBCO Co. Solid phase radio-immunoassa� kit was purchased from Beimian Dong�a Biotech Institute, Beijing.
Oligonucleotides and primersAll the oligonucleotides and primers were s�nthesized
Jun Yi, Wei-Dong Gong, Ling Wang, Rui Ling, Jiang-Hao Chen, Jun Yun

b� TaKaRa Biotech Co., Ltd. The underlined sequences indicate restriction enz�me (right)� sites, respectivel�, which were added to the oligonucleotide primers for subsequent cloning of amplified DNA. The capital letters indicate start or stop codon.HBc1: 5’-gcgcggtaccATGgacatcgaccctt-3’ (KpnI)�HBc2: 5’-gcgcctcgagTCAggatccacattgaggttccc-3’ (XhoI, BamHI)�US: 5’-gcccggatccatgacctctcgctccgtg-3’ (BamHI)�UR: 5’-ccccagatctatcgggactcgccatacc-3’ (BglII)�DS: 5’-gccgagatctgacgcggccacggcg-3’ (BglII)�DR: 5’-gggcctcgagTTAcagctaatcctcttctgag-3’ (XhoI)�c-m�c1:5’-gcccggatccgaacaaaaactcatctcagaagaggatctgTAActcgaggggc-3’ (BamHI, XhoI)�c-m�c2:5’-gggcctcgagTTAcagatcctcttctgagatgagtttttgttcggatccgccc-3’ (XhoI, BamHI)�
Cell cultureHepG2.2.15 cells integrated with full-length HBV gene[19-21] were cultured in DMEM containing 150 mL/L fetal bovine serum at 37 °C, in 50 mL/L CO2. G418 was added to screen cells at the final concentration of 100 mg/L. The media were freshened once in ever� two da�s and the cells were passaged ever� six da�s.
Plasmid constructsPCR products, amplified from EBO-HBV using HBc1/HBc2 as primers, were cloned into pcDNA3.1(-)� after being digested b� KpnI/XhoI, �ielding the vector pHBc (Figure 1)�.
C-m�c1/c-m�c2 were dissolved at a concentration of 0.1 g/L and annealed b� heating at 100 °C for 5 min, then slowl� cooling to room temperature to form double-stranded c-m�c digested b� BamHI/XhoI and cloned into pHBc digested b� the same restrictions to produce plasmid pHVP22/M.
The fragment including full-length of VP22 and c-myc epitope was amplified from pVP22/myc-His2 plasmid
6430 ISSN 1007-9327 CN 14-1219/ R World J Gastroenterol November 7, 2005 Volume 11 Number 41
(primers US/DR)�. PCR products were digested b� BamHI/XhoI and inserted into pHBc to produce pHVP22/F.
The upstream of VP22-coding sequence 102 bp amplified from pVP22/myc-His2 (primers US/UR)� was digested b� BamHI/BglII and ligated into BamHI site of pHVP22/M restricted with BamHI and dephosphorized. The resulting plasmid bearing directional insertion was called pHVP22/U.
The downstream of VP22-coding sequence 102 bp was amplified from pVP22/myc-His2, and PCR products were inserted into pHBc after BamHI/XhoI digestion to produce plasmid pHVP22/D.
TransfectionTransfections were performed as described b� the provider of Lipofectamine 2000 (Gibco’s handbook)�. Cells (4×10⁸ L)� were added to a 24-well plate (500 L/well)� in which a coverslide was placed in advance. The transfection experiment was divided into seven groups and carried out in triplicate: pHVP22/F, pHVP22/U, pHVP2 2 / D, pHVP22/M, pHBc, pcDNA3.1(-)� and MOCK transfection.
Confirmation of transgene expressionAfter transfection, cells were immediatel� washed with sterilized PBS (4 °C, pH 8.0)�, fixed in 20 g/L paraformaldeh�de and 1 g/L Triton X-100 diluted in PBS, and put on ice for 30 min. Cells were washed thrice with cold PBS. Non-specific epitopes were blocked with 10 g/L BSA for 10 min at 42 °C. After being washed with cold PBS, cells were incubated with mouse anti-HBc or c-m�c mAb (1:500)� for 15 min at 42 °C, further incubated with rabbit anti-mouse IgG labeled with FITC (1:1 000)�. The coverslides were mounted on slides using 50 mL/L glycerol/PBS and observed by fluorescence microscopy.
Antiviral activityFort�-eight hours after transfection, HBsAg concentration was determined b� RIA kit (completed b� Nuclear Medicine Department of Xijing Hospital)�, and HBV-DNA content was quantified b� FQ-PCR. The data obtained were anal�zed b� SPSS software.
MTT assayThe effect of transgene expression on host cells was evaluated b� MTT colorimetr�.
RESULTSPlasmid constructionTo enhance the antiviral effect of HBc DN mutant, both the full length of VP22 and the truncated version (102 bp upstream or downstream)� were fused to C terminals of HBc, respectivel� (pHVP22/F, pHVP22/U, pHVP22/D)�, and the effects of anti-HBV replication were detected. All plasmids used here were confirmed by sequencing, which was completed b� GeneCore Compan� (Shanghai, China)�.
Detection of transgene expression
VP22 ORF (902 bp)
Upsteam(102 bp) Downstream(102 bp)DSUS
k1
k1
k1
k1
k1
B1 B1
B1 B1
B1
B1
B1 X1
X1
X1
X1
B2
UR
pHVP22/D
pHVP22/M
pHVP22/U
pHVP22/F
pHBc
B1 X1
B1
c-myc
c-myc
c-myc
c-myc
DR
B2
HBc
HBc
HBc
HBc
HBc
Figure 1 Plasmid constructs used in the experiment. (Dotted lines represent the deleted sequences. The nomenclature of plasmids is listed in the right. The primers, US, UR, DS, and DR, are marked with arrows. Restriction enzymes are expressed in single letters. K1, KpnI; B1, BamHI; B2, BglII; X1, XhoI. Downstream sequence of 102 bp is the PTD of VP22).

Yi J et al. Dominant negative mutant inhibits HBV replication 6431
Figure 3 Comparison of HBsAg (A) and HBV-DNA (B) concentrations between transfection groups.
To identif� the expression of transgenes in HepG2.2.15 cells, indirect immunofluorescence was performed using antibod� against HBc or c-m�c. No fluorescence was found in pcDNA3.1(-)� and MOCK transfection, the same results were obtained in pHBc, pcDNA3.1(-)� and MOCK transfection. Strong fluorescence was detected in other transfections. The results suggested that transgenes were successfull� expressed in HepG2.2.15 cells and recognized b� the corresponding antibodies (Figure 2)�.
Antiviral effectTo investigate the antiviral activit� of VP22 fusion DN mutant on HBV replication, the inhibitor� effect was determined b� HBsAg concentration and HBV-DNA content in the supernatant of HepG2.2.15 cell culture. When compared to MOCK transfect ion, HBsAg concentrations in pHVP22/F, pHVP22/U, and pHVP22/D transfections decreased b� 81.94%, 38.88%, and 63.89%, respectivel� (Figure 3A, P<0.05)�, and HBV-DNA content b� 72.30%, 29.60%, 46.42%, respectivel� (Figure 3B, P<0.05)�, indicating that VP22 fusion DN mutant could inhibit HBV replication effectivel�. Regardless of taking HBsAg concentration or HBV-DNA content as an index, pHVP22/F, pHVP22/U, and
pHVP22/D showed a significant difference between the groups (P<0.05)�. DN mutant with transduction domains (pHVP22/F and pHVP22/D)� had a stronger antiviral activit� than that without the domain (pHVP22/U, P<0.05)�. When compared to DN mutant with full length of VP22 (pHVP22/F)�, DN mutant with the transduction domain (pHVP22/D)� showed a weaker antiviral activit� (P<0.05). There was no significant difference between DN mutant based on c-m�c epitope (pHVP22/M)� and MOCK transfection (P>0.05)�, suggesting that pHVP22/M could not inhibit HBV replication.
MTT assayAfter 48-h incubation, the morpholog� of cells was observed under inverted microscope and no discernable difference was found between groups. MTT assa� showed no significant differences between groups (P>0.05)�, suggesting that the expression of DN mutants had no effect on the growth of host cells (Table 1)�.
DISCUSSIONHBV infect ion i s an impor tant hea l th problem worldwide[14], and the investigation about HBV therap� is a long-standing focus. The development of genetic
A
HBV
-DN
A co
ncen
trat
ion
(¡Á1
06 co
py/m
L)
pHVP
22/F
pHVP
22/U
pHVP
22/M
pHVP
22/D
pHBc
pcDNA3
.1(-)
MOCK
9
8
7
6
5
4
3
2
1
0
Anti-HBc
Anti-myc
Figure 2 Confirmation of transgene expression in HepG2.2.15 cells.
GroupspH
VP22
/MpH
Bc
pcDNA3
.1(-)
MOCK
HBs
Ag c
once
ntra
tion
( μg/
L)
1
2
3
4
0
B
pHVP
22/F
pHVP
22/U
pHVP
22/D
Table1 MTT results of transfection groups (n=3, mean ±SD)
Group A490nm P1
pHVP22/F 0.425 ± 0.065 >0.05pHVP22/U 0.465 ± 0.050 >0.05 pHVP22/D 0.410 ± 0.075 >0.05 pHVP22/M 0.438 ± 0.042 >0.05 pHBc 0.413 ± 0.063 >0.05 pcDNA3.1(–) 0.430 ± 0.065 >0.05 MOCK 0.423 ± 0.058 >0.05
1vs mock.
pHVP22/F pHVP22/U pHVP22/D pHVP22/M pHBc pcDNA3.1(-) MOCK

engineering facilitates the role of gene therap� in anti-HBV therap�[13,14] and DN mutant is one of the important strategies[15-17]. After introduction of mutant gene into the infected cells, the activit� of wild-t�pe viral gene is inhibited b� the mutant version in a competitive manner, leading to the inhibition of virus replication[22,23]. DN mutant, as a preferential strateg�, takes protein as the effector and avoids the problem of HBV mutation, which is one of the obstacles when DNA is used as an effector. But insufficient therapeutic molecules can reach the VP22 protein, bearing protein-transduction abilit�, to enhance the DN mutant effect and complement the shortage of therapeutic molecules in target cells.
As a structural protein of HSV-1, VP22 (or its fusion protein)� has the strong abilit� to translocate between cells[18]. Proteins fused with the protein transduction domain (PTD)�, which lies in C terminal of VP22 (34 amino acids)�, also can translocate into the target cells[24-26]. In this report, HBsAg concentration decreased 63.89% b� PTD-HBc fusion based (pHVP22/D)� DN mutant, and DN mutant with upstream 34 amino acids of VP22 (pHVP22/U, without PTD)� onl� decreased 38.88%, suggesting that DN mutant with PTD can strongl� inhibit the activit� of wild-t�pe viral gene than that without PTD, and the transduction domain of VP22 can enhance the antiviral effect of DN mutant. B� detecting HBV-DNA concentrations in the supernatant, similar results could be obtained.
DN mutant based on full-length of VP22 (pHVP22/F)� decreased HBsAg concentration and HBV-DNA content b� 81.94% and 72.30%, respectivel� (Figures 3A and B)�, showing a significant difference compared to PTD-based DN mutant (pHVP22/D, P<0.05)�. Due to the different efficienc� between the two constructs, the molecular mass of the protein fused to HBc C-terminal is related to the inhibitor� effect of DN mutant. The larger the fused molecule, the stronger the antiviral effect of DN mutant. Possible explanations ma� be related to the stabilization of the larger fusion protein and the steric hindrance is necessar� to inhibit proper assembl� of the nucleocapsid.
In conclusion, DN mutant-based c-m�c epitope (pHVP22/M)� cannot inhibit HBV replication. Since c-m�c epitope has onl� 10 amino acids, DN mutant of HBc ma� mediate antiviral effect through a minimal length of C-terminal. The related experiments are in process.
REFERENCES1 FlemingJ. Current treatments for hepatitis. J Infus Nurs 2002;
25: 379-382 2 elSaadanyS, Tepper M, Mao Y, Semenciw R, Giulivi A. An
epidemiologic study of hepatocellular carcinoma in Canada. Can J Public Health 2002; 93: 443-446
3 MazumdarTN. Management of chronic hepatitis B infection: an update. J Indian Med Assoc 2001; 99: 306-308, 310
4 GanemD, Varmus HE. The molecular biology of the hepatitis B viruses. Annu Rev Biochem 1987; 56: 651-693
5 Tang ZY. Hepatocellular carcinoma--cause, treatment and metastasis. World J Gastroenterol 2001; 7: 445-454
6 Wai CT, Chu CJ, Hussain M, Lok AS. HBV genotype B is associated with better response to interferon therapy in HBeAg(+) chronic hepatitis than genotype C. Hepatology 2002; 36: 1425-1430
7 Manns MP. Current state of interferon therapy in the treatment of chronic hepatitis B. Semin Liver Dis 2002; 22 Suppl 1: 7-13
8 ShindoM,Hamada K, Koya S, Sokawa Y, Okuno T. The clinical significance of core promoter and precore mutations during the natural course and interferon therapy in patients with chronic hepatitis B. Am J Gastroenterol 1999; 94: 2237-2245
9 LiawYF. Therapy of chronic hepatitis B: current challenges and opportunities. J Viral Hepat 2002; 9: 393-399
10 Wolters LM, Hansen BE, Niesters HG, de Man RA. Viral dynamics in chronic hepatitis B patients treated with lamivudine, lamivudine-famciclovir or lamivudine-ganciclovir. Eur J Gastroenterol Hepatol 2002; 14: 1007-1011
11 Santantonio T, Mazzola M, Iacovazzi T, Miglietta A, Guastadisegni A, Pastore G. Long-term follow-up of patients with anti-HBe/HBV DNA-positive chronic hepatitis B treated for 12 months with lamivudine. J Hepatol 2000;32: 300-306
12 ChiouHC,Lucas MA, Coffin CC, Banaszczyk MG, Ill CR, Lollo CP. Gene therapy strategies for the treatment of chronic viral hepatitis. Expert Opin Biol Ther 2001; 1: 629-639
13 vonWeizsäckerF, Köck J, Wieland S, Offensperger WB, Blum HE. Dominant negative mutants of the duck hepatitis B virus core protein interfere with RNA pregenome packaging and viral DNA synthesis. Hepatology 1999; 30: 308-315
14 vonWeizsäcker F,Wieland S, Köck J, Offensperger WB, Offensperger S, Moradpour D, Blum HE. Gene therapy for chronic viral hepatitis: ribozymes, antisense oligonucleotides, and dominant negative mutants. Hepatology 1997; 26: 251-255
15 ScaglioniP, Melegari M, Takahashi M, Chowdhury JR, Wands J. Use of dominant negative mutants of the hepadnaviral core protein as antiviral agents. Hepatology 1996; 24: 1010-1017
16 von Weizsäcker F, Wieland S, Blum HE. Inhibition of viral replication by genetically engineered mutants of the duck hepatitis B virus core protein. Hepatology 1996; 24: 294-299
17 Scaglioni PP, Melegari M, Wands JR. Characterization of hepatitis B virus core mutants that inhibit viral replication. Virology 1994; 205: 112-120
18 ElliottG, O’Hare P. Intercellular trafficking and protein deliv-ery by a herpesvirus structural protein. Cell 1997; 88: 223-233 223-233223-233
19 Sells MA, Chen ML, Acs G. Production of hepatitis B virus particles in Hep G2 cells transfected with cloned hepatitis B virus DNA. Proc Natl Acad Sci U S A 1987; 84: 1005-1009
20 Acs G, Sells MA, Purcell RH, Price P, Engle R, Shapiro M, Popper H. Hepatitis B virus produced by transfected Hep G2 cells causes hepatitis in chimpanzees. Proc Natl Acad Sci U S A 1987; 84: 4641-4644
21 Sells MA, Zelent AZ, Shvartsman M, Acs G. Replicative intermediates of hepatitis B virus in HepG2 cells that produce infectious virions. J Virol 1988; 62: 2836-2844
22 Trono D, Feinberg MB, Baltimore D. HIV-1 Gag mutants can dominantly interfere with the replication of the wild-type virus. Cell 1989; 59: 113-120
23 MalimMH, Freimuth WW, Liu J, Boyle TJ, Lyerly HK, Cullen BR, Nabel GJ. Stable expression of transdominant Rev protein in human T cells inhibits human immunodeficiency virus replication. J Exp Med 1992; 176: 1197-1201
24 Elliott G, O’Hare P. Intercellular trafficking of VP22-GFP fusion proteins. Gene Ther 1999; 6: 149-151
25 AintsA, Güven H, Gahrton G, Smith CI, Dilber MS. Mapping of herpes simplex virus-1 VP22 functional domains for inter- and subcellular protein targeting. Gene Ther 2001; 8: 1051-1056
26 Schwarze SR, Dowdy SF. In vivo protein transduction: intracellular delivery of biologically active proteins, compounds and DNA. Trends Pharmacol Sci 2000; 21: 45-48
6432 ISSN 1007-9327 CN 14-1219/ R World J Gastroenterol November 7, 2005 Volume 11 Number 41
ScienceEditor Guo SY LanguageEditor Elsevier HK

• VIRAL HEPATITIS •
Hepatitis C virus non-structural 5A protein can enhance
full-length core protein-induced nuclear factor- B activation
Qing-Jiao Liao, Lin-Bai Ye, Khalid Amine Timani, Ying-Long She, Xiao-Jun Yang, Li Ye, Zheng-Hui Wu
EL SEVIER
PO Box 2345, Beijing 100023, China World J Gastroenterol 2005;11(41):6433-6439
www.wjgnet.com World Journal of Gastroenterology ISSN 1007-9327
[email protected] © 2005 The WJG Press and Elsevier Inc. All rights reserved.
Qing-Jiao Liao, Lin-Bai Ye, Khalid Amine Timani, Ying-LongShe, Xiao-Jun Yang, Li Ye, Zheng-Hui Wu, State KeyLaboratory of Virology, College of Life Sciences, Wuhan University,Wuhan 430072, Hubei Province, ChinaSupported by the Ph D Program Foundation of Ministry ofEducation of China, No. 20010486015Correspondence to: Lin-Bai Ye, Dr., Professor, State KeyLaboratory of Virology, College of Life Science, Wuhan University,Wuhan 430072, Hubei Province, China. [email protected]: +86-27-68752372 Fax: +86-27-68752372Received: 2005-03-13 Accepted: 2005-04-30
AbstractAIM: To study the effects of hepatitis C virus (HCV) coreand non-structural 5A (NS5A) proteins on nuclear factor-B (NF- B) activity for understanding their biological
function on chronic hepatitis caused by HCV infection.
METHODS: Luciferase assay was used to measure theactivity of NF- B in three different cell lines cotransfectedwith a series of deletion mutants of core protein alone ortogether with NS5A protein using pNF- B-Luc as a reporterplasmid. Western blot and indirect immunofluorescenceassays were used to confirm the expression of proteinsand to detect their subcellular localization, respectively.Furthermore, Western blot was also used to detect theexpression levels of NF- B/p65, NF- B/p50, and inhibitorB-a (I B-a).
RESULTS: The wild-type core protein (C191) and itsmutant segments (C173 and C158) could activate NF- Bin Huh7 cells only and activation caused by (C191) couldbe enhanced by NS5A protein. Moreover, the full-lengthcore protein and its different deletion mutants alone ortogether with NS5A protein did not enhance the expressionlevel of NF- B. The NF- B activity was augmented due tothe dissociation of NF- B-I B complex and the degradationof I B-a.
CONCLUSION:NF- B is the key transcription factor thatcan activate many genes that are involved in the cellularimmune response and inflammation. Coexpression of thefull-length core protein along with NS5A can enhance theNF- B activation, and this activation may play a significantrole in chronic liver diseases including hepatocellularcarcinoma associated with HCV infection.
© 2005 The WJG Press and Elsevier Inc. All rights reserved.
Key words: HCV; NS5A; Core protein; NF- B
Liao QJ, Ye LB, Timani KA, She YL, Yang XJ, Ye L, Wu ZH.Hepatitis C virus non-structural 5A protein can enhancefull- length core protein-induced nuclear factor- Bactivation. World J Gastroenterol 2005; 11(41):6433-6439http://www.wjgnet.com/1007-9327/11/6433.asp
INTRODUCTIONHepatitis C virus (HCV) is a major causative agent for acuteand chronic hepatitis, which often leads to liver cirrhosisand hepatocellular carcinoma[1,2]. HCV is an envelopedpositive-sense RNA virus of the Flaviviridae family. The viralgenome encodes a single polyprotein precursor of ~3 010amino acids, which is cleaved by both host and viralproteases to produce three structural proteins at the aminoterminus (Core, E1, and E2) and six nonstructural proteinsat the carboxyl terminus (NS2, NS3, NS4A, NS4B, non-structural 5A (NS5A), and NS5B)[3-5]. HCV core protein is the viral nucleocapsid protein thatbinds to and packages the viral RNA genome. Core proteinis a multifunctional protein that can interact with manycellular factors such as lymphotoxin- receptor, tumornecrosis factor receptor (TNFR), heterogeneous nuclearribonucleoprotein and LZIP[6-10]. Core protein also canmodulate the expression of some genes like interleukin-2(IL-2), p53 and p21[11-14]. NS5A protein is a phosphoproteinthat exists in differentially phosphorylated forms of 56 and58 ku with modifications of serine residues[15]. NS5A proteincan directly interact with double-stranded RNA-dependentkinase and inactivate its function, thus modulating the IFN-stimulated antiviral response[16].
Nuclear factor- B (NF- B) belongs to a highly
conserved Rel-related protein family, which includes RelA(p65), Rel B, c-Rel, NF- B1 (p105/p50), and NF- B2(p100/p52). Of these, the p50/p65 heterodimer, commonlycalled NF- B, is the most abundant and ubiquitous. NF-B is the key transcription factor activating many genesinvolved in the cellular immune responses and inflammation,such as interferon-β, TNF- , IL-2, IL-6, and IL-8[17]. Many researchers have reported that HCV core proteincan modulate the activity of NF- B in mammalian cells[18-21].This phenomenon has also been found in NS5A protein[22-24].Core protein can interact with NS5A protein both in vitroand in vivo[25]. However, whether this interaction has effecton NF- B activation has not yet been determined. In thisstudy, we investigated the effect of core protein and NS5Aprotein coexpression on NF- B activity in three differentcell lines. Our results showed that NS5A protein could

enhance the effect of full-length core protein onNF- B activation in Huh7 cell line only. This activation isassociated with the degradation of inhibitor B- (I B- ).
MATERIALS AND METHODSPlasmid constructionThe recombinant plasmids with different deletion mutationsof HCV core or NS5A genes were constructed by insertingthe corresponding DNA fragments into the eukaryoticexpression vector pcDNA3 under the immediate early CMVpromoter. The DNA fragments were amplified by PCRfrom pBRTM/HCV1-3011 plasmid (genotype 1a, agenerous gift from Dr. Charles M Rice, University ofWashington) using primers in Table 1. Primers 1a and 1bwere used to generate pcDNA-core (for C191) containingthe full-length core protein, 1a and 1c primers were used togenerate pcDNA- core519 (for C173) with a deletion of54 nt at its 3 -end, 1a and 1d primers were used to generatepcDNA- core474 (for C158) with a deletion of 99 nt at its3 -end, 2a and 1b primers were used to generate pcDNA-
core [76-573, for C(26-191)] with a deletion of 75 nt atits 3 -end, 2a and 1d primers were used to generate pcDNA-
core [76-474, for C(26-158)] with a 75 and 99 nt deletionat the 5 -end and 3 -end, respectively, 3a and 3b primerswere used for pcNS5A with full-length 5A gene. All theconstructed plasmids were confirmed by restricted digestion
and sequencing. pcNS5A; (2) 0.4 g pNF- B-Luc and the sameconcentration of core mutations (0.2 g) and pcNS5A(0.2 g) ; (3) 0 .3 g pNF- B-Luc and the sameconcentration of pcDNA-core (0.2 g) and differentconcentrations (0.1, 0.2, and 0.3 g) of pcNS5A; (4) 0.3 g pNF- B-Luc and the same concentration ofpcNS5A (0.2 g) and different concentrations (0.1, 0.2,and 0.3 g) of pcDNA-core. Cells were cotransfectedwith pNF- B-Luc and vector pcDNA3 as a negativecontrol. The total concentration of the transfectedplasmids was kept constant with pcDNA3 vector. Cellswere harvested at 24 h after transfection and then lysedin the reporter lysis buffer (Promega). The luciferaseactivity was measured by TD-20/20 luminometer (TurnerBioSystems, Sunnyvale, CA, USA), and normalized withrespect to the protein concentration of the cell lysates.Each experiment was repeated at least thrice.
Western blot analysisTwenty-four hours after transfection, the total cell proteinswere separated by 15% SDS-polyacrylamide gelelectrophoresis (SDS-PAGE) and transferred to apolyvinylidene difluoride membrane. The blots were firstblocked with 5% non-fat milk in Tris buffer saline (TBS)containing 1 g/L Tween-20 and then probed with the firstantibodies against HCV core protein (ViroStat, Inc., 1851),HCV NS5A protein (a generous gift from Dr. Stephene JPolyak, University of Washington), actin (Santa CruzBiotechnology, Inc., sc-1616), NF- B/P65 (Santa CruzBiotechnology, Inc., sc-800), NF- B/P50 (Santa CruzBiotechnolog y, Inc., sc-114) , I B- (Santa CruzBiotechnology, Inc., sc-847) for 1 h at 37 °C After extensivewashes, secondary antibodies conjugated with horseradishperoxidase were applied onto the blots for at least 1 h at37 °C. Blots were washed five times with TBS-1 g/LTween-20. Reagents for enhanced chemiluminescence wereapplied to the blots and the light signals were detected byX-ray film.
Indirect immunofluorescence assaySterile coverslips were placed in six-well tissue culture platesbefore the Cos-7 cells were plated on them. Twenty-fourhours after transfection, the coverslips were rinsed twice withPBS, and the cells were fixed in methanol-acetone (1:1) at-20 °C for 5 min. After washing thrice with PBS, the fixedcells were covered with anti-core monoclonal or anti-NS5AmAbs for 1 h at 37 °C, and then washed thrice with PBS.Secondary antibodies (FITC-conjugated goat anti-mouseIgG) were then applied on the cells for 1 h at 37 °C in thedark. After washing, the cells were stained with propidiumiodide to visualize the nuclear DNA and mounted in antifademounting medium. The stained cells were visualized undera Leica confocal microscope (TCS NT SN 1500001, LeicaLaser Technik, Germany). For the colocalization of full-length core and NS5A proteins, rabbit anti-core polyclonalantibody (produced in our laboratory) and mouse NS5AmAb were used as primary antibodies and TRITC-conjugatedgoat anti-rabbit IgG and FITC-conjugated goat anti-mouseIgG were used as secondary antibodies, respectively.
Cell culture and transfectionCos-7, HeLa, and Huh7 cell lines were grown in Dulbecco’smodified Eagle’s medium (Hyclone) with 10% fetal bovineserum (Gibco) at 37 °C in 50 mL/L CO2. DNA transfectionexperiment was performed using LipofectamineTM 2000(Gibco) according to the manufacturer’s instructions.
Luciferase assayThe pNF- B-Luc (Stratagene) vector containing the Photinuspyralis (firefly) luciferase reporter gene driven by a basicpromoter element (TATA box) plus five repeats of B cis-enhancer element (TGGGGACTTTCCGC) was used inthis experiment. Approximately 5 104 cells were seeded intoa 24-well tissue culture plate 24 h before transfection. Thecells were cotransfected with 0.8 µg plasmids as four kindsof combination: (1) 0.4 g pNF- B-Luc and differentconcentrations (0.1, 0.2, and 0.4 g) of core mutations or
Table 1 Primers used in this study
Italic nucleotides represent the enzymes used for the ligation and the enzymes are
also marked in the end of each primer. Bold nucleotides ATG and CTA represent
the start and stop codon, respectively.
Primers Oligonucleotides
1a 5’-AAG CTT GAATTC GCG ATG AGC ACG AAT CCT-3’ (EcoRI)
1b 5’-GTC GAC TCTAGA CTA GGC CGA AGC GGG CAC-3’ (XbaI)
1c 5’-GTC GAC TCTAGA CTA AGA GCA ACC AGG AAG-3’ (XbaI)
1d 5’-GTC GAC TCTAGA CTA CAG AAC CCG GAC GCC-3’ (XbaI)
2a 5’-AGT ACT GAATTC GCG ATG GGT GGC GGT CAG-3’ (EcoRI)
3a 5’-AGA TCT AAGCTT ATG GCT TCC GGC TCC TGG-3’ (HindIII)
3b 5’-TGG TAC TCTAGA TCA CAT TCA GCA GCA-3’ (XbaI)
6434 ISSN 1007-9327 CN 14-1219/ R World J Gastroenterol November 7, 2005 Volume 11 Number 41

RESULTSIdentification of core mutants and NS5A protein
In this study, four core deletion mutants (C173, C158, C(26-191), C(26-158) were constructed besides the wild-typecore protein (C191). C173 is the mature form of coreprotein with deletion of 18aa at its C-terminus. C158 is amutant fragment with deletion of the hydrophobic aminoacids at its C-terminus. C(26-191) is a mutant fragmentwithout the reported functional domain at its N-terminus.C(26-158) is a mutant fragment without functional andhydrophobic domains at its N- and C-terminus, respectively.The expression of core mutants and NS5A protein in Huh7was measured by Western blot. As shown in Figure 1A,core mutant fragments were expressed with a correctmolecule mass of 21 ku for C191, 19 ku for C173, 18 kufor C158, 18 ku for C(26-191) and 15 ku for C(26-158) in
the cells transfected with either core mutation fragmentsalone (lanes 1, 3, 5, 7, and 9) or together with NS5A protein(lanes 2, 4, 6, 8, and 10). The expression of NS5A proteinis shown in Figure 1B. We got the correct band of 56 ku inthe cells transfected with NS5A protein alone (lane 1) ortogether with core mutations (lanes 2-6). This experimentshowed that core mutants and NS5A protein were expressedsuccessfully from their respective recombinant plasmids.
HCV core protein activated NF- B and was enhanced by NS5Aprotein in Huh7 cellsTo study the effect of the coexpression of HCV core andNS5A proteins on NF- B activity, the expressed plasmids,pcDNA-core, pcDNA- core519, pcDNA- core474,pcDNA- core (75-573), pCDNA- core (75-474), alone ortogether with pcNS5A were cotransfected with pNF- B-Luc into three different cell lines Cos-7, HeLa, and Huh7.Luciferase activity was measured 24-h post-transfection. Ourresults showed a significant change of relative luciferaseactivity in Huh7 cells (Figure 2A) but not in Cos-7 cells(Figure 2B) or HeLa cells (Figure 2C). In Huh7 cells, theexpression of C191 resulted in a significant increase in theNF- B activity (sevenfold) compared to control cellstransfected with vector alone. Expression of C173 and C158also resulted in an increase in NF- B activity with aboutsix- and fourfold, respectively, compared to control.Furthermore, the luciferase activity was increased in a dose-dependent manner in core-expressing cells. In contrast, therewas no significant change in the relative luciferase activityin the cells transfected with pcDNA- core (75-573) orpcDNA- core (75-474), in which core proteins had 25amino acids deleted at the N-terminus. This suggested thatthe N-terminal region (1-25 aa) of core protein is importantfor its activation on NF- B, which is consistent with theprevious report[20]. The different augmentation of luciferaseactivity caused by C191, C173, and C158 suggested that
Figure 1 Expression of core mutant fragments (A) and NS5A protein (B).
20 ku
C191
C191+
NS5A
C173
C173+
NS5A
C158
C158+
NS5A
C(2
6-1
91)
C(2
6-1
91)+
NS5A
C(2
6-1
58)
C(2
6-1
58)+
NS5A
contr
ol
NS5A
NS5A
NS5A
+C
191
NS5A
+C
173
NS5A
+C
158
NS5A
+C
(26-1
91)
NS5A
+C
(26-1
58)
contr
ol
1 2 3 4 5 6 7 8 9 10 11
1 2 3 4 5 6 7
NS5A
A
B
Figure 2 Effect of HCV core and NS5A proteins on NF- B activity. A: NF- B activation capacity of the core mutant fragments and NS5A protein individuallyexpressing in Huh7 cell line; B: NF- B activation capacity of the core mutants and NS5A protein expressing in Huh7 cells, C: Cos-7 cells; D: HeLa cells.
Vector/NS5A C191 C173 C158 C(26-191) C(26-158)Vector/NS5A C191 C173 C158 C(26-191) C(26-158)
Core mutants Core mutants+NS5A
Vector C191 C173 C158 C(26-191) C(26-158)
9
8
7
6
5
4
3
2
1
0
18
16
14
12
10
8
6
4
2
0
A Huh7 B Huh7
0.1 g 0.2 g 0.4 g
Rela
tive
Luci
fera
se A
ctivi
tyRela
tive
Luci
fera
se A
ctivi
ty
Rela
tive
Luci
fera
se A
ctivi
tyRela
tive
Luci
fera
se A
ctivi
ty
Vector C191 C173 C158 C(26-191) C(26-158) NS5A
2.5
2
1.5
1
0.5
0
3
2.5
2
1.5
1
0.5
0
C cos7 D HaLa Core mutants Core mutants+NS5ACore mutants Core mutants+NS5A
Liao QJ et al. NS5A enhances core protein-induced NF- B activation 6435

the activation of NF- B by core protein was related to thehydrophobicity of C-terminus of core proteins (C191>C173>C158). When NS5A protein was expressed alone, it had no effecton NF- B activation (Figure 2A). But co-expression ofC191 and NS5A protein resulted in a significant increase inthe luciferase activity with about 15-fold compared to thecontrol and twofold compared to the C191-expressing cellsonly. However, the relative luciferase activity in the cellsco-expressing NS5A protein and other core mutants wasnot augmented (Figure 2B). These results indicated thatNS5A protein could enhance C191-induced NF- Bactivation.
NS5A protein enhanced core protein-induced NF-¦ÊB activationin a dose-dependent mannerIn order to understand, how NS5A protein affects the NF-
B activation caused by C191 core protein, we designedtwo kinds of combination between pcNS5A and pcDNA-core expression vectors for luciferase assay. In the firstone, 0.2 µg of pcNS5A vector was co-transfected withdifferent concentrations of pcDNA-core (0.1, 0.2, and 0.3µg), while in the other combination, 0.2 µg of pcDNA-corewas co-transfected with different concentrations of pcNS5A(0.1, 0.2, and 0.3 µg). Result is shown in Figure 3. WhenpcNS5A transfection was certain, more pcDNA-core wastransfected, the higher luciferase activity could be detected,while the enhanced increasing of activity in number wasalmost the same (ninefold) compared to cells expressingC191 alone (Figure 3, right), which meant that the sameamount of NS5A protein exerted the same effect ondifferent amounts of C191. When pcDNA-coretransfection was certain, more pcNS5A was transfected,higher enhanced increasing of luciferase activity could bedetected (Figure 3, left). These results showed that NS5Aprotein could enhance core protein-induced NF- Bactivation in a dose-dependent manner.
Activation of NF- B by core protein and NS5A was associatedwith I B degradationWe further studied whether NF- B activation occurred at
translational or post-translational levels. To do this, theexpression levels of NF- B/p65, NF- B/p50, and I B-in C191-expressing Huh7 cells either alone or together withNS5A were studied. As shown in Figure 4, at the sameconcentration of cell lysates as confirmed by actin (Figure4D), there was no change in the p65 and p50 expressionprofile (Figures 4A and B). While in case of the I B- , theexpression level was contrary to the NF- B activity. In thecontrol, cells transfected with pCDNA3 vector had thehighest expression level of I B- (Figure 4C, lane 1), whilein the cells co-expressing C191 and NS5A with the highestNF- B activity had the lowest expression of I B-a (Figure4C, lane 3). Cells expressing C191 also had a much lowerexpression of I B- (Figure 4C, lane 4), while cellsexpressing NS5A protein had a much higher expression ofI B- (Figure 4C, lane 2). It was more likely that whenC191 and NS5A protein were co-expressed, they activatedI B kinase (IKK) through some signal pathway, resulted inthe phosphorylation and then degradation of I B, leadingto the activation of NF- B. These results suggested thatC191 alone or together with NS5A protein did not enhancethe expression of NF- B. Thus, the NF- B activity wasaugmented due to the dissociation of NF- B¨CI B complexand I B degradation.
Subcellular localization of C191 and NS5A proteins in Cos-7cell lineWe then analyzed the subcellular localization of C191 andNS5A proteins using indirect immunofluorescence assay inCos-7 cell line. As shown in Figure 5, C191 was localizedpredominantly in the cytoplasm (Figures 5A-C). NS5Aprotein was also localized in the cytoplasm with fluorescencesignals surrounded the nuclear membrane (Figures 5D-F).On the other hand, the co-expression of C191 and NS5Aproteins did not alter the localization of C191, butredistributed the NS5A protein to the same localizationpattern of C191 (Figures 5G-I). All these results areconsistent with previous reports[25-27]. Thus, the same
Figure 4 Expression of NF- B/p65, NF- B/p50 and IkB-a.
Control NS5A NS5A+C191 C191
1 2 3 4
A
B
C
D
Figure 3 Enhancement of core protein-induced NF-kB activation in a NS5A
protein dose-dependent manner.
pc DNAcore - 0.2 0.2 0.2 0.2 - - 0.1 0.2 0.3
pc NS5A - - 0.1 0.2 0.3 - 0.2 0.2 0.2 0.2 (μg)
pc DNA3 0.5 0.2 0.2 0.1 - 0.5 0.3 0.2 0.1 -
6436 ISSN 1007-9327 CN 14-1219/ R World J Gastroenterol November 7, 2005 Volume 11 Number 41Rela
tive
Lu
cife
rase
Act
ivity
25
20
15
10
5
0
NF- B/p65
NF- B/p50
ikb-a
Actin

cytoplasmic localization pattern of C191 and NS5A proteinsuggested that NF- B activation caused by co-expressionof C191 and NS5A protein was more likely due to a physicalinteraction between them or the interaction with the samecellular factors.
DISCUSSIONNF-kB is a critical regulator of the immediate early pathogenresponse, and plays an important role in promotinginflammation and in regulation of cell proliferation andsurvival[17,28]. NF- B is highly activated at sites ofinflammation in diverse diseases and induces transcriptionof pro-inflammatory cytokines, chemokines, adhesionmolecules, matrix metalloproteinases, cyclooxygenase 2, andinducible nitric oxide synthase[29]. Moreover, NF- B canalso activate the expression of cyclin D1, c-myc, otherregulators of the cell cycle and enhance cell survival byswitching on genes that inhibit pro-apoptotic signals[30].Because of the multifunction of NF- B, many virusesincluding several human pathogens such as HIV-1, humanT-cell leukemia virus, herpes simplex virus, HBV, andEpstein-Barr virus have evolved different strategies tomodulate the activity of NF- B[31-34]. Some of themmodulate the NF- B activity through the binding of theviral particles to their receptor, some of them modulatethrough viral proteins. The activation of NF- B may be astrategy of viruses to block apoptosis and prolong survivalof the host cells in order to gain time for replication and
increase viral progeny production[35]. Since HCV core protein can interact with TNF- byyeast two-hybrid system[8], NF- B, the main effective factorin the TNF- signaling pathway, has become a hot factor inthe functional studies of core protein. Core protein canmodulate NF- B at the basal level in many mammalian celllines, although the modulation is different from HCVgenotype and cell lines[19-21]. In this study, we found that core protein could increasethe activity of NF- B only in Huh7 cell line, but not inCos-7 and HeLa cell lines. This augmentation was in a coreprotein dose-dependent manner. Core protein can interactwith NS5A protein both in vitro and in vivo[25]. NS5A proteincan also modulate the activity of NF- B[23]. Since thismodulation is also different from different cell lines[36], wewant to know if this interaction between core and NS5Aproteins has certain effect on the regulation of NF- B.Our results showed that when C191 and NS5A proteinswere co-expressed in Huh7 cell line, they activated NF- Band this activation was in a NS5A protein dose-dependentmanner. Moreover, the full-length core protein was requiredfor the interaction between core and NS5A proteins, becauseno increase in the NF- B activity was observed in the cellsco-expressing any of the core mutant fragments and NS5Aprotein. Further experiments have confirmed that thisactivation is associated with the NF- B-I B complexdissociation and I B degradation but not with the changein the expression level of NF- B. There are two signaling pathways leading to NF- Bactivation. The classical NF- B pathway, based on IKK- -dependent I B degradation, is essential for innate immunity.The alternative NF- B pathway, based on IKK- processingof NF- B2/p100 into NF- B2/p50, is related to lymphoidorgan development and adaptive immunity[29]. The activationof NF- B caused by co-expression of core and NS5Aproteins may occur in the classical NF- B pathway.Proinflammatory cytokines and pathogen-associatedmolecular patterns, working through different receptorsbelonging to the TNFR and Toll-like receptor-IL-1 receptorsuperfamilies, cause activation of IKK. The activated IKKs,predominantly acting through IKK- in an IKK- -dependentmanner , cat a lyze the phosphoryl at ion of I Bs ,polyubiquitination and subsequent degradation by the 26Sproteasome[29]. As previously reported, core protein canactivate NF- B through TNF receptor-associated factor2-IKK- -dependent pathway[37]. The phosphorylation of I
B- by IKK- can be significantly enhanced by HCV coreprotein expression in a dose-dependent manner. NS5Aprotein can activate NF- B by altering intracellular calciumlevels and then inducing oxidative stress, through tyrosinephosphorylation of I B- at Tyr42 and Tyr305 residues insteadof Ser32,36 phosphorylation of I B- caused by IKK, thusinducing I B- degradation[24]. We found that expressionof core protein could activate NF- B, while this did nothappen in case of NS5A protein expression in Huh7 cells.These results of NS5A protein are consistent with onereport[38] but inconsistent with other reports[22,24]. This maybe due to the different cell lines and/or experimentalmethods used in their studies. Interestingly, co-expressionof C191 and NS5A proteins activated NF- B significantly.
Figure 5 Localization of C191 and NS5A proteins. A-C: C191; D-F: NS5Aprotein; G: NS5A protein (FITC-labeled); H: C191 protein (TRITC-labeled); I:
merged localization of C191 and NS5A proteins; J-L: pcDNA3 vector alone as
a negative control.
FITC PI ME RGED
Liao QJ et al. NS5A enhances core protein-induced NF- B activation 6437
C191
NS5A
C191+
NS5A
Control
A B C
D E F
G H I
J K L

When NS5A and C191 proteins were co-expressed, thisinteraction caused the change in the conformation of NS5Aprotein, which leads to the tyrosine phosphorylation of IB- , and resulted in core protein-induced NF- B activation.Further experiments need to be done to elucidate this idea. HCV causes persistent infection and chronic hepatitisin most infected individuals. Spontaneous recoveryfollowing HCV infection is a relatively rare event. Themechanisms responsible for HCV-mediated chronicity anddisease progression remain unclear[39]. The activation ofNF- B has been found in both subgenomic replicon andfull-length HCV-transfected cells and HCV-infected livers[24,36,39]. This may provide the possible mechanism for HCVpathogenesis. C191 is produced in the early stage of HCV infectionand then cleavaged to its mature form C173 to assist virusassembly[40]. In this study, we found that NS5A protein couldenhance C191-induced NF- B activation but not C173,when NS5A and core proteins were co-expressed in Huh7cells. Activation of NF- B always leads to inhibition ofapoptosis. In the early stage of HCV infection, NS5Aprotein functions synergically with C191 on NF- Bactivation and this may inhibit apoptosis of host cells; whilein late stage of HCV infection, NS5A protein does notfunction synergically with C173 on NF- B activation anddecreases their ability to inhibit apoptosis of host cells. Thismay play an important role in the establishment of chronicand persistent liver disease during HCV infection.
ACKNOWLEDGMENTSThe authors thank Dr. Charles M Rice (University ofWashington) for providing pBRTM/HCV1-3011 and Dr.Stephene J Polyak (University of Washington) for provid-ing HCV NS5A mAb. The authors thank Jingrong Gaoand Changlu Liu for helpful suggestions, and also thankWei Peng for his technical help in confocal microscopy.
REFERENCES1 Farci P, Choo QL, Kuo G, Weiner AJ, Overby LR, Bradley
DW, Houghton M. Isolation of a cDNA clone derived from ablood-borne non-A, non-B viral hepatitis genome. Science 1989;
244: 359-362
2 Saito I, Miyamura T, Ohbayashi A, Harada H, Katayama T,Kikuchi S, Watanabe Y, Koi S, Onji M, Ohta Y, Hepatitis C
virus infection is associated with the development of
hepatocellular carcinoma. Proc Natl Acad Sci U S A 1990; 87:6547-6549
3 Hij ika ta M , Kat o N, Oot suyama Y , Nakaga wa M,
Shimotohno K. Gene mapping of the putative structural regionof the hepatitis C virus genome by in vitro processing analysis.
Proc Natl Acad Sci U S A 1991; 88: 5547-5551
4 Grakoui A, Wychowski C, Lin C, Feinstone SM, Rice CM.Expression and identification of hepatitis C virus polyprotein
cleavage products. J Virol 1993; 67: 1385-1395
5 Manabe S, Fuke I, Tanishita O, Kaji C, Gomi Y, Yoshida S,Mori C, Takamizawa A, Yosida I, Okayama H. Production
of nonstructural proteins of hepatitis C virus requires a
putative viral protease encoded by NS3. Virology 1994; 198:636-644
6 Matsumoto M, Hsieh TY, Zhu N, VanArsdale T, Hwang SB,
Jeng KS, Gorbalenya AE, Lo SY, Ou JH, Ware CF, Lai MM.Hepatitis C virus core protein interacts with the cytoplasmic
tail of lymphotoxin-beta receptor. J Virol 1997; 71: 1301-1309
7 Chen CM, You LR, Hwang LH, Lee YH. Direct interaction ofhepatitis C virus core protein with the cellular lymphotoxin-
beta recept or modulates t he signal pat hway of the
lymphotoxin-beta receptor. J Virol 1997; 71: 9417-94268 Zhu N, Khoshnan A, Schneider R, Matsumoto M, Dennert G,
Ware C, Lai MM. Hepatitis C virus core protein binds to the
cytoplasmic domain of tumor necrosis factor (TNF) receptor1 and enhances TNF-induced apoptosis. J Virol 1998; 72 :
3691-3697
9 Hsieh TY, Matsumoto M, Chou HC, Schneider R, Hwang SB,Lee AS, Lai MM. Hepatitis C virus core protein interacts with
heterogeneous nuclear ribonucleoprotein K. J Biol Chem 1998;
273: 17651-176591 0 Jin DY, Wang HL, Zhou Y, Chun AC, Kibler KV, Hou YD,
Kung H, Jeang KT. Hepatitis C virus core protein-induced
loss of LZIP function correlates with cellular transformation.EMBO J 2000; 19: 729-740
1 1 Bergqvist A, Rice CM. Transcriptional activation of the
interleukin-2 promoter by hepatitis C virus core protein. JVirol 2001; 75: 772-781
1 2 Ray RB, Steele R, Meyer K, Ray R. Transcriptional repression
of p53 promoter by hepatitis C virus core protein. J Biol Chem1997 ; 272: 10983-10986
1 3 Jung EY, Lee MN, Yang HY, Yu D, Jang KL. The repressive
activity of hepatitis C virus core protein on the transcriptionof p21(waf1) is regulated by protein kinase A-mediated
phosphorylation. Virus Res 2001; 79: 109-115
1 4 Yoshida I, Oka K, Hidajat R, Nagano-Fujii M, Ishido S, HottaH. Inhibition of p21/Waf1/Cip1/Sdi1 expression by hepatitis
C virus core protein. Microbiol Immunol 2001; 45: 689-697
1 5 Hirota M, Satoh S, Asabe S, Kohara M, Tsukiyama-Kohara
K, Kato N, Hijikata M, Shimotohno K. Phosphorylation of
nonstructural 5A protein of hepatitis C virus: HCV group-
specific hyperphosphorylation. Virology 1999; 257: 130-137
1 6 Gale MJ, Korth MJ, Tang NM, Tan SL, Hopkins DA, Dever
TE, Polyak SJ, Gretch DR, Katze MG. Evidence that hepatitis
C virus resistance to interferon is mediated through repression
of the PKR protein kinase by the nonstructural 5A protein.
Virology 1997; 230: 217-227
1 7 Li Q, Verma IM. NF-kappaB regulation in the immune system.
Nat Rev Immunol 2002; 2: 725-734
1 8 Shrivastava A, Manna SK, Ray R, Aggarwal BB. Ectopic
expression of hepatitis C virus core protein differentially
regulates nuclear transcription factors. J Virol 1998; 72: 9722-
9728
1 9 Marusawa H, Hijikata M, Chiba T, Shimotohno K. Hepatitis
C virus core protein inhibits Fas- and tumor necrosis factor
alpha-mediated apoptosis via NF-kappaB activation. J Virol
1999; 73 : 4713-4720
2 0 Watashi K, Hijikata M, Marusawa H, Doi T, Shimotohno K.
Cytoplasmic localization is important for transcription factor
nuclear factor-kappa B activation by hepatitis C virus core
protein through its amino terminal region. Virology 2001; 286:
391-402
2 1 Ray RB, Steele R, Basu A, Meyer K, Majumder M, Ghosh AK,
Ray R. Distinct functional role of Hepatitis C virus core protein
on NF- appaB regulation is linked to genomic variation.
Virus Res 2002; 87: 21-29
2 2 Gong G, Waris G, Tanveer R, Siddiqui A. Human hepatitis C
virus NS5A protein alters intracellular calcium levels, induces
oxidative stress, and activates STAT-3 and NF-kappa B. Proc
Natl Acad Sci U S A 2001; 98: 9599-9604
2 3 Park KJ, Choi SH, Lee SY, Hwang SB, Lai MM. Nonstructural
5A protein of hepatitis C virus modulates tumor necrosis
factor alpha-stimulated nuclear factor kappa B activation. J
Biol Chem 2002; 277: 13122-13128
2 4 Waris G, Livolsi A, Imbert V, Peyron JF, Siddiqui A. Hepatitis
C virus NS5A and subgenomic replicon activate NF- appaB
via tyrosine phosphorylation of IkappaBalpha and i ts
degradation by calpain protease. J Biol Chem 2003; 278: 40778-
40787
6438 ISSN 1007-9327 CN 14-1219/ R World J Gastroenterol November 7, 2005 Volume 11 Number 41

2 5 Goh PY, Tan YJ, Lim SP, Lim SG, Tan YH, Hong WJ. The
hepatitis C virus core protein interacts with NS5A and activates
its caspase-mediated proteolytic cleavage. Virology 2001; 290:
224-236
2 6 Ide Y, Zhang L, Chen M, Inchauspe G, Bahl C, Sasaguri Y,Padmanabhan R. Characterization of the nuclear localization
signal and subcellular distribution of hepatitis C virus
nonstructural protein NS5A. Gene 1996; 182: 203-2112 7 Polyak SJ, Paschal DM, McArdle S, Gale MJ, Moradpour D,
Gretch DR. Characterization of the effects of hepatitis C virus
nonstructural 5A protein expression in human cell lines andon interferon-sensitive virus replication. Hepatology 1999; 29:
1262-1271
2 8 Karin M, Cao Y, Greten FR, Li ZW. NF-kappaB in cancer:from innocent bystander to major culprit. Nat Rev Cancer 2002;
2:301-310
2 9 Bonizzi G, Karin M. The two NF-kappaB activation pathwaysand their role in innate and adaptive immunity. Trends Immunol
2004; 25 : 280-288
3 0 Karin M, Lin A. NF-kappaB at the crossroads of life anddeath. Nat Immunol 2002; 3: 221-227
3 1 Bour S , Perri n C, Aka ri H, Strebel K. The huma n
immunodeficiency virus type 1 Vpu protein inhibits NF-kappaB activation by interfering with beta TrCP-mediated
degradation of Ikappa B. J Biol Chem 2001; 276: 15920-15928
3 2 O'Mahony AM, Montano M, Van Beneden K, Chen LF, GreeneWC. Human T-cell lymphotropic virus type 1 tax induction
of biologically Active NF-kappaB requires IkappaB kinase-1-
mediated phosphorylation of RelA/p65. J Biol Chem 2004;279 :18137-18145
3 3 Goodkin ML, Ting AT, Blaho JA. NF-kappaB is required for
apoptosis prevention during herpes simplex virus type 1
infection. J Virol 2003; 77: 7261-7280
3 4 Luftig M, Yasui T, Soni V, Kang MS, Jacobson N, Cahir-McFarland E, Seed B, Kieff E. Epstein-Barr virus latent
infection membrane protein 1 TRAF-binding site induces NIK/
IKK alpha-dependent noncanonical NF-kappaB activation.Proc Natl Acad Sci USA 2004; 101: 141-146
3 5 Santoro MG, Rossi A, Amici C. NF-kappaB and virus
infection: who controls whom. EMBO J 2003; 22: 2552-25603 6 Soo HM, Garzino-Demo A, Hong W, Tan YH, Tan YJ, Goh P,
Lim SG, Lim SP. Expression of a full-length hepatitis C virus
cDNA up-regulates the expression of CC chemokines MCP-1and RANTES. Virology 2002; 303: 253-77
3 7 Chung YM, Park KJ, Choi SY, Hwang SB, Lee SY. Hepatitis C
virus core protein potentiates TNF-alpha-induced NF-kappaBactivation through TRAF2-IKK beta-dependent pathway.
Biochem Biophys Res Commun 2001; 284: 15-19
3 8 Miyasaka Y, Enomoto N, Kurosaki M, Sakamoto N,Kanazawa N, Kohashi T, Ueda E, Maekawa S, Watanabe H,
Izumi N, Sato C, Watanabe M. Hepatitis C virus nonstructural
protein 5A inhibits tumor necrosis factor-alpha-mediatedapoptosis in Huh7 cells. J Infect Dis 2003; 188: 1537-1544
3 9 Tai DI, Tsai SL, Chen YM, Chuang YL, Peng CY, Sheen IS,
Yeh CT, Chang KS, Huang SN, Kuo GC, Liaw YF. Activationof nuclear factor kappaB in hepatitis C virus infection:
implications for pathogenesis and hepatocarcinogenesis.
Hepatology 2000; 31 : 656-6644 0 Yasui K, Wakita T, Tsukiyama-Kohara K, Funahashi SI,
Ichikawa M, Kajita T, Moradpour D, Wands JR, Kohara M.
The native form and maturation process of hepatitis C viruscore protein. J Virol 1998; 72: 6048-6055
Science Editor Wang XL and Guo SY Language Editor ELsevier HK
Liao QJ et al. NS5A enhances core protein-induced NF- B activation 6439

PO Box 2345, Beijing 100023, China World J Gastroenterol 2005;11(41):6440-6444www.wjgnet.com World Journal of Gastroenterology ISSN [email protected] © 2005 The WJG Press and Elsevier Inc. All rights reserved.E L S E V I E R
• ������ ���������� •������ ���������� • •
Expression and immunoreactivity of HCV/HBV epitopes
Xin-Yu Xiong, Xiao Liu, Yuan-Ding Chen
Xin-Yu Xiong, Xiao Liu, Yuan-Ding Chen, Institute of Medical Biology, Chinese Academy of Medical Sciences and Peking Union Medical College, Kunming 650118, Yunnan Province, ChinaSupported by the Yunnan Province Natural Science Foundation, No. 2003C0076MCorrespondence to: Professor Yuan-Ding Chen, The key Laboratory, Institute of Medical Biology, Chinese Academy of Medical Sciences and Peking Union Medical College, Kunming 650118, Yunnan Province, China. [email protected] Telephone: +86-871-8334689 Fax: +86-871-8334483 Received: 2005-03-31 Accepted: 2005-04-30
© 2005 The WJG Press and Elsevier Inc. All rights reserved.
AbstractAIM: To develop the epitope-based vaccines to prevent Hepatitis C virus (HCV) / Hepatitis B virus (HBV) infections.
M E T H O D S : T h e H C V c o r e e p i t o p e s C 1 STNPKPQRKTKRNTNRRPQD (residuals aa2-21) and C2 VKFPGGGQIVGGVYLLPRR (residuals aa22-40), envelope epitope E GHRMAWDMMMNWSP (residuals aa315-328) and HBsAg epitope S CTTPAQGNSMFPSCCCTKPTDGNC (residuals aa124-147) were displayed in five different sites of the flock house virus capsid protein as a vector, and expressed in E. coli cells (pET-3 system). Immunoreactivity of the epitopes with anti-HCV and anti-HBV antibodies in the serum from hepatitis C and hepatitis B patients were determined.
RESULTS: The expressed chimeric protein carrying the HCV epitopes C1, C2, E (two times), L3C1-I2E-L1C2-L2E could react with anti-HCV antibodies. The expressed chimeric protein carrying the HBV epitopes S, I3S could react with anti-HBs antibodies. The expressed chimeric proteins carrying the HCV epitopes C1, C2, E plus HBV epitope S, L3C1-I2E-L1C2-L2E-I3S could react with anti-HCV and anti-HBs antibodies.
CONCLUSION: These epitopes have highly specific and sensitive immunoreaction and are useful in the development of epitope-based vaccines.
Key words: HCV; HBV; Epitope-based vaccine; Recombinant; Immunoreactivity
X i o n g X Y, L i u X , C h e n Y D . E x p r e s s i o n a n d immunoreactivity of HCV/HBV epitopes. World J Gastroenterol 2005;11(41): 6440-6444
http://www.wjgnet.com/1007-9327/11/6440.asp
INTRODUCTIONhepatitis C virus (HCV) and Hepatitis B virus (HBV) are the causative agents of hepatitis C and B. Exposure to HCV or HBV causes acute hepatitis, leading to chronic hepatitis, liver cirrhosis, hepatocellular carcinoma and even death. The worldwide prevalence is estimated to be around 170 million individuals (3%) infected with HCV and 350 million individuals (7%) infected with HBV[1,2]. HCV and HBV infections are social and economic issues. HCV is a member of the Flaviviridae family, possessing a linear single-stranded RNA genome of 9.4 kb[3]. The HCV genome contains a single open reading frame (ORF) encoding a polyprotein that is cleaved into the mature viral core, envelope and non-structural proteins[4]. The core protein is the most conserved and contains highly conserved epitopes[5]. The envelope protein E1 is the most variant region and contains the major neutralizing epitopes[6-11]. HBV is a double-stranded circular DNA virus[12]. The surface antigen of HBV (HBsAg), the major antigen protein, consists of large, middle and small proteins encoded by ORF S and preS, and have been successfully used as a hepatitis B vaccine. Since HCV and HBV infections share a similar route, i.e., mainly infected individuals through serum or seral products, it is very important to develop HCV/HBV covalent vaccines to simultaneously protect individuals from HCV and HBV infections. It has been previously demonstrated that the epitope-presenting system based on the flock house virus (FHV) capsid protein is useful in displaying foreign epitopes[13]. In the present study, epitopes derived from the HCV core, envelope protein and HBsAg were displayed in this system, immunoreactivities were determined, and the possibility to develop epitope-based vaccines was discussed.
MATERIALS AND METHODSEpitopes and epitope-presenting systemThe epi topes s tudied in th is s tudy were der ived f r o m t h e H C V c o r e r e g i o n r e s i d u e s a a 2 - 2 1 C 1 STNPKPQRKTKRNTNRRPQD (C1) and aa22-40, VKFPGGGQIVGGVYLLPRR (C2), the envelope region residues aa315-328, GHRMAWDMMMNWSP ( E ) , a n d t h e H B s A g r e s i d u e s a a 1 2 4 - 1 4 7 CTTPAQGNSMFPSCCCTKPTDGNC (S). The epitope-presenting system was developed using the

FHV capsid protein as a vector (FHV-RNA2 system)[13]. The FHV capsid protein expressed in the recombinant system could self-assemble into virus-like particles (VLPs). Six sites on the vector protein outer surface could be chosen for insertion of foreign epitopes which have little influence on the protein structure (Figure 1). The epitopes were inserted into L3 (C1), I2 (E), L1 (C2), L2 (E) and I3 (S), by means of genetic recombination engineering on plasmid pET-3. Four recombinant plasmids were constructed, pET-Wt carrying the bare vector protein gene, pET-I3S carrying the vector gene and the epitope S, pET-L3C1-I2E-L1C2-L2E carrying the vector gene and the epitopes C1, C2, E, and pET-L3C1-I2E-L1C2-L2E-I3S carrying the vector gene and the epitopes C1, C2, E and S.
Expression of chimeric proteins carrying epitopesThe recombinant plasmids were transformed into E. coli BL21(DE3) cells. The chimeric proteins carrying the epitopes were expressed under the control of T7 promotor[14] in TB/ampicillin media at 37 ℃. Cells were harvested by centrifugation at 3 000 r/min for 10 min at4 ℃ (Beckman ro to r t ype J -20 ) . Ce l l l y s i s was accomplished by ultrasonication and centrifuged at 10 000gfor 30 min. The chimeric proteins in the deposit were dissolved in 8 mol/L urea and analyzed by sodium dodecyl sulfate-polyacrylamide gel electrophoresis (SDS-PAGE). To purify the expressed chimeric proteins, the band containing the chimeric proteins was cut-off from the gel and the proteins were recovered by further electrophoresis procedures. The purified chimeric proteins were stored at -20 ℃ and used as an antigen in ELISA and Western blot tests.
Serum samplesSerum samples used in this study were collected from patients with hepatitis C (anti-HCV positive or HCV-RNA positive) or hepatitis B (anti-HBs positive), from the Kunming Infectious Disease Hospital, Kunming, China.
ELISARecombinant chimeric proteins carrying HCV/HBV epitopes purified by PAGE were diluted to 5 mg/L in carbonate/bicarbonate buffer (pH 9.6) and used as coating antigens in ELISA test. One hundred microliters
of the protein solution was added to each well of 96-well microtiter plates. The plates were incubated overnight at 4 ℃ and then blocked with 2.5 g/L bovine serum albumin in 10 mmol/L of phosphate-buffered saline containing 0.01% Tween 20 (PBS-T), at 37 ℃ for 1 h and washed five times with (PBS-T). Sera from hepatitis C or B patients were diluted to the ratio 1:10 and 100 μL was added to each well of the blocked plates. The mixture was incubated at 37 ℃ for 1 h. After washing, 100 μL of horseradish peroxidase-conjugated rabbit anti-human immunoglobulin G (Sigma BioSciences, St. Louis, MO, USA) was added to each well, and the plates were incubated for 1 h at 37 ℃. After incubation and washing, ortho-phenylenediamine dihydrochloride (OPD, Sigma BioSciences, St. Louis, MO, USA) was added, and the color was measured at 455 nm with a Titertek plate reader.
When the cut-off value was (SS-NC)/NC ≧ 2, it was defined as positive. In the formula, SS is the OD value of the serum sample, NC is the value of the negative control.
Western blotIn the Western blot test, the expressed chimeric proteins were separated in 10% SDS-PAGE and transferred onto the nitrocellulose membrane. After incubation with the patient’s serum (in 1∶400 dilution) and horseradish peroxidase-conjugated rabbit anti-human immunoglobulin G, the immobilized antigens (epitopes) were detected with 3,3-diaminobenzidine tetrahydrochloride (DAB, Sigma BioSciences, St. Louis, MO, USA).
RESULTSExpression and purification of chimeric proteinsThe chimeric proteins Wt, I3S, L3C1-I2E-L1C2-L2E and L3C1-I2E-L1C2-L2E-I3S were expressed in inclusion body form in transformed cells with the corresponding recombinant plasmids pET-Wt, pET-I3S, pET-L3C1-I2E-L1C2-L2E-I3S or pET-L3C1-I2E-L1C2-L2E-I3S, and analyzed by 10% SDS-PAGE (Figure 2). The results showed that the chimeric proteins were highly expressed.
Figure 2 Recombinant proteins expressed in E. coli cells. M: protein molecular mass standard; lane 1: recombinant vector protein Wt; lane 2: chimeric protein I3S; lane 3: L3C1-I2E-L1C2-L2E; lane 4: L3C1-I2E-L1C2-L2E-I3S; lane 5: supernatant of BL21 cells transformed by pET-L3C1-I2E-L1C2-L2E; lane 6: non-transformed BL21 cells.
M 1 2 3 4 5 6
97 400-66 200-
43 000-
31 000-
21 000-
Xiong XY et al . HCV/HBV epitope-based vaccine 6441
Figure 1 Three-dimensional structure of FHV capsid protein.

Figure 3 Expression of purified expressed proteins. M: protein molecular mass standard; lane 1: recombinant vector protein Wt; lane 2: chimeric protein I3S; lane 3: L3C1-I2E-L1C2-L2E; lane 4: L3C1-I2E-L1C2-L2E-I3S.
The contents of chimeric proteins were estimated possessing about 35.1% (Wt), 35.5% (I3S), 34.2% (L3C1-I2E-L1C2-L2E), and 39.7% (L3C1-I2E-L1C2-L2E-I3S) of the full cell proteins. After purification, the chimeric proteins possessed about 43.8 kD (Wt), 46.5 kD (I3S), 49.7 kD (L3C1-I2E-L1C2-L2E) and 52.5 kD (L3C1-I2E-L1C2-L2E-I3S) of molecular weight, respectively as expected (Figure 3).
ELISA testUsing purified chimeric proteins as a coating antigen, 66 anti-HCV+/HCV-RNA+ and 24 anti-HCV+/HCV-RNA- serum samples from hepatitis C patients were determined (Table 1). The results showed that the chimeric proteins carrying HCV epitopes, L3C1-I2E-L1C2-L2E and L3C1-I2E-L1C2-L2E-I3S could react with ant-HCV antibodies with a high specificity and susceptibility. The reactivity rates of chimeric proteins L3C1-I2E-L1C2-L2E and L3C1-I2E-L1C2-L2E-I3S were 95.5% and 95.5% with anti-HCV+/HCV-RNA+ sera, 29.2% and 37.5% with anti-HCV+/HCV-RNA- sera, respectively. No serum samples reacted with the expressed vector protein Wt. Few serum samples reacted with chimeric protein I3S, implying that the patients were co-infected with HBV
Western blot testUsing sera from patients with hepatitis C (anti-HCV
Figure 4 Western blot of expressed proteins using anti-HCV+ (A) and anti-HBsAg+ (B) sera as detecting antibodies. M: protein molecular mass standard; lane 1: recombinant vector protein W; lane 2: chimeric protein I3S, lane 3: L3C1-I2E-L1C2-L2E; lane 4: L3C1-I2E-L1C2-L2E-I3S.
positive by ELISA kit) or B (anti-HBs positive by ELISA kit) as detecting antibody, the chimeric proteins carrying HCV epitopes L3C1-I2E-L1C2-L2E and L3C1-I2E-L1C2-L2E-I3S could be recognized by anti-HCV antibody (Figure 4A), and the chimeric protein carrying HBV epitopes S, I3S and L3C1-I2E-L1C2-L2E-I3S could be recognized by anti-HBV antibody on Western blot (Figure 4B). Ten serum samples from hepatitis C or B patients were detected respectively and the results in each group were similar.
DISCUSSIONDue to the host defense mechanism and virus genome RNA instability, HCV seems to escape immune pressure by mutation and results in high genetic heterogeneity[15,16]. The humoral immune response to neutralizing antibodies appears to be restricted and isolate-specific. HCV isolates obtained can be classified into at least six major clades (clades 1 to 6) and more than 70 subtypes[3]. Development of HCV vacc ines i s l a rg e ly hampered for these characteristics of the virus. Recent studies indicate that when a virus epitope is present in an appropriate vector system, the epitope can be displayed on the exposed surface of the vector protein with high immunogenicity[17]. Sequencing and immunological analysis showed that the residues aa1-40 in HCV core region are the most conserved and the residues aa315-328 in E1 region are highly conserved too[18]. HBsAg is the major antigenic protein of HBV. Mature HBsAg can self-assemble into VLPs and induce effective immune response. The residues aa120-160 of the large protein S exposed on the outer surface of VLPs are defined as a determinant. This determinant induces cross neutralizing antibodies which protect infections against different HBV subtypes[19-21]. Further studies indicate that the “a” determinant is mainly located within a double-looped structure formed by disulfide bridges between cysteines at 124, 137 and at 139-147[22,23]. The epitope S (aa124-147) studied in this report contains the key residues of the “a”
97 400-
66 200-
43 000-
31 000-
M 1 2 3 4 1 2 3 4 M 1 2 3 4 M
-97 400
-66 200
-43 000
-31 000
-97 400
-66 200
-43 000
-31 000
A B
ISSN 1007-9327 CN 14-1219/ R World J Gastroenterol November 7, 2005 Volume 11 Number 416442
Patients Protein Anti-HCV+ /HCV-RNA+ Anti-HCV - /HCV-RNA+
(%) (%)Wt 0 013S 2/66 (3.1) 1/24 (4.1)L3C1-12E-L1C2-L2E 63/66 (95.5) 7/24 (29.2)L3C1-12E-L1C2-L2E-I3S 63/66 (95.5) 9/24 (37.5)
Table 1 Detection of immunoreaction of expressed proteins as antigen with anti-HCV antibodies in serum from hepatitis C patients by ELISA

determinant. The epitopes displayed in the FHV-RNA2 system in this study had a high reactivity to specific anti-HCV or anti-HBV antibodies, indicating the importance of these HCV and HBV epitopes. HCV/HBV epitopes, multiple-presented in a fusion form, cross react with HCV and HBV antibodies[24]. DNA immunization with fusion genes encoding different regions of the HCV E2 fused to the HBsAg gene elicits immune responses to both HCV and HBV. The antibody responses induced by the same epitopes are also demonstrated[25]. These results suggest that these epitopes contribute to the development of epitope-based vaccines. Since HCV and HBV have a similar infection route with a high co-infection rate, development of HCV/HBV covalent vaccines is of great importance. Previous studies on HIV-1[13], HCV[26] and rotavirus[27-29] single epitopes and the present study demonstrated that the FHV-RNA2 system can be used to study the foreign epitope characteristics and to develop epitope-based vaccines. Since no sustainable cell culture system can be used, whether the antibodies elicited by these epitopes neutralize HCV and HBV infectivity or protect individuals against HCV and HBV infection remains to be studied.
REFERENCES1 Koff RS. Hepatitis vaccines: recent advances. Int J Parasitol
2003; 33: 517-5232 El Khouri M, dos Santos VA. Hepatitis B: epidemiological,
immunological, and serological considerations emphasizing mutation. Rev Hosp Clin Fac Med Sao Paulo 2004; 59: 216-224
3 Robertson B, Myers G, Howard C, Brettin T, Bukh J, Gaschen B, Gojobori T, Maertens G, Mizokami M, Nainan O, Netesov S, Nishioka K, Shin i T, Simmonds P, Smith D, Stuyver L, Weiner A. Classification, nomenclature, and database development for HCV and related viruses: proposals for standardization. International Committee on Virus Taxonomy. Arch Virol 1998; 143: 2493-2503
4 Lindenbach BD, Rice CM. Flaviviridae: the viruses and their replication. In: D. M. Knipe, P. M. Howley, D. E. Griffin, R. A. Lamb, M. A. Martin, B. Roizman, and S. E. Straus (ed.). Fields virology, 4th ed. Philadelphia, Pa. Lippincott Williams & Wilkins, 2001; 991-1042
5 Hadlock KG, Lanford RE, Perkins S, Rowe J, Yang Q, Levy S, Pileri P, Abrignani S, Foung SK. Human monoclonal antibodies that inhibit binding of hepatitis C virus E2 protein to CD81 and recognize conserved conformational epitopes. J Virol 2000; 74: 10407-10416
6 Bukh J, Miller RH, Purcell RH. Genetic heterogeneity of hepatitis C virus: quasispecies and genotypes. Semin Liver Dis 1995; 15: 41-63
7 Keck ZY, Op De Beeck A, Hadlock KG, Xia J , Li TK, Dubuisson J, Foung SK. Hepatitis C virus E2 has three immunogenic domains containing conformational epitopes with distinct properties and biological functions. J Virol 2004; 78: 9224-9232
8 Habersetzer F, Fournillier A, Dubuisson J, Rosa D, Abrignani S, Wychowski C, Nakano I, Trépo C, Desgranges C, Inchauspé G. Characterization of human monoclonal antibodies specific to the hepatitis C virus glycoprotein E2 with in vitro binding neutralization properties. Virology 1998; 249: 32-41
9 da Silva Cardoso M, Siemoneit K, Sturm D, Krone C, Moradpour D, Kubanek B. Isolation and characterization of human monoclonal antibodies against hepatitis C virus envelope glycoproteins. J Med Virol 1998; 55: 28-34
10 Burioni R, Plaisant P, Manzin A, Rosa D, Delli Carri V, Bugli F, Solforosi L, Abrignani S, Varaldo PE, Fadda G, Clementi M. Dissection of human humoral immune response against hepatitis C virus E2 glycoprotein by repertoire cloning and generation of recombinant Fab fragments. Hepatology 1998; 28: 810-814
11 Allander T, Drakenberg K, Beyene A, Rosa D, Abrignani S , Houghton M, Widel l A, Gr i l lner L , Persson MA. Recombinant human monoclonal antibodies against different conformational epitopes of the E2 envelope glycoprotein of hepatitis C virus that inhibit its interaction with CD81. J Gen Virol 2000; 81: 2451-2459
12 Gust ID, Burrell CJ, Coulepis AG, Robinson WS, Zuckerman AJ. Taxonomic classification of human hepatitis B virus. Intervirology 1986; 25: 14-29
13 Tisminetzky SG, Scodeller EA, Evangelisti P, Chen Y, Schiappacassi M, Porro F, Bizik F, Zacchi T, Lunazzi G, Miertus S. Immunoreactivity of chimeric proteins carrying the HIV-1 epitope IGPGRAF. Correlation between predicted conformation and antigenicity. FEBS Lett 1994; 353: 1-4
14 Studier FW, Rosenberg AH, Dunn JJ, Dubendorff JW. Use of T7 RNA polymerase to direct expression of cloned genes. Methods Enzymol 1990; 185: 60-89
15 Chen YD, Liu MY, Yu WL, Li JQ, Peng M, Dai Q, Liu X, Zhou ZQ. Hepatitis C virus infections and genotypes in China. Hepatobiliary Pancreat Dis Int 2002; 1: 194-201
16 Chen YD, Liu MY, Yu WL, Li JQ, Peng M, Dai Q, Wu J, Liu X, Zhou ZQ. Sequence variability of the 5' UTR in isolates of hepatitis C virus in China. Hepatobiliary Pancreat Dis Int 2002; 1: 541-552
17 Chen Y, Dai C. [Current status and strategy of research on epitope-based vaccine] Zhonghua Yu Fang Yi Xue Za Zhi. 1999; 33: 315-316
18 Bukh J, Purcell RH, Miller RH. At least 12 genotypes of hepatitis C virus predicted by sequence analysis of the putative E1 gene of isolates collected worldwide. Proc Natl Acad Sci U S A 1993; 90: 8234-8238
19 Gerin JL, Alexander H, Shih JW, Purcell RH, Dapolito G, Engle R, Green N, Sutcliffe JG, Shinnick TM, Lerner RA. Chemically synthesized peptides of hepatitis B surface antigen duplicate the d/y specificities and induce subtype-specific antibodies in chimpanzees. Proc Natl Acad Sci U S A 1983; 80: 2365-2369
20 Moynihan JS, D'Mello FI, Howard CR. 48-mer synthetic peptide analogue of the hepatitis B virus "a" determinant induces an anti-HBs antibody response after a single injection. J Med Virol 2000; 62: 159-166
21 Stirk HJ, Thornton JM, Howard CR. A topological model for hepatitis B surface antigen. Intervirology 1992; 33: 148-158
22 Berting A, Hahnen J, Kröger M, Gerlich WH. Computer-aided studies on the spatial structure of the small hepatitis B surface protein. Intervirology 1995; 38: 8-15
23 Carman WF, Korula J, Wallace L, MacPhee R, Mimms L, Decker R. Fulminant reactivation of hepatitis B due to envelope protein mutant that escaped detection by monoclonal HBsAg ELISA. Lancet 1995; 345: 1406-1407
24 Li Q, Dong C, Wang J, Che Y, Jiang L, Wang J, Sun M, Wang L, Huang J, Ren D. Induction of hepatitis C virus-specific humoral and cellular immune responses in mice and rhesus by artificial multiple epitopes sequence. Viral Immunol 2003; 16: 321-333
25 Chen YD, Xiong X, Liu X, Li J, Wen YL, Chen Y, Dai Q, Cao Z, Yu W. Immunoreactivity of HCV/HBV epitopes displayed in an epitope-presenting system. Mol Immunol 2006; 43:436-442 in press
26 Buratti E, Di Michele M, Song P, Monti-Bragadin C, Scodeller EA, Baralle FE, Tisminetzky SG. Improved reactivity of hepatitis C virus core protein epitopes in a conformational antigen-presenting system. Clin Diagn Lab Immunol 1997; 4: 117-121
Xiong XY et al . HCV/HBV epitope-based vaccine 6443

27 Chen YD, Liu MY, Zou YJ, Peng M, Dai CB. Induction of neutralizing antibodies by SA11 Vp4-specific epitopes. Zhongguo Bing du xue 1997; 12: 125-131
28 Chen YD, Liu MY, Zhao W, Dai CB. Broadly Immunological Reactivities primed by epitopes corresponding to the cleavage
region of SA11 Vp4. Zhongguo Bing du xue 1998; 13: 57-6329 Liu X, Li JQ, Xiong XY, Chen YN, Peng M, Dai Q, Wen YL,
Chen YD. [Protective efficacy of recombinant rotavirus epitope-based vaccine in mice] Zhongguo Yixue Kexueyuan Xue bao 2005; 27: 216-22
Science Editor Guo SY Language Editor Elsevier HK
ISSN 1007-9327 CN 14-1219/ R World J Gastroenterol November 7, 2005 Volume 11 Number 416444

PO Box 2345, Beijing 100023, China World J Gastroenterol 2005;11(41):6445-6449www.wjgnet.com World Journal of Gastroenterology ISSN [email protected] © 2005 The WJG Press and Elsevier Inc. All rights reserved.E L S E V I E R
• BASIC RESEARCH•
Mark T Cartmell, Derek A O’Reilly, Andrew N Kingsnorth, Department of Surgery, Derriford Hospital, Plymouth, United KingdomSimon P Dunlop, Department of Gastroenterology, Derriford Hospital, Plymouth, United KingdomBing-Mei Yang, Andrew G Demaine, Department of Molecular Medicine, Plymouth Postgraduate Medical School, Plymouth, United KingdomHans-Ulrich Schulz, Walter Halangk, Department of Surgery, University of Magdeburg, Magdeburg, Germany Volker Kielstein, Outpatient Clinic for Addiction Diseases, Magdeburg, GermanyCorrespondence to: Mr Mark T Cartmell, c/o Professor Kingsnorth, Derriford Hospital, Plymouth PL6 8DH, United Kingdom. [email protected] : +44-1752-763017 Fax: +44-1752-763007Received: 2005-03-04 Accepted: 2005-04-02
AbstractAIM: To investigate a possible role for a recently identified polymorphism in the gene of cytochrome P450 2E1, the presence of which is associated with high activity of the enzyme.
METHODS: Two hundred and th i r ty-n ine a lcoho l consumers, ICD 10.1/.2 (ALC), and 208 normal controls were studied. PCR amplification of the CYP2E1 gene region was performed to assess polymorphic variation. Fisher’s exact test was used to assess the data.
RESULTS: Twelve normal controls (5.8%) possessed the insertion. Five ALC (2.1%) had the insertion; of these 2 of 144 with alcohol induced chronic pancreatitis, none of 28 with alcoholic liver disease and 3 of 67 without end-organ disease had the polymorphism. A significantly Lower frequency of subjects possessed the insertion than normal controls [P = 0.049 (genotype analysis P = 0.03)]. To further assess, if there was a relationship to alcohol problems per se or end-organ disease, we compared patients with alcohol induced end-organ disease vs alcoholic controls without end-organ disease vs normal controls which again showed a significant difference [P = 0.045 (genotype analysis,P = 0.011)], further sub-group analysis did not identify which group(s) accounted for these differences.
CONCLUSION: We have shown the frequencies of this high-activity polymorphism in alcohol related patient groups for the first time. The frequency is significantly less in alcoholics than normal controls, as with high activity
polymorphisms of alcohol dehydrogenase. The biological significance, and whether the relevance is solely for alcoholism or is there a relationship to end-organ disease, would benefit from the assessment in the populations with a greater frequency of this polymorphism.
©2005 The WJG Press and Elsevier Inc. All rightsreserved.
Key words: CYP2E1; Alcohol; Chronic pancreatitis; Liver disease; Polymorphism
Cartmell MT, Schulz HU, O’Reilly DA, Yang BM, Kielstein V, Dunlop SP, Halangk W, Demaine AG, Kingsnorth AN. Cytochrome P450 2E1 high activity polymorphism in alcohol abuse and end-organ disease. World J Gastroenterol 2005; 11(41):6445-6449http://www.wjgnet.com/1007-9327/11/6445.asp
INTRODUCTIONCytochrome P450 2E1 (CYP2E1) is the major component of the microsomal enzyme oxidizing system, which is one of the major pathways of oxidative metabolism of ethanol[1,2] as well as a large number of xenobiotics[3]. CYP2E1 is induced to greater activity by its substrate e thanol , probably v ia a number of mechanisms, including transcriptional, post-transcriptional and post-translational[2,4,5].
CYP2E1 activity is expressed in the liver, at sites of maximal alcohol induced damage[6], and in the pancreas, where it is also induced by chronic alcohol consumption[7,8]. These two are the major sites of damage following chronic consumption of ethanol. In addition, it is found in the brain[9], also a site of ethanol induced damage.
The genetic predisposition to both alcoholism and alcohol induced end-organ damage is an area of debate. Alcohol-induced pancreatitis occurs in approximately 5% of alcoholics[10] while no, or minimal, fibrosis is found in 32% of pancreata of alcoholics[11]. Alcoholic cirrhosis occurs in around 10% and hepatitis in 10-35%[12].
The heterogeneity of the response to alcohol implicates genetic factors. Family and twin studies suggest a genetic component to alcoholism[13,14]. Some evidence suggests that the majority of genetic predisposition to psychosis and liver disease may be accounted for by disposition to alcoholism[14].
Recently, an insertion polymorphism in the promoter
Mark T Cartmell, Hans-Ulrich Schulz, Derek A O’Reilly, Bing-Mei Yang, Volker Kielstein, Simon P Dunlop, Walter Halangk, Andrew G Demaine, Andrew N Kingsnorth
Cytochrome P450 2E1 high activity polymorphism in alcohol abuse and end-organ disease

region of the gene coding for the enzyme CYP2E1 has been described; sequencing has shown a 96-bp insertion as a series of eight repeats, as opposed to six in the wild type[15,16]. This corresponds to the restriction fragment length polymorphism, between positions -2270 and -1672. Presence of which is associated with higher CYP2E1 metabolic activity (employing an in vivo chlorazoxazone 6-hydroxylation test) in the presence of recently consumed alcohol or obesity[17]. We have therefore analyzed the frequency of this polymorphism in patients with a history of excessive alcohol consumption, with and without end-organ damage, and normal controls.
The 96-bp insertion, previously described, is a 729-bp fragment employing the PCR based analysis of Fritscheet al[16]. The wild type allele is 633 bp in length. In addition, a GenBank record also exists for a 48-bp deletion (accession no. J02843), corresponding to 585 bp.
MATERIALS AND METHODSSubjects Venous blood samples were drawn from patients giving informed consent and local research ethics committee approval was obtained. We collected samples on 239 Caucasoid subjects (ALC) fulfilling the ICD 10 criteria 10.1 and 10.2, that is harmful use and/or alcohol dependence syndrome. Cut-off for minimal consumption was 80 g alcohol per day (UK patients range 56-400 U/week; median 106 U/week) over a minimum of 2 years (UK range 2-45 years; median 10 years). Age range was 25-73 years, median 47 years. The subjects were sub-divided as follows:
Sixty-seven (36 British and 31 German) subjects without known end-organ disease, AC, collected from clients at alcohol rehabilitation centers.
One hundred and seventy-two with alcohol-related end-organ disease (AEOD). Of which, one hundred and forty-four (39 British and 105 German) patients had alcohol-induced chronic pancreatitis (AICP); all fulfilled the criteria for late- or end-stage AICP, as defined by the Zurich criteria[18]. The twenty-eight patients with alcoholic liver disease (ALD) had biopsy proven cirrhosis or a history, consistent with alcoholic hepatitis, including jaundice associated with excess alcohol consumption without other evident cause.
Two hundred and eight samples of cord blood from Caucasoids with a normal, healthy delivery taken in Derriford Hospital, Plymouth, UK were employed as normal controls.
Laboratory analysisDNA samples were extracted from peripheral and cord blood samples employing the commercially available Nucleon II DNA extraction kits (Nucleon Biosciences, Lanarkshire, Scotland, UK) or QIAmp DNA Blood Minikits (Qiagen, Hilden, Germany).
DNA amplification was performed for the promoter region of CYP2E1 as previously described[16], employing amplimers 5’-GTG ATG GAA GCC TGA AGA ACA-
6446 ISSN 1007-9327 CN 14-1219/ R World J Gastroenterol November 7, 2005 Volume 11 Number 41
and 5’-CTT TGG TGG GGT GAG AAC AG-. Reactions were carried out in a volume of 25 μL employing 100-200 ng of genomic DNA. Following a hot start for 4 min at 94 °C, thirty cycles of: 94 °C (denaturing) for 30 s; 66 °C (annealing) for 2 min and 72 °C (extension) for 2 min were performed. This was followed by 10-min extension at 72 °C.
Products were analyzed on a 1.5% agarose gel stained with 0.01% v/v ethidium bromide, viewed under ultraviolet light and compared to 50 and 100 bp molecular weight ladders (Roche Diagnostics, Lewes, East Sussex, UK).
Statistical analysisTwo-sided Fisher’s exact tests were used throughout (SPSS 9.0, SPSS Inc., Chicago, IL, USA). A P value of <0.05 was taken as significant. Where appropriate, multisided contingency tables were employed initially for comparisons, with sub-group analysis only when a statistically significant result was seen in the initial comparison. Individual sub-group analyses for end-organ disease(s) only involved comparison with AC controls. Chi square values, where expected cell numbers are greater than 5, are shown in brackets in tables. A comparison is made for the presence of the insertion polymorphism, which has the functional association[17], and for the genotype of that polymorphism.
RESULTSResults are displayed in Table 1. of 208 normal controls 12 (5.8%) had the insertion polymorphism, and all were heterozygotes (Figure 1A). In contrast, 5 of 239 ALC subjects (2.1%) had the insertion. In the AICP group two subjects had the insertion and one of these was homozygous for the insertion. In the AC group, three subjects had the insertion. In addition, one AICP and one AC had a band which would correspond to the 48-bp deletion found in GenBank (Figure 1B), as did two normal controls. Results from the British and German groups, all European Caucasoids, were similar: three of the 136 German subjects (2.2%) and 2 of the 103 British (2%) had the insertion; two of the 31 German AC, 1 of the 36 British AC, 1 of the 105 German AICP and 1 of the 39 British AICP.
Comparing ALC to NC for the presence of the insertion polymorphism, showed that it was less abundant in the former than the latter (P = 0.049) (Table 2). The same comparison for genotype of the insertion was comparable (P = 0.030) (Table 2).
To delineate whether the difference may have been for alcohol problems per se or end organ disease we initially employed Fisher’s exact test for the presence of the insertion using a three by two contingency table of normal controls, AC and AEOD. This revealed a statistically significant difference (P = 0.045), and analysis for insertion genotypes was comparable (P = 0.011) (Table 3). Thus, we further analyzed the sub-groups. Comparing AC with NC and comparisons within alcoholic (ALC) subgroups analysis did not reveal any significant differences, as might be expected with such a low frequency in the patient

Cartmell MT et al. CYP2E1 in alcohol abuse and end-organ disease 6447
groups. Although genotype analysis for AEOD compared with AC approached significance with P = 0.068.
DISCUSSIONPolymorphisms in CYP2E1, other than that studied here, have been looked at in previous studies, though some have
used small numbers. Their association with alcoholism has been studied: no association was found for the c1/c2 alleles in most studies[19-23]. A positive association for the D form of the C/D polymorphism was found in Japanese subjects[24]. Although some studies used non-alcoholic controls, in alcohol induced end-organ disease association for these polymorphisms has been found: for ALD and the c2 allele[25-27] and fatty liver and the c2 allele[28]. However, the positive association with end-organ disease has not been found in a number of studies[19,21,29-31] and two studies found an association with the c1 allele[32,33].
The original study describing the polymorphism assessed in this study, showed greater CYP2E1 metabolic activity associated with the 96 bp insertion. In that study chlorazoxazone hydroxylation was higher in the patients with the presence of the polymorphism and who were obese or recent consumers of alcohol[17]; both circumstances when CYP2E1 is induced. The two later descriptions[15,16] delineate the pattern of 8 repeats of 42-60 bp, as opposed to 6 in the wild type. The first sequencing data showed a run of five repeats[34] (accession no. J02843), which had not been seen in the two further studies[15,16], this form would correspond to the smaller band seen in four of our 447 samples (Figure 1B).
Hu et al [15] did not find an increased constitutive
Table 2 Normal control and alcoholic figures and comparisons
Normal controls n = 208 (%) ALC n = 239 (%) Fisher’s exact test
Presence of insertion polymorphism 12 (5.8) 5 (2.1) P = 0.049 (χ2 = 4.110, P = 0.043)
Genotype for insertion polymorphism Heterozygote 12 (5.8) 4 (1.7) P = 0.030 Homozygote 0 (0.0) 1 (0.4)
ALC, ICD 10.1/10.2.
Table 3 Alcoholic subgroup figures and analyses
Normal controls n = 208 (%) Alcoholic controls n = 67 (%) Alcoholic end organ disease n = 172 (%) Fisher’s exact test
Presence of insertion polymorphism 12 (5.8) 3 (4.5) 2 (1.2) P = 0.045Genotype forinsertion polymorphism Heterozygote 12 (5.8) 3 (4.5) 1 (0.6) P = 0.011 Homozygote 0 (0.0) 0 (0.0) 1 (0.6)
Table 1 Full genotype data on all subjects
Normal controls (n = 208) ALC (n = 239) Of ALC Of AEOD
AC (n = 67) AEOD (n = 172) AICP (n = 144) ALD (n = 28) Homozygote wildtype 194 232 63 169 141 28 Heterozygote for insertion 12 4 3 1 1 0
Homozygote for insertion 0 1 0 1 1 0
Heterozygote for deletion 2 2 1 1 1 0
ALC, ICD 10.1/10.2; AC, alcoholic controls; AEOD, alcohol-related end-organ disease; AICP, alcohol induced chronic pancreatitis; ALD, alcoholic liver disease.
700600
500 bp
M 1 2 3 4 5 6 7
700
600
M 1 2 3 4 5
Figure 1 A: Agarose gel showing wild type homozygotes (633 bp, lanes 1, 3, 5–7) and a heterozygote for the insertion polymorphism (729 bp, lane 4). Run alongside a molecular weight marker (M); B:Agarose gel showing wild type homozygotes (633 bp, lanes 1–3 and 5) and a heterozygote for the deletion polymorphism (585 bp, lane 4). Run alongside a molecular weight marker (M).
500 bp
A
B

expression in luciferase transfection experiments, for the insertion polymorphism, which would agree with McCarver et al[17] findings of increased enzymatic activity only in the induced state (obese subjects and recent alcohol consumers).
To our knowledge, this is the first study to look at this polymorphism in patient groups. In previous studies of healthy groups of American Caucasoids, frequencies of 6.9%[17] and 4.2%[16] are seen. Another previous study found the insertion in only 2.1% of healthy Swedish subjects[15].
At low frequencies these results, on Caucasoid subjects, could all be consistent with the frequencies found in our patient, as well as our control, groups; of 5.8% controls (British), 2.2% German ALC and 2% British ALC. However, in the large numbers in our study our results do indicate a statistically significant difference, which remains when isolating the smaller numbers of only British subjects for insertion genotype between NC and ALC(P = 0.03). Population stratification is a confounding factor in all genetic association studies and the possibility of this is recognized, raising the question as to whether our results are biologically as well as statistically significant.
We have shown a significantly lower frequency of this polymorphism, which is associated with increased activity, in the gene coding for the enzyme CYP2E1 when comparing those with alcohol dependence or abuse and normal controls. This could be explained and be analogous to the association found in the functional variations in ADH. It has been shown that high activity forms of ADH (and low activity forms of ALDH) are associated with the protection against alcoholism in a number of studies, as previously reviewed[35]. This is believed to be due to the increased production (or decreased metabolism) of the ethanol metabolite acetaldehyde (and possibly other toxic metabolites), to which associated unpleasant side effects such as flushing are ascribed[35].
Due to the low frequency in our patient populations it was not possible to delineate whether there was only a relationship to alcohol misuse per se, or a relationship to end-organ disease. If a lower frequency existed in alcoholics, it could then be expected to be increased in those with end-organ disease compared to alcoholic controls. The sole homozygote was a patient with AICP and genotype analysis of those with end-organ disease vs AC approached significance, with P = 0.068. However, to infer a finding from such a result would not be justified.
Further analysis in ethnic populations with a frequency of this polymorphism which is sufficiently common to a more likely impact on susceptibility to CYP2E1-related diseases would be useful (e.g. Chinese[15], Taiwanese or African American[16] populations). This would be useful both to confirm or refute the association found here and to delineate any association with end-organ disease, rather than alcoholism per se.
In conclusion, the debate regarding a role for CYP2E1 in alcohol misuse and end-organ disease and a genetic component of this is further assessed. We have shown for the first time frequencies of this functional polymorphism
in patient groups and there appears to be an association with this high activity polymorphism in the gene coding for cytochrome P450 2E1 and genetic protection against alcohol consumption. However, further studies are required in other populations.
ACKNOWLEDGMENTS The authors would like to thank David Wright for his statistical input and the staff and clients of Broadreach Drug and Alcohol Treatment Centre, Plymouth.
REFERENCES1 Lieber CS, DeCarli LM. Hepatic microsomal ethanol-oxidiz-
ing system. In vitro characteristics and adaptive properties in vivo. J Biol Chem 1970;245:2505-2512
2 LieberCS. Cytochrome P-4502E1: its physiological and patho-logical role. Physiol Rev 1997; 77:517-544
3 Parkinson A. Biotransformation of xenobiotics. In: Klassen CD, Amdur MO, Doull J. eds. Casarett and Doulls’ Toxicol-ogy: The Basic Science of Poisons. 5th ed. New York: McGraw-Hill, 1996; 113-186
4 OhnishiK, Lieber CS. Reconstitution of the microsomal eth-anol-oxidizing system. Qualitative and quantitative changes of cytochrome P-450 after chronic ethanol consumption. J Biol Chem 1977;252: 7124-7131
5 TakahashiT, Lasker JM, Rosman AS, Lieber CS. Induction of cytochrome P-4502E1 in the human liver by ethanol is caused by a corresponding increase in encoding messenger RNA. Hepatology 1993; 17: 236-245
6 TsutsumiM, Lasker JM, Shimizu M, Rosman AS, Lieber CS. The intralobular distribution of ethanol-inducible P450IIE1 in rat and human liver. Hepatology 1989; 10: 437-446
7 Kessova IG, DeCarli LM, Lieber CS. Inducibility of cyto-chromes P-4502E1 and P-4501A1 in the rat pancreas. Alcohol Clin Exp Res 1998; 22: 501-504
8 NortonID, Apte MV, Haber PS, McCaughan GW, Pirola RC, Wilson JS. Cytochrome P4502E1 is present in rat pancreas and is induced by chronic ethanol administration. Gut 1998; 42: 426-430
9 UpadhyaSC, Tirumalai PS, Boyd MR, Mori T, Ravindranath V. Cytochrome P4502E (CYP2E) in brain: constitutive expression, induction by ethanol and localization by fluorescence in situ hybridization. Arch Biochem Biophys 2000;373: 23-34
10 DreilingDA, Koller M. The natural history of alcoholic pan-creatitis: update 1985. Mt Sinai J Med 1985; 52:340-342
11 Pitchumoni CS, Glasser M, Saran RM, Panchacharam P, Thelmo W. Pancreatic fibrosis in chronic alcoholics and nonal-coholics without clinical pancreatitis. Am J Gastroenterol 1984; 79: 382-388
12 GrantBF, Dufour MC, Harford TC. Epidemiology of alcoholic liver disease. Semin Liver Dis 1988; 8: 12-25
13 National InstituteofAlcohol Abuse andAlcoholism. Ge-netic and psychosocial influences. In: Tenth Special Report to the U. S. Congress on Alcohol and Health. Maryland: NIAAA, 2000; 159-196
14 ReedT, Page WF, Viken RJ, Christian JC. Genetic predisposi-tion to organ-specific endpoints of alcoholism. Alcohol Clin Exp Res 1996; 20: 1528-1533
15 HuY, Hakkola J, Oscarson M, Ingelman-Sundberg M. Struc-tural and functional characterization of the 5’-flanking region of the rat and human cytochrome P450 2E1 genes: identifica-tion of a polymorphic repeat in the human gene. Biochem Bio-phys Res Commun 1999; 263: 286-293
16 FritscheE, Pittman GS, Bell DA. Localization, sequence analy-sis, and ethnic distribution of a 96-bp insertion in the promoter of the human CYP2E1 gene. Mutat Res 2000;432: 1-5
6448 ISSN 1007-9327 CN 14-1219/ R World J Gastroenterol Novmber 7, 2005 Volume 11 Number 41

17 McCarverDG, Byun R, Hines RN, Hichme M, Wegenek W. A genetic polymorphism in the regulatory sequences of human CYP2E1: association with increased chlorzoxazone hydrox-ylation in the presence of obesity and ethanol intake. Toxicol Appl Pharmacol 1998; 152: 276-281
18 AmmannRW. A clinically based classification system for alco-holic chronic pancreatitis: summary of an international work-shop on chronic pancreatitis. Pancreas 1997; 14: 215-221
19 Carr LG, Hartleroad JY, Liang Y, Mendenhall C, Moritz T, Thomasson H. Polymorphism at the P450IIE1 locus is not as-sociated with alcoholic liver disease in Caucasian men. Alcohol Clin Exp Res 1995; 19: 182-184
20 MaezawaY, Yamauchi M, Toda G, Suzuki H, Sakurai S. Alco-hol-metabolizing enzyme polymorphisms and alcoholism in Japan. Alcohol Clin Exp Res 1995; 19: 951-954
21 CarrLG, Yi IS, Li TK, Yin SJ. Cytochrome P4502E1 genotypes, alcoholism and alcoholic cirrhosis in Han Chinese and Atayal Natives of Taiwan. Alcohol Clin Exp Res 1996; 20: 43-46
22 KeeJY, Kim MO, You IY, Chai JY, Hong ES, An SC, Kim H, Park SM, Youn SJ, Chae HB. [Effects of genetic polymorphisms of ethanol-metabolizing enzymes on alcohol drinking behav-iors] Taehan Kan Hakhoe Chi 2003; 9: 89-97
23 KonishiT, Luo HR, Calvillo M, Mayo MS, Lin KM, Wan YJ. ADH1B*1, ADH1C*2, DRD2 (-141C Ins), and 5-HTTLPR are associated with alcoholism in Mexican American men living in Los Angeles. Alcohol Clin Exp Res 2004;28: 1145-1152
24 IwahashiK, Ameno S, Ameno K, Okada N, Kinoshita H, Sakae Y, Nakamura K, Watanabe M, Ijiri I, Harada S. Relation-ship between alcoholism and CYP2E1 C/D polymorphism. Neuropsychobiology 1998; 38: 218-221
25 TsutsumiM, Takada A, Wang JS. Genetic polymorphisms of cytochrome P4502E1 related to the development of alcoholic liver disease. Gastroenterology 1994; 107: 1430-1435
26 TanakaF, Shiratori Y, Yokosuka O, Imazeki F, Tsukada Y, Omata M. Polymorphism of alcohol-metabolizing genes af-fects drinking behavior and alcoholic liver disease in Japanese men. Alcohol Clin Exp Res 1997; 21:596-601
27 GroveJ, Brown AS, Daly AK, Bassendine MF, James OF, Day
CP. The RsaI polymorphism of CYP2E1 and susceptibility to alcoholic liver disease in Caucasians: effect on age of presen-tation and dependence on alcohol dehydrogenase genotype. Pharmacogenetics 1998;8: 335-342
28 PiaoYF, Li JT, Shi Y. Relationship between genetic polymor-phism of cytochrome P450IIE1 and fatty liver. World J Gastro-enterol 2003; 9: 2612-2615
29 Itoga S, Nomura F, Harada S, Tsutsumi M, Takase S, Nakai T. Mutations in the exons and exon-intron junction regions of human cytochrome P-4502E1 gene and alcoholism. Alcohol Clin Exp Res 1999; 23: 13S-16S
30 Burim RV, Canalle R, Martinelli Ade L, Takahashi CS. Polymorphisms in glutathione S-transferases GSTM1, GSTT1 and GSTP1 and cytochromes P450 CYP2E1 and CYP1A1 and susceptibility to cirrhosis or pancreatitis in alcoholics. Mutagenesis 2004;19:291-298
31 VerlaanM, Te Morsche RH, Roelofs HM, Laheij RJ, Jansen JB, Peters WH, Drenth JP. Genetic polymorphisms in alcohol-metabolizing enzymes and chronic pancreatitis. Alcohol Alcohol 2004;39: 20-24
32 MaezawaY, Yamauchi M, Toda G. Association between restriction fragment length polymorphism of the human cytochrome P450IIE1 gene and susceptibility to alcoholic liver cirrhosis. Am J Gastroenterol 1994; 89: 561-565
33 KimMS, Lee DH, Kang HS, Park HS, Jung S, Lee JW, Kwon KS, Kim PS, Kim HG, Shin YW, Kim YS, Baek I, Lee MS. [Genetic polymorphisms of alcohol-metabolizing enzymes and cytokines in patients with alcohol induced pancreatitis and alcoholic liver cirrhosis] Korean J Gastroenterol 2004; 43: 355-363
34 UmenoM, McBride OW, Yang CS, Gelboin HV, Gonzalez FJ. Human ethanol-inducible P450IIE1: complete gene sequence, promoter characterization, chromosome mapping, and cDNA-directed expression. Biochemistry 1988; 27: 9006-9013
35 Bosron WF , Ehrig T, Li TK. Genetic factors in alcohol metabolism and alcoholism. Semin Liver Dis 1993; 13: 126-135
ScienceEditor Guo SY LanguageEditor Elsevier HK
Cartmell MT et al. CYP2E1 in alcohol abuse and end-organ disease 6449

PO Box 2345, Beijing 100023, China World J Gastroenterol 2005;11(41):6450-6458www.wjgnet.com World Journal of Gastroenterology ISSN [email protected] © 2005 The WJG Press and Elsevier Inc. All rights reserved.E L S E V I E R
• BASIC RESEARCH •
Tomasz Brzozowski, Danuta Drozdowicz, Stanislaw J Konturek, Robert Pajdo, Slawomir Kwiecien, Wieslaw W Pawlik, Department of Physiology, Jagiellonian University Medical College, Cracow, PolandPeter C Konturek, Eckhart G Hahn, Department of Medicine I, University of Erlangen-Nuremberg, Erlangen, Germany; Oxana Zayachivska National Medical University, Lviv, UkraineCorrespondence to: Professor Tomasz Brzozowski, Department of Physiology, Jagiellonian University Medical College, Cracow, Poland. [email protected] Telephone: +48-12-424-7231 Fax: +48-12-421-1578Received: 2005-01-06 Accepted: 2005-05-24
Abstract AIM: Grapefru i t-seed extract (GSE) conta in ing flavonoids, possesses antibacterial and antioxidative properties but whether it influences the gastric defense mechanism and gastroprotection against ethanol- and stress-induced gastric lesions remains unknown.
METHODS: We compared the effects of GSE on gastric mucosal lesions induced in rats by topical app l icat ion of 100% ethanol or 3 .5 h of water immersion and restraint stress (WRS) with or without (A) inhibition of cyclooxygenase (COX)-1 activity by indomethacin and rofecoxib, the selective COX-2 inhibitor, (B) suppression of NO-synthase with L-NNA(20 mg/kg ip), and (C) inactivation by capsaicin(125 mg/kg sc) of sensory nerves with or without intragastric (ig) pretreatment with GSE applied 30 min prior to ethanol or WRS. One hour after ethanol and 3.5 h after the end of WRS, the number and area of gastric lesions were measured by planimetry, the gastric blood flow (GBF) was assessed by H2-gas clearance technique and plasma gastrin levels and the gastric mucosal generation of PGE2, superoxide dismutase (SOD) activity and malonyldialdehyde (MDA) concentration, as an index of lipid peroxidation were determined.
RESULTS: Ethanol and WRS caused gastric lesions accompanied by the significant fall in the GBF and SOD activity and the rise in the mucosal MDA content. Pretreatment wi th GSE (8-64 mg/kg i g) dose-dependently attenuated gastric lesions induced by 100% ethanol and WRS; the dose reducing these lesions by 50% (ID50) was 25 and 36 mg/kg, respectively, and this
protective effect was similar to that obtained with methyl PGE2 analog (5 μg/kg i g). GSE significantly raised the GBF, mucosal generation of PGE2, SOD activity and plasma gastrin levels while attenuating MDA content. Inhibition of PGE2 generation with indomethacin or rofecoxib and suppression of NO synthase by L-NNA or capsaicin denervation reversed the GSE-induced protection and the accompanying hyperemia. Co-treatment of exogenous calcitonine gene-related peptide (CGRP) with GSE restored the protection and accompanying hyperemic effects of GSE in rats with capsaicin denervation.
CONCLUSION: GSE exerts a potent gastroprotective activity against ethanol and WRS-induced gastric lesions via an increase in endogenous PG generation, suppression of lipid peroxidation and hyperemia possibly mediated by NO and CGRP released from sensory nerves.
Key words: Grapefriut-seed extract; Gastroprotection; Gastric blood flow; Superoxide dismutase; Prostaglandin; Calcitonine gene-related peptide
© 2005 The WJG Press and Elsevier Inc. All rights reserved.
Brzozowski T, Konturek PC, Drozdowicz D, Konturek SJ, Zayachivska O, Pajdo R, Kwiecien S, Pawlik WW, Hahn EG.Grapefruit-seed extract attenuatesGrapefruit-seed extract attenuates e t h a n o l - a n d stress-induced g a s t r i c l e s i o n s v i a a c t i v a t i o n o f prostaglandin, nitric oxide and sensory nerve pathways .World J Gastroenterol 2005; 11(41):6450-6458http://www.wjgnet.com/1007-9327/11/6450.asp
INTRODUCTION Grapefruit-seed extract (GSE) containing flavonoids, possesses antibacterial, antiviral and antifungal properties[1-3]. These beneficial actions of GSE have been attributed to the antioxidative activity of grapefruit containing citrous flavonoids such as naringenin[4]. Moreover, grapefruit juice and its major flavonoid exhibited the potent anti-H pylori activity in vitro[5] and was also recently found to exert the cytoprotection against hepatocyte injury induced by algal toxins[6]. In another study, naringenin showed anti-cancer
Tomasz Brzozowski, Peter C Konturek, Danuta Drozdowicz, Stanislaw J Konturek, Oxana Zayachivska, Robert Pajdo, Slawomir Kwiecien, Wieslaw W Pawlik, Eckhart G Hahn
Grapefruit-seed extract attenuates ethanol-and stress-induced gastric lesions via activation of prostaglandin, nitric oxide and sensory nerve pathways
3

activity against human breast cancers[7]. Therapeutic efficacy of citrous fruits such as grapefruits and red grapes has been explained by the content of different classes of polyphenolic flavonoids, that were shown to inhibit platelet aggregation, thus decreasing the risk of coronary thrombosis and myocardial infarction[8]. However, the involvement of grapefruit extracts containing various flavonoids in the mechanism of gastric mucosal defense has been little studied.
Our group demonstrated previously that other flavonoids, namely, meciadanol, a synthetic flavonoid inhibiting histidine decarboxylase (HDC) and decreasing histamine content in the stomach, attenuated gastric mucosal lesions produced by ethanol and aspirin via the mechanism unrelated to gastric acid secretion and endogenous prostaglandins (PG)[9]. Furthermore, naringenin, a major citrous flavonoid, was reported to exhibit gastroprotection against the gastric injury induced by absolute ethanol due to the increase in the mucus secretion and that this gastroprotective effect of naringenin and accompanying increase in the mucus secretion, were, in part, attenuated by indomethacin suggesting the involvement of endogenous PG in the mechanism of this flavonoid-induced gastroprotection[10]. It remains unknown, to what extent GSE influences the gastric mucosal injury induced by topical (ethanol) and non-topical ulcerogens (stress) and, if so, what is the mechanism of gastroprotection induced by GSE. Therefore, using animal models of gastric lesions induced by 100% ethanol and water immersion and restraint stress (WRS), we determined the influence of GSE on gastric lesions and the accompanying changes in the gastric blood flow (GBF) in the rat stomach. An attempt was also made to assess the contribution of gastric acid secretion, plasma gastrin levels, PG/cyclooxygenase (COX)-system, nitric oxide (NO) and sensory nerves in the gastroprotective effect of GSE. Finally, we evaluated the effect of pretreatment with GSE on the gene expression and activity of superoxide dismutase (SOD) and lipid peroxidation, as expressed by malonyldialdehyde (MDA) concentration, in rats with or without the pretreatment with GSE.
MATERIALS AND METHODSMale Wistar rats, weighing 180-220 g and fasted for 24 hbefore the study were employed in all the studies. This study was approved by the Institutional Animal Care and Use Committee of Jagellonian University School of Medicine in Cracow and run in accordance to the statements of European Union regarding handling of experimental animals.
Gastric secretory studies The effects of GSE purchased from Herb-Pharma, Welke Dudince, Slovakia on gastric acid secretion were examined in 40 conscious rats equipped about 1 mo earlier with a gastric fistula (GF) as described previously[11]. The animals were fasted overnight but had free access to water 24 h before the experiment and they were placed in individual
Bollman type cages to maintain the minimum restraint necessary. The GF was opened; the stomach was rinsed gently with about 5 mL of tap water at 37 ℃. The basal gastric secretion was collected for 60 min and GSE was administered i.g. in gradual doses ranging from 8 to 64mg/kg,each dose being administered on a separate test day. In control tests, vehicle (1 mL of saline, i g) was given in the same volume as in tests with GSE and the collection of gastric juice was continued for the final 120 min. The volume and acid concentration of each collected sample of gastric juice were measured and acid outputs was calculated and expressed in terms of micromoles of acid per 30 min[12].
Induction of ethanol and stress lesions and determination of gastric blood flow (GBF)Acute gastric lesions were induced by an intragastric (ig)application of 100% ethanol similarly to the method described previously[11,12]. Briefly, 100% ethanol in a volume of 1.5 mL was administered ig to rats by means of a metal orogastric tube. After 60 min, the animals were lightly anesthetized with ether, their abdomen was opened by the midline incision and stomach exposed for the measurement of GBF by means of using the H2-gas clearance technique as described previously[13]. For this purpose double electrodes of electrolytic regional blood flowmeter (Biotechnical Science, Model RBF-2, Osaka, Japan) were inserted into the gastric mucosa. One of these electrodes was used for the local generation of gaseous H2 and another for the measurement of tissue H2.With this method, the H2 generated locally was carried out by flow of blood, while the polarographic current detector reads out decreasing tissue H2. The tissue H2
clearance curve was used to calculate an absolute flow rate (mL/100 g/min) in the oxyntic area as described previously[13]. The measurements were made in three areas of the mucosa and the mean values of the measurements were calculated and expressed as percent changes of those recorded in the vehicle (saline) treated animals. After the GBF measurement, the stomach was removed, rinsed with water and pinned open for macroscopic examination. The area of necrotic lesions in oxyntic mucosa was determined by computerized planimetry (Morphomat, Carl Zeiss, FRG)[12-14] by the person who did not know to which experimental group the animals belonged.
The WRS was induced in the animals that were placed in restraint cages and immersed vertically to the level of the xiphoid process in a water bath of 23 ℃ for 3.5 h[13,14]. After 3.5 h of WRS, the rats were lightly anesthetized with ether, the abdomen was opened and the stomach was exposed. The GBF was measured in the oxyntic gland area of the stomach by means of local H2-gas clearance method using an electrolytic regional blood flow meter (Biomedical Science, Model RBF-2, Osaka, Japan) as described above. The stomach was removed, opened along the greater curvature and placed flat to count the number of gastric lesions by two investigators, unaware of the treatment given as described in our previous studies[13,14]. The stress lesions were defined as round or linear mucosal defects of at least 0.1 mm in diameter.
Brzozowski T et al. Grapefruit-seed extract in gastroprotection 6451

Animals with sensory denervation induced by capsaicin The role of sensory afferent nerves in mechanism of WRS-induced gastric lesions with or without pretreatment with GSE was determined in rats with or without capsaicin induced deactivation of these nerves. For this purpose the animals were pretreated with capsaicin (Sigma Co., St. Louis, MO, USA) injected s.c. for 3 consecutive days at a dose of 25, 50 and 50 mg/kg for about 2 wk, before the experiment[15,16]. All injections of capsaicin were performed under ether anesthesia to counteract the pain reactions and respiratory impairment associated with injection of this agent. To check the effectiveness of the capsaicin denervation, a drop of 0.1 mg/mL solution of capsaicin was instilled into the eye of each rat and the protective counting movements were counted as described previously[16]. Rats with or without capsaicin-denervation received vehicle or GSE (5-80 mg/kg ig) 30 min prior to exposure to 3.5 h of WRS. At the end of WRS, animals were anesthetized and then the GBF and the number of gastric lesions were measured in a similar manner as mentioned above.
Determination of mucosal generation of PGE2, lipid peroxidation and SOD activity in gastric mucosa exposed to ethanol and WRS with and without GSE In groups of rats exposed to standard 3.5 h of WRS without or with pretreatment with GSE, the mucosal samples from the gastric mucosa were taken by biopsy (about 200 mg) from oxynt ic g land area without mucosal lesions immediately after the animals were killed to determine the mucosal generation of PGE2 by radioimmunoassay (RIA) as described previously[17]. The capability of the mucosa to generate PGE2 was expressed in nanograms of wet tissue weight.
Since lipid peroxidation is a well-established mechanism of cellular injury induced by reactive oxygen metabolites, we measured the changes in the MDA as an indicator of this lipid peroxidation in gastric mucosa[18,19] exposed to WRS without and with the treatment with GSE. For the measurement of lipid peroxidation, the tissue was weighed, transferred to the ice-cooled test tube and homogenized in 400 μL of 20 m mol/L Tris buffer pH 7.4 containing 5 mM butylated hydroxytoluene to prevent new lipid peroxidation that can occur during the homogenization. The homogenate was then centrifuged at 4 oC for 10 min and resulted supernatant (200 μL) was stored in -80 oC until an assay of lipid peroxidation. The content of lipid peroxidation was measured at 37 oC by spectrophotometer at a wave length of 586 nm and compared with the absorbance of purified MDA as the standard.
The activity of SOD was measured in the gastric mucosa of rats exposed to WRS with or without pretreatment with GSE using SOD 525 assay kit (OXIS International, Inc., Portland, USA)[19,20]. The gastric tissue was first washed with 0.9% NaCl containing 0.16 mg/mL heparin to remove red blood cells which may interfere with the SOD activity in the gastric specimens. Then the biopsy sample was blotted on the filter paper, weighed and finally homogenized in 400 μL of PBS buffer pH 7.4
using a tissuemizer Ultra Turax (Janke and Kunkel GmbH and Co., Staufen, Germany). The principle of the SOD measurement is based on the SOD-mediated increase in the rate of auto-oxidation of 5, 6, 6a, 11β-tetrahydro-3,9,10-trihydrobenzoflurene in aqueous solution at 37 oC to yield a chromophore with maximum absorbance at 525 nm. Ethanol-chloroform extraction was employed to inactivate Mn-SOD and Fe-SOD and to ensure that the assay is specific for Cu/Zn-SOD.
Determination of SOD transcripts by reverse transcriptase polymerase chain reaction (RT-PCR) The expression of SOD was determined by RT-PCR in the gastric mucosa of intact rats or following exposure to WRS with or without GSE. Samples of the gastric oxyntic mucosa (about 500 mg) were scraped off on ice using glass slide and then immediately snap frozen in liquid nitrogen, and stored at -80 oC. Total RNA was isolated from the gastric oxyntic mucosa using a rapid guanidinum isothiocyanate/phenol chloroform single step extraction kit from Stratagene (Stratagene GmbH, Heidelberg, Germany)[21,22]. Following precipitation, the RNA was resuspended in RNase-free TE buffer and the concentration was estimated by absorbance at 260 nm wave length. Samples were frozen at -80 oC until analysis.
First strand cDNA was synthesized from total cellular RNA (5 µg) using 200 U Strata Script TM reverse transcriptase (Stratagene GmbH, Heidelberg, Germany) and oligo (dT) primers (Stratagene GmbH, Heidelberg, Germany). After the reverse transcription, the transcriptase activity was destroyed by heating, and the cDNA was stored at -20 oC until PCR.
A 496-bp fragment of SOD was amplified from single-stranded DNA by PCR using two oligonucleotide pr imers to SOD. The SOD sense pr imer was 5 ’CGAGTTATGGCGACGAAG3’ and antisense primer was 5’GTCAGCAGTCACATTGCC3’. The primers for SOD and β-actin were synthesized by Biometra (Gottingen, Germany). Concomitantly, amplification of control rat β-actin (Clon Tech, Palo Alto, CA, USA) (764 bp) was performed on the same samples to verify RNA integrity.
DNA amplification was carried out under the following conditions; denaturation at 94 oC for 1 min, annealing at60 oC for 45 s, and extension at 72 oC for 45 s. The number of amplification cycles was 29 for SOD. Each PCR-product (8 µL) was electrophoresed on 1.5% agarose gel stained with ethidium bromide, and then visualized under UV light. Location of predicted PCR product was confirmed by using a 100-bp ladder (Gibco BRL/Life Technologies, Eggenstein, Germany) as standard marker.
The intensity of bands was quantified in a semi-quantitative manner using densitometry (LKB Ultrascan, Pharmacia, Sweden) as described in detail in our previous studies[22]. Briefly the gel was photographed under UV transillumination. The intensity of PCR products was measured using video image analysis system (Kodak Digital Science). The SOD mRNA signals were standardized against the β-actin mRNA signal for each sample and results were expressed as SOD mRNA/β-actin mRNA ratio.
6452 ISSN 1007-9327 CN 14-1219/ R World J Gastroenterol November 7, 2005 Volume 11 Number 41

caused a signif icant attenuation of WRS-induced gastric damage; the ID50 being 36 mg/kg. The GBF was significantly decreased in rats exposed to 3.5 h of WRS but GSE given 30 min before the exposure of animals to3.5 h of WRS resulted in a dose-dependent rise in the GBF as compared to that obtained in vehicle-treated animals (Figure 2).
Effect of pretreatment with GSE on the gastric mucosal SOD activity and MDA content in gastric mucosa exposed to ethanol or WRSTab le 2 shows the resu l t s o f de te r mina t ion of MDA+4 HNE as an index of lipid peroxidation in the gastric mucosa or rats exposed to ethanol- or WRS without or with GSE pretreatment. The MDA concentration was significantly increased in vehicle-control gastric mucosa exposed to ethanol or WRS as compared to that in the intact gastric mucosa. Pretreatment with GSE applied ig
Statistical analysisResults are expressed as means±SE. The significance of the difference between means was evaluated using analysis of variance followed by Duncan’s test with a level of significance at P < 0.05.
RESULTS Effect of GSE on gastric acid secretion and plasma gastrin levels in rats with chronic GF As shown in Table 1, gastric acid output reached the value of 134±11 μmol/30 min, while fasting plasma gastrin concentration averaged of 53 ± 4 μmol/L in control rats treated with vehicle (saline). GSE applied ig in a dose of 8 mg/kg ig failed to affect significantly the gastric acid output and plasma gastrin levels as compared to those in control animals. GSE applied ig in a dose of 16 mg/kg and higher, produced a significant decrease in the gastric acid output and significantly raised the plasma gastrin levels (Table 1).
Effect of GSE on acute gastric lesions induced by ethanol and WRS Figure 1 shows the effect of topical pretreatment with GSE applied ig in graded concentrations ranging from 8 to 64 mg/kg on the mean area of gastric lesions induced by 100% ethanol and the accompanying changes in the GBF. Ethanol caused typical widespread gastric lesions with an area of 86±5 mm2 and reduced the GBF by about 38% as compared to that in intact gastric mucosa. Pretreatment with GSE applied in the lowest dose of 8 mg/kg, failed to influence the ethanol lesions but starting from the dose 16 mg/kg up to dose of 64 mg/kg of GSE, a dose-dependent reduction in gastric lesions was observed; the dose that inhibits ethanol damage by 50% (ID50) being 28 mg/kg. This protective effect of GSE applied in graded doses against ethanol damage was accompanied by the significant rise in the GBF. The gastroprotective effect of GSE and accompanying increase in the GBF were similar to those achieved by the pretreatment with methyl analog of PGE2 applied 30 min before the application of ethanol.
As shown in Figure 2, the pretreatment with GSE applied topically in a doses ranging from 8 to 64 mg/kg
Table 1 Effect of vehicle (saline) and GSE applied ig in graded concentrations ranging from 8 up to 64 mg/kg on the gastric acid secretion and plasma gastrin levels. Results are mean±SE from 6 determinations on 6–8 animals
Type of test Gastric acid output Plasma gastrin (μmol/30 min) (pmol/L)
Vehicle 134 ± 11 53 ± 4GSE (mg/kg ig)8 131 ± 9 56 ± 616 118 ± 9a 69 ± 8a
32 89 ±7a 75 ± 9a
64 64 ± 5a 82 ± 10a
aP< 0.05 vs vehicle.
Mea
n le
sion
are
a (m
m2 )
GBF
(%co
ntro
l)
80
20
100
60
40
0
GSE(mg/kg i.g.)
16,16dm PGE2
(5μg/kg i.g.) Veh 8 16 32 64
100%Ethanol
80
20
100
60
40
0
a
aa
a
aaa
a
Figure 1 Effect of intragastric (ig) pretreatment with GSE applied in graded doses ranging from 8 mg/kg up to 64 mg/kg or 16,16 dimethyl PGE2 (5 μg/kg ig) on the mean area of gastric lesions induced by ethanol and accompanying changes in the GBF. Results are mean±SE from 6 to 8 animals per group. aP<0.05 vs vehicle (Veh).
Figure 2 Effect of intragastric (ig) pretreatment with GSE applied in graded doses ranging from 8 mg/kg up to 64 mg/kg or 16,16 dimethyl PGE2 (5 μg/kg ig) on the mean number of gastric lesions induced by 3.5 h of WRS and accompanying changes in the GBF. Results are mean ± SE from 6 to 8 animals per group. aP < 0.05 vs vehicle (Veh).
Mea
n le
sion
num
ber
Water immersion and restraint stress
Veh 8 16 32 64 16,16dm PGE2
(5μg/kg ig)
20
10
5
0
15
80
20
100
60
40
0
GSE(mg/kg ig)
a
aa
aa
a
a
a
GBF
(%co
ntro
l)
Brzozowski T et al. Grapefruit-seed extract in gastroprotection 6453

Effect of inhibitors of COX and NOS activity on GSE-induced gastroprotection against WRS induced gastric damage and the alterations in GBFPretreatment with GSE (32 mg/kg ig) significantly reduced gastric lesions induced by WRS in a manner similar to that presented in Figure 2. The ip administration of indomethacin at a dose of 5 mg/kg which inhibited generat ion of endogenous PGE 2 by about 85%, ag g ravated the WRS-induced gastr ic les ions and significantly decreased GBF as compared to the respective values in animals treated with vehicle. Such pretreatment with indomethacin reversed almost completely the protective effect of GSE against WRS-induced lesions and the accompanying increase in the GBF (Figure 3).
The L-NNA, an inhibitor of NO-synthase by itself failed to affect the area of gastric lesions and the fall in the GBF induced by ethanol or WRS (Table 3, Figure 4).Pretreatment with GSE (32 mg/ kg ig) resulted in a significant reduction of ethanol- or WRS-induced gastric damage and significantly decreased the GBF as compared with the respective values attained in rats without GSE administration. Co-treatment with L-arginine (200 mg/kg ig) but not with D-arginine, added to GSE restored the gastroprotection and the accompanying increase in the
Table 3 Effect of GSE with or without pretreatment with NG-nitro-L-arginine (L-NNA 20 mg/kg ip) applied with or without the combination with L-arginine (L-Arg, 200 mg/kg ig) or D-arginine (D-Arg, 200 mg/kg ig) on the area of ethanol-induced gastric lesions and accompanying changes in the GBF. Results are mean±SE of 6–8 rats
aP < 0.05 vs vehicle, cP < 0.05 vs values in respective group without L-NNA, eP < 0.05 vs values in respective group with L-NNA but without L-Arg administration.
Type of test Mean lesion area (mm2) GBF (% control)
Without L-NNA Vehicle 82 ± 5 63 ± 3GSE (32 mg/kg i.g.) 8 ± 1.5a 81 ± 4a
With L-NNAVehicle 88 ± 4 58 ± 3GSE (32 mg/kg i.g.) 76±3c 66 ± 5c
L-Arg (200 mg/kg i.g.) +GSE (32 mg/kg i.g.) 12 ± 2c 79 ± 3c
D-Arg (200 mg/kg i.g.) +GSE (32 mg/kg i.g.) 72 ± 4 69 ± 3
Table 4 The number of WRS-induced gastric lesions and accompanying changes in the GBF in rats treated with vehicle and GSE (32 mg/kg i.g.) without or with capsaicin denervation. Means±SE of 6–8 rats
aP < 0.05 vs vehicle, cP < 0.05 vs corresponding values obtained in animals without capsaicin denervation, eP < 0.05 vs corresponding values obtained in animals with capsaicin denervation without CGRP treatment.
Type of test Mean lesion number GBF (% control)
3
Without capsaicin denervation Vehicle 18 ± 3 67 ± 4GSE (32 mg/kg ig) 8 ± 1.5a 78 ± 3a
With capsaicin denervationVehicle 28 ± 4b 54 ± 3b
GSE (32 mg/kg ig) 16 ± 3b 64 ± 4b
CGRP (10 μg/kg sc) +GSE (32 mg/kg ig) 9 ± 1.3c 74 ± 3c
in a dose 16 mg/kg or higher, significantly attenuated the MDA concentration in animals exposed to ethanol or WRS (Table 2). The mucosal SOD activity was inhibited in the gastric mucosa of animals exposed to ethanol or WRS as compared to the respective value in intact gastric mucosa (Table 2). In contrast, the pretreatment with GSE applied in i.g. in graded doses ranging from 8 up to 64 mg/kg,which caused a significant attenuation of the damage induced by ethanol or WRS, dose-dependently reversed the deleterious effect of ethanol or WRS on the SOD activity and significantly counteracted the ethanol and WRS-induced rise in the MDA content (Table 2).
Table 2 Effect of vehicle (saline) and GSE applied i.g. in graded concentrations ranging from 8 mg/kg up to 64 mg/kg on the MDA concentration and SOD activity in the gastric mucosa in rats exposed to 100% ethanol or those subjected to 3.5 h of WRS. Results are mean±SE from 6 determinations on 6–8 animals
aP < 0.05 vs intact, cP < 0.05 vs vehicle+ethanol or vehicle+WRS.
Type of test MDA concentration SOD activity (nmol/g) (unit/g)Intact 0.5 ± 0.02 733 ± 43 Vehicle+ethanol 14.8 ± 2.3a 425 ± 32a
Vehicle+WRS 16.8 ± 2.3a 425 ± 32a
GSE (mg/kg i.g.)+ethanol8 13.7 ± 2.3 438 ± 3716 10.4 ± 2.8c 549 ± 38c
32 8.3 ± 0.9c 675 ± 40c
64 6.6 ± 0.7c 695 ± 43c
GSE (mg/kg i.g.)+WRS 8 15.7 ± 2.6c 438 ± 37c
16 13.4 ± 2.3c 549 ± 38c
32 10.3 ± 1.9c 675 ± 40c
64 8.6 ± 0.8c 695 ± 43c
6454 ISSN 1007-9327 CN 14-1219/ R World J Gastroenterol November 7, 2005 Volume 11 Number 41
GBF induced by this extract in L-NNA treated animals. Capsaicin-denervation which by themselves aggravated
ethanol- and WRS-induced gastric damage significantly attenuated the GSE-induced protection and hyperemia against lesions induced by ethanol or WRS (Table 4, Figure 5). Co-administrat ion of calcitonine gene-related peptide (CGRP) with GSE in rats with capsaicin-denervation restored the protective and hyperemic effects of this extract against ethanol- and WRS-induced gastric lesions. Gastric mucosal expression of mRNA for SOD in ethanol-treated rats with or without pretreatment with GSE As shown in Figure 6, mRNA for SOD was detected by RT-PCR as a strong signal in the gastric mucosa of vehicle-control animal not treated with ethanol. In contrast, the signal for the SOD mRNA in the gastric mucosa of ethanol-treated rats was faint. The ratio of SOD mRNA

Figure 3 Effect of GSE (32 mg/kg ig) on the mean number of WRS-induced gastric lesions and accompanying alterations in the gastric mucosal PGE2 generation and GBF in rats with or without the pretreatment with indomethacin (5mg/kg ip) or rofecoxib (10 mg/kg ig). Results are mean±SE from 6 to 8 animals per group. aP<0.05 vs vehicle (Veh), cP<0.05 vs respective values in animals without indomethacin or rofecoxib pretreatment.
Water immersion and restraint stress
Mea
n le
sion
num
ber
GBF
(%co
ntro
l)
Veh GSE
(32 mg/kg ig)
GSE (32 mg/kg ig)
ab
L-ARGVeh GSEGSE
(200 mg/kg ig)(32 mg/kg i.g.)
+L-NNA (20 mg/kg ip)
a
b
c
c
0
15
25
20
5
90
15
0
30
60
45
75
10
Figure 4 Effect of GSE (32 mg/kg i.g.) on the mean number of WRS-induced gastric lesions and accompanying alterations in the GBF in rats with or without the pretreatment with L-NNA (20 mg/kg i.p.). Results are mean ±SE from 6-8 animals per group. aP < 0.05 vs vehicle (Veh), bP < 0.01 vs respective values in animals without L-NNA administration, cP < 0.05 vs respective values in animals treated with L-NNA. vs vehicle (Veh), bP < 0.01 vs respective values in animals without indomethacin or rofecoxib pretreatment.
Mea
n le
sion
num
ber
GBF
(%co
ntro
l)
Water immersion and restraint stress
Veh GSE GSEVehGSEVeh(32mg/kg ig)(32mg/kg ig)
+ROFECOXIB(10mg/kg ip)
+Indomethacin(5mg/kg ip)
(32mg/kg ig)
PGE2
(ng/
g)
50 90
0
15
0
30
60
45
75
20
40
30120
60
180
10
a
a
cc
c
b
c c
c
c
cc
vb
c
a
Figure 5 Effect of GSE (32 mg/kg ig) on the mean area of ethanol-induced gastric lesions and accompanying alterations in the GBF in rats with or without capsaicin inactivation of sensory nerves. Results are mean±SE from 6–8 animals per group. aP < 0.05 vs vehicle (Veh), bP < 0.01 vs respective values in animals without capsaicin denervation, cP < 0.05 vs respective values in animals with capsaicin denervation. administration, cP < 0.05 vs respective values in animals treated with L-NNA. vs vehicle (Veh), bP < 0.01 vs respective values in animals without indomethacin or rofecoxib pretreatment.
(32 mg/kg ig)Veh GSE
Mea
n le
sion
num
ber
GBF
(%co
ntro
l)
a
c
+Capsaicin denervation
100%Ethanol
(32 mg/kg ig)Veh GSE CGRP
10μg/kg sc
5030
0
125
75
100
25
90
60
b
b
bb
c
0
a
Brzozowski T et al. Grapefruit-seed extract in gastroprotection 6455
over β-actin mRNA was significantly decreased in ethanol-treated animals as compared to those treated with vehicle only. SOD mRNA was strongly expressed in animals pretreated with various doses of GSE (16-64 mg/kg ig) before the ethanol application. The ratio of mRNA for SOD over the β-actin mRNA was significantly increased in gastric mucosa of rats pretreated with graded doses of GSE as compared to that attained in vehicle-pretreated rats that were given ethanol.
DISCUSSIONThis study shows that GSE attenuates the lesions in the rat stomach by the intragastric application of noxious agent such as ethanol or those caused by stress and that this protective effect of GSE is accompanied by the increase in the GBF and SOD expression and its activity and reduction of MDA concentration, that is widely considered as an index of lipid peroxidation. The inhibition of acid-dependent lesions caused by WRS can be attributed to the inhibition of acid secretion by this compound as observed in this study using well-conditioned and fully adapted GF rats. This protective and hyperemic activity of GSE against WRS ulcerogenesis was abolished by COX inhibitors such as indomethacin and rofecoxib and significantly reduced by L-NNA. Thus, we conclude that GSE containing citrous flavonoids exerts a potent gastroprotective activity against ethanol- and WRS-induced gastric lesions and this protective effect in the stomach may involve endogenous PG derived from COX-1 and COX-2 activity, suppression of lipid peroxidation and gastric hyperemia mediated by NO and neuropeptides released from afferent sensory nerves.
Previous studies documented that grapefruit seeds are the major depository for limonoids (triterpenoid dilactones chemically related to limonin) of these 77% are neutral while 2% are acidic limonoids[1-3]. Grapefruit contains also many flavonoids that includes glycosides, naringenin, quercetin, kaempferol, hesperetin and apigenin being the most abundant among their aglycones[4]. GSE, containing flavonoids, has been shown to possess antibacterial, antiviral and antifungal properties[2,3]. This beneficial action of GSE was attributed to the antioxidative activity of grapefruit containing citrus flavonoids[4,23], since, for instance, these flavonoids were found to exhibit the potent

SOD
mRN
A/β-
actin
mRN
A
16Veh
GSE (mg/kg ig)
bb
b
a
6432
+100%E thanol
0.4
0.8
1.2
0
Figure 6 Determination of SOD mRNA (left panel) by RT-PCR and by ratio of SOD mRNA over β-actin (right panel) in the vehicle-control intact gastric mucosa (lane 1) and in those treated with GSE given i.g. in graded doses of 16 mg/kg (lane 2), 32 mg/kg (lane 3) and 64 mg/kg (lane 4) prior to the exposure to ethanol, M-DNA size marker, NC-negative control. Mean±SE of 4–6 rats. aP < 0.05 vs vehicle (Veh), bP < 0.01 vs ethanol alone group. cP < 0.05 vs respective values in animals with capsaicin denervation. administration, cP < 0.05 vs respective values in animals treated with L-NNA. vs vehicle (Veh), bP < 0.01 vs respective values in animals without indomethacin or rofecoxib pretreatment.
β-actin
(476 bp)
SOD(496 bp)
M 54321 NC
6456 ISSN 1007-9327 CN 14-1219/ R World J Gastroenterol November 7, 2005 Volume 11 Number 41
anti-H pylori activity in vitro[5,24]. Furthermore, grapefruit containing flavonoids were also recently implicated in cytoprotection against injury induced by algal toxins in isolated hepatocytes[6,25]. Interestingly, GSE in a formulation of Citricidal, was demonstrated to be effective against more than 800 bacterial and vital strains, 100 strains of fungus and a large number of single or multicelled parasites[1]. These antimicrobiological properties against a wide range of Gram-negative and Gram-positive organisms were attributed to the disruption by GSE of the bacterial membrane and the subsequent liberation by this extract of the bacterial cytoplasmic contents within a relatively short time (e.g. 15-20 min). In a similar report, it was reported that GSE-induced antimicrobial action is comparable to that of proven antibacterials[2]. Moreover, naringenin, the bioactive component of GSE, showed anti-cancer activity against human breast cancers[7,26]. The underlying mechanism of the therapeutic efficacy of citrus fruits such as grapefruits and red grapes seems to depend upon the presence of different classes of polyphenolic flavonoids that were shown to inhibit platelet aggregation, thus decreasing the risk of coronary thrombosis and myocardial infarction[27-30].
The involvement of GSE in the mechanism of gastric mucosal defense against the formation of gastric lesions caused by obnoxious substances has been little studied. Herein, we provide evidence that GSE applied topically caused dose-dependent diminution of acute gastric lesions induced by both, 100% ethanol and WRS. Previous studies demonstrated that the damaging action of ethanol and WRS could be attributed to the enhancement in the reactive oxygen substances (ROS) and the ROS-dependent increase in the lipid peroxidation and inhibition of antioxidizing enzyme activity[18,19,21]. We found that
GSE dose-dependently attenuated the rise in MDA content in the gastric mucosa injured by ethanol or WRS indicating that this extract can attenuate the process of lipid peroxidation implicated in the pathogenesis of ethanol and WRS-induced gastric damage[18,19]. Moreover, we have demonstrated that ethanol decreased the gene expression and activity of SOD in the gastric mucosa suggesting that the suppression of key mucosal antioxidizing enzyme along with the elevation of lipid peroxidation, play an important role in the pathogenesis of these lesions. This increase in the mucosal lipid peroxidation as well as the fall in SOD expression and its activities were attenuated by GSE, suggesting that the reduction in lipid peroxidation by this seed extract may contribute to the attenuation of the deleterious effect of noxious agents on the gastric mucosa. This is supported by the fact that the GBF was elevated and gastric PGE2
production were enhanced in animals treated with GSE as compared to those treated with vehicle. Our finding is in accordance with observations that some flavonoids stimulated PGE2 production by isolated gastric mucosal cells while suppressing gastric acid secretion via direct inhibitory effect on H+/K+-ATPase activity[24]. It is not concluded that NO/NOS system is also involved in gastroprotection against ethanol and WRS caused by GSE because both, GSE-induced protection and hyperemia were counteracted by L-NNA, a non-specific inhibitor of NO-synthase and this effect was restored in these animals by the combined treatment with L-arginine and GSE. Thus, our study implies that some natural products of the citrous fruits such as GSE, afford protection against ethanol and stress-induced gastric damage due to

Brzozowski T et al. Grapefruit-seed extract in gastroprotection 6457
endogenous PG and the preservation of expression and activity of a major antioxidizing enzyme such as SOD.
The mechanism of gastroprotective activity of GSE appears to be dependent on endogenous PG and the functional activity of sensory nerves releasing CGRP. This notion is supported by our findings that indomethacin, a non-selective inhibitor of COX-1 and COX-2 activity or functional ablation of sensory afferent nerves by capsaicin reversed GSE-induced protection and accompanying hyperemia. In addition, co-treatment of exogenous CGRP with GSE, administered to replace the deficit of this peptide in capsaicin-treated animals, restored the protective efficacy of GSE. Interestingly, rofecoxib which is a highly selective COX-2 inhibitor[17], also attenuated the gastroprotective and hyperemic activities of GSE suggesting the involvement of COX-2 derived products in the gastroprotection and increase in the GBF induced by this extract. Further studies assessing the mRNA expression of COX-1 and COX-2 in GSE-treated mucosa should reveal which enzymatic pathway is involved in aforementioned effects of this extract.
This gastroprotective activity of the GSE could be attributed to naringenin, a major GSE flavonoid, because this flavonoid was reported to exhibit gastroprotection against the gastric injury induced by absolute ethanol, predominant ly due to the increase in the mucus secretion[10]. It is of interest that this gastroprotective effect of naringenin and accompanying increase in the mucus secretion, were, in part, attenuated by indomethacin, supporting the contribution of endogenous PG to the mechanism of gastroprotection by grapefruit products[10]. As shown in our present study, GSE by itself enhanced the gastric mucosa generation of PGE2 but our unpublished evidence indicates that this extract can be also effective against aspirin-induced gastric lesions under the conditions, where PG generation is completely suppressed. Therefore, it seems likely, that endogenous PG might not be primary mediators of this protection and other gastroprotective factors such as NO and/or neuropeptides released from sensory afferent nerves could be involved. This was the reason for carrying out the study with L-NNA, a potent NO-synthase inhibitor and with capsaicin, applied in a dose that causes functional ablation of sensory nerves releasing vasoactive neuropeptides such as CGRP. We found that L-NNA and capsaicin denervation inhibited the GSE-induced protection against ethanol- and WRS-induced gastr ic lesions and accompanying gastr ic mucosal hyperemia. Our study militates against PG as the primary mediator in the mechanism of GSE-induced gastroprotection and this remains in accordance with our previous report that meciadanol, the synthetic flavonoid inhibiting the activity of HDC, prevented the ethanol- and aspirin-induced injury in rat stomach without altering the mucosal generation of prostacyclin (PGI2)[9].
Another candidate involved in the GSE-induced protection could be gastrin, which is known to exhibit both, gastroprotective and hyperemic activities[11]. Indeed, we addressed this issue by direct determination of the plasma gastrin levels by specific RIA and we found that
gastrin is elevated in GSE-treated animals. This effect could be secondary to the inhibition of gastric acid secretion caused by this compound as demonstrated in our study by the administration of GSE to the chronic, well-adapted rats with chronic GF. Suppression of gastric secretion by GSE might contribute to the protective activity of this extract against WRS, because WRS damage depends upon gastric acidity and becomes exaggerated by acidic conditions in the stomach.
In summary, we have demonstrated in this report that the pretreatment with GSE reduces the ethanol and WRS-induced gastric damage through the preservation of the antioxidizing enzyme (SOD) activity, reduction of free radical-dependent lipid peroxidation, enhancement in the GBF and plasma gastrin levels. Endogenous PG appears to be important mediator of this protection, but other mediators such as NO and neuropeptides released from sensory nerves such as CGRP could be also involved in the gastroprotective and hyperemic activities of this extract. No study, so far has been undertaken to examine the ulcer healing efficacy of GSE, but the fact that this grapefruit seed extract exerts a potent anti-H pylori in vitro[30] and profound gastroprotective effects in laboratory animals warrants a further approach for its potential application in healing of chronic ulcerations in human beings.
REFERENCES1 Heggers JP, Cottingham J, Gusman J, Reagor L, McCoy L, Ca-
rino E, Cox R, Zhao JG. The effectiveness of processed grape-fruit-seed extract as an antibacterial agent: II. Mechanism of action and in vitro toxicity. J Altern Complement Med 2002; 8: 333-340
2 Reagor L, Gusman J, McCoy L, Carino E, Heggers JP. The ef-fectiveness of processed grapefruit-seed extract as an antibac-terial agent: I. An in vitro agar assay. J Altern Complement Med 2002; 8: 325-332
3 Proteggente AR, Pannala AS, Paganga G, Van Buren L, Wag-ner E, Wiseman S, Van De Put F, Dacombe C, Rice-Evans CA. The antioxidant activity of regularly consumed fruit and veg-etables reflects their phenolic and vitamin C composition. Free Radic Res 2002; 36: 217-233
4 Tirillini B. Grapefruit: the last decade acquisitions. Fitoterapia 2000; 71 Suppl 1: S29-S37
5 Bae EA, Han MJ, Kim DH. In vitro anti-Helicobacter pylori activity of some flavonoids and their metabolites. Planta Med 1999; 65: 442-443
6 Blankson H, Grotterød EM, Seglen PO. Prevention of toxin-induced cytoskeletal disruption and apoptotic liver cell death by the grapefruit flavonoid, naringin. Cell Death Differ 2000; 7: 739-746
7 So FV, Guthrie N, Chambers AF, Moussa M, Carroll KK. In-hibition of human breast cancer cell proliferation and delay of mammary tumorigenesis by flavonoids and citrus juices. Nutr Cancer 1996; 26: 167-181
8 Keevil JG, Osman HE, Reed JD, Folts JD. Grape juice, but not orange juice or grapefruit juice, inhibits human platelet aggre-gation. J Nutr 2000; 130: 53-56
9 Konturek SJ, Kitler ME, Brzozowski T, Radecki T. Gastric protection by meciadanol. A new synthetic flavonoid inhibit-ing histidine decarboxylase. Dig Dis Sci 1986; 31: 847-852
10 10Motilva V, Alarcón de la Lastra C, Martín MJ. Ulcer-protecting effects of naringenin on gastric lesions induced by ethanol in rat: role of endogenous prostaglandins. J Pharm

Pharmacol 1994; 46: 91-94 11 Konturek SJ, Brzozowski T, Bielanski W, Schally AV. Role of
endogenous gastrin in gastroprotection. Eur J Pharmacol 1995; 278: 203-212
12 12 Brzozowski T, Konturek SJ, Kwiecień S, Pajdo R, Droz-dowicz D, Sliwowski Z, Muramatsu M. SU- 840, a novel synthetic flavonoid derivative of sophoradin, with potent gas-troprotective and ulcer healing activity. J Physiol Pharmacol 1998; 49: 83-89
13 Brzozowski T, Konturek PC, Sliwowski Z, Drozdowicz D, Hahn EG, Konturek SJ. Importance of nitric oxide and capsaicin-sensitive afferent nerves in healing of stress lesions induced by epidermal growth factor. J Clin Gastroenterol 1997; 25 Suppl 1: S28-S38
14 14Konturek SJ , Brzozowski T, Konturek PK, Majka J, Dembiński A. Role of salivary glands and epidermal growth factor (EGF) in gastric secretion and mucosal integrity in rats exposed to stress. Regul Pept 1991; 32: 203-215
15 15Holzer P, Livingston EH, Saria A, Guth PH. Sensory neu-rons mediate protective vasodilatation in rat gastric mucosa. Am J Physiol 1991; 260: G363-G370
16 16Brzozowski T, Konturek SJ, Sliwowski Z, Pytko-Polończyk J, Szlachcic A, Drozdowicz D. Role of capsaicin-sensitive sensory nerves in gastroprotection against acid-independent and acid-dependent ulcerogens. Digestion 1996; 57: 424-432
17 Brzozowski T, Konturek PC, Konturek SJ, Sliwowski Z, Dro-zdowicz D, Stachura J, Pajdo R, Hahn EG. Role of prostaglan-dins generated by cyclooxygenase-1 and cyclooxygenase-2 in healing of ischemia-reperfusion-induced gastric lesions. Eur J Pharmacol 1999; 385: 47-61
18 Kwiecień S, Brzozowski T, Konturek SJ. Effects of reactive oxygen species action on gastric mucosa in various models of mucosal injury. J Physiol Pharmacol 2002; 53: 39-50
19 Kwiecień S , Brzozowski T, Konturek PC, Pawlik MW, Pawlik WW, Kwiecień N, Konturek SJ. The role of reactive oxygen species and capsaicin-sensitive sensory nerves in the pathomechanisms of gastric ulcers induced by stress. J Physiol Pharmacol 2003; 54: 423-437
20 Kwiecień S, Brzozowski T, Konturek PC, Pawlik MW, Pawlik
Science Editor Guo SY Language Editor Elsevier HK
6458 ISSN 1007-9327 CN 14-1219/ R World J Gastroenterol November 7, 2005 Volume 11 Number 41
WW, Kwiecień N, Konturek SJ. Gastroprotection by pentoxy-Gastroprotection by pentoxy-filline against stress-induced gastric damage. Role of lipid peroxidation, antioxidizing enzymes and proinflammatory cytokines. J Physiol Pharmacol 2004; 55: 337-355
21 Brzozowski T , Konturek P, Konturek SJ, Kwiecień S, Sliwowski Z, Pajdo R, Duda A, Ptak A, Hahn EG. Implications of reactive oxygen species and cytokines in gastroprotection against stress-induced gastric damage by nitric oxide releasing aspirin. Int J Colorectal Dis 2003; 18: 320-329
22 Konturek PC, Duda A, Brzozowski T, Konturek SJ, Kwiecien S, Drozdowicz D, Pajdo R, Meixner H, Hahn EG. Activation of genes for superoxide dismutase, interleukin-1beta, tumor necrosis factor-alpha, and intercellular adhesion molecule-1 during healing of ischemia-reperfusion-induced gastric injury. Scand J Gastroenterol 2000; 35: 452-463
23 Lee YS, Reidenberg MM. A method for measuring naringeninA method for measuring naringenin in biological fluids and its disposition from grapefruit juice by man. Pharmacology 1998; 56: 314-317
24 Beil W, Birkholz C, Sewing KF. Effects of flavonoids on pari-etal cell acid secretion, gastric mucosal prostaglandin produc-tion and Helicobacter pylori growth. Arzneimittelforschung 1995; 45: 697-700
25 Kanno S, Shouji A, Asou K, Ishikawa M. Effects of naringin on hydrogen peroxide-induced cytotoxicity and apoptosis in P388 cells. J Pharmacol Sci 2003; 92: 166-170
26 Guthrie N, Carroll KK. Inhibition of mammary cancer by citrus flavonoids. Adv Exp Med Biol 1998; 439: 227-236
27 Nijveldt RJ, van Nood E, van Hoorn DE, Boelens PG, van Norren K, van Leeuwen PA. Flavonoids: a review of probable mechanisms of action and potential applications. Am J Clin Nutr 2001; 74: 418-425
28 Folts JD. Potential health benefits from the flavonoids in grape products on vascular disease. Adv Exp Med Biol 2002; 505: 95-111
29 Osman HE, Maalej N, Shanmuganayagam D, Folts JD. Grape juice but not orange or grapefruit juice inhibits platelet activity in dogs and monkeys. J Nutr 1998; 128: 2307-2312
30 Borrelli F, Izzo AA. The plant kingdom as a source of anti-ulcer remedies. Phytother Res 2000; 14: 581-591

PO Box 2345, Beijing 100023, China World J Gastroenterol 2005;11(41):6459-6465www.wjgnet.com World Journal of Gastroenterology ISSN [email protected] © 2005 The WJG Press and Elsevier Inc. All rights reserved.E L S E V I E R
• BASIC RESEARCH•
Neutrophil engagement and septic challenge in acute experimental pancreatitis in rats
Stanisław Hać, Marek Dobosz, Jan J Kaczor, Robert Rzepko, Ewa Aleksandrowicz-Wrona, Zdzisław Wajda, Zbigniew Śledziński, Jacek Krajewski
Stanisław Hać, Zbigniew Śledziński, Jacek Krajewski, Department of General Endocrine and Transplant Surgery, Medical University of Gdańsk, PolandMarek Dobosz, Department of General and Gastroenterological Surgery, St. Vincent a’ Paulo Hospital of Gdynia, PolandJan J Kaczor, Department of Bioenergetics, J. Śniadecki University School of Physical Education in Gdańsk, PolandRobert Rzepko, Department of Pathomorphology, Medical University of Gdańsk, PolandEwa Aleksandrowicz-Wrona, Department of Clinical Nutrition, Medical University of Gdańsk, PolandZdzisław Wajda, II Department of General Gastroenterological and Endocrinological Surgery Medical University of Gdańsk, PolandSupported by the grant from Medical University of Gdańsk, PolandCorrespondence to: Stanisłasw Hać, MD, PhD, Department of General Endocrine and Transplant Surgery, Medical University of Gdańsk, 7 Dębinki Street, Gdańsk 80-952, Poland. [email protected]: +48-58-3492410 Fax: +48-58-3492410Received: 2005-03-07 Accepted: 2005-04-04
AbstractAIM: To invest igate the inf luence of neutrophi l adhesion molecule blockade with monoclonal antibody (MoAb CD11b) and E. coli lipopolysaccharide (LPS) administration on experimental acute pancreatitis (AP).
METHODS: AP was induced by four ip injections of cerulein (Cn) at 1-h intervals. MoAb CD 11b and LPS were administered at the beginning of the experiment.
RESULTS: The neutrophil count and chemiluminescence were diminished at the beginning of AP. The oxidative stress parameters were found within the pancreatic gland. MoAb CD 11b used for AP resulted in a significant reduction of pancreatic infiltration and pancreatitis oxidative stress parameters. Serum interleukin-6 (IL-6) was not detected in AP animals, whereas high serum IL-6 concentration was noted only in animals receiving LPS.
CONCLUSION: Neutrophils are involved in pancreatic damage in the early stage of AP. Neutrophil infiltration reduction protects the pancreatic gland from destruction during AP. LPS does not change the early course of Cn pancreatitis in rats.
© 2005 The WJG Press and Elsevier Inc. All rights reserved.
Key words: Acute pancreatitis; Polymorphonuclear cells; Immunomodulation; Septic shock
Hać S, Dobosz M, Kaczor JJ, Rzepko R, Aleksandrowicz-Wrona E , Wa jda Z , Ś l edz ińsk i Z , K ra jewsk i J . Neutrophil engagement and septic challenge in acute experimental pancreatitis in rats. World J Gastroenterol; 2005;11(41):6459-6465http://www.wjgnet.com/1007-9327/11/6459.asp
INTRODUCTIONAcute pancreatitis (AP) is an insidious disease. Almost 75% of patients suffer from the mild edematous form of AP. About 25% of patients develop the severe disease with a mortality rate of 30-60%. The reasons of two different courses still remain unclear. One of the discussed reasons of organ dysfunction complicating AP is excessive leukocyte activation. Activation of inflammatory mediators [interleukins, leukotrienes, TNF-α, PAF, and lipopolysaccharide 9LPS)] within the pancreas may result in excessive damage within the pancreas, peripancreatic tissue or even distant organs[1-3]. The suggestion of neutrophil deteriorating role in human AP has largely been suggested. LPS, presented in the Gram-negative bacterial wall, has been studied extensively as an inflammatory stimulating factor contributing to the pathophysiology of conversion from mild to severe form of AP[4-6]. The pathophysiology of inflammatory process in AP leads to the immunomodulation concept. The idea is one of the most promising treatment options in AP nowadays. The early polymorphonuclear (PMN) requirement is well documented in AP. The aim of this study was to investigate the PMN activation in the early stage of experimental cerulein (Cn) AP and the influence of mAb against adhesion molecule CD 11b on inflammatory response of the disease. Besides, whether LPS aggravated the early experimental AP in rats was also examined. The hypothesis of early aggravation of AP by LPS challenge was investigated.
MATERIALS AND METHODSThe study was performed on male Wistar rats (180-200 g) that were kept on standard rat chow and fasted overnight before the experiment, but with free access to water. AP was induced by four ip injections of Cn at a dose of 15 μg/kg (Sigma Chemical Co., St. Louis, USA) in 1 mL

6460 ISSN 1007-9327 CN 14-1219/ R World J Gastroenterol November 7, 2005 Volume 11 Number 41
of saline at 1-h intervals. MoAb CD 11b (POLATOM Świerk, Poland) was given iv once at the beginning of the experiment at a dose of 1 mg/kg. LPS (Sigma Chemical Co., St. Louis, USA) was administered ip at a dose of 10 mg/kg, simultaneously with the first Cn injection. Control animals were injected intravenously with an adequate volume of 0.9% saline solution. Five and nine hours from the beginning of the experiment, rats were anesthetized with sodium pentobarbital (25 mg/kg ip) and thoracolaparotomy was performed. Blood was aspirated into the test tubes on 30 U/mL heparin from left ventricle, the pancreas was excised, and animals were killed by exsanguinations. Pancreas specimen was taken for light microscopy and for determination of malonyldialdehyde (MDA), total sulfhydryl groups (SH) and myeloperoxidase (MPO). The study protocol was approved by The Local Ethic Committee for the Use of Experimental Animals of Medical University (Protocol No. 22/71). Animals were divided into seven groups: group 1 (n = 14) control, group 2 (n = 16) AP, group 3 (n = 11) AP+MoAb CD 11b, group 4 (n = 11) AP+LPS, group 5 (n = 8) AP+MoAb CD 11b+LPS, group 6 (n = 8) MoAb CD 11b, group 7 (n = 11) LPS.
Whole blood chemiluminescence (CL) assayCL assay was performed in 1:200 diluted heparinized whole blood (30 IU/mL) to reduce artefacts. Diluent was prepared with PBS mixed with calcium and magnesium chloride (Biomed, Poland) and glucose (0.1%). Granulocyte CL was started by the phorbol-12-myristate-13-acetate (PMA, ICN Biomedicals Inc., USA). PMA (1 mg) was diluted with 1 mL dimethyl-sulfoxide (DMSO, Sigma) to the final concentration of 1.6×10⁻³ mol/L. PMA solution was diluted with PBS to the final concentration of1.6×10-6 mol/L just before the measurement. Luminol solution was prepared with 1.77 mg dry substance (ICN Biomedicals Inc., USA) combined with 1 mL 0.4% NaOH and filled to 3 mL with PBS to obtain 3×10⁻⁵ mol/L concentration.
Chemiluminescence measurementTransparent tubes containing 100 µL heparinized whole blood diluted 1:20 with PBS, 200 µL luminol( 3×10 - 5 mo l/L ) , 500 µL PBS and 200 µL PMA(1.6×10⁻⁵ mol/L) were analyzed in a FB 12 luminometer (Berthold Detection Systems, Germany) at 460-nm light length. The measurement was carried out at 10-s intervals for 20 min. All reagents were kept at 22℃ during the procedure. The CL intensity was calculated in relative light units (RLU) per 2 000 of whole blood PMN cel ls, per minute (RLU/2 000 PMN ×min).
Serum polymorphonuclear elastase (PMN-E)T he measurement was ca r r i ed out on the bas i s of commerc ia l ELISA method (PMN-E, K6840 Immundiagnostic GmbH, Germany). PMN-E serum concentration was expressed as nanogram per milliliter.
Pancreatic myeloperoxidase (MPO)A part of the pancreatic gland (at least 0.3 g wet mass) was
taken during the laparotomy. The tissue was homogenized (Porter-Elvenheim ) immediately at 4 ℃ with PBS(pH 7.4). The volume of PBS was adequate to obtain 5% homogenate solution. Then the sample was centrifuged at 2 400 r/min for 10 min at 4 ℃. The supernatant was taken for MPO, SH and MDA measurements. Two milliliters of the supernatant was mixed with 0.5 mL of 0.1% phenyl-methyl-sulfo-fluoride (Sigma Chemicals Co.) and 0.5 mL of 0.5% cetrimide (Merck). The mixture was centrifuged again at 2 400 r/min at 4 ℃. MPO was measured using the ELISA method (Immundiagnostic GmbH, Germany). Pancreatic MPO concentration was expressed as nanogram per one gram of protein.
Sulfhydryl groups (-SH) and malonyldialdehyde (MDA) in pancreatic homogenateA total of 300 µL of pancreatic homogenate was diluted with sodium phosphate buffer (10 mmol/L) pH 8.0 to obtain 2.5% proteins concentration. Then 300 µL of sodium dodecyl sulfate (10%) was added to the sample to dissolve proteins in order to expose hidden sulfhydryls. Two thousand and four-hundred-microliter PBS was added, mixed and the absorbance was measured at 412 nm(Cecil Super Aquarius CE 9200). Then 300 µL of DTNB was added into the extract or 300 µL of PBS as blank to the reference mixture. Samples were incubated at 37 °C in a water bath for 1 h. The absorbance was measured again. The concentration of SH groups was expressed as nanomole per milliliter. MDA content was measured by spectrophotometer (LPO-586 Test Kit) assay (OxisResearch, Portland, USA), 600 µL of supernatant was mixed with 1 950 µL of R1(10.3 nmol/L N-methyl-2-phenylindole solved in acetonitrile) and 450 µL 37% HCl. Samples were incubated in a water bath at 45 °C for 1 h, and then centrifuged at 3 500 r/min for 10 min. The absorbance of the supernatant was measured at 586 nm (Cecil Super Aquarius CE 9200).
Plasma α-amylase and lipase activityThe activity of α-amylase was measured using commercial kit RTU 63116 (BioMerieux). Lipase act ivity was determined using commercial kit Lipase Color 63109 (BioMerieux) in units per liter.
Microscopic findings within the pancreatic glandHematoxylin-eosin standard staining was performed. An experienced pathologist performed the light microscopic examination. All samples were estimated with 200× magnification. Edema, vacuolization and necrosis of pancreatic cells were established in modified Spormann scale (0-3 points each parameter). PMN infiltration within the pancreatic parenchyma was calculated as mean number of neutrophils in 10 consecutive microscopic fields by a “blinded” pathologist.
Whole WBC countWhole WBC and neutrophils were counted in Bürker’s camera following 1∶200 dilution with Türk’s solution.

Hać S et al. Neutrophils in acute pancreatitis 6461
CD 11b given before AP induction significantly increase WBC/PMN count in peripheral blood (from 2 204/614 to 3 942/2315 after 5 h of observation and from 4 225/1 286 to 4 037/1 120 cells/µL after 9 h of observation). LPS in AP group diminished peripheral WBC count 5 h after AP, while ameliorated their count 9 h after AP induction. LPS given with MoAb CD 11b in AP resulted in a time-dependent decrease of WBC count. MoAb CD 11b given to healthy animals did not change WBC count significantly. LPS given to healthy animals gradually reduced WBC count (Table 1).
Oxidative stress parameters within pancreatic tissueSulfhydryl (-SH) compounds and malonyldialdehyde (MDA) concentration in pancreatic homogenate The concentration of (-SH) groups in pancreatic homogenate reduced from 60.3 nmol/mg protein in control group to 40.2 nmol/mg protein in AP group after 5 h of observation. Depletion of (-SH) compounds accompanied the elevation of MDA concentration in pancreatic homogenate from 0.21 nmol/mg protein in control group to 0.38 nmol/mg protein in AP group in the same period of time. After 9 h of observation concentration of (-SH) groups reduced from 64.7 nmol/mg in control group to 43.5 nmol/mg in AP group. LPS and MoAb CD 11b given together or separately in AP did not change the (-SH) group concentration in both periods of observation incomparison to AP group (group 2). MDA concentration in
Table 1 WBC and PMN cells count (/µL, mean±SD)
Group WBC after 5 h WBC after 9 h PMN after 5 h PMN after 9 h
(/µL) (/µL) (/µL) (/µL)
Control 5 120 ± 1 220 5 597 ± 1 447 1 230 ± 490 1 434 ± 569
AP 2 204a± 705a 4 225 ±583 614a ± 229a 1 286 ± 598
AP+MoAb 3 942c± 493c 4 037 ±1 778 2 315c±850c 1 120 ± 705
AP+LPS 1 678 ± 259 6 762c±580c 1 047 ± 560 5 146c±1 124c
AP+MoAb 4 087 ± 259 5 450 ± 580 1 830 ± 560 3 250 ± 1 124 +LPS
MoAb 6 587±1 003 3 887 ± 1 612 2 200 ± 502 990 ± 307
LPS 3 771a±1 510a 4 100 ± 1 824 2 892a±1 372a 2 959a±1 553a
aP<0.05 vs control group; cP<0.05 vs AP group.
Group SH after 5 h SH after 9 h MDA after 5 h MDA after 9 h
Control 60.3 ± 7.3 64.7 ± 8.3 0.21 ± 0.02 0.22 ± 0.03
AP 40.2a ± 8.5a 43.5a ± 4.3a 0.38a ± 0.07a 0.39a ± 0.03a
AP+MoAb 40.0 ± 6.5 46.7 ± 1.4 0.25c ± 0.06c 0.26c ± 0.03c
AP+LPS 40.0±6.8 41.1 ± 8.2 0.39 ± 0.07 0.41 ± 0.1
AP+MoAb 39.0 ± 6.7 40.4 ± 5.0 0.37 ± 0.08 0.35 ± 0.2+LPS
MoAb 63.4 ± 8.6 59.4 ± 9.0 0.2 ± 0.03 0.21 ± 0.04
LPS 52.0 ± 9.1 48.6 ± 4.7 0.28 ± 0.04 0.35 ± 0.05
aP<0.05 vs control group; cP<0.05 vs AP group.
Table 2 SH compound and MDA concentration within pancreatic homogenate (nmol/mg protein, mean±SD)
Cells were counted twice by experienced laboratory technician and the mean value was considered as the result.
Interleukin-6 (IL-6) concentrationSerum IL-6 concentration was determined using the commercial ELISA kit Rat-IL-6 (Biosource). The reaction was based on the peroxidation of tetra-methyl-benzydine. The absorbance measurement was made using an automatic reader (Organon Teknika; Reader 200) at 450-nm wave length.
Statistical analysisData were expressed as mean±SD. One-way analysis of variance with the post hoc analysis was employed to compare the groups. P<0.05 was considered statistically significant.
RESULTSWhole blood chemiluminescence (CL) intensityCL intensity of peripheral blood neutrophils was significantly lower in Cn AP group after 5 and 9 h of observation than that in control animals. CL was reduced from 1 700 to 1 086 RLU/min ×2 000 PMN in AP group, and from 1 842 to 988 RLU/min ×2 000 PMN after 9 h. MoAb CD 11b given before AP induction did not significantly decrease CL intensity in group 3, but the CL intensity decreased from 1 086 to 1 421 after 5 h and from 988 to 1 408 RLU/2 000 PMN ×min after 9 hof AP induction. No important reduction of CL was observed in AP groups receiving LPS or LPS and MoAb CD 11b. MoAb CD 11b given to healthy animals did not change CL value significantly. LPS given to healthy animals significantly reduced CL from 1 842 to 976 RLU/2 000 PMN ×min after 9 h of experiment (Figure 1).
WBC and polymorphonuclear cell (PMN) countInduction of Cn AP resulted in a significant reduction of peripheral WBC from 5 120 in control group to2 204 cells/µL in AP group after 5 h of observation. PMN count in peripheral blood reduced from 1 230 to614 cells/µL during the same period of time. MoAb
Figure 1 Whole blood CL. aP<0.05 vs control group.Control AP AP+MoAb AP+LPS AP+MoAb+LPS
2500
2000
1500
1000
500
0
a CL after 5hCL after 9h

6462 ISSN 1007-9327 CN 14-1219/ R World J Gastroenterol November 7, 2005 Volume 11 Number 41
AP group treated with MoAb CD 11b reduced significantly from 0.38 to 0.25 after 5 h of observation and from 0.39 to 0.26 nmol/mg protein after 9 h of observation (Figure 2A and Table 2).
Myeloperoxidase (MPO) level in pancreatic homogenateAP significantly increased pancreatic MPO concentration from 260 in control animals to 602 ng/g protein in AP group after 5 h of observatiozn and from 280 ng/g protein to 626 ng/g protein after 9 h of observation compared to control group. Adhesion molecule blockade with MoAb CD 11b, prior to AP induction, protected the pancreatic gland from MPO elevation after 5 h (from 602 to 168 ng/g protein) and 9 h of observation (626-246 ng/g protein, Figure 2B). LPS or LPS with MoAb CD 11b given to AP groups did not change the course of pancreatic MPO activity (data not shown).
α-Amylase and lipase plasma activityCn (15 μg/kg for 4 h) caused transient hyperamylasemia and hyperl ipasemia in a l l AP g roups after 5 h of
observation (groups 2-5). Animals receiving MoAb CD 11b alone or with LPS in AP (groups 3 and 5) had significantly lower α-amylase and lipase activity after 9 h of experiment compared to other AP groups (groups 2 and 4, Table 3).
Polymorphonuclear elastase (PMN-E) plasma activityCn-induced AP caused an elevation of plasma PMN-E in all AP groups (groups 2-5). AP animals receiving MoAb CD 11b alone or with LPS had significantly lower PMN-E activity in both periods compared to other AP groups. LPS given to healthy animals elevated plasma PMN-E in a time-dependent manner (3 ng/mL after 5 h and 8 ng/mL after 9 h of observation, Figure 3).
Interleukin-6 plasma concentrationIL-6 was detectable in high concentration only after 5 h of observation in groups 4, 5, and 7 receiving LPS. AP did not correlate with IL-6 plasma level (Table 4).
Microscopic findings within pancreatic glandCn-induced AP caused marked pancreatic interstitial edema and acinar cell vacuolization, neutrophil infiltration and foc i of necros i s. mAb g iven in AP reduced significantly interstitial neutrophil infiltration within the pancreas after 5 h of observation. LPS alone given to healthy animals resulted in a significant acceleration of pancreatic infiltration in comparison to control animals. Lipopolysaccharide given in AP did not result in significant
B
A
0.6
0.45
0.3
0.15
0Control AP AP+MoAb AP+LPS AP+MoAb+LPS
Control AP AP+MoAb AP+LPS AP+MoAb+LPS
Figure 2 MDA (A) and MPO (B) level in pancreatic homogenate. aP<0.05 vs control group; cP<0.05 vs AP group. MDA: malonyldialdehyde; MPO: myeloperoxidase.
Group Α-Amylase Α-Amylase Lipase Lipase after 5 h after 9 h after 5 h after 9 h
Control 690 ± 120 743 ± 156 6 ± 8 8 ± 9AP 8 286a ± 143a 5 908a ± 640a 2 140a ± 1 123a 929a ± 252a
AP+MoAb 5 119 ± 2 487 2 293c ± 1 739c 1 704 ± 731 342c ± 178c
AP+LPS 9 310 ± 7 552 4 001 ± 1 638 2 573 ± 2 133 1 257 ± 164AP+MoAb 12 699c ± 4 978c 2 719c ± 634c 3 470 ± 1 832 305c ± 65c
+LPSMoAb 696 ± 151 582 ± 273 21 ± 12 8 ± 4LPS 584 ± 182 332 ± 93 11 ± 8 8 ± 4
Table 3 Plasma α-amylase and lipase activity (U/L, mean ± SD)
aP<0.05 vs control group; cP<0.05 vs AP group.
1000
800
600
400
200
0
ac
nmol/mg protein
ng/g protein
Figure 3 Plasma PMN-E concentration. aP<0.05 vs control group; cP<0.05 vs AP group.
a
c
MDA after 5hMDA after 9h
MPO after 5hMPO after 9h
Control AP AP+MoAb AP+LPS AP+MoAb+LPS
ac
25
20
15
10
5
0
ng/ml
c
PMN-elastase after 5hPMN-elastase after 9h

Hać S et al. Neutrophils in acute pancreatitis 6463
exacerbation of microscopic findings within the pancreatic gland (Table 5).
DISCUSSIONCn-induced AP is a widely accepted model of acute edematous pancreatitis in rats. The intraperitoneal route of four doses of Cn (15 µg/kg) at 1-h intervals is as effective as the intravenous route[7-9]. Based on the morphologic criteria of acute edematous pancreatitis including acinar cell vacuolization, interlobar and interstitial edema, leukocyte infiltration and foci of acinar cell necrosis, all animals receiving Cn revealed a remarkable hyperamylasemia and hyperlipasemia at the presented study. The time of observation was established on the basis of preliminary experiments, maximum effect of Cn and T1/2 elimination of MoAb CD11b. The production of highly reactive molecules in PMN, as a result of respiratory burst activation, is an essential step in host defense against micro-organisms. The production of these highly reactive molecules can be measured by CL. CL is the process of light emission derived from the chemical reaction in which
excited molecules decay the electronic basic state and emit photons. The CL intensity is directly proportional to cell activation and competence. Measurement of CL is a valuable and simple tool in studying PMN activity[10,11]. CL method is used in experimental and clinical medicine to evaluate the function of different cell types. CL detection is used as a label which allows signal amplification due to the enzyme-catalyzed reaction, thus obtaining a higher sensitivity[11]. The whole blood CL assay requires small blood samples and avoids artefacts due to cell isolation. The disadvantage of whole blood CL measurement is light extinguished by erythrocytes. Thus, highly diluted (final sample dilution 1:200) samples of whole blood are used. The diluted whole blood CL corresponds to individual neutrophil activity, because in this case interaction between cells and plasma is minimal[12]. Neutrophil infiltration is the universal feature of acute and chronic inflammatory process. The adhesion to vessel epithelium is followed by interstitial migration and action in the inflammatory focus[13-15]. This phenomenon is well documented. Neutrophil infiltration is the evidence of cell activation[16-20]. Experimental pancreatitis in the present study resulted in early PMN infiltration within the pancreatic gland. Whole blood white cells and neutrophils, in pancreatitis groups, reduced compared to control animals and also whole blood neutrophil CL reduced in AP groups during the same period of time. The phenomenon of low CL activity in pancreatitis group may be due to the migration of activated cells into interstitial space. After 9 hof experiment, the WBC and PMN count of AP group were similar to control one, because peripheral white cells perhaps were supplemented by immature cells from the bone marrow. However, the CL was still significantly lower, parallel to the results obtained in preliminary investigation[21]. The other possible explanation may be
Table 4 Plasma IL-6 concentration (pg/mL, mean ± SD)Group IL-6 after 5 h IL-6 after 9 h
AP 0.6 ± 2.0 0.0 ± 0.0
AP+MoAb 4.7 ± 7.0 0.0 ± 0.0
AP+LPS 982.0c ± 749.0c 10.0 ± 20.0
AP+MoAb+LPS 1 561.0c ± 493.0c 0.0 ± 0.0
Control 0.2 ± 0.3 0.1 ± 0.3
MoAb 0.0 ± 0.0 0.0 ± 0.0
LPS 941.0a ± 756.0a 2.0 ± 4.0aP<0.05 vs control group; cP<0.05 vs AP group.
Table 5 Microscopic findings within the pancreatic gland (mean ± SD)
Edema Vacuolization Infiltration Necrosis
5 9 5 9 5 9 5 9
Group 1
Control
0.00
±0.00
0.00
±0.00
0.00
±0.00
0.00
±0.00
1.1
±0.9
1.21
±1.03
0.00
±0.00
0.00
±0.00
Group 2
AP
1.91a
±0.90a
0.50
±0.57
2.50a
±0.90a
1.00
±1.41
7.40a
±5.29a
14.60a
±2.37a
0.17
±0.38
0.25
±0.50
Group 3
AP+MoAb CD11b
2.28
±0.75
1.50
±1.00
1.71
±0.4 8
1.50
±1.00
3.87c
±1.69c
10.95
±0.92
0.00
±0.00
0.00
±0.00
Group 4
AP+LPS
1.28
±1.25
2.00
±1.15
1.57
±1.39
1.25
±1.25
10.94
±3.02
17.92
±5.98
0.14
±0.37
0.00
±0.00
Group 5
AP+MoAbCD11b +LPS
2.50
±1.00
1.00
±0.00
2.00
±1.15
1.00
±0.00
10.40
±8.30
15.10
±6.46
0.00
±0.00
0.00
±0.00
Group 6
Control+MoAb CD11b
0.25
±0.50
0.00
±0.00
0.00
±0.00
0.00
±0.00
0.80
±1.04
0.25
±0.30
0.00
±0.00
0.00
±0.00
Group 7
Control+LPS
0.00
±0.00
0.00
±0.00
0.00
±0.00
0.00
±0.00
2.45
±2.75
6.00a
±4.11a
0.00
±0.00
0.00
±0.00
aP<0.05 vs control group; cP<0.05 vs AP group.
Houvs

ISSN 1007-9327 CN 14-1219/ R World J Gastroenterol November 7, 2005 Volume 11 Number 416464
the action of plasma anti-inflammatory agents (cytokines: IL-10, IL-11; soluble receptors: IL-1ra, p75 or prostanoids PGE2 and PGI)[22]. Some data have confirmed that CL intensity is elevated in AP[23,24]. A different methodology of measurement may be the reason. The majority of investigators have analyzed the isolated neutrophils, whereas any isolation technique can change the neutrophil activity status[15,25]. On the other hand, the CL elevation may occur due to infection complicating AP clinical course. CD11b is a well-known surface adhesion molecule of neutrophils. The use of mAb against CD11b results in competitive binding of specific adhesion molecules. Administration of MoAb CD11b in the present study significantly reduced the neutrophil infiltration within the pancreatic gland in AP animals. The pancreatic MPO tissue level was correlated to pancreatic neutrophil infiltration. Neutrophil depletion may protect pancreas from damage during AP as was observed by several other authors[16-18].PAF antagonists reduce adhesion molecule expression and may prevent PMN infiltration of the pancreatic gland during AP. Another known pathomechanism of pancreatic damage during AP is oxidative stress. Several other authors documented that free radicals are generated in experimental AP[17-20]. Oxidative stress and lipid peroxidation debris elevated concentration was observed in animals with AP. MoAb CD11b administration during AP in the present study did not change the (-SH) groups concentration within the pancreatic gland, but the significant reduction of pancreatic MDA concentration was observed. The similar result was noticed in preliminary study group[21]. PMNs are the major source of oxygen radicals. Neutrophil NADPH-oxidase activation leads to the production of superoxide radicals during AP. Thus, MoAb 11b protects lipid peroxidation within pancreatic parenchyma in group 3. Our observations suggest that MoAb 11b induces neutrophil depletion in AP[16-20].Substances which are thought to be effective in AP treatment (i .e. , procaine, dextran, NO or heparin) reduce the aggregation of blood cells[14,26-29]. The role of ischemia-reperfusion and xanthine oxidase reaction is also the source of ROS in AP[26,29,30]. The aggregation of neutrophils and platelets may result in vessel obstruction. Kusterer et al[14] found that leukocyte adherence can be observed within the first 30 min from AP induction. The early neutrophil requirement determines the early adhesion molecule blockade necessity. In our investigation, the IL-6 plasma concentration in AP groups was not elevated in both observation periods in comparison to control animals. IL-6 is a marker cytokine in severe human AP. Edematous AP may not demonstrate cytokinemia during the early stage of the disease[31-34]. On the other hand, some data suggest that IL-6 and other pro-inflammatory cytokines are elevated in Cn-induced AP[8,35]. The difference may be related to the different method of measurement. The biological method is not so specific compared to ELISA technique used in the present experiment[34]. On the other hand, IL-6 may be the marker
of complications or SIRS but not AP “per se”. Numerous data have confirmed the early inflammatory process in the pancreatic parenchyma in early AP. Local cytokine concentration is much higher than the peripheral one[33,36]. The liver plays a cardinal role in cytokine clearance in the early stage of the disease. These facts confirm the local characteristic of AP in the edematous form of the disease. The pathogenesis of AP is the involvement of bacterial LPS. LPS is the universal stimulator of inflammatory process. Digestive tract bacteria are the major source of LPS in AP. Mucosal damage is the reason of LPS detection in early course of AP. The infected pancreatic necrosis foci are responsible for LPS detection in late stage of AP. In the present work, group 7 was the evidence of LPS action on healthy animals. The LPS administered intraperitoneally worked as a systemic inflammatory agent. There was the elevation in peripheral PMN count, pancreatic infiltration and high plasma IL-6 concentration. AP rats receiving LPS (group 4) revealed slight depletion in circulating neutrophils compared to AP group after 5 hof experiment. It could be the consequence of larger neutrophil sequestration. After 9 h of experiment, elevated peripheral blood PMN count was elevated, but the CL intensity was as low as that in AP group. We observed elevation of circulating PMN count in group 4 after 9 h of observation. But CL intensity was not elevated in the same period. The difference in PMN count after 5 and 9 h of experiment might be the result of bone marrow or spleen release. Edematous AP seems to be the local inflammatory process, whereas LPS administration resulted in huge WBC and PMN count elevation after 9 h of observation. The data confirm the early neutrophil requirement in AP. But surprisingly, the activation of circulating PMN was lower in AP than in control animals. This phenomenon may result from activated cell sequestration within the inflamed pancreatic gland. The adhesion molecule CD11b blockade and neutrophil infiltration reduction can protect the pancreatic parenchyma from damage. The early PMN involvement of PMN makes it difficult to conduct comparable clinical trials. Most AP patients admitted to the hospital have at least few hours of history. The idea of immunomodulation seems to be attractive but needs further investigations. In conclusion, the circulating neutrophil and activity are reduced in the early period of Cn-induced AP in rats. Adhesion molecule CD11b blockade can prevent pancreatic infiltration and oxidative stress within the pancreatic gland during AP in rats. Lipopolysaccharide septic challenge does not change the early course of Cn-induced AP in rats.
ACKNOWLEDGMENTSThe authors thank Mr. Anselm Berthold from Berthold Detection Systems for professional assistance and help, and Miss Justyna Hirsz for her language assistance.
REFERENCES1 Johnson CD, Kingsnorth AN, Imrie CW, McMahon MJ,

Hać S et al. Neutrophils in acute pancreatitis 6465
Neoptolemos JP, McKay C, Toh SK, Skaife P, Leeder PC, Wilson P, Larvin M, Curtis LD. Double blind, randomised, placebo controlled study of a platelet activating factor antagonist, lexipafant, in the treatment and prevention of organ failure in predicted severe acute pancreatitis. Gut 2001; 48: 62-69
2 Kald B, Kald A, Ihse I, Tagesson C. Release of platelet-activating factor in acute experimental pancreatitis. Pancreas 1993; 8: 440-442
3 Yamano M, Umeda M, Miyata K, Yamada T. Protective effects of a PAF receptor antagonist and a neutrophil elastase inhibitor on multiple organ failure induced by cerulein plus lipopolysaccharide in rats. Naunyn Schmiedebergs Arch Pharmacol 1998; 358: 253-263
4 S o o n g C V , L e w i s H G , H a l l i d a y M I , R o w l a n d s B J . Intramucosal acidosis and the inflammatory response in acute pancreatitis. Am J Gastroenterol 1999; 94: 2423-2429
5 Kimura Y, Hirota M, Okabe A, Inoue K, Kuwata K, Ohmuraya M, Ogawa M. Dynamic aspects of granulocyte activation in rat severe acute pancreatitis. Pancreas 2003; 27: 127-132
6 Gray KD , Simovic MO, Chapman WC, Blackwell TS, Christman JW, May AK, Parman KS, Stain SC. Endotoxin potentiates lung injury in cerulein-induced pancreatitis. Am J Surg 2003; 186: 526-530
7 Frossard JL, Saluja A, Bhagat L, Lee HS, Bhatia M, Hofbauer B, Steer ML. The role of intercellular adhesion molecule 1 and neutrophils in acute pancreatitis and pancreatitis-associated lung injury. Gastroenterology 1999; 116: 694-701
8 Norman J, Franz M, Messina J, Riker A, Fabri PJ, Rosemurgy AS, Gower WR. Interleukin-1 receptor antagonist decreases severity of experimental acute pancreatitis. Surgery 1995; 117: 648-655
9 Vaccaro MI, Ropolo A, Grasso D, Calvo EL, Ferreria M, Iovanna JL, Lanosa G. Pancreatic acinar cells submitted to stress activate TNF-alpha gene expression. Biochem Biophys Res Commun 2000; 268: 485-490
10 Fujisawa M, Kojima K, Beppu T, Futagawa S, Kuwahara K, Hiramatsu K. Early diagnosis of postoperative infection: assessment of whole blood chemiluminescence. Surg Today 2000; 30: 309-318
11 Roda A, Pasini P, Guardigli M, Baraldini M, Musiani M, Mirasoli M. Bio- and chemiluminescence in bioanalysis. Fresenius J Anal Chem 2000; 366: 752-759
12 Bochev BG , Magrisso MJ , Bochev PG, Markova VI , Alexandrova ML. Dependence of whole blood luminol chemiluminescence on PMNL and RBC count. J Biochem Biophys Methods 1993; 27: 301-309
13 Hartwig W, Jimenez RE, Fernandez-del Castillo C, Kelliher A, Jones R, Warshaw AL. Expression of the adhesion molecules Mac-1 and L-selectin on neutrophils in acute pancreatitis is protease- and complement-dependent. Ann Surg 2001; 233: 371-378
14 Kusterer K, Poschmann T, Friedemann A, Enghofer M, Zendler S, Usadel KH. Arterial constriction, ischemia-reperfusion, and leukocyte adherence in acute pancreatitis. Am J Physiol 1993; 265: G165-G171
15 Larvin M, Alexander DJ, Switala SF, McMahon MJ. Impaired mononuclear phagocyte function in patients with severe acute pancreatitis: evidence from studies of plasma clearance of trypsin and monocyte phagocytosis. Dig Dis Sci 1993; 38: 18-27
16 Bhatia M, Brady M, Shokuhi S, Christmas S, Neoptolemos JP, Slavin J. Inflammatory mediators in acute pancreatitis. J Pathol 2000; 190: 117-125
17 Dabrowski A, Chwiećko M. Oxygen radicals mediate depletion of pancreatic sulfhydryl compounds in rats with cerulein-induced acute pancreatitis. Digestion 1990; 47: 15-19
18 Panés J, Perry M, Granger DN. Leukocyte-endothelial cell
adhesion: avenues for therapeutic intervention. Br J Pharmacol 1999; 126: 537-550
19 Schulz HU, Niederau C, Klonowski-Stumpe H, Halangk W, Luthen R, Lippert H. Oxidative stress in acute pancreatitis. Hepatogastroenterology 1999; 46: 2736-2750
20 Tailor A, Das AM, Getting SJ, Flower RJ, Perretti M. Subacute treatment of rats with dexamethasone reduces ICAM-1 levels on circulating monocytes. Biochem Biophys Res Commun 1997; 231: 675-678.
21 HaćS, Dobosz M, Kaczor J, Rzepko R. Influence of molecule CD 11b blockade on the course of acute ceruleine pancreatitis in rats. EMP 2004; 77: 57-65
22 McKay C, Imrie CW, Baxter JN. Mononuclear phagocyte activation and acute pancreatitis. Scand J Gastroenterol Suppl 1996; 219: 32-36
23 Tsai K , Wang SS, Chen TS, Kong CW, Chang FY, Lee SD, Lu FJ. Oxidative stress: an important phenomenon with pathogenetic significance in the progression of acute pancreatitis. Gut 1998; 42: 850-855
24 Widdison AL, Cunningham S. Immune function early in acute pancreatitis. Br J Surg 1996; 83: 633-636
25 Pascual C, Karzai W, Meier-Hellmann A, Bredle DL, Reinhart K. A controlled study of leukocyte activation in septic patients. Intensive Care Med 1997; 23: 743-748
26 Closa D, Sabater L, Fernández-Cruz L, Prats N, Gelpí E, Roselló-Catafau J. Activation of alveolar macrophages in lung injury associated with experimental acute pancreatitis is mediated by the liver. Ann Surg 1999; 229: 230-236
27 Dobosz M, Hac S, Mionskowska L, Dobrowolski S, Wajda Z. Microcirculatory disturbances of the pancreas in cerulein-induced acute pancreatitis in rats with reference to L-arginine, heparin, and procaine treatment. Pharmacol Res 1997; 36: 123-128
28 Menger MD, Bonkhoff H, Vollmar B. Ischemia-reperfusion-induced pancreatic microvascular injury. An intravital fluorescence microscopic study in rats. Dig Dis Sci 1996; 41: 823-830
29 Sendur R, Pawlik WW. [Vascular factors in the mechanism of acute pancreatitis] Przegl Lek 1996; 53: 41-45
30 Dobosz M, Wajda Z, Hać S, Myśliwska J, Bryl E, Mionskowska L, Roszkiewicz A, Myśliwski A. Nitric oxide, heparin and procaine treatment in experimental ceruleine-induced acute pancreatitis in rats. Arch Immunol Ther Exp (Warsz) 1999; 47: 155-160
31 G r o s s V , L e s e r H G , H e i n i s c h A , S c h ö l m e r i c h J . Inflammatory mediators and cytokines-new aspects of the pathophysiology and assessment of severity of acute pancreatitis? Hepatogastroenterology 1993; 40 : 522-530
32 Kikuchi Y, Shimosegawa T, Satoh A, Abe R, Abe T, Koizumi M, Toyota T. The role of nitric oxide in mouse cerulein-induced pancreatitis with and without lipopolysaccharide pretreatment. Pancreas 1996; 12: 68-75
33 Okabe A , Hirota M, Nozawa F, Shibata M, Nakano S, Ogawa M. Altered cytokine response in rat acute pancreatitis complicated with endotoxemia. Pancreas 2001; 22: 32-39
34 Viedma JA, Pérez-Mateo M, Domínguez JE, Carballo F. Role of interleukin-6 in acute pancreatitis. Comparison with C-reactive protein and phospholipase A. Gut 1992; 33: 1264-1267
35 de Dios I, Perez M, de La Mano A, Sevillano S, Orfao A, Ramudo L, Manso MA. Contribution of circulating leukocytes to cytokine production in pancreatic duct obstruction-induced acute pancreatitis in rats. Cytokine 2002; 20: 295-303
36 Bhatnagar A, Wig JD, Majumdar S. Expression of activation, adhesion molecules and intracellular cytokines in acute pancreatitis. Immunol Lett 2001; 77: 133-141
Edited by Guo SY Language Editor Elsevier HK

PO Box 2345, Beijing 100023, China World J Gastroenterol 2005;11(41):6466-6471www.wjgnet.com World Journal of Gastroenterology ISSN [email protected] © 2005 The WJG Press and Elsevier Inc. All rights reserved.E L S E V I E R
• BASIC RESEARCH•
Bile salts inhibit growth and induce apoptosis of culture human normal esophageal mucosal epithelial cells
Ru Zhang, Jun Gong, Li Wang, the Second Hospital of Xi’an Jiaotong University, Xi’an 710004, Shaanxi Province, ChinaHui Wang, Department of Anesthesia, Shaanxi Provincial People’s Hospital, Xi’an 710068, Shaanxi Province, ChinaSupported by the Clinical Key Programs of Ministry of Public Health, China, No. 20012130Co-first-authors: Ru Zhang and Jun GongCo-correspondence: Ru ZhangCorrespondence to: Dr. Jun Gong, Digestive Department of the Second Hospital, Xi’an Jiaotong University, Xi’an 710004, Shaanxi Province, China. [email protected]: +86-29-88083495 Fax: +86-29-87678758Received: 2005-01-07 Accepted: 2005-04-11
AbstractAIM: To invest igate the effect of s ix bi le salts: glycocholate (GC), glycochenodeoxycholate (GCDC), g l ycodeoxycho la te (GDC) , t au rocho la te (TC) , taurochenodeoxycholate (TCDC), taurodeoxycholate (TDC), and their mixture on cultured human normal esophageal mucosal epithelial cells.
METHODS: Human normal esophageal mucosal ep i the l ia l ce l l s were cu l tured wi th serum-free keratinocyte medium. 3-[4,5-Dimethylthiaolyl]-2,5-diphenyl-tetrazolium bromide assay was applied to the detection of cell proliferation. Apoptotic morphology was observed by phase-contrast video microscopy and terminal deoxynucleotidyl transferase-mediated dUTP nick end labeling (TUNEL) assay. Sub-G1 DNA fragmentations and early apoptotic cells were assayed by flow cytometry (FCM) with propidium iodide (PI) staining and annexin V-FITC conjugated with PI staining. Apoptotic DNA ladders on agarose gel electrophoresis were observed.
RESULTS: Except for GC, GCDC, GDC, TC, TCDC, TDCand their mixture could initiate growth inhibition of esophageal mucosal epithelial cells in a dose- and time-dependent manner. TUNEL and FCM assays demonstrated that the bile salts at 500 μmol/L and their mixture at 1 500 μmol/L induced apoptosis except for GC. The percentage of sub-G1 detected by FCM with PI staining was 83.5% in cells treated with 500 μmol/L TC for 2 h, and 19.8%, 20.4%, 25.6%, 13.5%, and 75.8% in cells treated with 500 μmol/L GCDC, TCDC, GDC, TDC, and 1 500 μmol/L mixture for 24 h, respectively, which were higher than that of the control (1.5%). The percentage was 1.4% in cells with 500 μmol/L GC for 24 h. DNA ladders on agarose gel electrophoresis were seen incells treated with 500 μmol/L TC for 2 h and 1 500 μmol/L
mixture for 24 h.
CONCLUSION: All GCDC, GDC, TC, TCDC, TDC and their mixture can inhibit growth and induce apoptosis of cultured human normal esophageal mucosal epithelial cells, but GC is well tolerated by the cells.
©2005 The WJG Press and Elsevier Inc. All rights reserved.
Key words: Bile salts; Duodenogastroesophageal reflux; Esophageal mucosal epithelial cells; Apoptosis
Zhang R, Gong J, Wang H, Wang L. Bile salts inhibit growth and induce apoptosis of cultured human normal esophageal mucosal epithelial cells. World J Gastroenterol 2005; 11(41): 6466-6471http://www.wjgnet.com/1007-9327/11/6466.asp
INTRODUCTIONDuodenogastroesophageal ref lux (DGER) causes various gastroesophageal reflux diseases (GERD), and is associated with some complications of GERD, such as reflux esophagitis, Barrett's esophagus, and esophageal carcinoma. It is well known that the incidence of adenocarcinoma of the esophagogastric junction has been increasing during the past decade in Western countries[1]. It was also reported that the incidence of GERD is increasing in the developing countries, such as China[2]. The potential contribution of gastroduodenal components to the development of Barrett's esophagus remains unclear. But bile acids, presenting especially frequently in the refluxate of Barrett's esophagus patients, are likely to influence the development and persistence of metaplasia[3–5]. On the other hand, bile salts can enter mucosal cells in their non-ionized lipophilic form, and cause injuries to cell membranes and tight junctions, thus leading to cell necrosis[6]. It has been reported recently that bile acids upregulate the expression of COX-2 in Barrett’s esophagus biopsy explant culture systems [7]. Overexpression of COX-2 inhibits apoptosis[8,9]. However, present studies about bile salt-caused cellular injury performed on hepatocytes[10] and colon cancer cell lines[11,12] showed that different bile salts can induce cell apoptosis. Direct oligomerization of the Fas receptor (CD95/Apo-1) has been suggested as the primary causative mechanism of bile salt-mediated hepatocyte apoptosis[13]. Therefore, it is necessary to investigate the injury mechanism of bile salts on human normal esophageal epithelial cells.
Ru Zhang, Jun Gong, Hui Wang, Li Wang

There are no studies about bile salt-induced apoptosis in normal human esophageal epithelial cells. In the present study, normal human esophageal epithelial cells were cultured successfully. We characterized the kinetics of different bile salt-inhibited growth and different bile salt-induced apoptosis in cultured normal human esophageal epithelial cells. The specificity of death induction by toxic bile salts was demonstrated.
MATERIALS AND METHODS
MaterialsSerum-free keratinocyte medium for culture of human keratinocytes (K-SFM) and dispase were purchased from GIBCO. DMEM was from Hyclone and trypsin was from Sigma, fetal bovine serum (FBS) from Hangzhou Jiangbin Biotechnology Co., Ltd. Glycocholate (GC), glycochenodeoxycholate (GCDC), glycodeoxycholate (GDC), taurocholate (TC), taurochenodeoxycholate (TCDC), and taurodeoxycholate (TDC) were from Sigma. Terminal deoxynucleotidyl transferase-mediated dUTP nick end labeling (TUNEL) kits were purchased from Beijing Zhongshan Golden Bridge Biotechnology Co., Ltd. Annexin V-FITC apoptosis detection kit I was from BD Biosciences.
Cell cultureHuman normal esophageal epithelial cells, cultured from normal esophageal epithelium, were obtained from the resected esophagus of a patient suffering from esophageal carcinoma. Tissue for culture was selected just near the edge of the surgical resection specimens and far away from carcinoma lesions. Tissues were confirmed to contain no macroscopic tumor tissue or histologically detectable metaplastic cells or cancer cells[14,15]. Written informed consent was obtained from the patient for surgery and for the usage of his resected samples. Tunica mucosa was separated from the tissues with forceps, and cut into 0.2 cm × 0.5 cm fragments, then the pieces were transferred to a petri dish containing 25 U/mL dispase[16] and incubated for 18-24 h at 4 °C. Epithelial sheets were separated from the full-thickness mucosa with forceps, pooled in PBS containing 0.25% trypsin/0.02% EDTA, and incubated at 37 °C for 15-20 min with gentle pipetting to dissociate aid cells. Trypsin activity was terminated by the addition of DMEM with 10% FBS. The dissociated cells were collected and grown in K-SFM (pH 7.4) in a humidified atmosphere consisting of 50 mL/L CO2/95% air at 37 °C. K-SFM contained 3 μL epidermal growth factor, and 0.438 g L-glutamine, 0.9 mL bovine pituitary extract per 500 mL, which was based, but modified on the media of esophageal cells[17] and skin keratinocytes[18,19]. The cells were subcultured and those in passages 3-6 were selected to be used in the study. In the following study, different bile salts were added into the K-SFM (pH 7.1-7.3).
Assessment of cell proliferation3-[4,5-Dimethylthiaolyl]-2,5-diphenyl-tetrazolium
bromide (MTT) assay was conducted to determine the cell proliferation. Cells were treated with six bile salts at the concentrations of 500, 250, and 50 μmol/L, and their mixture at the concentrations of 1 500, 1 000, 500, and 250 μmol/L at the ratio 2:2:1:2:2:1.
Cells were seeded on a 96-well plate (4-6×10⁴ cells/well). After 24 h of seeding, cells were treated with different bile salts for 3 d and untreated cells served as a control. Prior to the determination, 10 μL of the 2.5 g/L stock solution of MTT was added to each well. After 4 h of incubation, the culture media were discarded followed by addition of 100 mL of DMSO to each well and vibration for 10 min. The absorbance (A) was measured at 492 nm with a microplate reader. The percentage of viable cells was calculated as follows: (A of experimental group/A of control group)×100%.
Flow cytometry by PI stainingCells from the medium supernatant and adherent cells treated with bile salts were collected and pelleted at1 200 U/min. The harvested cells were fixed with 1 mL of 75% cold ethanol at -20 °C for a night, and then washed with PBS. Cell pellets were incubated with 10 μg/mL RNAse and stained with 50 μg/mL propidium iodide (PI) for 30 min in the dark. Samples were analyzed using a FACSCalibur flow cytometer (FCM) with an excitation wavelength of 488 nm. The resulting histograms were analyzed by the program CELLQuest. A total of 2 104 cells were detected by FCM in each of the samples.
Flow cytometry by annexin V-FITC conjugated with PI staining[20]
Cells from the medium supernatant and adherent cells treated with bile salts were collected and pelleted at 1 200 U/min. Pellets were washed twice with cold PBS and then resuspended in a binding buffer at a concentration of 1×10⁶ cells/mL, and two volumes of the 100 μL solution (1×10⁵ cells) were transferred to two 5-mL culture tubes. Five microliters of annexin V-FITC and 5 μL of PI were added into each of the 100 μL solution, and the cells were gently vortexed and incubated for 15 min at room temperature in the dark. The samples, to which 4 0 0 μ L of 1× binding buffer was added, were analyzed by FACSCalibur FCM within 1 h. A total of 2×10⁴ cells were detected by FCM in each of the samples.
TUNEL assayApoptosis of cells was analyzed using an in situ cell apoptosis detection kit based on the TUNEL technique. Cells were grown on chamber glass culture slides and treated with bile salts. To avoid adherence of the apoptotic cells, the slides were coated with poly-lysine. In brief, after the cells were treated with or without bile salts for the indicated time, they were fixed overnight in 100 g/L formaldehyde, then treated with proteinase K and H2O2, labeled with dUTP in a humidified box at 37 °C for 1 h. The cells without addition of TdT enzyme were used as a negative control. The positive cells/the total cells were calculated using an
Zhang R et al. Bile salts on human normal esophageal mucosal epithelial cells 6467

image-analysis system. A mean of 20 adjacent fields, at a magnification of ×400, was analyzed for each section[21].
DNA fragmentationA total of 106-107 cells treated with bile salts were collected and low molecular weight DNA was extracted using a cell apoptosis DNA ladder extraction kit (Beijing Dingguo Biotechnology Co., Ltd). Standard loading buffer was added, 20 μL DNA samples was run on an 1% agarose gel containing 0.1% ethidium bromide in TAE buffer (40 mmol/L Tris, 20 mmol/L sodium acetate, and 1 mmol/L EDTA, pH 8.0).
Statistical analysisAll values were expressed as mean±SD. Statistical differences between means were calculated by the Student's t-test and the χ2 test. P < 0.05 was considered statistically significant.
RESULTSHuman normal esophageal mucosal epithelial cells were cultured with serum-free keratinocyte medium successfully without contamination of fibroblasts, and could be passaged for more than 20 times without senescence. Cells in passages 3-6 were selected for the following research.
Inhibiting growthThe cell viability was determined by MTT assay
(Figure 1). Except for GC, the other five bile salts and their mixture inhibited the growth of normal human esophageal mucosal epithelial cells in a dose- and time-dependent manner. The mixture at 1 500 μmol/L had an
inhibitory effect of 79% on esophageal mucosal epithelial cells after 24-h treatment. Cell growth was suppressed by 96% after 24-h treatment with TC at 500 μmol/L, higher than that after being treated with other bile salts at the same concentration (P < 0.01). Cell growth was suppressed by 51%, 58%, 65%, and 24% after 24-h treatment with GCDC, GDC, TCDC, and TDC at 500 μmol/L, respectively.
Apoptosis induced by the mixture of bile saltsThe mixture of bile salts induced apoptosis of cultured human normal mucosal epithelial cells. Morphological criteria of cell apoptosis, such as membrane blebbing, cell shrinkage, and nuclear condensation, were assessed3 h after the addition of the mixture at the concentrations of 1 500 μmol/L by phase-contrast video microscopy (Figure 2A). FCM assays with only PI staining showed that 27.6% and 75.8% of the cells treated with 1 500 μmol/L bile salt mixture for 12 and 24 h, respectively, were in sub-G1, which were higher than that of the control (1.5%, P<0.01), and 13.5% of the cells treated with 1 000 μmol/Lbile salt mixture for 12 h were in sub-G1 (Figure 2B). Early apoptotic cells, detected by FCM with annexin-V conjugated with PI staining, reached 8.4%, 6 h after being treated with 1 500 μmol/L bile salt mixture, higher than that of the control (2.3%, P < 0.01, Figure 2C). TUNEL assay also proved that bile salt mixture induced cell apoptosis, because the number of positively stained nuclei was (30 ± 8)% in cells after being treated with 1 500 μmol/Lbile salt mixture for 12 h, which was significantly higher than that of the control (3% ± 2%, P < 0.01, Figure 2D). DNA laddering, a typical sign of apoptosis, was detectable after being treated with 1 500 μmol/L bile salt mixture for
Figure 1 Effect of GC (A), GCDC (B), GDC (C), TC (D), TCDC (E), TDC (F), and mixture (G) on the growth of cultured normal human esophageal epithelial cells. (at the concentration 50 μmol/L), ■ (250 μmol/L), ▲ (500 μmol/L), △ (1 000 μmol/L), and * (1 500 μmol/L).
1 2 3 (d)
1.2
0.4
0.2
0.8
0
0.6
1
Perce
ntage
of va
ible c
ells(1
00%
)
Glycodeoxycholate
0
0.2
0.4
0.6
1
0.8
1.2
Perce
ntage
of va
ible c
ells(1
00%
)
1 2 3 (d) Glycochenodeoxycholate
B1.4
1.2
0.8
1
0.2
0.6
1 2 3 (d)
Perce
ntage
of va
ible c
ells
Glycocholate
A
0
0.4
0.2
0.8
0
0.6
1
Taurochenodeoxycholate1 2 3
Perce
ntage
of va
ible c
ells(1
00%
) E
Taurodeoxycholate
1.2
0.8
0.6
1
Perce
ntage
of va
ible c
ells(1
00%
)
1 2 3
0.2
0
0.4
F
Mixed bile salts
1.2
0.8
1
Perce
ntage
of va
ible c
ells(1
00%
)
1 2 3 (d)
0.2
0
0.4
G
0.6
Perce
ntage
of va
ible c
ells(1
00%
) 1.2
0.4
0.2
0.8
0
0.6
1
1 2 3 (d)Taurocholate
D
6468 ISSN 1007-9327 CN 14-1219/ R World J Gastroenterol November 7, 2005 Volume 11 Number 41
C
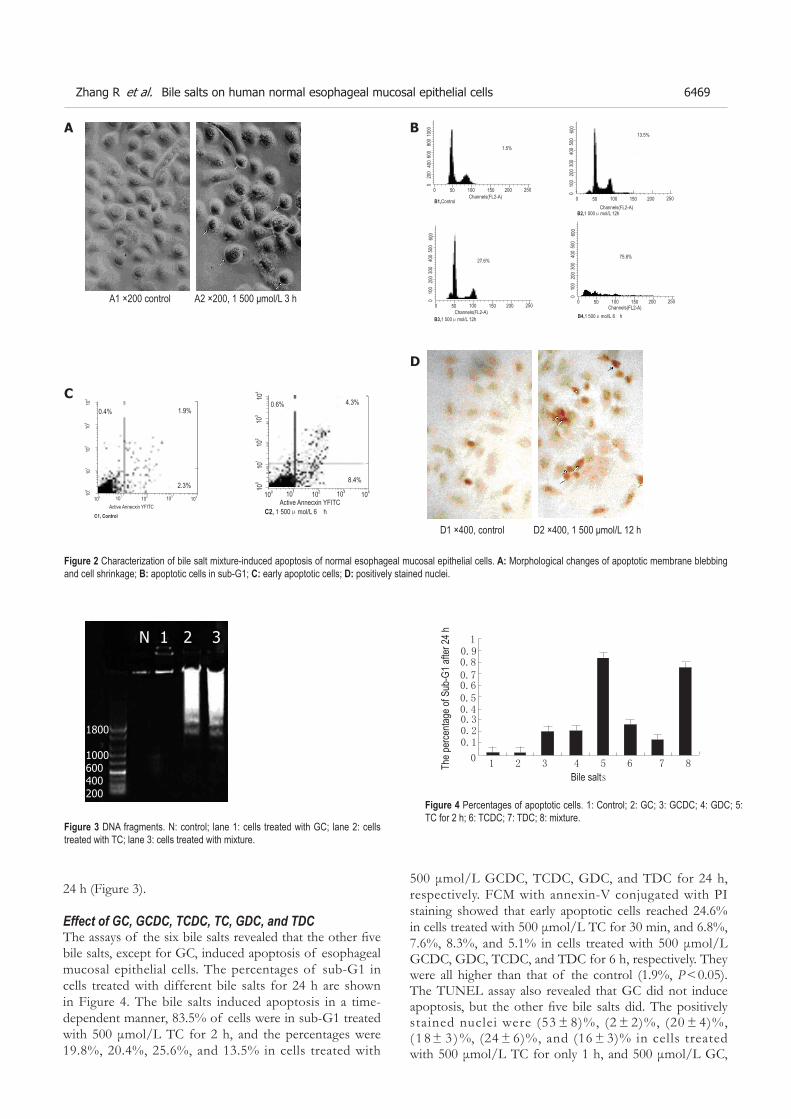
24 h (Figure 3).
Effect of GC, GCDC, TCDC, TC, GDC, and TDCThe assays of the six bile salts revealed that the other five bile salts, except for GC, induced apoptosis of esophageal mucosal epithelial cells. The percentages of sub-G1 in cells treated with different bile salts for 24 h are shown in Figure 4. The bile salts induced apoptosis in a time-dependent manner, 83.5% of cells were in sub-G1 treated with 500 μmol/L TC for 2 h, and the percentages were 19.8%, 20.4%, 25.6%, and 13.5% in cells treated with
1 2 3 4 5 6 7 8
0.4
1
0.50.6
0.8
0.30.2
0.7
0
0.9
0.1
The p
erce
ntage
of S
ub-G
1 afte
r 24 h
Bile salts
Figure 4 Percentages of apoptotic cells. 1: Control; 2: GC; 3: GCDC; 4: GDC; 5: TC for 2 h; 6: TCDC; 7: TDC; 8: mixture.
500
300
200
400
100
25020015010050
0
0
600
75.8%
B4,1 500μmol/L 6 hChannels(FL2-A)
1000
600
400
800
200
25020015010050
0
0
1.5%
B1,ControlChannels(FL2-A)
500
300
200
400
100
25020015010050
0
0
600
13.5%
B2,1 000μmol/L 12hChannels(FL2-A)
500
300
200
400
100
25020015010050
0
0
600
27.6%
B3,1 500μmol/L 12hChannels(FL2-A)
0.4% 1.9%
100 101 104103102100
101
104
103
102
Active Annecxin YFITCC1, Control
0.6% 4.3%
100 101 104103102100
101
104
103
102
Active Annecxin YFITCC2, 1 500μmol/L 6 h
BA
C
A1 ×200 control A2 ×200, 1 500 μmol/L 3 h
D1 ×400, control D2 ×400, 1 500 μmol/L 12 h
Figure 2 Characterization of bile salt mixture-induced apoptosis of normal esophageal mucosal epithelial cells. A: Morphological changes of apoptotic membrane blebbing and cell shrinkage; B: apoptotic cells in sub-G1; C: early apoptotic cells; D: positively stained nuclei.
Figure 3 DNA fragments. N: control; lane 1: cells treated with GC; lane 2: cells treated with TC; lane 3: cells treated with mixture.
D
0.4%
2.3%8.4%
1.9%
500 μmol/L GCDC, TCDC, GDC, and TDC for 24 h, respectively. FCM with annexin-V conjugated with PI staining showed that early apoptotic cells reached 24.6% in cells treated with 500 μmol/L TC for 30 min, and 6.8%, 7.6%, 8.3%, and 5.1% in cells treated with 500 μmol/L GCDC, GDC, TCDC, and TDC for 6 h, respectively. They were all higher than that of the control (1.9%, P < 0.05). The TUNEL assay also revealed that GC did not induce apoptosis, but the other five bile salts did. The positively stained nuclei were (53 ± 8)%, (2 ± 2)%, (20 ± 4)%, ( 1 8 ± 3 ) %, (24 ± 6)%, and (16 ± 3)% in cells treated with 500 μmol/L TC for only 1 h, and 500 μmol/L GC,
Zhang R et al. Bile salts on human normal esophageal mucosal epithelial cells 6469
N 1 2 3
1800
1000600400200

GCDC, GDC, TCDC, and TDC for 24 h, respectively. Except for GC, all the others were significantly higher than that of the control (3 ± 2)%, P < 0.01). DNA fragments were detected in cells treated with TC at 500 μmol/L for 2 h (Figure 3).
DISCUSSIONThe injury mechanism of reflux duodenal components underlying DGER is still controversial. Bile acids and bile salts play a most important role[6]. But the causative mechanism of bile salts has not yet been elucidated in detail.
Bile acids constitute 67% of the normal bile, and are conjugated with glycine or taurine. The normal bile acids consist of 40% cholic acids, 40% chenodeoxycholic acid, and 20% deoxycholic acids, and a minor fraction of lithocholic acid and ursodeoxycholic acid[22]. In the present study, we investigated the effect of GC, GCDC, GDC, TC, TCDC, and TDC in esophageal epithelial cells. In order to speculate the effect of bile in the duodenoesophageal reflux in vivo, we also observed the effect of the mixture of these six bile salts. Moreover, the concentrations of bile salts in our study were selected from 25 to 500 μmol/L in the different bile salts and from 50 to 1 500 μmol/L in the mixture. This is because the total bile acid concentration in esophagus of patients suffering from reflux esophagitis is 0.89 mg/mL[23].
MTT assay in this report demonstrated that five bile salts and the mixture, except for GC, could inhibit the growth of cultured human normal esophageal mucosal epithelial cells in a dose- and time-dependent manner. The induced cell death was a major reason for the cell growth inhibition. GCDC, GDC, TC, TCDC, TDC and the mixture caused typical apoptotic alterations including the morphological changes assessed by phase-contrast video microscopy and TUNEL assay, positive cells stained with annexin-V assessed by FCM, apoptotic sub-G1 peak assessed by FCM with PI staining, and DNA fragmentation by agarose gel electrophoresis assay. However, these apoptosis changes were not seen in cells treated with GC.
Differences in the effect of bile salts on cultured normal human esophageal mucosal epithelial cells and hepatocytes and colon cancer cell line death were identified in this study. Studies performed on hepatocytes showed that glycine-conjugated bile acids, such as glycocholic and glycochenodeoxycholic acids, induce hepatocyte apoptosis in vitro[24], whereas taurine-conjugated bile acids, such as taurocholic and taurochenodeoxycholic acids, are well tolerated by hepatocytes[25,26]. Cell apoptosis is specifically induced by toxic (hydrophobic) bile salts such as deoxycholate and dihydroxy bile salt, whereas the conjugated bile salt GDC and the trihydroxy bile salt and its conjugate GC do not induce apoptosis of colorectal cancer cell lines[11], which are not in accordance with our results. Conversely, hepatocyte-cytotoxic glycine-conjugated bile acids such as GC, which induce hepatocyte apoptosis in vitro[24], do not induce apoptosis in esophageal
mucosal epithelial cells. Whereas the hepatocyte-tolerated TC and TCDC[25,26] could induce apoptosis of esophageal mucosal epithelial cells. Our results also showed that TC was the most toxic to esophageal mucosal epithelial cells compared to the other four bile salts. We speculate that the mechanisms of the bile salts-induced apoptosis in human esophageal epithelial cells are different from those in hepatocytes or colorectal cancer cell lines. It was reported that direct oligomerization of the Fas receptor could be suggested as the primary causative mechanism of bile salt-mediated hepatocyte apoptosis[13,27,28]. Some hydrophobic bile acids such as TC could activate PI3K-dependent survival pathways, which prevent their otherwise inherent toxicity in hepatocytes[10,29]. As opposed to hepatocyte death mediated by bile acids, bile salt-induced apoptosis of human colon cancer cell lines involves the mitochondrial transmembrane potential but not the CD95 (Fas/Apo-1) receptor[11,30]. Studies are needed to gain further insight into the effect of bile salts on human esophageal mucosal epithelial cells.
In conclusion, GCDC, GDC, TC, TCDC, and TDC and their mixture inhibit the growth and induce apoptosis of cultured human normal esophageal mucosal epithelial cells in a dose- and time-dependent manner. But GC is not cytotoxic to the esophageal mucosal epithelial cells. Studies are needed to gain further insight into the effect of bile salts on human esophageal mucosal epithelial cells.
ACKNOWLEDGMENTSWe thank Dr. Bingheng Zhang and Dr. Xiaoge Zhao, Central Laboratory for Biomedical Research of Xi’an Jiaotong University Medical School, for their help on the FCM assays.
REFERENCES1 C a m e r o n A J , L o m b o y C T , P e r a M , C a r p e n t e r H A .
Adenocarcinoma of the esophagogastric junction and Barrett's esophagus. Gastroenterology 1995; 109: 1541-1546
2 Li ZS, Xu GM, Liu Q. Epidemiology of gastroesophageal reflux disease in Shanghai adults part I: Suggestive symptoms and influencing factors. Jiefangjun Yixue Zazhi 1997; 22: 259-2623
Jankowski JA, Anderson M. Review article: management of oesophageal adenocarcinoma-control of acid, bile and inflammation in intervention strategies for Barrett's oesophagus. Aliment Pharmacol Ther 2004; 20 (Suppl 5): 71-80 discussion 95-96
4 Kondo K, Kojima H, Akiyama S, Ito K, Takagi H. Pathogenesis of adenocarcinoma induced by gastrojejunostomy in Wistar rats: role of duodenogastric reflux. Carcinogenesis 1995; 16: 1747-1751
5 Miwa K, Miyashita T, Hattori T. Reflux of duodenal or gastroduodenal contents induces esophageal carcinoma in rats. Nippon Rinsho 2004; 62: 1433-1438
6 Stein HJ, Kauer WK, Feussner H, Siewert JR. Bile acids as components of the duodenogastric refluxate: detection, relationship to bilirubin, mechanism of injury, and clinical relevance. Hepatogastroenterology 1999; 46: 66-73
7 Shirvani VN, Ouatu-Lascar R, Kaur BS, Omary MB, Triadafilopoulos G. Cyclooxygenase 2 expression in Barrett's esophagus and adenocarcinoma: Ex vivo induction by bile salts and acid exposure. Gastroenterology 2000; 118: 487-496
6470 ISSN 1007-9327 CN 14-1219/ R World J Gastroenterol November 7, 2005 Volume 11 Number 41

8 Tsujii M, DuBois RN. Alterations in cellular adhesion and apoptosis in epithelial cells overexpressing prostaglandin endoperoxide synthase 2. Cell 1995; 83: 493-501
9 Sawaoka H, Kawano S, Tsuji S, Tsujii M, Gunawan ES, Takei Y, Nagano K, Hori M. Cyclooxygenase-2 inhibitors suppress the growth of gastric cancer xenografts via induction of apoptosis in nude mice. Am J Physiol 1998; 274: G1061-G1067
10 Torchia EC, Stolz A, Agellon LB. Differential modulation of cellular death and survival pathways by conjugated bile acids. BMC Biochem 2001; 2: 11
11 Schlottman K, Wachs FP, Krieg RC, Kullmann F, Schölmerich J, Rogler G. Characterization of bile salt-induced apoptosis in colon cancer cell lines. Cancer Res 2000; 60: 4270-4276
12 Milovic V, Teller IC, Faust D, Caspary WF, Stein J. Effects of deoxycholate on human colon cancer cells: apoptosis or proliferation. Eur J Clin Invest 2002; 32: 29-34
13 Sodeman T, Bronk SF, Roberts PJ, Miyoshi H, Gores GJ. Bile salts mediate hepatocyte apoptosis by increasing cell surface trafficking of Fas. Am J Physiol Gastrointest Liver Physiol 2000; 278: G992-G999
14 Washington K, Gottfried MR, Telen MJ. Tissue culture of epithelium derived from Barrett’s oesophagus. Gut 1994; 35: 879-883
15 Kawabe A, Shimada Y, Soma T, Maeda M, Itami A, Kaganoi J, Kiyono T, Imamura M. Production of prostaglandinE2 via bile acid is enhanced by trypsin and acid in normal human esophageal epithelial cells. Life Sci 2004; 75: 21-34
16 David AJ, Paul JB, Darrin DB. Culture of human keratinocytes in defined serum-free mudium. FOCUS of GIBCO 1997; 19: 2-5.
17 Fitzgerald RC, Farthing MJ, Triadafilopoulos G. Novel adaptation of brush cytology technique for short-term primary culture of squamous and Barrett's esophageal cells. Gastrointest Endosc 2001; 54: 186-189
18 Font J , Braut-Boucher F, Pichon J , Noel-Hudson MS, Muriel MP, Bonnet M, Wepierre J, Aubery M. A new three-dimensional culture of human keratinocytes: optimization of differentiation. Cell Biol Toxicol 1994; 10: 353-359
19 Harvima IT, Lappalainen K, Hirvonen MR, Mättö M, Kivinen PK, Hyttinen M, Pelkonen J, Naukkarinen A. Heparin modulates the growth and adherence and augments the growth-inhibitory action of TNF-alpha on cultured human keratinocytes. J Cell Biochem 2004; 92: 372-386
20 Lecoeur H, Prévost MC, Gougeon ML. Oncosis is associated with exposure of phosphatidylserine residues on the
Science Editor Wang XL Language Editor Elsevier HK
outside layer of the plasma membrane: a reconsideration of the specificity of the annexin V/propidium iodide assay. Cytometry 2001; 44: 65-72
21 Coppola D, Schreiber RH, Mora L, Dalton W, Karl RC. Significance of Fas and retinoblastoma protein expression d u r i n g t h e p r o g r e s s i o n o f B a r r e t t ' s m e t a p l a s i a t o adenocarcinoma. Ann Surg Oncol 1999; 6: 298-304
22 Guoming X, Meiyun K, Jinyan L. Bile acid reflux related disease. Shanghai Science and Technology Press 2002; 9: 24
23 Stein HJ, Feussner H, Kauer W, DeMeester TR, Siewert JR. Alkaline gastroesophageal reflux: assessment by ambulatory esophageal aspiration and pH monitoring. Am J Surg 1994; 167: 163-168
24 Agellon LB, Torchia EC. Intracellular transport of bile acids. Biochim Biophys Acta 2000; 1486: 198-209
25 Torchia EC, Agellon LB. Bile acid-induced morphological changes in hepatoma cells with elevated sodium-dependent bile acid uptake capacity. Eur J Cell Biol 1997; 74: 190-196
26 Roberts LR, Kurosawa H, Bronk SF, Fesmier PJ, Agellon LB, Leung WY, Mao F, Gores GJ. Cathepsin B contributes to bile salt-induced apoptosis of rat hepatocytes. Gastroenterology 1997; 113: 1714-1726
27 Faubion WA, Guicciardi ME, Miyoshi H, Bronk SF, Roberts PJ, Svingen PA, Kaufmann SH, Gores GJ. Toxic bile salts induce rodent hepatocyte apoptosis via direct activation of Fas. J Clin Invest 1999; 103: 137-145
28 Qiao L, Studer E, Leach K, McKinstry R, Gupta S, Decker R, Kukreja R, Valerie K, Nagarkatti P, El Deiry W, Molkentin J, Schmidt-Ullrich R, Fisher PB, Grant S, Hylemon PB, Dent P. Deoxycholic acid (DCA) causes ligand-independent activation of epidermal growth factor receptor (EGFR) and FAS receptor in primary hepatocytes: inhibition of EGFR/mitogen-activated protein kinase-signaling module enhances DCA-induced apoptosis. Mol Biol Cell 2001; 12: 2629-2645
29 Rust C, Karnitz LM, Paya CV, Moscat J, Simari RD, Gores GJ. The bile acid taurochenodeoxycholate activates a phosphatidylinositol 3-kinase-dependent survival signaling cascade. J Biol Chem 2000; 275: 20210-20216
30 Wachs FP, Krieg RC, Rodrigues CM, Messmann H, Kullmann F, Knüchel-Clarke R, Schölmerich J, Rogler G, Schlottmann K. Bile salt-induced apoptosis in human colon cancer cell lines involves the mitochondrial transmembrane potential but not the CD95 (Fas/Apo-1) receptor. Int J Colorectal Dis 2005; 20: 103-113
Zhang R et al. Bile salts on human normal esophageal mucosal epithelial cells 6471

PO Box 2345, Beijing 100023, China World J Gastroenterol 2005;11(41):6472-6476www.wjgnet.com World Journal of Gastroenterology ISSN [email protected] © 2005 The WJG Press and Elsevier Inc. All rights reserved.E L S E V I E R
• BASIC RESEARCH •
Jie Yan, Ren-Da Yang, Jun-Feng He, Shou-Xiang Yi, Xiao-Rong Chang, Ya-Ping Lin, Department of Acupuncture and Moxibustion, Hunan College of Traditional Chinese Medicine, Changsha 410007, Hunan Province, ChinaSupported by the National Natural Science Foundation of China, NO. 90209023 Correspondence to: Professor Jie Yan, Department of Acupunc-ture and Moxibustion, Hunan College of Traditional Chinese Medicine, Changsha 410007, Hunan Province, China. [email protected]: +86-731-5381159 Fax: +86-731-5381159Received: 2005-03-01 Accepted: 2005-04-02
AbstractAIM: To explore the regularity of multi-meridians controlling a same viscus (MMCSV).
METHODS: The rabbit gastr ic u lcer model was established by ethanol intragastric instillation. Fifty-six rabbits were randomly divided into normal group, model group (MG), model plus acupuncture at Foot Yangming Meridian group (YMG), model plus acupuncture at Foot Taiyin Meridian group (TYG), model plus acupuncture at Foot Shaoyang Meridian group (SYG), model plus acupuncture at Foot Jueyin Meridian group (JYG), model plus acupuncture at Foot Taiyang Meridian group (TYMG), with eight rabbits in each group. Gastric mucosal nitric oxide (NO) and nitric oxide synthase (NOS) were assayed by the nitric acid reductase method, and prostaglandin E2 (PGE2) and epidermal growth factor (EGF) were measured by radioimmunoassay. The comprehensive effects were analyzed by weighing method.
RESULTS: Compared to MG, SYG, JYG and TYMG, the rabbits gastric mucosal injury index (GMII) reduced very significantly in YMG (P <0.01). Compared to MG, the GMII also reduced significantly in TYG (P<0.05). NO, NOS, PGE2 and EGF increased very significantly in YMG (P<0.01). The EGF in YMG also increased significantly than that in TYG compared to those in MG, SYG, JYG and TYMG (P<0.05). The PGE2 and EGF also increased very significantly in TYG than those in MG, JYG and TYMG (P<0.01). While compared to SYG, the NOS increased significantly in TYG (P <0.05). NOS was the highest in YMG (P<0.01), and was higher in TYG than in MG (P<0.01).
CONCLUSION: MMCSV is common. The Foot Yangming Meridian is most closely related to the stomach, followed by Foot Taiyin Meridian, Foot Shaoyang Meridian and
Effect of acupuncture at different meridian acupoints on changes of related factors for rabbit gastric mucosal injury
Jie Yan, Ren-Da Yang, Jun-Feng He, Shou-Xiang Yi, Xiao-Rong Chang, Ya-Ping Lin
INTRODUCTIONAccording to the meridian theory, the meridians in the body connections are sealed. Qi and blood flow recurrently, the meridians connect with each other directly or indirectly. Therefore, it is the underlying theory of multi-meridians controlling a same viscus (MMCSV)[1]. Previous studies are focused on one meridian controlling one viscus[2-4], while MMCSV is seldom referred to. In general, NO, NOS, PGE2 and EGF are regarded as protective factors involved in repairing gastric mucosal injury. Based on our previous research on MMCSV[5,6], in this study, we focused on the Foot Yangming Meridian (FYM) controlling the stomach. The Foot Shaoyang Meridian (FSY), Foot Jueyin Meridian (FJY), Foot Taiyin Meridian (FTY), as well as Foot Taiyang Meridian (FTYM) were selected to explore the regularity of MMCSV and meridian speciality for the Stomach.
MATERIALS AND METHODSAnimalsFifty-six New Zealand 3-4 mo old pure rabbits, weighing 1.5-2.5 kg, were supplied by the Experimental Animal Center of Hunan College of Traditional Chinese Medicine (Permission number: 20030316).
Animal model and groups The rabbit gastric ulcer model was established by ethanol intragastric instillation[7]. Fifty-six rabbits were divided into normal group (NG), model group (MG), model plus acupuncture at Foot Yangming Meridian group (YMG), model plus acupuncture at Foot Taiyin Meridian group (TYG), model plus acupuncture at Foot Shaoyang Meridian group (SYG), model plus acupuncture at Foot
Foot Jueyin Meridian. Foot Taiyang Meridian has no correlation with the stomach.
© 2005 The WJG Press and Elsevier Inc. All rights reserved.
Key words: Relationship between Meridian and Viscus; Gastric mucosal injury/acupuncture effects; MMCSV
Yan J, Yang RD, He JF, Yi SX, Chang XR, Lin YP. Effect of acupuncture at different meridian acupoints on changes of related factors for rabbit gastric mucosal injury. World J Gastroenterol 2005;11(41):6472-6476http://www.wjgnet.com/1007-9327/11/6472.asp

Yan J et al. Protective effect of acupuncture on gastric mucosa 6473
Jueyin Meridian group (JYG), and model plus acupuncture at Foot Taiyang Meridian group (TYMG), with eight rabbits in each group. All the animals were fasted for 48 h before ulcer model-making. Rabbits in NG were given normal saline by intragastric instillation (2.35 mL/kg). Rabbits in other groups were given ethanol intragastrically (2.35 mL/kg). Twenty-four hours later, all animals were allowed free access to normal food. Except for rabbits in NG and MG groups, the animals received acupuncture therapy.
Acupuncture methodAcupoints were se lec ted based on the (Moder n Acupuncturolgy)[8] and anthropomorphic method[6] as well as on our previous research results[5,6]. In the FYM, Neiting (ST 44), Jiexi (ST 41), Zusanli (ST36), Liangqiu (ST 34), Tianshu (ST 25) and Liangmen (ST 21) were selected for gastric ulcer therapy. The other acupoints of different meridians were almost in the same horizontal level to the FYM. In the FSY, Jiaxi (GB 43), Qiuxu (GB 40), Yanglingquan (GB 34), Xiyangguan (GB 33), Daimai (GB 26) and Jingmen (GB 25) were selected. In the FJY, the selected acupoints were Xingjian (LR 2), Zhongfeng (LR 4), Xiguan (LR 7), Yinbao (LR 9), Zhangmen (LR 13) and Qimen (LR 14). In the FTY, Dadu (SP 2), Shangqiu (SP 5), Yinlingquan (SP 9), Xuehai (SP 10), Dahen (SP 15) and Fu’ai (SP 16) were selected. In the FTYM, Tonggu (BL 66), Shenmai (BL 62), Chengjin (BL 56), Fuxi (BL 38), Beixiadian and Beishangdian were selected. Consecutive acupoint-stimulation in one meridian was applied by Xuanshou Meridian Dredging Apparatus (China Peace Economy Technology Consultation Company)[6]. Parameters for manipulation were as follows: single way running, six steps, at 0.5 s intervals; double direction narrow impulse and consecutive wave, 50 Hz, 0.5 ms wave width. The apparatus output was connected to the needle (diameter 0.25 mm, length 25 mm) which was inserted into the acupoints. Just mimicking human’s obeying meridian to propaganda sense, the excited order was from low leg to trunk, and the output strength was controlled within 2-3 intensity. Acupuncture stimulation was manipulated once a day, for seven days, 30 s each time. All the selected acupoints were in the left lateral body throughout the experiment.
Determination of gastric mucosal injury index (GMII)After seven days, the animals were killed with their stomachs removed and opened along the greater curvature. The content in the stomach was washed with running water, mucus attached to gastric mucosa was removed by the brusher. Then the mucosa was extended in a flat plate. GMII was calculated by the Guth method[9] with a general magnifier.
Determination of NO, NOS, PGE2 and EGF in gastric mucosaNO and NOS kit were supplied by Nanjing Jincheng Bioengineering Institute. EGF radioimmunoassay kit was
provided by Beijing Huaying Radioimmunoassay Institute. [3H]PGE2 radioimmunoassay kit was obtained from Beijing Furui Bioengineer Co. Gastric mucosal NO and NOS were assayed by the nitric acid reductase method, and PGE2 and EGF were measured by radioimmunoassay. All assays were carried out according to the manufacturer’s instructions.
Statistical analysis All the results were expressed as mean±SD. Comparison between groups was made using one-way analysis of variance (ANOVA). Differences were considered statistically significant, if the P value was less than 0.05. Software SPSS 10.0 was used in all statistical tests.
RESULTSGastric mucosal injury condition and index (Table1)There were some dots and strips of injury under the magnifier. The highest GMII was observed in MG and the lowest GMII in NG. There was a very significant difference between them (P<0.01), demonstrating that the ulcer model was successful. Compared to MG, GMII in YMG and TYG reduced significantly (P<0.05 or P<0.01), and the GMII in YMG was better than that in TYG. While the GMII in SYG, JYG and TYMG had no significant difference compared to that in MG (P>0.05). The GMII in YMG had a significant difference compared to that in SYG, JYG and TYMG (P<0.01). The GMII in TYG also had a significant difference compared to that in TYGM (P<0.05).
NO and NOS changes in gastric mucosa (Table 2)Gastric mucosal NO and NOS in NG were both higher than those in MG (P<0.01). The highest NO content was found in YMG, than TYG, JYG and TYMG, while the lowest NO content was observed in SYG. The NO was higher in YMG than in MG, SYG, JYG and TYMG, and there was a very significant difference between YMG and MG, SYG, JYG, TYMG, respectively (P<0.01). However, no significant difference was found between YMG and TYG (P>0.05). The highest NOS content was observed in YMG, the lowest NOS content was found in TYMG. The NOS was higher in YMG and TYG than in
Table 1 Gastric mucosal injury index comparison (mean±SD)
NG 8 8.50±2.98b
MG 8 24.88±6.29df
YMG 8 10.88±3.23b
SYG 8 19.38±3.66d
JYG 8 20.38±4.03d
TYG 8 14.62±3.20a
TYMG 8 24.13±1.64dc
Groups n GMII
aP <0.05, bP <0.01 vs MG; dP <0.01 vs YMG; cP <0.05, fP <0.01 vs TYG.

6474 ISSN 1007-9327 CN 14-1219/ R World J Gastroenterol November 7, 2005 Volume 11 Number 41
method was used to analyze the differences. According to the importance of gastric mucosal protective factors including NO, NOS, PGE2 and EGF, the whole weight was set at 10, NO at 2.5, NOS at 1.25, EGF at 3.75 and PGE2 at 2.5. The comprehensive effect value (CEV) was made in the following process: NO, NOS, EGF and PGE2 content were multiplied with their own weight respectively, then added. ANOVA was used to compare the difference in the acupuncture therapy groups. The highest CEV was found in YMG followed by TYG, SYG, JYG, TYMG, and MG. The statistics showed that there was a very significant difference in CEV between YMG and other groups (P<0.01). In addition, CEV was also higher in TYG than in SYG, JYG, TYMG, and MG, respectively (P < 0.01).
DISCUSSIONExcessive ethanol ingestion can result in gastritis characte-rized by mucosal edema, subepithelial hemorrhages, cellular exfoliation and inflammatory cell infiltration[6]. Ethanol intragastric instillation breaks the gastric mucosal barrier and increases histamine release and pepsinogen output, thus leading to the damage in the gastric mucosa at least in part via hyperosmolarity[7]. In the present study, after ethanol intragastric instillation, the highest GMII was found in MG, demonstrating that the model of gastric mucosal injury is reliable. It is known that neuronal modulating processes such as release of vasoactive mediators are crucial for the gastric mucosa to resist the continual onslaught of aggressive agents[8,9]. Endothelial cells also release a highly labile humoral vasodilator
Table 2 NO and NOS changes in gastric mucosa (mean ± SD)
NG 8 1.48 ± 0.54b 2081.4 ± 482.6b
MG 8 0.45 ± 0.20d 762.1 ± 156.3d,f
YMG 8 1.38 ± 0.27b 1931.5 ± 612.6b
SYG 8 0.45 ± 0.19d 1327.0 ± 319.4bdc
JYG 8 0.76 ± 0.25d 987.2 ± 365.1d,f
TYG 8 1.25 ± 0.68 1728.2 ± 213.2b
TYMG 8 0.57 ± 0.24d 750.9 ± 254.3d,f
Groups n NO (μ mot/gprot) NOS (u/mgprot)
aP <0.05, bP <0.01 vs MG; dP <0.01 vs YMG; cP <0.05, fP <0.01 vs TYG.
MG, SYG, JYG and TYMG (P<0.05 or <0.01). The NOS was also higher in SYG than in MG, and there was a very significant difference between them (P<0.01).
PGE2 and EGF changes in gastric mucosa (Table 3)Gastric mucosal PGE2 and EGF were both higher in NG than in MG (P<0.01). The PGE2 was higher in YMG and TYG than that in NG and other acupuncture therapy groups (P<0.01). The highest EGF was found in YMG, compared to MG and other acupuncture therapy groups, and there were very significant differences between YMG and other groups respectively (P<0.01), demonstrating that acupuncture can raise gastric mucosal PGE2 and EGF content in YMG, while acupuncture could only raise gastric mucosal PGE2 content in TYG ulcer rabbits.
Summarization of effects of acupuncture at different meridian acupoints (Table 4)To compare the protective effects of acupuncture at different meridian acupoints on the gastric mucosal injury, we ranked the intensity of effects. From the summarization in Table 4, we could see the comprehensive protection of acupuncture therapy against gastric mucosal injury of experimental rabbits was the best in YMG, followed by TYG, JYG or SYG, and TYMG.
Comprehensive protective effects of acupuncture at different meridian acupoints in gastric mucosa (Table 5)In order to compare the comprehensive effects of acupuncture at different meridian acupoints on gastric mucosa, weight
Table 3 PGE2 and EGF changes in gastric mucosa (mean±SD, ng/L)
NG 8 2 624.8 ± 336.2b 91.3 ± 14.9b
MG 8 1 629.2 ± 406.7d,f 73.6 ± 14.8d
YMG 8 2 708.8 ± 526.2b 92.2 ± 6.7b
SYG 8 1 763.8 ± 371.5d,f 74.9 ± 9.0d
JYG 8 1 663.4 ± 258.0d,f 72.7 ± 12.4d
TYG 8 2 383.6 ± 547.5b 68.5 ± 14.1d
TYMG 8 1 748.6 ± 594.9d,f 65.4 ± 12.8d
Groups n PGE2 EGF
bP <0.01 vs MG; dP <0.01 vs YMG; fP <0.01 vs TYG.
Table 4 Summarization of effects on items after acupuncture therapy
GMII YMG TYG SYG JYG TYMG
NO YMG TYG JYG TYMG SYG
NOS YMG TYG SYG JYG TYMG
EGF YMG SYG JYG TYG TYMG
PGE2 YMG TYG SYG TYMG JYG
Order sequenceItems
1 2 3 4 5
Order sequence refers to the effect intensity from strong to weak.
NG 8 9 542.1±851.4b
MG 8 5 298.5±963.8d,f
YMG 8 9 653.5±1 064.7b
SYG 8 6 344.6±1 013.8d,f,
JYG 8 5 660.7±919.4d,f
TYG 8 8 391.1±1 466.1b,d
TYMG 8 5 550.4±1 501.4d,f
Table 5 Comprehensive protective effects of different meridian acupuncture on gastric mucosa (mean±SD)
Groups n WEV
bP <0.01 vs MG; dP <0.01 vs YMG; fP <0.01 vs TYG.

Yan J et al. Protective effect of acupuncture on gastric mucosa 6475
substance, now known as NO that mediates the vascular relaxation induced by vagal stimulation[10]. NO could protect the gastric mucosa by increasing gastric mucosal blood flow[11,12], suggesting that gastroprotection can be induced by low level of central vagal stimulation and the consequent release of NO, and that NO plays a role also in ulcer healing by stimulating the formation of growth factors, such as epithelial proliferation and angiogenesis[13]. NOS is a limited enzyme for NO synthesis. Studies have shown that chronic nitric oxide synthase inhibitor L-NAME enhances ulcerogenesis by decreasing mucosal resistance due to reduced mucosal blood perfusion[14–16]. When the specific iNOS inhibitor L-N6-(1-iminoethyl) lysine (L-NIL) is given intravenously to rats, the blood flow increase in response to luminal acid is attenuated[17]. Therefore, NOS is important for maintaining mucosal resistance through increasing the gastric mucosal blood flow. PGE2 is also involved in protecting gastric mucosa. PGE2 inhibits ethanol-induced apoptosis and increases cell viability in a dose-dependent manner in primary cultures of guinea pig gastric mucosal cells. PGE2 also inhibits hydrogen peroxide-induced apoptosis[18]. EGF is also a key to the protection against mucosal injury. Since acute gastric lesions are induced by cold-restraint stress,the ulcer score is significantly reduced after intraperitoneal and intragastric administration of EGF solution[19]. When EGF is added to primary monolayer cultures of guinea pig gastric mucous cells, the cytoprotection induced by EGF can be demonstrated. Mucin biosynthesis and PGE2 release are both significantly increased by EGF[20]. EGF promotes gastric mucosal restitution by activating Na+/H+ exchange of epithelial cells[21]. In the present study, the comprehensive effects of different meridian acupuncture on gastric mucosal protective factors including NO, NOS, PGE2 and EGF, the relationship between meridian and viscus were revealed. MMCSV is common in the theory of meridian and viscus correlation, manifested in two aspects. On the one hand, multiple meridians have different connections with the same viscus, and the function of meridians is complex. For example, there are five meridians connecting the stomach, namely Hand Taiyin Meridian (HTY), FTY, FJY, Hand Taiyang Meridian (HTY), FYM. On the other hand, stimulating different meridian acupoints could regulate the same viscus physical function, which is the underlying theory for treating diseases. For example, moxibustion at Neiguan (PC 6) of Hand Jueyin Meridian, Yangfu (GB 38) of FSY, as well as Shangqiu (SP 5) of FTY, can be selected for stomachache therapy. Though MMCSV is common, the meridians do have some speciality. It could be explained by the following two reasons. One is that since different meridian acupoints have a relative speciality, and meridian is composed of acupoints, it is no doubt that the meridian has some speciality. In addition, the meridian and viscus match theory also can explain the meridian’s speciality. Since FYM is the responsible meridian to stomach, acupuncture at FYM could regulate the stomach physical function and improve pathological conditions. According to viscus-
viscus match theory, the stomach is matched with the spleen; since the FTY is responsible for the spleen, acupuncture at FTY also has good effects on the stomach function regulation. Gallbladder’s bile secretion from gallbladder could help the stomach to digest, while the secretion depends on the liver dredging function. Since the FSY is responsible for gallbladder, and FJY for the liver, acupuncture at FSY and FJY also has some effects on the stomach function regulation. In the present study, FYM had the best effect on stomach function regulation, followed by FTY, FSY and FJY, while the FTYM had no effect. MMCSV is the unification for universality and speciality of meridian and viscus theory. In the present study, the protective effects of acupuncture at different meridian acupoints on gastric mucosa were various. For example, except for acupuncture at FTY, GMII decreased in all acupuncture therapy groups, while acupuncture at FYM, FTY and FSY, increased the NOS, suggesting that MMCSV is common. Acupuncture at FYM achieved the best intensity and width of protective effects on gastric mucosa. FJY had almost no effects on NO, NOS, PGE2, and EGF. FTYM has no significant effects on NO, NOS, PGE2, and EGF. In summary, the FYM is most closely related to the stomach, followed by FTY, FSY, FJY, while FTYM has no correlation with the stomach.
REFERENCES1 Bing Z. Zhenjiu De Kexue Jichu. 1th edition. Qingdao: Qingdao
Press, 1998:323 2 Sun DY, Huan YX, Gao W, Chu ZH, Wang QL. Mechanism of
electroacupuncture of Zusanli in protecting gastric mucosa of dogs. Guangzhou Zhongyiydao Daxue Xuebao 2002; 19: 192-194
3 Sun DY, Huan YX, Gao W, Chu ZH, Wang QL. Effects of electroacupuncture on plasma and gastric mucosal levels of ET in dogs. Zhenci Yanjiu 2002; 27: 197-200
4 Y a n J , L i J S , C h a n g X R , Y i S X , L i n Y P . E f f e c t o f electroacupuncture at acupoints of the Foot-Yangming meridian on gastric motion function in normal rabbits. Chinese J Cur Tra West Med 2003; 1: 193-194
5 Zhang H, Yi SX, Yan J,Chang XR, Liu YQ, Lin YP,Deng YJ. A comparative study on the effect of electroacupuncture to the points of three yang meridians of foot on brain-gut peptide of rabbits. Zhongguo Linchuang Kangfu 2004; 8: 2290-2291
6 Yi SX, Lin YP, Yan J, Chang XR, Yang Y. Effect of electro-acupuncture on gastric motility, substance P (SP) and motilin (MTL) in rats. Shijie Huaren Xiaohua Zazhi 2001; 9: 284-287
7 Miao M. Shiyan Dongwu He Dongwu Shiyan Jishu. Beijing: Zhongguo Zhongyiyao Chubanshe, 1997: 219
8 Lin WZ, Wang P. Modern Acupuncturolgy. 1th edition. Beijing: Shanghai Kexue Jishu Chubanse 1999: 278-281
9 Guth PH, Aures D, Paulsen G. Topical aspirin plus HCl gastric lesions in the rat. Cytoprotective effect of prostaglandin,
cimetidine, and probanthine. Gastroenterology 1979; 76: 88-93 10 Ko JK, Cho CH, Lam SK. Adaptive cytoprotection through
modulation of nitric oxide in ethanol-evoked gastritis. World J Gastroenterol 2004; 10: 2503-2508
11 Puurunen J, Huttunen P, Hirvonen J. Is ethanol-induced damage of the gastric mucosa a hyperosmotic effect? Comparative studies on the effects of ethanol, some other hyperosmotic solutions and acetylsalicylic acid on rat gastric mucosa. Acta Pharmacol Toxicol (Copenh) 1980; 47: 321-327
12 Yonei Y, Holzer P, Guth PH. Laparotomy-induced gastric

6476 ISSN 1007-9327 CN 14-1219/ R World J Gastroenterol November 07, 2005 Volume 11 Number 41
protection against ethanol injury is mediated by capsaicin-sensitive sensory neurons. Gastroenterology 1990; 99: 3-9
13 Whittle BJ, Lopez-Belmonte J, Moncada S. Regulation of gastric mucosal integrity by endogenous nitric oxide: interactions with prostanoids and sensory neuropeptides in the rat. Br J Pharmacol 1990; 99: 607-611
14 Palmer RM, Ferrige AG, Moncada S. Nitric oxide release accounts for the biological act ivity of endothelium-derived relaxing factor. Nature 1987; 327: 524-526
15 Holzer P. Neural emergency system in the stomach. Gastroenterology 1998; 114: 823-839
16 Wallace JL, Miller MJ. Nitric oxide in mucosal defense: a little goes a long way. Gastroenterology 2000; 119: 512-520
17 Gyires K. Gastric mucosal protection: from prostaglandins to
gene-therapy.Curr Med Chem 2005; 12: 203-215 18 Qiu BS, Pfeiffer CJ, Cho CH. Effects of chronic nitric oxide
synthase inhibition in cold-restraint and ethanol-induced gastric mucosal damage in rats. Digestion 1996; 57: 60-66
19 Kim H, Hwan Kim K. Role of nitric oxide and mucus in ischemia/reperfusion-induced gastric mucosal injury in rats. Pharmacology 2001; 62: 200-207
20 Lippe IT, Holzer P. Participation of endothelium-derived nitric oxide but not prostacyclin in the gastric mucosal hyperaemia due to acid back-diffusion. Br J Pharmacol 1992; 105: 708-714
21 Phillipson M, Henriksnäs J, Holstad M, Sandler S, Holm L.Inducible nitric oxide synthase is involved in acid-induced gastric hyperemia in rats and mice.Am J Physiol Gastrointest Liver Physiol 2003; 285: G154-G162
Science Editor Wang XL and Guo SY Language Editor ELsevier HK

PO Box 2345, Beijing 100023, China World J Gastroenterol 2005;11(41):6477-6482www.wjgnet.com World Journal of Gastroenterology ISSN [email protected] © 2005 The WJG Press and Elsevier Inc. All rights reserved.E L S E V I E R
• BASIC RESEARCH•
Acid fibroblast growth factor reduces rat intestinal mucosal damage caused by ischemia-reperfusion insult
Wei Chen, Xiao-Bing Fu, Shi-Li Ge, Tong-Zhu Sun, Wen-Juan Li, Zhi-Yong Sheng
Wei Chen, Xiao-Bing Fu, Tong-Zhu Sun, Wen-Juan Li, Zhi-Yong Sheng, Wound Healing and Cell Biology Laboratory, Burns Institute, 304th Clinical Department, General Hospital of PLA, Beijing 100037, ChinaShi-Li Ge, Institute of Radiation Medicine, Academy of Military Medicine Sciences, Beijing 100850, ChinaSupported by the National Natural Science Foundation of China, No. 30400172 and 30230370 and "973" programm NO.2005CB52203Correspondence to: Professor Xiao-Bing Fu, Wound Healing and Cell Biology Laboratory, Burns Institute, 304th Clinical Department, General Hospital of PLA, 51 Fu Cheng Road, Beijing 100037, China. [email protected]: +86-10-66867396 Fax: +86-10-88416390Received: 2004-12-28 Accepted: 2005-03-24
AbstractAIM: To detect the effects of acid fibroblast growth factor (aFGF) on apoptosis and proliferation of intestinal epithelial cells in differentiation or proliferation status to explore the protective mechanisms of aFGF.
METHODS: Wistar rats were randomly divided into sham-operated control group (C, n = 6), intestinal ischemia group (I, n = 6), aFGF treatment group (A, n = 48) and intestinal ischemia-reperfusion group (R, n = 48). Apoptosis of intestinal mucosal cells was determined with terminal deoxynucleotidyl transferase-mediated dUTP-biotin nick-end labeling (TUNEL) technique. Proliferating cell nuclear antigen (PCNA) protein expression and distribution were detected with immunohistochemical method. Plasma levels of D-lactate were determined with modified Brandts method.
RESULTS: In A group, administration of exogenous aFGF could improve intestinal histological structure and decrease plasma D-lactate levels at 2-12 h after the reperfusion compared with R group. The apoptotic rates and PCNA protein expressions were not increased until 2 h after reperfusion and were maximal at 12 h. After reperfusion for 2-12 h, the apoptotic rates were gradually augmented along the length of jejunal crypt-villus units. Administration of aFGF could significantly reduce the apoptotic response at 2-12 h after reperfusion (P<0.05). Apoptosis rates in villus and crypt epithelial cells in A group at 12 h after reperfusion were (62.5±5.5)% and (73.2±18.6)% of those in R group, respectively. Treatment of aFGF could apparently induce protein expression of PCNA in intestinal mucosal cells of A group compared with R group during 2-12 h after reperfusion
(P<0.05). There were approximately 1.3- and 1.5-times increments of PCNA expression levels in villus and crypt cells in A group at 12 h after reperfusion compared with R group, respectively.
CONCLUSION: Intestinal I/R insult could lead to histological structure change and apoptotic rate increment. The protective effects of aFGF against ischemia/reperfusion in rat intestinal mucosa might be partially due to its ability to inhibit ischemia/reperfusion-induced apoptosis and to promote cell proliferation of crypt cells and villus epithelial cells.
© 2005 The WJG Press and Elsevier Inc. All rights reserved.
Key words: Acid fibroblast growth; Ischemia; Reperfusion; Intestine; Crypt; Villus
Chen W, Fu XB, Ge SL, Sun TZ, Li WJ, Sheng ZY. Acid fibroblast growth factor reduces rat intestinal mucosal damage caused by ischemia-reperfusion insult. World J Gastroenterol 2005; 11(41): 6477-6482http://www.wjgnet.com/1007-9327/11/6477.asp
INTRODUCTIONAn ischemic insult decreases oxygen and nutrient delivery and causes post mitotic cell lineages in the brain, myocardium, muscle and adrenal cortex to undergo apoptosis. Paradoxically, the introduction of oxygen during reperfusion of ischemic tissues exacerbates the damage of these tissues[1-5]. These tissues do not allow evaluation of the effects of proliferative status or state of differentiation on the apoptotic response to this inductive stimulus. The intestinal epithelium provides an excellent system for such an analysis. Renewal of intestinal epithelium takes place continuously in anatomically distinct crypt-villus units. Proliferation is restricted to mucosal invaginations known as crypts. All epithelial cells in each crypt are derived from an uncertain number of multipotent stem cells located at or near the base of the crypt[6-8]. These crypt stem cells divided to produce daughter stem cells as well as more rapidly replicating transit cells, which in turn undergo 4-6 rapid cell divisions in the proliferative zone located in the lower half of each crypt[9,10]. The small intestine is highly sensitive to ischemia-reperfusion (I/R). It has been demonstrated that occlusion of the superior mesenteric artery (SMA) followed by reperfusion can cause apoptosis in the intestinal epithelium[11].

6478 ISSN 1007-9327 CN 14-1219/ R World J Gastroenterol November 7, 2005 Volume 11 Number 41
Acid fibroblast growth factor (aFGF) is a mitogen in vitro for most of the ectodermal- and mesodermal-derived cell lines. In addition, this factor shows a wide range of endocrine-like activities[12,13]. As a multiple function growth factor, aFGF is involved in embryo development and tissue repair[14-16]. However, the protective mechanisms of aFGF on intestinal I/R injury remain unknown. Given the anatomically well-defined stratification of proliferation and differentiation programs along its crypt-villus axis, the self-renewing intestinal epithelium provides an opportunity to consider, whether aFGF protects intestinal mucosa from I/R injury through inducing proliferation of cells located in crypt or inhibiting apoptosis of epithelial cells distributed in villus or adopting both these two procedures. In the present article, we have clarified the mechanism of aFGF protection following I/R injury in the small intestinal mucosa of rats by evaluating changes in apoptosis of epithelial cells along gut crypt-villus axis. We evaluated the expression of proliferating cell nuclear antigen (PCNA). The expressive level of this protein is frequently used to evaluate the regenerative ability of epithelial tissue[17]. We also estimated the integrity of small intestinal mucosa by measuring the levels of plasma D-lactate. This study will lead to a better understanding of the repair mechanisms of small intestinal mucosa induced by aFGF treatment after I/R injury.
MATERIALS AND METHODSAnimal model and experimental designHealthy male Wistar rats weighing 220 ± 20 g (Animal Centre, Academy of Military Medical Science, Beijing) were used in this study. Animals were housed in wire-bottomed cages placed in a room illuminated from 08:00 am to 08:00 pm (12:12 h light-dark cycle) and maintained at 21±1 oC. Rats were allowed to access water and chow ad libitum. The animals were anesthetized by using 3% sodium pentobarbital (40 mg/kg), and a laparotomy was performed. The SMA was identified and freed by blunt dissection. A micro-bulldog clamp was placed at the root of SMA to cause complete cessation of blood flow for 45 min, and thereafter the clamp was loosened to form reperfusion injury. The animals were randomly divided into sham-operated control group (C, n = 6), intestinal ischemia group (I, n = 6), aFGF treatment group (A) and intestinal ischemia-reperfusion group (R). According to the different periods after reperfusion, groups R and A were further divided into 0.25, 0.5, 1, 2, 6, 12, 24 and 48 h subgroups, respectively (n = 6, each subgroup). In group I, the animals were killed after 45 min of SMA occlusion, while in groups R and A, the rats sustained 45 min of SMA occlusion and were treated with 0.15 mL normal saline and 0.15 mL saline plus 20 μg/kg aFGF (R&D Systems, Inc.) injected from tail vein, respectively, then sustained 0.25, 0.5, 1, 2, 6, 12, 24 and 48 h of reperfusion, respectively. In C group, SMA was separated, but without occlusion, and the samples were taken after exposure of SMA for 45 min. In groups R and A, rats were killed at different time points after reperfusion. Blood samples and intestinal tissue
biopsies were taken. Blood samples were centrifuged and serum was frozen to measure plasma levels of D-lactate. Tissue biopsies were fixed with 10% neutral buffered formalin for detection of intestinal epithelial apoptosis, and protein expression of PCNA.
In situ detection of cell deathThe apoptotic cells in intestinal tissues were detected with the terminal deoxynucleotidyl transferase (TdT)-mediated dUTP-biotin nick-end labeling (TUNEL) method. Specimens were dewaxed and immersed in phosphate-buffered saline containing 0.3% hydrogen peroxide for 10 min at room temperature and then incubated with20 μg/mL proteinase K for 15 min. Seventy-f ive microliters of the equilibration buffer was applied directly onto the specimens for 10 min at room temperature, followed by 55 μL of TdT enzyme and incubation, which were then incubated at 37 ℃ for 1 h. The reaction was terminated by transferring the slides to prewarmed stop/wash buffer for 30 min at 37 ℃. The specimens were covered with a few drops of rabbit serum and incubated for 20 min at room temperature and then covered with55 μL of anti-digoxigenin peroxidase and incubated for30 min at room temperature. Specimens were then soaked in Tris buffer containing 0.02% diaminobenzidine and 0.02% hydrogen peroxide for 1 min to achieve color development. Finally, the specimens were counterstained by immersion in hematoxylin. The cells with clear nuclear labeling were defined as TUNEL-positive cells. The results of positive cells and their distribution were observed under 400 times microscope. Sixty intestinal villi and crypts per time point were required for counting, and then the apoptotic ratios were calculated and analyzed, respectively.
ImmunohistochemistryImmunostaining for PCNA was performed in paraffin sections with a high-temperature antigen-unmasking method in citrate buffer and ABC peroxidase, using monoclonal mouse antibody (Zymed Corp., ZM-0213) against antigen (1∶100 in PBS). Tissues were fixed overnight in 4% paraformaldehyde, dehydrated, and embedded in paraffin. Sections of 5 µm thickness were deparaffinized and rehydrated using graded alcohol concentrations. Antigen retrieval was performed by incubation in100 mmol/L sodium citrate, pH 6.0, at 90 ℃ for20 min. Then, sections were blocked with 5% normal swine serum in PBS for 30 min at 25 ℃, followed by incubation with primary antibodies at a concentration of 5 µg/mL overnight at 4 ℃. Control slides were incubated with PBS without primary antibodies. Tissues sections were then incubated for 60 min with biotinylated secondary antibody. After washing in PBS, the sections were exposed to acidin-biotin complex for 60 min. The sections were reacted with 0.05% (wt/vol) DAB in 50mol/LTris-HCl (pH 7.4) with 0.1% (vol/vol) hydrogen peroxide for 5 min and counterstained with hematoxylin. The results of positive staining cells and their distribution were observed under 400 times microscope. Sixty intestinal villi and crypts per time point were required for counting,

Chen W et al. Acid fibroblast growth factor reduces intestinal damage 6479
and then the ratio of positive cells were calculated and analyzed, respectively.
Measurement of plasma D-lactateThe levels of plasma D-lactate were measured with modified Brandts method[18,19]. Briefly, heparinized blood was centrifuged at 3 200 r/min for 10 min and 2 mL of the plasma was deproteinized with 0.2 mL perchloric acid (1/10 vol), mixed and kept in an ice bath for 10 min. The denatured protein solution was centrifuged at 3 200 r/minfor 10 min and the supernatant was removed. To 1.4 mLof supernatant, 0.12 mL KON was added and they were mixed for 20 s. Precipitant KCLO4 was removed by centrifugation at 3 200 r/min for 10 min. The supernatant and neutralized-protein-free plasma were used to measure the absorbency at 304 nm. Plasma D-lactate concentrations were expressed as μg/mL.
Statistical analysisAll values were expressed as mean ± SD. Differences in mean values were compared using SPSS 11.0 by one-way ANOVA and Student-Newman-Keul (SNK) test. P < 0.05 as considered as statistically significant.
RESULTSChange of cellular apoptotic ratesAfter the SMA was clamped near its origin from the aorta, the damage to the small intestine in the 45-min ischemia group was small. At 2 h after reperfusion, the partial loss of the mucosa could be observed. During6-12 h after reperfusion, the damage of intestinal epithelial cells, hemorrhage and necrosis could be found, the crypt-villus structure was seriously spoiled. In the period of24-48 h after reperfusion, the mucosal integrity was partially restored. The protective function of aFGF on intestinal mucosa was the most effective during 2-12 h after reperfusion. The structures of crypt and villus were both guarded, with less damage of the intestinal mucosa (Figure 1). Apoptosis was measured and quantified by TUNEL assay in serial sections prepared from the middle quarter of the small intestine (jejunum). The time animals were killed after a 45 min SMA occlusion
followed by reperfusion was varied to further define the apoptotic response. Statistically significant increases in TUNEL-positive cells were not detectable until 2 h after reperfusion and were maximal at 12 h. The augmentation of the cellular apoptotic rates was evident along the length of jejunal crypt-villus units after reperfusion for 2-12 h; i.e., the average increase was 2.3 times for villi [84.0 ± 6.2(12 h after reperfusion) 37.3 ± 6.6 (C group P < 0.05)] and 1.9 times for crypts [28.2 ± 3.9 (12 h after reperfusion) vs 14.4 ± 3.8 (C group P < 0.05; Table 1)]. Highest levels of apoptosis were noted in the upper quarter of the villus. In no matter villus and crypt, the apoptotic rates were restored to the levels of C group after reperfusion for 24 and 48 h. Administration of aFGF could significantly reduce the apoptotic response observed 2-12 h after reperfusion (P < 0.05). Apoptosis rates in villus and crypt epithelial cells of A group at 12 h after reperfusion were (62.5 ± 5.5)% and (73.2 ± 18.6)% of those in their littermates of R group, respectively (Table 1, Figure 2).
Expression characteristics of PCNA proteinQuantitative immunohistochemical results for PCNA protein were evaluated in Table 2 and Figure 3. PCNA was weakly expressed in the sham-operated intestinal tissues and ischemic tissues, with positive particles mostly
Figure 1 The histological structure of intestine in sham-operated control group (A), 6 h after ischemia-reperfusion in R group (B) and 6 h after ischemia-reperfusion in A group (C) (100×). Anatomic structures of villi and crypts of intestine in control group were intact. In R group, at 6 h after reperfusion, the crypt-villus structure was seriously spoiled, accompanied by inflammatory cells infiltrating into the intestinal wall. In A group, the structures of crypt and villi were both protected, with less damage of the intestinal mucosa.
A B C
Table 1 Effect of aFGF on the apoptotic rates in intestinal villi and crypts after ischemia-reperfusion insult (n = 6, mean±SD, %)
C group 37.3 ± 8.6 37.3 ± 8.6 14.4 ± 3.8 14.4 ± 3.8I group 40.0 ± 6.9 40.0 ± 6.9 13.7 ± 4.1 13.7 ± 4.10.25 h after reperfusion 45.3 ± 5.7 35.2 ± 6.7c 15.0 ± 3.2 11.8 ± 2.60.5 h after reperfusion 46.3 ± 8.3 37.8 ± 7.4 16.2 ± 4.7 13.0 ± 3.51 h after reperfusion 49.5 ± 5.3 45.3 ± 7.4 19.3 ± 5.6 16.2 ± 3.32 h after reperfusion 70.2 ± 6.5a 50.5 ± 5.3ac 23.5 ± 6.2a 17.8 ± 4.1c
6 h after reperfusion 76.8 ± 4.7a 49.2 ± 5.0a,c 27.2 ± 4.8a 19.3 ± 5.0a,c
12 h after reperfusion 84.0 ± 6.2a 52.5 ± 4.6a,c 28.0 ± 3.9a 20.5 ± 5.2a,c
24 h after reperfusion 41.8 ± 5.4 35.2 ± 5.2 14.2 ± 4.3 9.3 ± 3.648 h after reperfusion 33.7 ± 4.8 34.3 ± 6.2 13.3 ± 2.9 11.0 ± 4.3
Groups Villus Crypt
R group A group R group A group
aP<0.05 vs C group; cP<0.05 vs R group at matched time points.

6480 ISSN 1007-9327 CN 14-1219/ R World J Gastroenterol November 7, 2005 Volume 11 Number 41
distributing in the nuclei of the lower third of crypt cells. However, the positive cellular rate elevated with the increment of duration after reperfusion injury. In the period after reperfusion, marked PCNA immunoreactivities were observed in the nuclei of crypt and villus cell. At 12 h after reperfusion, the positive cellular rates were maximal, the average increase was 2.2 times for villi [19.0±5.4 vs 8.5 ± 5.0 (P < 0.05)] and 1.7 times for crypts [52.1 ± 5.1 vs 31.5 ± 5.2 (P < 0.05; Table 2)]. The positive cellular rates of PCNA were restored to the levels of sham-operated
tissues at 24 and 48 h after reperfusion. During 2-12 h after reperfusion, treatment of aFGF could apparently induce protein expression of PCNA in intestinal mucosal epithelial cells from villi and crypts in comparison with R group at different matched times (P < 0.05) (Table 2). There are approximately 1.3- and 1.5-time increments of PCNA expressive levels in both villus and crypts in rats of A group after reperfusion for 12 h compared with their littermates of R group, respectively. After reperfusion for 24 and 48 h, the positive signals of this protein had no substantial change in A group in comparison with R group (P > 0.05).
The changes of plasma levels of D-lactateAs shown in Table 3, 45 min of ischemia followed by reperfusion in intestinal mucosa could result in plasma D-lactate level elevation. Plasma D-lactate level was significantly elevated from 30 min after reperfusion in R group, and reach its peak at 12 h, which was 1.5-folds of that in sham-operated group ((0.299 ± 0.025) μg/mL vs (0.201 ± 0.008) μg/mL, P < 0.05), and then returned to the level of sham-operated group (P > 0.05). Administration of aFGF produced decreases in the plasmas D-lactate level compared with R group during 0.25-12 h after reperfusion, except for 1 h after reperfusion, leading to statistically significant reduction of D-lactate contents (P < 0.05). No significant decreases were observed at 24 and 48 h after reperfusion in A group compared with R group
Figure 2 The cellular apoptotic rates in sham-operated control group (A), 6 h after ischemia-reperfusion in R group (B) and 6 h after ischemia-reperfusion in A group (C) (200×). Cellular apoptotic rates were less in sham-operated control group and were significantly increased in villi and crypts at 6 h after reperfusion. The augmentation of the cellular apoptotic rates was evident along the length of jejunal crypt-villus units. The cellular apoptotic rates both decreased remarkably at 6 h after reperfusion in villi and crypts of A group vs those of R group.
A B C
A B C
Figure 3 The expression of PCNA protein in sham-operated control group (A), 6 h after ischemia-reperfusion in R group (B) and 6 h after ischemia-reperfusion in A group (C) (200×). PCNA was weakly expressed in sham-operated control group, with positive particles mostly distributing in the nuclei of the lower third of crypt cells. Protein contents of PCNA were significantly increased in villi and crypts at 6 h after reperfusion compared with control group. The contents of PCNA increased remarkably in villi and crypts at 6 h after reperfusion in A group vs R group.
Table 2 Effect of aFGF on protein expression of PCNA in intestinal villi and crypts after ischemia-reperfusion (n = 6, mean±SD, %)
C group 8.5 ± 5.0 8.5 ± 5.0 31.5 ± 5.2 31.5 ± 5.2I group 8.8 ± 5.3 8.8 ± 5.3 33.3 ± 4.1 33.3 ± 4.10.25 h after reperfusion 10.5 ± 5.1 10.7 ± 4.9 39.7 ± 5.4 36.0 ± 5.60.5 h after reperfusion 11.5 ± 3.8 14.7 ± 4.3 41.0 ± 4.7a 43.8 ± 5.2a
1 h after reperfusion 12.3 ± 6.2 11.3 ± 5.4 44.3 ± 4.6a 51.5 ± 6.0a
2 h after reperfusion 16.7 ± 4.5a 23.3 ± 5.1ac 48.2 ± 5.3a 67.8 ± 5.3ac
6 h after reperfusion 18.2 ± 3.5a 25.0 ± 6.4ac 47.3 ± 5.5a 76.0 ± 3.8ac
12 h after reperfusion 19.0 ± 5.4a 25.3 ± 4.5ac 52.1 ± 5.1a 79.8 ± 5.2ac
24 h after reperfusion 8.7 ± 4.7 11.2 ± 2.3 43.7 ± 5.4 44.8 ± 6.248 h after reperfusion 6.7 ± 2.9 9.2 ± 4.0 38.5 ± 6.1 42.7 ± 4.9
Groups Villus Crypt
R group A group R group A group
aP<0.05 vs C group; cP<0.05 vs R group at matched time points.

Chen W et al. Acid fibroblast growth factor reduces intestinal damage 6481
(P > 0.05, Table 3).
DISCUSSIONThe major clinical disorders involving gastrointestinal circulation are hemorrhage and ischemia. It is well recognized that the small intestine is very sensitive to the deleterious effects of I/R and it has been clearly demonstrated that I/R causes mucosal injury within the small intestine. Several recent studies have proposed that ischemia-reperfusion can induce an apoptotic response in the adult rat intestinal epithelium, although they did not quantitate this response along the crypt-villus axis[11,20]. In the current study, we found that I/R, following occlusion of the SMA, led to statistically significant increment of apoptosis in undifferentiated epithelial cells located in the proliferative compartment of the adult rat’s small intestine, as well as in differentiated epithelial cells distributed in the villus at 2-12 h after reperfusion. The most apoptotic rates in the upper portion of the villus are the region, which is farthest from submucosal vessels that supply blood to the mesenchymal core of the villus. The asymmetric distribution of apoptosis may reflect the fact that hypoxia and deficient nutrient generated by SMA occlusion are greater in epithelial cells located in the upper villus compared with crypts. However, it is also possible that the signaling pathways that mediate the induction differ qualitatively or quantitatively between undifferentiated proliferating cells in the crypt and postmitotic differentiated cells in the upper villus. The actual mechanism needs to be deeply explored. Our studies displayed that administration of exogenous aFGF produced an approximately 1.5-fold reduction in the number of TUNEL positive cells that appear following transient SMA occlusion in proliferating undifferentiated crypt epithelial lineage as well as their postmitotic differentiated villus descendants. These results are compatible with the notion that exogenous aFGF might protect from intestinal injury caused by I/R insult through an identical mechanism in villus and crypt epithelial cells. D(-)-lactate is the stereoisomer of mammalian L(+)-lactate. Mammalian tissue cannot produce D(-)-lactate
and can only slowly metabolize it. It is a strict product of bacterial fermentation. Since intestinal I/R injury can cause mucosal injury and subsequent bacterial proliferation, D(-)-lactate releasing from the gut into the host blood circulation, the change of plasma D(-)-lactate level was used as a predictor of intestinal I/R injury[21,22]. In the present study, it was shown that plasma D(-)-lactate levels began to increase in rat’s intestinal villus subjected to 45 min of ischemia followed by 30 min of reperfusion, maximal at 12 h after reperfusion. In the aFGF treated group, it was significantly decreased during 2-12 h after reperfusion compared with normal saline treated group, which was corroborated with the data obtained by the TUNEL method, indicating that aFGF exerts a positive protective effect on the mucosal barrier and decreases the intestinal permeability. Our study also found that apoptosis occurred at 2 h post-reperfusion followed by a return to baseline values by 24 h suggestsing that I/R induction of intestinal apoptosis and mucosal recovery were rapid processes. Thereason for this interesting kinetics of induction of mucosal cell death and restoration was unclear. PCNA is a significant cell-cycle regulated nuclear protein for DNA-polymerase. PCNA-labeled nuclei identify cells in the late G1 and early S phases of the cell cycle, as well as cells undergoing DNA repair[23,24]. Our current study demonstrated that the expressing levels of PCNA at 2-12 h after reperfusion were significantly higher than the levels of C control in both crypt and villus epithelial cells. These findings indicated that the repair process of small intestinal mucosa was initiated by I/R and cellular regeneration continued for 12 h following reperfusion. At the same time, the PCNA protein was mainly located in the nuclei of proliferative cells in crypts. Administration of exogenous aFGF could induce protein expression of PCNA in mucosal cells, especially in crypt epithelial cells. At 2-12 h after reperfusion, PCNA was strongly expressed both in undifferentiated crypt epithelial cells as well as differentiated villus cells in comparison with normal saline treated group. These results suggest that aFGF treatment could inhibit cellular apoptosis of mucosal cells and induced cell proliferation, especially cells in crypt, to accelerate regeneration and repair of small intestinal mucosa after ischemia-reperfusion insult. Ischemia of the adult human small intestine could result in high mortality[25]. Because administration of exogenous aFGF can ameliorate the reperfusion injury that accompanies intestinal transplantation or the epithelial wound brought about by sepsis, interventions that elevate aFGF levels or enhance its activity may be useful for reducing the damage produced by ischemia-reperfusion insult. In conclusion, the present study provided the primary evidence that the protective effects of aFGF against ischemia/reperfusion in rat’s intestinal villus might be partially due to its abilities to inhibit ischemia/reperfusion-induced apoptosis and to promote crypt and villus epithelial cell proliferation. The precise mechanism for the attenuation of intestinal ischemia/reperfusion injury and acceleration of mucosal regeneration afforded by aFGF
Groups R group A group
C group 0.201 ± 0.008 0.201 ± 0.008
I group 0.212 ± 0.011 0.212 ± 0.011
0.25 h after reperfusion 0.247 ± 0.011 0.225 ± 0.016c
0.5 h after reperfusion 0.281 ± 0.036a 0.222 ± 0.020c
1 h after reperfusion 0.285 ± 0.068a 0.233 ± 0.022
2 h after reperfusion 0.283 ± 0.031a 0.232 ± 0.018ac
6 h after reperfusion 0.293 ± 0.033a 0.252 ± 0.014ac
12 h after reperfusion 0.299 ± 0.025a 0.250 ± 0.018ac
24 h after reperfusion 0.228 ± 0.012 0.223 ± 0.015
48 h after reperfusion 0.231 ± 0.004 0.224 ± 0.009
aP<0.05 vs C group; cP<0.05 vs R group at matched time points.
Table 3 Effect of aFGF on plasma D-lactate levels after intestinal ischemia-reperfusion (n = 6, mean±SD, μg/mL)

requires further investigation.
REFERENCES1 Chang TH, Liu XY, Zhang XH, Wang HL. Effects of dl-
praeruptorin A on interleukin-6 level and Fas, bax, bcl-2 protein expression in ischemia-reperfusion myocardium. Acta Pharmacol Sin 2002; 23: 769-774
2 Zhou H, Ma Y, Zhou Y, Liu Z, Wang K, Chen G. Effects of magnesium sulfate on neuron apoptosis and expression of caspase-3, bax and bcl-2 after cerebral ischemia-reperfusion injury. Chin Med J (Engl) 2003; 116: 1532-1534
3 Wang Y, Hayashi T, Chang CF, Chiang YH, Tao LI, Su TP, Borlongan C, Lin SZ. Methamphetamine potentiates ischemia/reperfusion insults after transient middle cerebral artery ligation. Stroke 2001; 32: 775-782
4 Hatoko M, Tanaka A, Kuwahara M, Yurugi S, Iioka H, Niitsuma K. Difference of molecular response to ischemia-reperfusion of rat skeletal muscle as a function of ischemic time: study of the expression of p53, p21(WAF-1), Bax protein, and apoptosis. Ann Plast Surg 2002; 48: 68-74
5 Baskin DS, Ngo H, Didenko VV. Thimerosal induces DNA breaks, caspase-3 activation, membrane damage, and cell death in cultured human neurons and fibroblasts. Toxicol Sci 2003; 74: 361-368
6 Loeff ler M, Bratke T , Paulus U, L i YQ, Pot ten CS . Clonality and life cycles of intestinal crypts explained by a state dependent stochastic model of epithelial stem cell organization. J Theor Biol 1997; 186: 41-54
7 Fu XB, Xing F, Yang YH, Sun TZ, Guo BC. Activation of phosphorylating-p38 mitogen-activated protein kinase and its relationship with localization of intestinal stem cells in rats after ischemia-reperfusion injury. World J Gastroenterol 2003, 9: 2036-2039
8 Fu XB, Yang YH, Sun TZ, Chen W, Li JY, Sheng ZY. Rapid mitogen-activated protein kinase by basic fibroblast growth factor in rat intestine after ischemia/reperfusion injury. World J Gastroenterol 2003; 9: 1312-1317
9 Potten CS, Booth C, Pritchard DM. The intestinal epithelial stem cell: the mucosal governor. Int J Exp Pathol 1997; 78: 219-243
10 Wang ZH, Chang XT, Fu XB, Sun TZ, Yang YH, Chen W, Zhao ZL. Expression of protooncogene c-jun, p38 and proliferating cell nuclear antigen in intestinal epithelial cells in rats different development stages. Chin Crit Care Med 2003; 15: 77-80
11 Noda T , Iwakir i R , Fu j imoto K , Matsuo S , Aw TY. Programmed cell death induced by ischemia-reperfusion in rat intestinal mucosa. Am J Physiol 1998; 274: G270-G276
12 Cuevas P, Carceller F, Martinez-Coso V, Asin-Cardiel E, Giménez-Gallego G. Fibroblast growth factor cardioprotection
against ischemia-reperfusion injury may involve K+ ATP channels. Eur J Med Res 2000; 5: 145-149
13 Cuevas P, Carceller F, Martinez-Coso V, Cuevas B, Fernandez-Ayerdi A, Reimers D, Asin-Cardiel E, Gimenez-Gallego G. Cardioprotection from ischemia by fibroblast growth factor: role of inducible nitric oxide synthase. Eur J Med Res 1999; 4: 517-524
14 Chen W, Fu XB, Zhou G, Jiang D, Sun T, Sheng ZY. Gene expression of fibroblast growth factors and their receptors in proliferative and mature hypertrophic scars. Chin J Exp Surg 2004; 21: 1111-1113
15 Weng LX, Fu XB, Li XX, Sun TZ, Zheng SY, Chen W. [Effects of acidi fibroblast growth factor on hepatic and renal functions after intestinal ischemia/reperfusion injury] Zhongguo Wei Zhong Bing Ji Jiu Yi Xue 2004; 16: 19-21
16 Fu X, Cuevas P, Gimenez-Gallego G, Sheng Z, Tian H. Acidic fibroblast growth factor reduces rat skeletal muscle damage caused by ischemia and reperfusion. Chin Med J 1995; 108: 209-214
17 Itoh H, Yagi M, Hasebe K, Fushida S, Tani T, Hashimoto T, Shimizu K, Miwa K. Regeneration of small intestinal mucosa after acute ischemia-reperfusion injury. Dig Dis Sci 2002; 47: 2704-2710
18 Li JY, Sun D, Lu Y, Jin H, Jiang XG, Hu S, Sheng ZY. [Change in intestinal function in sepsis in rat] Zhongguo Weizhongbingji jiu Yixue 2004; 16: 352-354
19 Li JY, Sun D, Lu Y, Jin H, Hu S, Sheng ZY, Effect of intestinal ischemia-reperfusion on gut barrier, absorption, penetration and transmission. Shijie Huaren Xiaohua Zazhi 2004; 12: 464-466
20 Fu X, Sheng Z, Wang Y, Ye Y, Xu M, Sun T, Zhou B. Basic fibroblast growth factor reduces the gut and liver morphologic and functional injuries after ischemia and reperfusion. J Trauma 1997; 42: 1080-1085
21 Murray MJ, Barbose JJ, Cobb CF. Serum D (-)-lactate levels as a predictor of acute intestinal ischemia in a rat model. J Surg Res 1993; 54: 507-509
22 Murray MJ, Gonze MD, Nowak LR, Cobb CF. Serum D (-)-lactate levels as an aid to diagnosing acute intestinal ischemia. Am J Surg 1994; 167: 575-578
23 Itoh H, Yagi M, Fushida S, Tani T, Hashimoto T, Shimizu K, Miwa K. Activation of immediate early gene, c-fos, and c-jun in the rat small intestine after ischemia/reperfusion. Transplantation 2000; 69: 598-604
24 Chen W, Fu XB, Sun TZ, Zhao Z, Yang Y, Sheng ZY. Characteristics of proliferating cell nuclear antigen and P53 expression in fetal and postnatal skins and their biological significance. Chin Criti Care Med 2002; 14: 654-657.
25 Chen W, Fu XB, Ge SL, Sun TZ, Zhao JY, Du YR, Sheng ZY. Effects of extrogenous aFGF on bax and bcl-2 expression in intestine cells after ischemia/reperfusion. Shijie Huaren Xiaohua Zazhi 2004; 12: 2599-2604.
Science Edited Wang XL and Guo SY Language Editor ELsevier HK
6482 ISSN 1007-9327 CN 14-1219/ R World J Gastroenterol November 7, 2005 Volume 11 Number 41

PO Box 2345, Beijing 100023, China World J Gastroenterol 2005;11(41):6483-6488www.wjgnet.com World Journal of Gastroenterology ISSN [email protected] © 2005 The WJG Press and Elsevier Inc. All rights reserved.E L S E V I E R
• BASIC RESEARCH •
Jian Li, Jian-Zhao Niu, Ji-Feng Wang, Yu Li, Xiao-Hua Tao, Cell Biochemistry Laboratory, Basic Medicine College, Beijing University of Traditional Chinese Medicine, Beijing 100029, ChinaSupported by National Natural Science Foundation of China, No. 30130220 and Program for Changjiang Scholars and Innovative Research Team in University (2004)Correspondence to: Jian-Zhao Niu, Basic Medicine College, Beijing University of Traditional Chinese Medicine, Beijing 100029, China. [email protected]: +86-10-64287538 Fax: +86-10-64286716Received: 2005-05-09 Accepted: 2005-06-24
AbstractAIM: To study the role of hepatic sinusoidal capillarization and perisinusoidal fibrosis in rats with alcohol-induced portal hypertension and to discuss the pathological mechan isms of a lcoho l - induced hepat ic por ta l hypertension.
METHODS: Fifty SD rats were divided into control group (n=20) and model group (n=30). Alcoholic liver fibrosis rat model was induced by intragastric infusion of a mixture containing alcohol, corn oil and pyrazole (1 000:250:3). Fifteen rats in each group were killed at wk 16. The diameter and pressure of portal vein were measured. Plasma hyaluronic acid (HA), type IV collagen (CoIV) and laminin (LN) were determined by radio immunoassay. L iver t issue was f ixed in formalin (10%) and 6-μm thick sections were routinely stained with Mallory and Sirius Red. Liver tissue was treated with rabbit polyclonal antibody against LN and ColIV. Hepatic non-parenchymal cells were isolated, total protein was extracted and separated by SDS-PAGE. MMP-2 and TIMP-1 protein expression was estimated by Western blotting.
R E S U LT S : T h e d i a m e t e r ( 2 . 2 0 7 ± 0 . 0 9 6 v s 1.528 ± 0.054 mm, P<0.01) and pressure (11.014±0.395 vs 8.533±0.274 mmHg, P<0.01) of portal vein were significantly higher in model group than those in the control group. Plasma HA (129.97±16.10 vs 73.09±2.38 ng/mL, P<0.01), ColIV (210.49±4.36 vs 89.65±4.42 ng/mL, P<0.01) and LN (105.00±7.29 vs 55.70±4.32 ng/mL, P<0.01) were upregulated in model group. Abundant collagen deposited around the central vein of lobules, hepatic sinusoids and hepatocytes in model group. ColI and ColIII increased remarkably and perisinusoids were almost surrounded by ColIII.
Pathological mechanisms of alcohol-induced hepatic portal hypertension in early stage fibrosis rat model
Jian Li, Jian-Zhao Niu, Ji-Feng Wang, Yu Li, Xiao-Hua Tao
Immunohistochemical staining showed that ColIV protein level (0.130±0.007 vs 0.032±0.004, P<0.01) and LN protein level (0.152±0.005 vs 0.029±0.005, P<0.01) were up-regulated remarkably in model group. MMP-2 protein expression (2.306±1.089 vs 0.612±0.081, P<0.01) and TIMP-1 protein expression (3.015±1.364 vs 0.446±0.009, P<0.01) in freshly isolated hepatic non-parenchymal cells were up-regulated in model group and TIMP-1 protein expression was evidently higher than MMP-2 protein expression (2.669±0.170 vs 1.695±0.008, P<0.05).
CONCLUSION: Hepatic sinusoidal capillarization and peri-sinusoidal fibrosis are responsible for alcohol-induced portal hypertension in rats.
© 2005 The WJG Press and Elsevier Inc. All rights reserved.
Key words: Alcoholic liver fibrosis; Portal hypertension; Hepatic sinusoidal capillarization; Perisinusoidal fibrosis
Li J, Niu JZ, Wang JF, Li Y, Tao XH. Pathological mechanisms of alcohol-induced hepatic portal hypertension in early stage fibrosis rat model. World J Gastroenterol 2005; 11(41):6483-6488http://www.wjgnet.com/1007-9327/11/6483.asp
INTRODUCTIONIn China, the number of patients with alcoholic liver fibrosis is increasing. It has been reported that about 20% of people with 10-20 years of alcohol drinking might develop alcoholic liver fibrosis[1]. Portal hypertension is a major complication of liver fibrosis and cirrhosis, which can lead to variceal bleeding, fluid retention and reduced renal blood flow, etc. being a major cause of death in patients with liver fibrosis. The pathological mechanisms of portal hypertension remain unclear. Recently, it has been found that pathological changes of hepatic microvasculature play a major role in the formation of portal hypertension[2]. Wang et al[3]. pointed out that alcohol might cause microvasculature obstruction and capillarization of hepatic sinusoids. Capillarization of the sinusoids is an early event in liver fibrogenesis, which is gradually formed by deposition of type IV collagen and LN in the perisinusoidal space and finally forms a complete and thick basement membrane[4]. When liver fibrosis occurs, it affects normal material exchange between blood and hepatocytes while the blood flow

6484 ISSN 1007-9327 CN 14-1219/R World J Gastroenterol November 7, 2005 Volume 11 Number 41
resistance and portal hypertension ensue. Studies on the relation between alcoholic liver injury and portal hypertension are rarely available and the pathological mechanisms are still controversial. One of the popular hypotheses is that hepatic non-parenchymal cells might synthesize basement membrane proteins and take part in the formation of extra-cellular matrix (ECM)[5]. In order to understand the pathological mechanisms of alcohol-induced portal hypertension, we explored the possible changing rule by which ECM of perisinusoid basement membrane (types І, III and IV collagen and LN) abides. Moreover, the synthesis of MMP-2 and TIMP-1 protein in freshly isolated hepatic non-parenchymal cells and their correlation with portal hypertension were also investigated. Hopefully, this may provide new insights for the prevention of alcoholic liver fibrosis.
MATERIALS AND METHODSMaterialsMale SD rats weighing 160±10 g, were purchased from Vital River Experimental Animal Company (eligible certificate number: SCXK2002-2003). Pyrazole was purchased from Aldrich Chemical Company. Alcohol was purchased from Beij ing Red Star Alcohol Ltd (concentration: 52%). Conventional corn oil was from the supermarket. Rabbit immunoglobulins directed against mouse ColIV, LN, MMP-2, and TIMP-1 were from Santa Cruz (USA). Secondary antibody (PV-6001) and DAB kit were purchased from Beijing Zhongshan Company. Unless specifically indicated, all other reagents were purchased from Beijing Chemical Agent Company.
Modeling alcoholic liver fibrosis Fifty rats were divided into control group (n = 20) and model group (n = 30). Alcoholic liver fibrosis model was induced by intra-gastric infusion of a mixture containing alcohol, corn oil and pyrazole (1 000:250:3) as previously described[6,7]. The control rats received intra-gastric infusion of saline solution and had normal diet. Fifteen animals in each group were killed at wk 16.
Measurement of portal vein diameter and pressure Rats were anesthetized with sodium pentobarbital (40 mg/kg, ip) and the abdomen was opened to expose the portal vein. Portal vein diameter and pressure were measured. The numerical value was recorded as previously described8].
Radioimmunoassay of HA, ColIV and LN Blood samples were obtained by abdominal aortic artery puncture for radioimmunoassay of HA, ColIV and LN using a standardized and optimized commercial radioimmunoassay kit.
Liver tissue collagen stainingLiver tissue was fixed in buffered formalin (10%) and embedded in paraffin. Sections (6-μm thick) were routinely stained with Mallory and Sirius Red, then observed under
ordinary optical and polarization microscope.
Liver tissue immunohistochemical stainingLiver tissue sections were treated with 1% hydrogen peroxide, 0.1% proteinase K and 1% Triton X-100. The sections were reacted with 1:150 diluted rabbit polyclonal antibody against LN and ColIV overnight at 4 ˚C, then with PV-6001 kits for 2 h at room temperature (SP method).
Isolation of hepatic nonparenchymal cellsHepatic non-parenchymal cells were isolated from male SD rats with proteinase E and collagenase digestion as described previously[9]. Following perfusion, hepatocytes were removed by low-speed centrifugation. Hepatic non-parenchymal cells were separated by density centrifugation in a Nycodenz (33%) gradient. Hepatic sinusoidal cells, Kupffer cells and hepatic stellate cells were harvested.
Western blotting Hepatic non-parenchymal cells were treated with RIPA (50 mmol/L TrisHCl, 150mmol/L NaCl, 0.025% NaN3, 0.1% SDS, 100 μg/mL PMSF, 1 mmol/L NaF, 1% NP-40, 2 mmol/L Na3VO4, 50mmol/L Hepes, 1% Triton X-100) to extract total protein. Total protein was detected with the BCA protein assay method. Total protein(12μg) was loaded into each lane. Cell extracts were separated by SDS-PAGE using a 12% gel and transferred onto a PVDF membrane. The membranes were blocked for 1 h at room temperature in 10 g/L BSA and incubated overnight at 4˚C with surviving antibody(MMP-2 and TIMP-1), then with sheep anti-rabbit second antibody conjugated to horseradish peroxidase for 2 h. Finally the membranes were developed with DAB and incubated until color developed sufficiently. An equal amount of proteins was loaded onto the stocking gel, β-actin expression was simultaneously estimated in each sample as the internal marker by Western blotting using anti-actin monoclonal antibody.
Image analysis of immunohistochemical staining and Western blot resultsImmunohistochemical staining results were analyzed by “5-point sampling” method using the Motic patho-image analysis system on 7 sections for each group. Under the same magnification (10×20), we collected 35 samples from each group, then measured the average facio-density (average facio-density = whole area of positive reaction grains/whole area of visual field). Western blotting results were analyzed by the Motic gel analysis system. We compared the gray scale value of target protein and internal marker to gain the relative optical density value.
Statistical analysisSPSS version 10.0 was used. Data were analyzed using test and one-way ANOVA. All values were expressed as mean±SE. P<0.05 or <0.01 was considered statistically significant.

Li J et al. pathological mechanisms of hepatic portal hypertension 6485
Table 1 Comparison of portal vein diameter and pressure in control and model groups (mean±SE)
Group n Portal vein diameter (mm) Portal vein pressure (mmHg)
Control 10 1.528 ± 0.054 8.533 ± 0.274 b
Model 10 2.207 ± 0.096 11.014 ± 0.395b
bP<0.01 vs control.
RESULTSChanges of portal vein diameter and pressureAll data of portal vein diameter and pressure were collected and analyzed by a computer. The results are shown in Table 1. Portal vein diameter and pressure were significantly higher in model group than in control group (bP<0.01)
Figure1 Levels of plasma HA, ColIV and LN in model and control groups bP<0.01 vs control.
Immunohistochemical stainingThe immune reaction for ColIV in normal liver was detected only at the level of portal tract and around the major central vein of lobules (Figure 2E). In alcoholic liver fibrosis tissue, positive ColIV was detected at the level of portal tract and in the central vein of lobules or in the Disse space between the sinusoid cells and hepatocytes (Figure 2F). Image analysis showed that the average facio-density of positive granules in ColIV of alcoholic liver fibrosis tissue was upregulated remarkably compared to the normal liver tissue (0.130±0.007 vs 0.032±0.004, P<0.01, Figure 3).
Plasma HA, ColIV and LN assayPlasma HA, ColIV and LN levels were detectable b y r a d i o i m m u n o a s s a y. T h e l e v e l s o f p l a s m a H A ( 129.97±16.10 v s 7 3 . 0 9 ± 2 . 3 8 n g / m L ) , ColIV(210.49±4.36 vs 89.65±4.42 ng/mL) and LN(105.00±7.29 vs 55.70±4.32 ng/mL) were all up-regulated in model group compared to control group(P<0.01, Figure 1).
Figure 3 Density of ColIV and LN in positive granule area bP<0.01 vs control in model and co.
In normal liver tissue, a few LN positive cells were detected (Figure 2G). However, the LN positivity increased significantly in alcoholic liver fibrosis tissue. The LN positive granules deposited not only in the cytoplasm but also in the perisinusoidal area (Figure 2H). Image analysis showed that the average facio-density of positive granules in LN was upregulated remarkably compared to the normal liver tissue (0.1518±0.0058 vs 0.0299±0.0058, P<0.01, Figure 3).
Figure 4 Comparison of MMP-2 and TIMP-1 protein expression in hepatic non-parenchymal cells between model and control groupsbP<0.01, model group vs control group; cP<0.05, TIMP-1 vs MMP-2.
Results of Mallory and Sirius Red stainingMore collagen was stained with Mallory in model group than in control group. Optical microscopy showed that there was only a little collagen around the central vein of lobules in control rats (Figure 2A). On the contrary, abundant collagen deposited around the central vein of lobules, hepatic sinusoids and hepatocytes in model group, which interweaved to form a net-shape pattern and connected with each other (Figure 2B). Polarization microscopy showed that ColIV was red or yellow while ColIV was green, suggesting that there was a small quantity of ColIV around the central vein of lobules in control rats (Figure 2C). But in model rats, ColIV and ColIV increased remarkably and perisinusoids were almost surrounded by increased ColIV (Figure 2D).
OD
val
ue
Western blotting analysisWestern blotting analysis showed that MMP-2 and
Control
Model
250
200
150
100
50
0
ng/m
L b
b
b
HA Col IV LN
Control
Model
0.18
0.16
0.14
0.12
0.1
0.08
0.06
0.04
0.02
0
Area
den
sity
ColIV LN
b
b
5
4
3
2
1
0 MMP-2 TIMP-1
b
b Normal
Model

6486 ISSN 1007-9327 CN 14-1219/R World J Gastroenterol November 7, 2005 Volume 11 Number 41
Figure 2 Mallory, Sirius Red and immunohistochemical staining of liver tissue. A: Mallory staining of normal rat liver tissue, ×200 B: Mallory staining of rat alcoholic fibrosis liver tissue, ×400 C: Sirius Red staining of normal rat liver tissue and polarization microscopy, ×200 D: Sirius Red staining of rat alcoholic fibrosis liver tissue and polarization microscopy, ×200 E: Immunohistochemical staining of the first antibody of ColIV of normal rat liver tissue, ×200 F: Immunohistochemical staining of the first antibody of ColIV rat alcoholic liver fibrosis tissue, ×200 G: Immunohistochemistry staining of the first antibody of LN in normal rat liver tissue, ×200 H: Immunohistochemical staining of the first antibody of LN in rat alcoholic liver fibrosis tissue, ×200.
A B
C D
E F
G H

Li J et al. pathological mechanisms of hepatic portal hypertension 6487
TIMP-1 proteins were significantly up-regulated in rat fibrosis liver tissue compared to control group (2.306±1.089 vs 0.612±0.081 and 3.015±1.364 vs 0.446±0.009, P<0.01).Image analysis of rat fibrosis liver tissue showed that protein expression was higher in TIMP-1 than in MMP-2 (2.669±0.170 vs 1.695±0.008, P<0.05, Figure 4).
DISCUSSIONIn this study, portal vein pressure increased significantly in the early stage of alcoholic l iver fibrosis. ColI, ColIII, ColIV and LN levels were increased in the ECM of basement membrane. Furthermore, TIMP-1 protein level was increased in hepatic non-parenchymal cells isolated from alcoholic liver fibrotic tissue, suggesting that the major pathological changes are capillarization of hepatic sinusoids and perisinusoidal fibrosis in early stage of alcoholic liver fibrosis. Some studies demonstrated that kupffer cells, hepatic stellate cells (HSC) and sinusoidal endothelial cells (SEC) play a key role in the synthesis or decomposition of extra cellular matrix (ECM)[10,11]. Others believe that the levels of serum hyaluronate are strongly related to SEC injury and hepatic microcirculation disorders[12]. Serum hyaluronate is a better index of morphological and functional changes in SECs. Our results showed that the level of rat serum hyaluronate increased remarkably in the early stage of alcoholic liver fibrosis, indicating that SECs are severely injured. When SECs get injured, a large number of inflammatory leucocytes move to the injured sinusoids and trigger the self-recovery process. Therefore, the ECM of basement membrane increases and enwraps the injured sinusoids in order to defend against inflammatory leucocytes. After repeated injury, over-recovery emerges and the ECM of basement membrane including type I, III, IV collagen and LN is over-deposited in perisinusoid[13,14]. Deposition of type I, III, IV collagen and LN reduces hepatic sinusoidal penetration and causes sinusoidal capillarization[15]. Hepatic sinusoids are special capillaries that are limited by fenestrated endothelial cells without a genuine basement membrane and surrounded by perisinusoidal cells storing vitamin A and Kupffer cells as well as pit cells, resident macrophages and large granular lymphocytes[16]. Hepatic sinusoidal capillarization includes a series of pathological changes, in which SECs lose fenestrae, basement membrane develops and sinusoidal outlets collapse[17]. All these pathological changes disable the normal sinusoid intrinsic functions[18]. Capillarization of the sinusoid may cause a disturbance in the exchange of many bioactive substances between the sinusoidal blood and hepatocytes across the Disse space, contributing to the pathogenesis of alcoholic liver fibrosis. On the other hand, with the occurrence of sinusoidal capillarization, the sinusoidal space is significantly narrowed and the sinusoidal endothelial fenestrations are decreased in size and number or disappear in the end. All these pathological changes increase resistance of the hepatic vascular bed and pressure of hepatic portal vein.
Additionally, the breakdown of ECM is essential for tissue remodeling. The matrix metalloproteinases (MMPs), also called matrixins, are thought to play a central role in these processes[19]. The activities of MMPs are precisely controlled during the activation from their precursors and inhibited by tissue inhibitors of metalloproteinases (TIMPs)[20]. MMP-2 is secreted from Kupffer cells and HSCs as they become activated. Also, the activation of MMP-2 is in turn inhibited by TIMP-1. Generally, TIMP-1 and MMP-2 affect biological functions by non-covalent bond [20]. At the early stage of alcoholic liver fibrosis, with the activation of Kupffer cells and HSCs, the level of MMP-2 expression increases. MMP-2 can decompose type I, III, IV collagen and assist Kupffer cells, HSCs and SECs to activate and transfer. Emmanouil et al[21]. showed that increased MMP-2 could decompose the basal membrane of neighboring SECs. The signal of injured SECs triggers the mechanisms of TIMP synthesis to balance the levels of MMPs. However, while repeated injury occurs, the synthesis of ECM becomes stronger than decomposition[22,23]. We examined the expression of MMP-2 and TIMP-1 protein in freshly isolated hepatic non-parenchymal cells of normal and fibrotic rats by Western blotting. The results showed that the levels of MMP-2 and TIMP-1 protein expression were upregulated in the early stage of alcoholic liver fibrosis, the level of TIMP-1 was significantly higher than that of MMP-2, suggesting that the synthesis of basal membrane collagen is stronger than decomposition and more and more ECMs of the basement membrane are synthesized due to the inhibition deposit around SECs and hepatocytes of MMPS[24]. This in turn induces perisinusoidal fibrosis and causes aggravating portal hypertension[25,26]. The therapy of alcohol-induced liver disease varies according to the severity of histological liver damage and clinically overt portal hypertension and hepatic dysfunction[27,28]. Only a few studies have been conducted on alcohol-induced portal hypertension in the past decades[29,30]. Our experimental results showed that hepatic portal hypertension occurred earlier than alcohol-induced cirrhosis, suggesting that hepatic portal hypertension plays a potential role in cirrhosis. In conclusion, hepatic sinusoidal capillarization and perisinusoidal fibrosis are the vital causes for alcohol-induced portal hypertension in rats. A thorough evaluation of hepatic microcirculation and anti-capillarization may provide the basis for new therapeutic avenues.
REFERENCES1 Lu XL, Luo JY, Tao M, Gen Y, Zhao P, Zhao HL, Zhang XD,
Dong N. Risk factors for alcoholic liver disease in China. World J Gastroenterol 2004; 10: 2423-2426
2 Wang Xb, Liu P, Tang ZP, Lu X, Liu CH, Hu YY, Xu LM, Gu H-T, Liu CH. Study on the mechanisms of development of hepatic sinusoidal capillarization. Zhonghua Xiaohua Zazhi 2004; 24: 289-292
3 Wang BY, Fu BY, Zhang J, Ju XH, Cao YX. The influence of alcohol on the liver sinusoids endothelial cell fenestrae of rats Zhonghua Gan Zang Bing Za Zhi 2004; 12: 479-481
4 Xu GF, Wang XY, Ge GL, Li PT, Jia X, Tian DL, Jiang LD,

6488 ISSN 1007-9327 CN 14-1219/R World J Gastroenterol November 7, 2005 Volume 11 Number 41
Science Editor Wang XL and Guo SY Language Editor Elsevier HK
Yang JX. Dynamic changes of capillarization and peri-sinusoid fibrosis in alcoholic liver diseases. World J Gastroenterol 2004; 10: 238-243
5 Neubauer K, Kruger M, Quondamatteo F, Knittel T, Saile B, Ramadori G. Transforming growth factor-beta1 stimulates the synthesis of basement membrane proteins laminin, collagen type IV and entactin in rat liver sinusoidal endothelial cells. J Hepatol 1999; 31: 692-702
6 Lin H, Lu M, Zhang YX, Wang BY, Fu BY. Induction of a rat model of alcoholic liver diseases. Shijie Huaren Xiaohua Zazhi 2001; 9: 24-28
7 Ding X, Meng YC, Ben CE, Tian DL. Induction of alcoholic liver fibrosis animal model. Zhongguo Zhongyi Jichu Yixue Zazhi 1999; 5: 47-48
8 Scorticati C, Prestifilippo JP, Eizayaga FX, Castro JL, Romay S, Fernández MA, Lemberg A, Perazzo JC. Hyperammonemia, brain edema and blood-brain barrier alterations in prehepatic portal hypertensive rats and paracetamol intoxication. World J Gastroenterol 2004; 10: 1321-1324
9 Zhang X, Yu WP, Gao L, Wei KB, Ju JL, Xu JZ. Effects of lipopolysaccharides stimulated Kupffer cells on activation of rat hepatic stellate cells. World J Gastroenterol 2004; 10: 610-613
10 Zimmermann A, Zhao D, Reichen J. Myofibroblasts in the cirrhotic rat liver reflect hepatic remodeling and correlate with fibrosis and sinusoidal capillarization. J Hepatol 1999; 30: 646-652
11 Kimura H, Mochida S, Inao M, Matsui A, Fujiwara K. Angiopoietin/tie receptors system may play a role during reconstruction and capillarization of the hepatic sinusoids after partial hepatectomy and liver necrosis in rats. Hepatol Res 2004; 29: 51-59
12 Hao JH, Shi J, Ren WH, Han GQ, Zhang JR, Wang WZ, Wang SY, Wang YH. The relationship between serum hyaluronate level and hepatic microcirculation status. Linchuang Ganbing Zazhi 2002; 18: 35-37
13 X u G F , T i a n D L . P r o g r e s s i v e o f h e p a t i c s i n u s o i d a l capillarization. Zhongguo Zhongxiyi Jiehe Zazhi 2002; 10: 314-316
14 Jia YT, Zeng MD. Progressive on hepat ic s inusoidal capillarization. Guowai Yixue: Xiaohuadao Jibing 2000; 20: 86-90
15 Reichen J. The role of the sinusoidal endothelium in liver function. News Physiol Sci 1999; 14: 117-121
16 Paolo Onori, Sergio Morini, Antonio Franchitto, Robert Sferra, Domenico Alvaro, Eugenio Gaudio. Hepatic microvascular features in exper imenta l c i r rhos is : a s t ructura l and morphometrical study in CCl4-treated rats. J Hepatol 2000; 33: 555-563
17 Xiao W, Wang Y, Liu X. The coordinated expression of laminin and its integrin receptor in hepatic sinusoidal capillarization. Zhonghua Neike Zazhi 2001; 40: 618-620
18 Nakashima O, Kurogi M, Yamaguchi R, Miyaaki H, Fujimoto M, Yano H, Kumabe T, Hayabuchi N, Hisatomi J, Sata M, Kojiro M. Unique hypervascular nodules in alcoholic liver cirrhosis:
identical to focal nodular hyperplasia-like nodules? J Hepatol 2004; 41: 992-998
19 Arthur MJ. Fibrogenesis II. Metalloproteinases and their inhibitors in liver fibrosis. Am J Physiol Gastrointest Liver Physiol 2000; 279: G245-G249
20 Nagase H, Woessner JF. Matrix metalloproteinases. J Biol Chem 1999; 274: 21491-21494
21 Karagiannis ED, Popel AS. A theoretical model of type I collagen proteolysis by matrix metalloproteinase 2 and membrane type 1 MMP in the presence of tissue inhibitor of metalloproteinase 2. J Biol Chem 2004; 279: 39105-39114
22 Vaillant B, Chiaramonte MG, Cheever AW, Soloway PD, Wynn TA. Regulation of hepatic fibrosis and extracellular matrix genes by the th response: new insight into the role of tissue inhibitors of matrix metalloproteinases. J Immunol 2001; 167: 7017-7026
23 Murphy FR, Issa R, Zhou X, Ratnarajah S, Nagase H, Arthur MJ, Benyon C, Iredale JP. Inhibition of apoptosis of activated hepatic stellate cells by tissue inhibitor of metalloproteinase-1 is mediated via effects on matrix metalloproteinase inhibition: implications for reversibility of liver fibrosis. J Biol Chem 2002; 277: 11069-11076
24 Li J, Niu JZ, Zeng Y, Yang MJ, Tao XH, Wang JF. Effects of FFBJRGP on collagen deposition in hepatic Disse space in alcohol induced liver fibrosis in rat. Jiefangjun Yixue Zazhi 2004; 29: 567-570
25 Lu X, Liu P, Xu GF, Liu CH, Li FH, Liu C. The role of hepatic sinusoid capillarization during the formation of portal hypertension in fibrotic rats induced by dimethylnitrosamine Zhonghua Gan Zang Bing Za Zhi 2003; 11: 595-598
26 Zhang RP, Zhang WH, Xue DB, Wei YW. Morphology of portal hypertension at the early stage of liver damage induced by CCl4: an experimental study with dogs Zhonghua Yi Xue Za Zhi 2004; 84: 1118-1121
27 Xu B, Broome U, Uzunel M, Nava S, Ge X, Kumagai-Braesch M, Hultenby K, Christensson B, Ericzon BG, Holgersson J, Sumitran-Holgersson S. Capillarization of hepatic sinusoid by liver endothelial cell-reactive autoantibodies in patients with cirrhosis and chronic hepatitis. Am J Pathol 2003; 163: 1275-1289
28 Patch D, Armonis A, Sabin C, Christopoulou K, Greenslade L, McCormick A, Dick R, Burroughs AK. Single portal pressure measurement predicts survival in cirrhotic patients with recent bleeding. Gut 1999; 44: 264-269
29 Mookerjee RP, Sen S, Davies NA, Hodges SJ, Williams R, Jalan R. Tumor necrosis factorα is an important mediator of portal and systemic haemodynamic derangements in alcoholic hepatitis. Gut 2003; 52: 1182-1187
30 Diehl AM. Liver disease in alcohol abusers: clinical perspective. Alcohol 2002; 27: 7-11

• BASIC RESEARCH •
Effects of angiotensin II receptor antagonist, Losartan on the
apoptosis, proliferation and migration of the human pancreaticstellate cells
Wen-Bin Liu, Xing-Peng Wang, Kai Wu, Ru-Ling Zhang
EL SEVIER
PO Box 2345, Beijing 100023, China World J Gastroenterol 2005;11(41):6489-6494
www.wjgnet.com World Journal of Gastroenterology ISSN 1007-9327
[email protected] © 2005 The WJG Press and Elsevier Inc. All rights reserved.
Wen-Bin Liu, Xing-Peng Wang, Kai Wu, Ru-Ling Zhang,Shanghai No. 1 People’s Hospital, Shanghai Jiaotong University,Shanghai 200080, ChinaSupported by Shanghai Sanitary Bureau Foundation, No. 40306Correspondence to: Xing-Peng Wang, Shanghai No. 1 People’sHospital, Shanghai Jiaotong University, Shanghai 200080,China. [email protected]: +86-21-63240090-4706 Fax: +86-21-63240825Received: 2004-12-30 Accepted: 2005-02-18
Abstract
AIM: To investigate the effects of AT1 (Type 1 angiotensinII receptor) antagonist (Losartan) on the apoptosis,proliferation and migration of the human pancreaticstellate cells (hPSCs).
METHODS: hPSCs were isolated from pancreaticsample of patients with pancreatic carcinoma usingradioimmunoassay (RIA) technique to detect theconcentration of AngII in culture media and cellhomogenate. Immunocytochemistry (ICC) and in situhybridization (ISH) methods were utilized to test AT1
expression in hPSCs. Effects of Losartan on hPSCsproliferation, apoptosis and migration were investigatedusing BrdU incorporation, TUNEL, flow cytometry (FCM),and phase-contrast microscope separately when cellstreated with Losartan. Immunofluorescence and Westernblot were applied to quantify the expression of type Icollagen in hPSCs.
RESULTS: There exists AT1 expression in hPSCs, whileno AngII was detected in culture media and cellhomogenate. Losartan induces cell apoptosis in a dose-and time-dependent manner (apparently at 10-5 mol/L),no pro-proliferative effect was observed in the samecondition. Corresponding dosage of Losartan can alsoalleviate the motion capability and type I collagen contentof hPSCs compared with AngII treatment and non-treatmentcontrol groups.
CONCLUSION: These findings suggest that paracrine notautocrine functions of AngII may have effects on hPSCs,which was mediated by AT1 expressed on cells, whileLosartan may exert anti-fibrotic effects by inhibiting hPSCsmotion and partly by inducing apoptosis.
© 2005 The WJG Press and Elsevier Inc. All rights reserved.
Key words: Pancreatic stellate cell; Angiotensin II receptor;Antagonist; Losartan
Liu WB, Wang XP, Wu K, Zhang RL. Effects of angiotensinII receptor antagonist, Losartan on the apoptosis,proliferation and migration of the human pancreatic stellatecells. World J Gastroenterol 2005; 11(41):6489-6494
http://www.wjgnet.com/1007-9327/11/6489.asp
INTRODUCTIONFibrosis is a dynamic process in which both altered matrixdegradation and abnormal extracellular matrix (ECM)protein synthesis play key roles[1,2]. Chronic pancreatitis isaccompanied by progressive fibrosis that is characterizedby the loss of functional tissue and its replacement by ECM,while the molecular mechanisms of pancreatic fibrogenesisremain to be elucidated.
In 1998, star-shaped cells in the pancreas, namely PSCs,were identified and characterized[3,4]. These cells like theircounterparts, hepatic stellate cells (HSCs) and pancreaticstellate cells (PSCs) are responsible for the development ofpancreatic fibrosis. Meanwhile, many of the morphologicaland metabolic changes associated with the activation ofPSCs in animal models of fibrosis also occur when thesecells are grown in culture on plastics. Therefore, a cultureof primary PSCs on plastics has been accepted as a modelthat mimics the in vivo process of PSC activation followingpancreatic injury[5].
Numerous studies have emphasized the important roleof the local Renin-angiotensin system (RAS) in thefibrogenesis that occurs in the setting of chronic kidney orcardiac diseases and the antifibrogenic effect of therapieswith AT1 blockers or angiotensin-converting enzyme (ACE)inhibitors in this condition. Recent study has shown thatAngII may induce apoptosis in some type of cells triggeredby the interaction with AT1
[6]. Also, AngII can promote cellmigration even though the mechanism is still unclear. Alocal RAS has been described in the pancreas[7-9]. Thoughapoptosis, migration and proliferation of human pancreaticstellate cells (hPSCs) might affect the pancreatic fibroticprocess, it has reason to hypothesize that AngII and AT1
may participate in this process by different mechanisms.The present study attempts to investigate the effects of
Losartan, an antagonist of AT1 on hPSCs, providinglaboratory data for interfering pancreatic fibrosis.
MATERIALS AND METHODSCell isolation and culturehPSCs were isolated from pancreatic sample of patients

6490 ISSN 1007-9327 CN 14-1219/ R World J Gastroenterol November 7, 2005 Volume 11 Number 41
with pancreatic carcinoma (kindly gifted by Prof. BachemMG)[4], culturing in a 95% air and 50 mL/L CO2 incubatorat 37 ℃ with DMEM containing 10% FCS supplementedwith 100 U/mL penicillin,100 µg/mL streptomycin and2 mmol/L L-glutamine.
AngII level in culture media and cell homogenateCell homogenate and culture media were taken and kept at-30 ℃ for assays. The levels of AngII were determined byradioimmunoassay (RIA) method following the companydirections (Northern Biot Co, China).
ICC Staining of AT1
For analysis of AT1 expression, cells were fixed with acetonefor 5 min, exposed to a rabbit anti-human AT1 antibody(4 ℃ overnight, 1:200 in PBS, Boster, Wuhan, China),washing and incubating with an anti-rabbit secondaryantibody (37 ℃, 2 h, 1:200 in PBS, Dako, USA) and withthe substrate solution (DAB in H2O2 in Tris buffer pH 7.4)for 15 min after repeating the above-mentioned steps.Pictures were visualized and taken with microscope(Olympus, Japan) and camera (Japan). For control staining,PBS was used instead of the primary antibody.
ISH for AT1
In situ hybridization (ISH) kit (Boster, Wuhan, China) wasused to detect AT1 expression in hPSCs, Briefly, slides wereincubated with the probe and a biotinylated secondaryantibody subsequently. The bound antibody was visualizedwith an indirect biotin streptavidin system coupled to alkalinephosphatase and were detected by the DAB reagent. Humanheart tissue was used as a positive control and the senseprobes (included in kit) were used as a negative control.
Apoptosis evaluation of hPSCsImmunocytochemistry (ICC) detection of apoptotic cellswas carried out with the use of TUNEL, in which residuesof digoxigenin-labeled dUTP are catalytically incorporatedinto the DNA by terminal deoxynucleotidyl transferase II.After treatment with Losartan (Merck & Co, New Jersey,USA) in different concentrations (10-9, 10-7, 10-5 and 10-3 mol/L), the slides were fixed and washed thrice in 0.01 mol/LPBS, the following procedures were performed accordingto the manufacturer’s guidance (Boster, Wuhan, China). Thepositive particles of DAB staining were viewed with amicroscope (Olympus Japan). The number of apoptotic cellswas counted and expressed as a percentage of total hPSCspopulation. Next, after a certain concentration of Losartantreatment, harvested cells were washed twice with PBS(0.01 mmol/L, pH 7.4), and the cells were resuspended inbind buffer to a final concentration of 1×10⁶ cells/mL.Annexin-V FITC/PI solution (Roche, Germany) was added,which can stain the damaged DNA in apoptotic cells, andthen the cells were kept in a dark place at room temperaturefor 15 min. Quantitative analysis for apoptosis wasperformed with regular flow cytometry (FCM)[10].
Cell proliferation assessmentThe effect of Losartan on hPSCs proliferation wasdetermined by BrdU incorporation and cell counting. After
being cultured for 3 d on glass slides, hPSCs were incubatedwith Losartan (a series of final concentrations 10-9, 10-8,10-7 mol/L) for 48 h. Each concentration included six wells,cells being cultured for 48 h firstly, and then supplementedwith BrdU (Boster, Wuhan, China) at 1×10⁻⁵ mmol/L. After24 h, slides were stained according to the protocol. Positivesignals were visualized by DAB reagent plus substrateintensifier. Five random areas of the slides were chosenfor counting stained and unstained hPSCs nuclei [positivecells/(negative+positive cells)×100].
Migration studyCell migration was assessed by an in vitro wound-healingassay. For the wound-healing assay, hPSCs were cultureduntil confluence on 35 mm-diameter culture dishes. Cellswere serum-starved for 24 h, and a 2-mm wide linear woundwas cleared. Cells were then incubated with AngII (10-8mol/L,Sigma, USA), AngII (10-8 mol/L) plus Losartan (10-7 mol/L)for 24 h[11]. Cells migrating into the wound were detectedusing a phase-contrast microscope.
Western blottingWestern blotting was performed under standard conditions.Briefly, hPSCs (1×10⁶ ) were cultured in 60 mm culturedishes, and were stimulated with AngII (10-7 mol/L) andAngII plus Losartan (10-6 mol/L) separately for 24 h, 4 mLof the cell media as precipitated with 0.76 g of sodiumsulfite at 4 ℃ for 4 h and then centrifuged at 12 000 g for30 min. Pellets were resuspended in buffer (containing 50mmoL Tris-Cl, 50 mmol DTT, 2% SDS, 0.1% bromophenolblue, 10% glycerol), protein concentrations were determinedby BCA protein assay (Pierce, IL). Protein samples wereheated for 5 min at 100 ℃ and were subjected toelectrophoresis on a 8% acrylamide gel, and transferred toPVDF membrane (Schleicher&Schuell, Germany). Themembrane was blocked in 50 mL/L non-fat dried milk inTBS buffer for 2 h at 20 ℃, then membrane was incubatedovernight at 4 ℃ with rabbit anti-human collagen type Iantibody (diluted 1:200 in TBS buffer; Boster, Wuhan China)and for 60 min with corresponding horseradish-conjugatedsecondary antibodies (Santa Cruz, USA) at room temperature.Membrane was washed thrice in Tris-buffered salinecontaining 1% Tween-20 for 10 min after each of the steps.The protein bands were visualized with ECL chemiluminescencesystem.
Immunofluorescent staining for collagen type IhPSCs grew in chamber slides fixed with 2% paraformaldehyde,permeabilized by 0.1% Triton X-100. For non-specificbinding site blocking, 1:50 normal goat serum was appliedfor 10 min, and then incubated with primary antibody fortype collagen I (Boster, Wuhan, China) at 4 ℃ overnight,biotinylated secondary antibody and streptavidin-conjugatedFITC (Southern Biotechnology Association, Birmingham,USA) were used to intensify the images. Images were takenby fluorescent microscope (Olympus, Japan).
Statistical analysisData values we expressed as mean±SD, these experimentswere performed in triplicate for each of the six samples.

Liu WB et al. Effects of Losartan on human pancreatic stellate cells 6491
Statistical analysis was performed with a two-tailedStudent’s t test, and P<0.05 was considered statisticallysignificant.
RESULTSAT1 expression and AngII concentration in hPSCshPSCs were cultured for 14 d (activated PSCs),immunostaining revealed that positive signals for AT1 werelocated in cell plasm as shown (in Figures 1A and B).ISH assay shows positive nuclei in hPSCs at mRNA level,and representative examples of ISH staining are shown(in Figures 1C and D). AngII was not detected in theculture media or cell homogenate by RIA.
Effects of Losartan on hPSCsTUNEL staining results suggest a marked increase inapoptotic cell death in Losartan treatment groups in adosage-dependent manner compared to PBS treatmentgroup (Figure 2).
The percentage of apoptotic cell induced by Losartan(Figure 3) was achieved using FCM (EpicsXL Coulter, USA).In the two-dimensional histogram the horizontal axis showsAnnexin-V binding and the vertical axis shows PI uptake. Thepercentage of cells are indicated in the apoptotic quadrant(bottom right). Apoptosis began 24 h after certain dosage ofLosartan (10-5 mol/L) treatment, and the percentage ofapoptotic hPSCs rose from 3.7% (24 h) to 13.1% (72 h) duringtreatment.
Figure 1 Immunocytochemistry and ISH detection of AT1 in hPSCs at protein and mRNA levels. Immunostaining positive particles were located in plasm, A (magnification ×100);B (magnification ×400). ISH positive signals were located in nuclei C (magnification ×100); D (magnification ×400).
Figure 2 Dose-dependent induction of apoptosis by Losartan at dif ferentconcentrations. (Con, 1 = 10-9, 2 = 10-7 , 3 = 10-5, 4 = 10-3 mol/L; aP < 0.05 vsdifferent from all groups ).
Figure 3 Time-course of Losartan-induced apoptosis. hPSCs in 0.1% FCSwere exposed to 10-5 mol/L Losartan, and was assessd at 24, 48,72 h. Resultsindicate that Losartan induces apoptosis in a time-dependent manner.
A B
C D
Groups
-1 1 10 100 1000
-1 1 10 100 1000 -1 1 10 100 1000
-1 1 10 100 1000
DN
A
-1 1
1
0 1
00
1000
-1 1
1
0 1
00
1000
-1 1
1
0 1
00
1000
-1 1
1
0 10
0 1
000
4:A
(1
28×
128)
Annexin V
4:A
4:A 4:A
DN
A
DN
A
DN
A
(1
28×
128)
(1
28×
128)
(1
28×
128)
Annexin V
Annexin V Annexin V
1h 24h
48h 72h
Con 1 2 3 4
PSC
apopto
sis
(‰
co
ntr
ol)
a
a180160140120100 80 60 40 20 0

were shown by immunofluorescence assay (Figure 6).
DISCUSSIONChronic pancreatitis is an irreversible progressive diseasecharacterized by the destruction of acinar and ductule cells.Increased accumulation of ECM is a histologic characteristicof chronic pancreatitis that results in pancreatic fibrosis[12,13].
The molecular mechanisms resulting in the fibrosis inpancreas remain unknown. PSCs may participate in matrixremodeling through the regulation of ECM production andmatrix degradation. Like his counterpart HSCs, it is now
Figure 5 AngII accelerates in vitro wound healing confluent, culture-activated PSCs were serum deprived for 48 h. A wound was produced in the monolayer witha pipette tip, and the cells were exposed to (A) AngII (10-8 mol/L), (B) 10% fetal bovine serum, (C) AngII + Losartan, (D) serum-free medium along 24 h later, the cellswere photographed.
Figure 6 Losartan down-regulated collagen I protein expression by westernblot and immunofluoresence. hPSCs were incubated with 10-6 mol/L Losartan.Samples were exposed to certain concentration of Losartan+AngII and AngII for24 h.
The BrdU labeling index in control cells was 3.5±0.8%.Treatment with Losartan did not increase the labeling indices(4.7±1.1%, 3.6±0.7%, 4.3±0.5%, Figure 4).
Migration of hPSCs was assessed with an in vitrowound-healing assay. AngII (10-8 mol/L) and 10% FCSinduced migration of hPSCs into the wound. This effectmight be inhibited by Losartan (10-7 mol/L)[10], as demonstratedby the assay. Images are representative of this experiment(Figure 5).
Figure 4 Effects of Losartan on hPSCs proliferation assessed with BrdUincorporation. Losartan itself did not affect cell proliferation compared to controlgroup. (aP>0.05 different from all the groups).
Western blotting and immunofluorescence assay for collagentype IThe collagen type I level was substantially down-regulated after10-6 mol/L Losartan treatment in hPSCs. In contrast, levelsof collagen were higher in control groups, and the same results
A
α(Ⅰ)Col
A
6492 ISSN 1007-9327 CN 14-1219/ R World J Gastroenterol November 7, 2005 Volume 11 Number 41
AngⅡ+Losartan AngⅡ
C
A B
D
GroupsCon 1 2 3
PS
C
prol
ifera
tion
(‰
co
ntro
l) a
a6543210
aAngⅡ+Losartan AngⅡ

generally accepted that PSCs are major ECM producingcells in the pancreas[14,15]. On activation by different stimuli,such as growth factor, cytokines, ethanol, oxidative stress,PSCs produce a large amount of ECM proteins. Increasingsynthesis of ECM results from the number of PSCs,determined by the balance of cell proliferation and apoptosis,or cells migrating from non-injured areas to injured areas.Apoptosis, proliferation and migration of PSCs must play acrucial role in pancreatic fibrotic process.
Recent evidence indicates that AngII plays a role in liverfibrogenesis[16]. The AngII is locally expressed in injuredlivers, and AngII inhibition attenuates experimental liverfibrosis[17]. AngII is able to induce contraction andproliferation of HSCs[18], and also increase the expressionof collagen I in lung fibroblasts[19]. Recently, it was shownthat ACE inhibitor suppressed progression of hepatic fibrosisin rats[18]. In addition, AngII and AT1 interaction results inhepatic fibrosis, which could be suppressed by AT1
antagonist in vivo and in vitro[16]. Since the pathophysiologicprocess of pancreatic fibrosis is similar to hepatic fibrosis,and the hPSCs are a counterpart of HSCs, we hypothesizethat AngII participates in pancreatic fibrogenesis, thoughthe mechanisms underlying the fibrogenic action of AngIIin the pancreas merit further investigation. We speculatedthat AngII and AT1 also play an important role in thefibrogenesis of pancreas, so the expression of AT1 in PSCswas assessed in our study.
It is reported that increased AngII may affect activationand proliferation of PSCs[20]. Therefore, we propose a linkbetween AngII and PSCs during pancreatic fibrosis. Whilethe effects of AngII on cells are mediated by interactionwith its receptor (mainly AT1), we here present evidencethat hPSCs express AT1 at protein and mRNA level, thisfinding suggests that AngII could exert biological actions inthese cells. Moreover we found that no AngII was detectedby RIA either in culture media or in hPSCs homogenate,indicating that it is paracrine but not autocrine function ofAngII interacting with AT1 in hPSCs, which plays a role inpancreatic fibrosis. In injured areas of pancreas, the levelof AngII alleviate apparently. We observed that AngIIderived from exogenous pathway could promote hPSCsmigration, which is an important way for increasing hPSCsnumber in these areas, and this process can be blockedwith certain concentration of Losartan. We know thatAngII may modulate the re-organization of actin andvinculin through Paxillin and other downstream moleculessuch as small Rho family members after combining to acertain membrane receptor, leading to cell polarity andmigration[21,22]. hPSCs migrating from uninjured areasaccumulate in the injured area, and participate in ECMsecretion and fibrotic formation[23,24]. The inhibitory effectof Losartan might be attributed to AngII receptorintervention. However, the precise modulating mechanismsstill need to be elucidated.
It is well accepted that AngII can induce apoptosisthrough AT1 in some cell types, and this apoptotic processcould be alleviated with Losartan[25]. AT1 and AT2 aretwo subtypes receptor of AngII. The AT1 regulatesvasoconstriction and sodium and water re-absorption, aswell as promote cell growth, proliferation, and collagen matrix
deposition. The AT2 appears to counterbalance the AT1 byincreasing the production of bradykinin, nitric oxide, andcyclic guanosine monophosphate-mediating vasodilation andby promoting cell differentiation, anti-proliferation, andapoptosis. It is meaningful that our results suggest thatLosartan itself can induce hPSCs apoptosis in a dose- andtime-dependent manner clarified by TUNEL and FCMassays, while there are no marked effects on hPSCsproliferation. We made a serial concentration of Losartanfirstly in order to ascertain the adaptable pro-apoptoticdosage, and found that 10-5 mol/L had significant pro-apoptotic effect. Also we chose 0.1% FCS in time-courseapoptotic test in order to decrease the serum’s effect onanti-apoptosis. Based on this result, we used 10-6 mol/L inpro-proliferation study in order to avoid pro-apoptotic effect.Apoptosis is a physiological mechanism of deleting cellsthat regulates cell mass and architecture in many tissues.Inducing PSCs apoptosis or inhibiting PSCs proliferationare always hope-giving methods for complete treatment ofpancreatic fibrosis. The regulatory mechanisms and signalingpathways in this process are poorly defined. However, howcan we explain this paradox? Actually, AngII is also a potentanti-apoptotic factor, capable of reversing the effects ofNO as well as the response to serum withdrawal-inducedapoptosis was noted at concentrations as low as 10 nmol/L[26].The observation that AngII inhibits cGMP analog-inducedapoptosis suggests that the survival signal is downstreamfrom the activation of cGMP protein kinase[26]. Giventhe pleiotropic effects of AngII on a variety of secondmessenger systems, such as calcium, protein kinase C,mitogen-activated protein kinase, and other tyrosine kinases,there are many potential mechanisms by which AngII maystimulate a cell survival signal[27,28]. It has been reportedthat AngII inhibits apoptosis mainly via the stimulation ofthe AT1
[26]. Other anti-apoptotic mechanism might beassociated with down-regulation of iNOS expression andrequires an intact phosphatidylinositol 3-kinase-Akt survivalsignal pathway[29]. Whether the interaction between Losartanand AT1 could activate downstream molecular signalsinducing apoptosis is worthy of further investigation.Losartan treatment also lowers the content of collagen I inculture media and hPSCs compared to control groupdetermined by Western blot and immunofluorescence. Thiscontention coincides with other reports that the specificblockade of AT1 causes a reduction in collagen I.
It is demonstrated that PSCs possessing AT1, have apossible impact on the pathogenesis of acute and chronicpancreatitis. In the injured pancreas, AngII production bythe local RAS may contribute to an impaired microcirculation,resulting in increased intrapancreatic vascular resistance,reduced pancreatic juice efflux, and fibrotic reorganization[30].Kuno et al.[12] recently demonstrated in an in vivo model ofchronic pancreatitis that inhibition of the ACE attenuatespancreatic inflammation and fibrosis, further corroboratingthe view that AngII and AT1 may play an important role inpancreatic pathophysiology. Taken together, our data provideevidence to support that Losartan has direct anti-migration,antifibrotic and pro-apoptotic effects on hPSCs in vitro, theseprocesses might be mediated in part, by interaction withAT1. These findings have important implications for
Liu WB et al. Effects of Losartan on human pancreatic stellate cells 6493

understanding the role of AT1 and its antagonist in pancreaticfibrosis. If this is confirmed, the inhibition of AT1 byLosartan could represent a novel approach to inhibitfibrogenesis in patients with chronic pancreatic disease.
REFERENCES1 Valderrama R, Navarro S, Lopez JM, Caballeria J, Gimenez
A, Pares A, Adrian MJ, Fernandez-Cruz L, Teres J. Synthesisand degradation of collagen in pancreatic fibrogenesis. Pan-
creas 1999; 18: 34-38
2 Wang XP, Zhang R, Wu K, Wu L, Dong Y. Angiotensin IImediates acinar cell apoptosis during the development of rat
pancreatic fibrosis by AT1R. Pancreas 2004; 29: 264-270
3 Masamune A, Satoh M, Kikuta K, Suzuki N, ShimosegawaT. Establishment and characterization of a rat pancreatic stel-
late cell l ine by spontaneous immortalization. World J
Gastroenterol 2003; 9: 2751-27584 Bachem MG, Schneider E, Gross H, Weidenbach H, Schmid
RM, Menke A, Siech M, Beger H, Grunert A, Adler G.
Identification, culture, and characterization of pancreaticstellate cells in rats and humans. Gastroenterology 1998; 115:
421-432
5 Ohnishi N, Miyata T, Ohnishi H, Yasuda H, Tamada K,Ueda N, Mashima H, Sugano K. Activin A is an autocrine
activator of rat pancreatic stellate cells: potential therapeu-
tic role of follistatin for pancreatic fibrosis. Gut 2003; 52 :1487-1493
6 Kajstura J, Cigola E, Malhotra A, Li P, Cheng W, Meggs LG,
Anversa P. Angiotensin II induces apoptosis of adult ven-tricular myocytes in vitro. J Mol Cell Cardiol 1997; 29: 859-870
7 Chan WP, Fung ML, Nobiling R, Leung PS. Activation of
local renin-angiotensin system by chronic hypoxia in ratpancreas. Mol Cell Endocrinol 2000; 160: 107-114
8 Regoli M, Bendayan M, Fonzi L, Sernia C, Bertell i E.
Angiotensinogen localization and secretion in the rat pancreas.
J Endocrinol 2003; 179: 81-899 Ohta T, Amaya K, Yi S, Kitagawa H, Kayahara M, Ninomiya
I, Fushida S, Fujimura T, Nishimura G, Shimizu K, Miwa K.
Angiotensin converting enzyme-independent, local angiotensinII-generation in human pancreatic ductal cancer tissues. Int J
Oncol 2003; 23 : 593-598
1 0 Vermes I, Haanen C, Steffens-Nakken H, Reutelingsperger C. Anovel assay for apoptosis. Flow cytometric detection of
phosphatidylserine expression on early apoptotic cells using fluo-
rescein labelled Annexin V. J Immunol Methods 1995 ; 184: 39-511 1 Bataller R, Schwabe RF, Choi YH, Yang L, Paik YH, Lindquist
J, Qian T, Schoonhoven R, Hagedorn CH, Lemasters JJ, Brenner
DA. NADPH oxidase signal transduces angiotensin II in he-patic stellate cells and is critical in hepatic fibrosis. J Clin
Invest 2003; 112: 1383-1394
1 2 Kuno A, Yamada T, Masuda K, Ogawa K, Sogawa M,Nakamura S, Nakazawa T, Ohara H, Nomura T, Joh T, Shirai
T, Itoh M. Angiotensin-converting enzyme inhibitor attenu-
ates pancreatic inflammation and fibrosis in male WistarBonn/Kobori rats. Gastroenterology 2003; 124: 1010-1019
1 3 Tsang SW, Cheng CH, Leung PS. The role of the pancreatic
renin-angiotensin system in acinar digestive enzyme secretionand in acute pancreatitis. Regul Pept 2004; 119: 213-219
1 4 Haber PS, Keogh GW, Apte MV, Moran CS, Stewart NL,
Crawford DH, Pirola RC, McCaughan GW, Ramm GA, Wilson
JS. Activation of pancreatic stellate cells in human and experi-
mental pancreatic fibrosis. Am J Pathol 1999; 155: 1087-10951 5 Lam KY, Leung PS. Regulation and expression of a renin-
angiotensin system in human pancreas and pancreatic endo-
crine tumours. Eur J Endocrinol 2002; 146: 567-5721 6 Yoshiji H, Kuriyama S, Yoshii J, Ikenaka Y, Noguchi R,
Nakatani T, Tsujinoue H, Fukui H.Angiotensin-II type 1 re-
ceptor interaction is a major regulator for liver fibrosis devel-opment in rats. Hepatology 2001; 34: 745-750
1 7 Jonsson JR, Clouston AD, Ando Y, Kelemen LI, Horn MJ,
Adamson MD, Purdie DM, Powell EE. Angiotensin-convert-ing enzyme inhibition attenuates the progression of rat he-
patic fibrosis.Gastroenterology 2001; 121: 148-155
1 8 Bataller R, Gines P, Nicolas JM, Gorbig MN, Garcia-RamalloE, Gasull X, Bosch J, Arroyo V, Rodes J. Angiotensin II in-
duces contraction and proliferation of human hepatic stellate
cells. Gastroenterology 2000; 118: 1149-11561 9 Marshall RP, McAnulty RJ, Laurent GJ. Angiotensin II is
mitogenic for human lung fibroblasts via activation of the type
1 receptor. Am J Respir Crit Care Med 2000; 161: 1999-20042 0 Nagashio Y, Asaumi H, Watanabe S, Nomiyama Y, Taguchi
M, Tashiro M, Sugaya T, Otsuki M. Angiotensin II type 1
receptor interaction is an important regulator for the develop-ment of pancreatic fibrosis in mice. Am J Physiol Gastrointest
Liver Physiol 2004; 287: G170-G177
2 1 Ishida T, Ishida M, Suero J, Takahashi M, Berk BC. Agonist-stimulated cytoskeletal reorganization and signal transduc-
tion at focal adhesions in vascular smooth muscle cells re-
quire c-Src. J Clin Invest 1999; 103: 789-7972 2 Amaya K, Ohta T, Kitagawa H, Kayahara M, Takamura H,
Fujimura T, Nishimura G, Shimizu K, Miwa K. Angiotensin
II activates MAP kinase and NF-kappaB through angiotensinII type I receptor in human pancreatic cancer cells. Int J Oncol
2004; 25 : 849-856
2 3 Klonowski-Stumpe H, Reinehr R, Fischer R, Warskulat U,Luthen R, Haussinger D. Production and effects of endothelin-
1 in rat pancreatic stellate cells. Pancreas 2003; 27: 67-74
2 4 Phillips PA, Wu MJ, Kumar RK, Doherty E, McCarroll JA,Park S, Pirola RC, Wilson JS, Apte MV. Cell migration: a
novel aspect of pancreatic stellate cell biology. Gut 2003; 52:
677-6822 5 Gonzalez A, Lopez B, Ravassa S, Querejeta R, Larman M,
Diez J, Fortuno MA. Stimulation of cardiac apoptosis in es-
sential hypertension: potential role of angiotensin II. Hyper-tension 2002; 39: 75-80
2 6 Pollman MJ, Yamada T, Horiuchi M, Gibbons GH. Vasoac-
tive substances regulate vascular smooth muscle cellapoptosis. Countervailing influences of nitric oxide and an-
giotensin II. Circ Res 1996; 79: 748-756
2 7 Griendling KK, Alexander RW. The angiotensin (AT1)receptor. Semin Nephrol 1993; 13: 558-566
2 8 Ip SP, Tsang SW, Wong TP, Che CT, Leung PS. Saralasin, a
nonspecific angiotensin II receptor antagonist, attenuatesoxidative stress and tissue injury in cerulein-induced acute
pancreatitis. Pancreas 2003; 26: 224-229
2 9 Tian B, Liu J, Bitterman P, Bache RJ. Angiotensin II modu-lates nitric oxide-induced cardiac fibroblast apoptosis by ac-
tivation of AKT/PKB. Am J Physiol Heart Circ Physiol 2003;
285: H1105-H11123 0 Reinehr R, Zoller S, Klonowski-Stumpe H, Kordes C,
Haussinger D. Effects of angiotensin II on rat pancreatic stel-
late cells. Pancreas 2004; 28: 129-137
Science Editor Guo SY Language Editor Elsevier HK
6494 ISSN 1007-9327 CN 14-1219/ R World J Gastroenterol November 7, 2005 Volume 11 Number 41

PO Box 2345, Beijing 100023, China World J Gastroenterol 2005;11(41):6495-6502www.wjgnet.com World Journal of Gastroenterology ISSN [email protected] © 2005 The WJG Press and Elsevier Inc. All rights reserved.E L S E V I E R
• BASIC RESEARCH •
to non-noxious and noxious CRD in a dose-dependent manner.
CONCLUSION: Our resul ts suggest that sp inal N -methyl-D-aspartate (NMDA) and non-NMDA receptors may contribute to the processing of central sensitivity in a neonatal CI rat model, but they may play different roles in it.
© 2005 The WJG Press and Elsevier Inc. All rights reserved.
Key words: Chronic visceral hypersensitivity; Dorsal horn neurons; Irritable bowel syndrome; NMDA receptors; Non-NMDA receptors
Lin C, Al-Chaer ED. Differential effects of glutamate receptor antagonists on dorsal horn neurons responding to colorectal distension in a neonatal colon irritation rat model. World J Gastroenterol 2005; 11(41): 6495-6502http://www.wjgnet.com/1007-9327/11/6495.asp
INTRODUCTIONChronic pain is frequently associated with increased neuronal excitability in the spinal cord, a phenomenon often referred to as central sensitization. Central sen-sitization can be induced by a number of sensitizing stimuli, including repeated mechanical stimulation and peripheral tissue injury, triggering burst of activities in nociceptors that alter the strength of synaptic connections between the nociceptors and the neurons of the spinal cord. In functional pain disorders, the peripheral stimulus is mostly lacking, and the prevalent hypothesis is that hypersensitivity is caused by functional changes (plasticity) in the nervous system, including central sensitization[1]. A key step in the development of central sensitization is activation and modulation of the N-methyl-D-aspartate (NMDA) receptor in those dorsal horn neurons of the spinal cord that receive primary afferent input[2,3]. NMDA receptors have a voltage-dependent magnesium ion (Mg2+) channel block at resting membrane potential[4] and, therefore, do not seem to contribute to transient pain transmission[5-7] . Transient pain transmission occurs through the release of glutamate from the nociceptor afferent neurons acting via the AMPA/kainate receptors at the dorsal horn, which do not have a Mg2+ block, resulting
Differential effects of glutamate receptor antagonists on dorsal horn neurons responding to colorectal distension in a neonatal colon irritation rat model
Chun Lin, Elie D Al-Chaer
Chun Lin, Elie D Al-Chaer, Laboratory of Elie D Al-Chaer (ACELAB), Center for Pain Research (CPR), University of Texas Medical Branch, Galveston, TX 77555-0632, United States Chun Lin, Center for Neubiological Research, Department of Physiology and Pathophysiology, Fujian Medical University, Fuzhou 350004, Fujian Province, China Supported by NIH grant 40434Correspondence to: Elie D Al-Chaer, MS, Ph D, JD, Associate Professor of Pediatrics, Neurobiology and Developmental Sciences, College of Medicine, University of Arkansas for Medical Sciences, 4301 West Markham, Slot 842, Little Rock, AR 72205-842, United States. [email protected] Telephone: +1-501- 526-7828 Fax: +1-501- 526-7862Received: 2005-05-10 Accepted: 2005-06-18
AbstractAIM: To investigate and compare the effects of spinal D-(-)-2-amino-7-phosphonoheptanoic acid (AP-7) and 6-cyano-7-nitroquinoxaline-2,3-dione disodium (CNQX), two glutamate receptor antagonists, on the responses of dorsal horn neurons to colorectal distension (CRD) in adult rats exposed to neonatal colon irritation (CI).
METHODS: Hypersensitive SD rats were generated by CI during postnatal days 8, 10 and 12. Experiments on adult rats were performed using extracellular single-unit recording. The effects of spinal application of AP-7 (0.001, 0.01, 0.1, 1 mmoL) were tested on the CRD-evoked neuronal responses in 16 controls and 17 CI rats. The effects of CNQX (0.2, 2, 5, 10 μmoL) were also tested on the CRD-evoked responses of 17 controls and 18 CI neurons.
RESULTS: (1) The average responses of lumbosacral neurons to al l intensit ies of CRD in CI rats were significantly higher than those in control rats; (2) In control rats, AP-7(0.01 mmoL)had no significant effect on the neuronal response to all intensities of CRD (20, 40, 60, 80 mmHg); while AP-7 (0.1 mmoL) inhibited the neuronal response to 80-mmHg CRD. By contrast, in CI rats, AP-7 (0.01-1 mmoL) attenuated the CRD-evoked neuronal responses to all distention pressures in a dose-dependent manner; (3) In control rats, CNQX (2 μmoL) had no significantly effect on the neuronal response to all intensities of CRD; however, CNQX (5 μmoL) significantly attenuated the responses to CRD in the 40-80 mmHg range. By contrast, CNQX (2-10 μmoL) significantly decreased the neuronal responses in CI rats

6496 ISSN 1007-9327 CN 14-1219/ R World J Gastroenterol November 7, 2005 Volume 11 Number 41
in membrane depolarization. However, stimulation of nociceptive afferents following injury/inflammation causes an increased and sustained release of glutamate from the central terminals of nociceptor afferents in the dorsal horn; this results in depolarization beyond a critical threshold, with the removal of the Mg2+ block, activation of NMDA receptors and a consequent amplification of pain[8,9]. This phenomenon of NMDA receptor-mediated central sensitization is a well-established mechanism in both animal and human models of somatic pain hypersensitivity and is attenuated by NMDA receptor antagonists[10,11].
Persistent or inf lammatory visceral stimuli also produce central sensitization via NMDA receptors. Spinal administration of NMDA aggravates behavioral and neural responses to both noxious and innocuous intensities of CRD; these responses can be blocked by NMDA receptor antagonists[12,13]. Visceral hyperalgesia produced by colonic inflammation is mediated by NMDA and non-NMDA spinal receptors[14,15]. However, to our knowledge, little is known about the role of NMDA or non-NMDA glutamate receptors in the central sensitization of chronic visceral pain.
Previous work done by our group has shown that colon irritation (CI) in neonates can engender chronic visceral hypersensitivity in adult rats with associated peripheral and central neuronal sensitization in the absence of identifiable peripheral pathology[1,16]. The present study investigated and compared the effects of spinal D-(-)-2-amino-7-phosphonoheptanoic acid (AP-7, TOCRIS), an NMDA receptor antagonist, and 6-cyano-7-nitroquinoxaline-2, 3-dione disodium (CNQX, TOCRIS), a non-NMDA receptor antagonist, on the responses of dorsal horn neurons responding to colorectal distension (CRD) in rats with neonatal CI and in controls. Part of these data have been reported in abstract[17].
MATERIALS AND METhODSExperiments were performed on 68 adult male Sprague-Dawley rats (weight, 250-350 g) obtained as pre-weanling neonates (younger than 5 d) from Harlan Sprague-Dawley (Indianapolis, IN). Thirty five rats received colon irritation (CI) as neonates and 33 rats served as controls (see below). Rats were housed in plastic cages containing corn chip bedding (Sani-Chips; PJ Murphy Forest Products, Montville, NJ) and maintained on a 12:12 h light-dark cycle (lights on at 7 am). The irritation procedures and the experimental testing were conducted during the light component of the cycle. The neonates were housed 10 per cage with 1 mo until they were 28-d-old. The adult females were accessed to food and water ad libitum. After separation, the male young rats were housed 4 per cage with access to food and water ad libitum. The rats were observed daily, and their weights were measured at least once a week. Adequate measures were taken to minimize pain and discomfort. All studies were performed in accordance with the proposal of the Committee
for Research and Ethical Issues of the International Association for the Study of Pain[18] and were approved by the Institutional Animal Care and Use Committee at the University of Texas Medical Branch in accordance with the guidelines provided by the USA National Institute of Health Guide for the Care and Use of Laboratory Animals (NIH Publications No. 80-23) revised in 1996.
Neonatal colon irritation Neonatal colon irritation (CI) was applied using colorectal distension (CRD) during postnatal development. The CRD procedure was modified from a previous report by Al-Chaer et al[1]. Briefly, the rats (8-d-old) were divided into two groups for the purposes of two different treatments: Group 1 (CI rats) received CRD once on postnatal (PN) days 8, 10, and 12. The distention was applied using an angioplasty balloon (Advanced Polymers Inc., length: 20.0 mm; diameter: 3 mm), inserted rectally into the descending colon in awake neonates. The balloon was distended with 0.3 mL of water, exerting a pressure of 60 mmHg (as measured with a sphygmomanometer) for 1 min and then deflated and withdrawn. Group 2 (which served as controls) was handled in a way similar to group 1 except that no colonic insertion was made. Rats in this group were separated from the dams, gently held and touched on the perianal area on a schedule similar to that described for group 1. Above experiments were done by the same investigator. No treatment, procedures or further interventions were done by the investigator until the testing date.
Electrophysiological preparationsAnimal preparation and surgical procedures Ex-periments were carried out on anesthetized and para-lyzed adult rats (> 2 mo). Anesthesia for adult rats in both groups was induced by 5% halothane. The depth of anesthesia during surgery was maintained by ~2.5 % halothane, which was adjusted by monitoring withdrawal responses to pinch. During electrophysiological recording, anesthesia was maintained by ~1.0 % halothane. Once a stable level of anesthesia was reached, the rats were paralyzed with pancuronium bromide (0.3 mg/kg iv) and artificially ventilated. The adequacy of the depth of anesthesia during recordings was monitored by frequent examination of the pupillary reflexes and assessing stability of the level of end-tidal CO2, which was kept between 3.5% and 4.5% by adjusting the respiratory parameters. Body temperature was monitored and maintained at 37 oC by a servo-controlled heating blanket. The L6-S1 segments of the spinal cord were exposed by laminectomy. The rat was placed in a head holder and suspended with thoracic vertebral and ishial clamps. The dura matter was carefully removed and the spinal cord was bathed in artificial cerebral spinal fluid (ACSF)[19].Colon stimulation Colon stimulation in adult rats consisted of graded colorectal distension (CRD) produced by inflating a balloon inside the descending colon and rectum. The balloon was 4 cm in length and made of the

Lin C et al. Functional visceral pain and spinal NMDA and non-NMDA receptors 6497
finger of a latex glove. It was attached to polyethylene tubing and inserted through the anus into the rectum and descending colon. The open end of the balloon was secured to the tubing with thread and wrapped with tape (1 cm wide). The balloon was inserted so that the thread was approximately 1 cm proximal to the anal sphincter, and was held in place by taping the tubing to the tail. The tubing was attached via a T-connector to a sphygmomanometer pump and a pressure gauge. Prior to use, the balloon was inflated and left overnight so that the latex stretched and the balloon became compliant. CRD was produced by rapidly inflating the balloon to the desired pressure (20, 40, 60 or 80 mmHg) for a duration of 10 s. Stimuli applied in an ascending graded manner (spaced by 4 min). To decrease the “human factor” bias to the minimum possible, the same stimulation paradigm was used in every rat. Colon stimulation was applied accurately according to the pressure gauge without observation of the oscilloscope or computerized record so that the experimenter was unaware of the response magnitude.Electrophysiological recording Tungsten micro-electrodes (2-6 MΩ Micro Probe Inc.) were used for extracellular single-unit recording in the L6-S2 spinal segments, 0-1.5 mm lateral to midline, 0.2-1.1 mm from the spinal cord dorsum. The search stimulus consisted of brushing the ipsilateral perianal/scrotal area with a small paint brush[20] and CRD (60 mmHg)[21]. When a neuron responsive to the cutaneous stimuli was identified, the colon was distended for several seconds to test whether the neuron was responsive to CRD. The electrophysiological recordings were conducted by an investigator blinded to the type of rats. Action potentials were fed into a window discriminator and monitored continuously by analog delay and displayed on a storage oscilloscope after initial amplification through a low-noise AC differential amplifier (DAM 80i). The output of the amplifier and window discriminator were fed into a data collection system (CED 1401 +) and Spike2 for Windows software (Cambridge Electronic design, UK) to compile rate histograms or wavemark files. Single units were differentiated on- and off-line. Only cells that had an excitatory response to CRD were chosen for the study. Care was taken to insure that noise was not captured by the window discriminator.
Experimental protocols Each CRD-responsive neuron was tested with the same method (20, 40, 60, and 80 mmHg) before drug administration to establish a baseline response of the neuron. Drugs were dissolved in ACSF and 20 μL was applied spinally to the surface of the spinal cord[19]. The effects of spinal application of AP-7 (0.001, 0.01, 0.1, 1 mmoL) were tested on the CRD-evoked responses of 16 controls and 17 CI neurons. The effects of spinally administered CNQX (0.2, 2, 5, 10 μmoL) were tested on the CRD-evoked responses of 17 controls and 18 CI neurons. The drug was removed by tissue wick prior to application of the next dose. Only one neuron was studied in each animal. The reported doses were the applied dose, not a cumulative dose. A drug effect was
described as a change by more than 20% in the response to CRD after the drug was applied, compared to baseline response recorded before drug application. Responses of LS neurons to CRD were recorded 15 min after each drug administration.
The responses to CRD were recorded and calculated as the difference between the rate of firing during the stimulus application and that during the baseline recording. The responses of CI rats were compared to those of controls for statistical significance. Drug effect was tested by recording responses of neurons to CRD before and after the drug application in controls and CI rats. For control purposes, the spinal cord was bathed in ACSF before the drug application. The effects of drugs on the baseline and the responses to CRD were analyzed within each group and were compared between the controls and CI groups for any statistical significance. At the end of the experiments, the rats were euthanized with an overdose of halothane.
Statistical analysisThe spontaneous activity of a neuron was measured for 20 s before CRD, and the response of a neuron to CRD was determined as the average increase in discharge during distention above the average spontaneous activity. The responses recorded in CI rats were compared to those recorded in control rats for statistical significance. Unless otherwise indicated, data were expressed as mean ± SE. The CRD data was analyzed using repeated measures analysis of variance (RM ANOVA). A model with the repeated factors of intensity, group, and the (intensity x group) interaction was used to examine significant intensity effects, group effects and (intensity x group) interactions. Significant group and interaction effects meant that responses in the corresponding groups increased in a significantly different manner (i.e., responses of CI group were significantly different from responses of control group). For non-parametric data, the Mann Whitney rank sum test was used. P<0.05 was considered statistically significant in all cases.
RESULTSResponses to CRDThe neuronal responses to CRD recorded in the controls or CI rats were stimulus-locked. In both controls and CI rats, responses of lumbosacral (LS) neurons to CRD were graded with stimulus intensity. A model with the repeated factors of intensity, group, and the (intensity x group) interaction showed that there was a significant intensity effect (P<0.05), group effect (P<0.05) and (intensity x group) interaction (P<0.05). The interpretation of these results is that there was a significant increase in the magnitude of neuronal responses with increasing levels of CRD in both groups (Figure 1). Also, the average responses of LS neurons to all intensities of CRD in CI rats were significantly higher than those in control rats (Figure 1).

6498 ISSN 1007-9327 CN 14-1219/ R World J Gastroenterol November 7, 2005 Volume 11 Number 41
Effect of spinal AP-7 on LS neuronal response to CRDPercentage of LS neurons inhibited by spinal AP-7 Generally, the effect of AP-7 occurred during 5-30 min after the drug administration.
In control rats, 4 of the 16 neurons (25%) were inhibited by AP-7 (0.001 mmoL); these responded to all graded CRD. Eight of the 16 neurons (50%) responded to CRD (20-60 mmHg); these were inhibited by AP-7 (1 mmoL). Thirteen of the 16 neurons (81.2%) that responded to CRD (80 mmHg) were inhibited by AP-7 (1 mmoL). The effect of AP-7 appeared to be incremental. The effect of AP-7 appeared to be incrementalThe effect of AP-7 appeared to be incremental with dose and stimulus intensity with maximum effect seen on the response to 80 mmHg CRD in control rats (Table 1).
In CI rats, 6 of the 15 neurons (40%) that responded to all intensities of CRD were inhibited by AP-7AP-7 (0.001 mmoL). All nine neurons (100%) that responded to. All nine neurons (100%) that responded toneurons (100%) that responded to all intensities of CRD were inhibited by AP-7 (1 mmoL)AP-7 (1 mmoL)1 mmoL)) (Table 1)..
The effect of AP-7 on neuronal response to all intensities of CRD was more pronounced in CI rats compared to control rats. AP-7 dose-dependently attenuated the CRD-evoked responses at all distention pressures in all nine (100%) CI neurons. Effect of spinal AP-7 on the average responses of LS neurons to CRD No significant changes were seen in the responses of 11 control neurons to intensities of CRD fol lowing spinal administrat ion of AP-7 (0.01 mmoL) (Figure 2A). On the other hand, AP-7 (0.1 mmoL) significantly attenuated the average response to high intensity of CRD (80 mmHg) (n = 12) and AP-7 (1 mmoL) significantly attenuated the average responses to CRD (40-80 mmHg) in controls (n = 16) (Figure 3A).
AP-7 (0.01 mmoL) significantly attenuated the average responses to intensities of CRD in CI rats in a dose-dependant manner (Figures 2B and 3B).
Effect of spinal CNQX on LS neuronal response to CRD (20-80 mmHg)Percentage of LS neurons inhibited by CNQX In general, the effect of CNQX occurred during about 10 min after the drug administration.
In control rats, spinal CNQX (0.2 µmoL) inhibited the responses of 4 of the 17 neurons (23.5%) that responded to intensities of CRD. At a higher dose, CNQX (10 µmoL) inhibited the responses of 6 of 8 neurons (75%) that responded to CRD (40-80 mmHg), (Table 2).
In CI rats, spinal CNQX (0.2 µmoL) inhibited the responses of 5 of the 11 neurons (45.4%) that responded to intensities of CRD. At a higher dose, CNQX (10 µmoL) inhibited the responses of all 8 neurons (100%) that responded to intensities of CRD (Table2). Thus, CNQX dose-dependently attenuated the CRD-evoked responses at all distention pressures in CI neurons. The effect of CNQX on neuronal response to all intensities of CRD was more pronounced in the CI rats compared to the control rats.
Control (n = 17)CI (n = 18)
a
c
a
a,c
a,e
Baseline 20 40 60 80CRD (mmHg)
30
20
10
0
Rate
(Sp
ikes
/s)
Figure 1 Average responses of LS neurons to CRD (20, 40, 60, 80 mmHg). Bar graph summarizes the average background activity (baseline; control, n = 17; CI, n = 18) and the responses of LS neurons to all intensities of CRD in control and CI rats. The responses to CRD are reported as the mean increase in firing rate above baseline. Responses recorded in CI rats were significantly higher than those recorded in control rats. aP<0.05 vs the values of normal rats with the same intensity; cP<0.05 vs 20 mmHg CRD in each group; eP<0.05 vs 40mmHg CRD in CI rats.
Dose 20 (%) 40 (%) 60 (%) 80 (mmHg%)Controls0.001 mmoL 25 (4/16) 25 (4/16) 25 (4/16) 25 (4/16)0.01 mmoL 36.3 (4/11) 36.3 (4/11) 36.3 (4/11) 45.4 (5/11)0.1 mmoL 41.6 (5/12) 50 (6/12) 58.3 (7/12) 75 (9/12)1 mmoL 50 (8/16) 50 (8/16) 50 (8/16) 81.2 (13/16)CI rats0.001 mmoL 40 (6/15) 40 (6/15) 40(6/15) 40 (6/15)0.01 mmoL 60 (6/10) 60 (6/10) 60 (6/10) 60 (6/10)0.1 mmoL 81.8 (9/11) 81.8 (9/11) 81.8 (9/11) 81.8 (9/11)1 mmoL 100 (9/9) 100 (9/9) 100 (9/9) 100 (9/9)
Table 1 Percentage attenuation of responses to graded CRD of LS neurons by AP-7 in control and CI rats
Denominators in parentheses indicate the total number of LS neurons treated with AP-7 and numerators indicate the number of neurons affected by AP-7 at the same dose level in control and CI rats. A drug effect is described as a change by more than 20% in the response to CRD after the drug was applied, compared to baseline response recorded before the use of drug.
Dose 20 (%) 40 (%) 60 (%) 80 (mmHg%)Controls0.2 μmoL 23.5 (4/17) 23.5 (4/17) 23.5 (4/17) 23.5 (4/17)2 μmoL 44.4 (4/9) 44.4 (4/9) 44.4 (4/9) 44.4 (4/9)5 μmoL 50 (4/8) 62.5 (5/8) 62.5 (5/8) 62.5 (5/8)10 μmoL 71.4 (5/7 ) 75 (6/8) 75 (6/8) 75 (6/8)CI rats0.2 μmoL 45.4 (5/11) 45.4(5/11) 45.4 (5/11) 45.4 (5/11) 2 μmoL 77.8 (7/9) 77.8 (7/9) 77.8 (7/9) 77.8 (7/9) 5 μmoL 83.3 (5/6) 83.3 (5/6) 83.3 (5/6) 83.3 (5/6)10 μmoL 100 (8/8 ) 100 (8/8 ) 100 (8/8 ) 100 (8/8 )
Table 2 Percentage attenuation of responses to graded CRD of LS neurons by CNQX in control and CI rats
Denominators in parentheses indicate the total number of LS neurons treated with CNQX and numerators indicate the number of neurons affected by CNQX at the same dose level in control and CI rats. The effect of CNQX on neuronal response to all intensities of CRD was more pronounced in CI rats than that in control rats. CNQX dose-dependently attenuated the CRD-evoked responses at all distention pressures in all 8 (100%) CI neurons.

Lin C et al. Functional visceral pain and spinal NMDA and non-NMDA receptors 6499
Effect of spinal CNQX on the average responses of LS neurons to CRD CNQX (2 µmoL) had no significant effect on the responses of 9 control neurons to all intensities of CRD (Figure 4A). However, CNQX (5 µmoL) significantly attenuated the responses to CRD in the 40-80 mmHg range and CNQX (10 µmoL) significantly attenuated the response to all intensities of CRD in control rats (n = 8) (Figure 5A).
By contrast, CNQX (2 µmoL) significantly attenuated
the average response of 9 CI neurons to all intensities of CRD (Figure 4B). In general CNQX (2-10 µmoL) decreased the neuronal responses in CI rats to non-noxious and noxious CRD in a dose-dependant manner (Figure 5B).
DISCUSSIONInjury and pain in neonates can have severe developmental
20 40 60 80Control Rats
CI Rats
Num
ber
of S
pike
sN
umbe
r of
Spi
kes
180
50
10 s
Figure 2 Effect of AP7 (0.01 mmoL) on dorsal horn neuronal responses to CRD in control or CI rats. Rate histograms illustrate the responses of a dorsal horn neuron isolated from a control rat (A) and of another neuron isolated from a CI rat (B) before (grey) and after (black) spinal administration of AP-7 (0.01 mmoL). Horizontal bars indicate the timing and duration (10 s) of CRD (20- 80 mmHg).
20
10
0
Rate
(Sp
ikes
/s)
Figure 3 Effect of spinal AP7 on average responses of LS neurons to CRD. Bar graphs illustrate the responses of LS neurons to CRD (20-80 mmHg) recorded in control rats (A; left panel) or CI rats (B; right panel) before and after spinal administration of AP7. A: AP-7 (0.1 mmoL) significantly attenuated the average response to high intensity CRD (80 mmHg) and AP-7 (1 mmoL) significantly attenuated the responses to CRD (40-80 mmHg) in controls; B: AP-7 (0.01 mmoL) significantly attenuated the average responses to graded CRD in CI rats in a dose-dependant manner. aP<0.05, bP<0.01, dP<0.001 vs before AP-7 application at that distention pressure in each group.
A Before AP-7
b
a
AP-7 (0.01 mmoL)AP-7 (0.1 mmoL)AP-7 (1 mmoL)
Control Rats
a
a
20 40 60 80CRD (mmHg)
20 40 60 80CRD (mmHg)
30
20
10
0
Rate
(Sp
ikes
/s)
AP-7 (0.01 mmoL)AP-7 (0.1 mmoL)AP-7 (1 mmoL)
Before AP-7 AP-7 (0.001 mmoL)
CI Rats
d
a
a a
d
a
a
d
a
a a d
B
A
B

6500 ISSN 1007-9327 CN 14-1219/ R World J Gastroenterol November 7, 2005 Volume 11 Number 41
repercussions that may often alter the physiological and functional profile of the adult. In previous studies, our group has shown that colon pain in neonatal rats can cause long-term visceral hypersensitivity associated with central neuronal and peripheral sensitization, despite the lack of inflammation signs in the colon[1,16]. This chronic colorectal hyperalgesia can be blocked by a peripheral NMDA receptor antagonist (AP7)[22]. In this study, we showed that spinal application of AP-7 or CNQX attenuated the neuronal response to graded CRD in both control and CI
rats with a more pronounced effect in CI rats. Thus, both spinal NMDA and non-NMDA receptors contribute to the central sensitization seen in adult rats with chronic visceral hypersensitivity.
Neonatal injury and central sensitizationSignificant development of nociceptive neural circuits occurs during early postnatal life[9]. Painful or stressful stimuli, which are normally absent or limited during this critical developmental period, represent a unique sensory
20 40 60 80Control Rats
CI Rats
Num
ber
of S
pike
sN
umbe
r of
Spi
kes
180
50
Figure 4 Effect of CNQX (2 µmoL) on dorsal horn neuronal responses to CRD in control or CI rats. Rate histograms illustrate the responses of a dorsal horn neuron isolated from a control rat (A) and of another neuron isolated from a CI rat (B) before (grey) and after (black) spinal administration of CNQX (2 µmoL).
10 s
10 s
A
B
Figure 5 Effect of spinal CNQX on average responses of LS neurons to CRD. Bar graphs illustrate the responses of LS neurons to graded CRD (20-80 mmHg) recorded in control rats (A; left panel) or CI rats (B; right panel) before and after spinal administration of CNQX. A: In control rats, CNQX (5 µmoL) significantly attenuated the responses to CRD in the 40-80 mmHg range and CNQX (10 µmoL) significantly attenuated the response to all intensities of CRD; B: In CI rats, CNQX (2-10 µmoL) significantly decreased the response to all intensities of CRD in a dose-dependent manner. aP<0.05, bP<0.01, dP<0.001 vs before CNQX application at that distention pressure in each group; cP <0.05 vs 2 µmoL CNQX.
d
Before CNQX CNQX (2 µmoL)CNQX (5 µmoL)CNQX (10 µmoL)
Control Rats
CNQX (2 µmoL)CNQX (5 µmoL)CNQX (10 µmoL)
Before CNQX CNQX (0.2 µmoL)
CI Rats
b
a
20 40 60 80CRD (mmHg)
20
10
0
Rate
(Sp
ikes
/s)
30
20
10
0
Rate
(Sp
ikes
/s)
d
20 40 60 80CRD (mmHg)
c c
b
c a a c
bb
d
dd
c
b b
A B
c

Lin C et al. Functional visceral pain and spinal NMDA and non-NMDA receptors 6501
experience that may result in permanent alterations in the afferent pathways of the newborn organism[23-28]. In human neonates, sensitization can be produced by repeated mechanical stimulation or heel lances and as a consequence of circumcision or surgery[29,30]. The neonatal nervous system appears particularly vulnerable and susceptible to plastic changes.
Our group has previously shown that neonatal colon pain or inflammation in rats can have a devastating effect on the physiology and function of the adult. Colon hypersensitivity, characterized by allodynia and hyperalgesia, could be observed two months after the initial injury despite the lack of an obvious pathology in the colon tissue. This hypersensitivity was shown to be associated with central neural and peripheral sensitization characterized by increased neuronal responses to CRD and a reduction in the thresholds of visceral nociceptors[1,16]. This was consistent with the work of others who have demonstrated the presence of central plastic changes in both somatic and visceral nociceptive systems[31-33], and also consistent with our earlier work on central processing of visceral nociception[34-36].
Generally, pelvic visceral input converges onto spinal neurons in the lumbosacral (LS) segments[37, 38] and hypogastric input onto thoracolumbar (TL) segments of the spinal cord. Many experiments have demonstrated that nociceptive afferent discharges in visceral afferents evoke profound central changes[31,32,39].
NMDA receptors and CRDIn somatic tissue, NMDA receptors contribute to the generation of central sensitization following tissue injury and inflammation[2,3]. Transient distension of the ureter evokes a pressor response that is inhibited by NMDA receptor antagonists[40]. Rice and McMahon[41] investigated the role of spinal NMDA receptors in central sensitization in an animal model of persistent visceral pain[12]. Likewise, NMDA receptor antagonists attenuated primary afferent[22,42] and spinal neuron responses to acute noxious and innocuous colorectal stimuli[13,43,44]. Our results indicated that, in control animals (without colon hypersensitivity), the lower doses of AP-7 had no effect on the neuronal response to noxious and innocuous CRD; while the higher dose of AP-7 lowered the neuronal response to noxious CRD. However, in chronic colon hypersensitivity rats in the absence of inflammation, lower doses of AP-7 significantly decreased the response to graded CRD as compared to the controls. These data support the proposition that spinal NMDA receptors contribute to chronic visceral hypersensitivity.
Non-NMDA receptors and CRDIntrathecal administration of non-NMDA receptor antagonist, DNQX, was reported to attenuate enhanced reflex responses to mechanical stimulation of an inflamed colon, but was ineffective in non-inflamed rats[14]. On the other hand, systemically-administered DNQX attenuated spinal dorsal horn neuronal responses to noxious CRD in normal rats[45]. Our experiments showed that the response
to noxious and innocuous CRD was dose-dependently attenuated by CNQX in 75% (6/8) and 71.4% (5/7) control neurons. But, the effect of CNQX on neuronal response to all intensities of CRD was more pronounced in CI rats than that in control rats. These results further support a role for spinal non-NMDA receptors in visceral sensory processing[19,35,46] .
In summary, a possible shift in the role of spinal NMDA and non-NMDA receptors residual to the neonatal injury may underlie the differential effects of AP-7 and CNQX between rats with neonatal CI and controls. These results further support the assertion that both spinal NMDA and non-NMDA receptors contribute to the central sensitization seen in adult rats with chronic visceral hypersensitivity and the conjecture that IBS pain may be associated with NMDA and non-NMDA receptors.
ACKNOWLEDGMENTSThe authors thank Ms. Kirsten Garner for administrative assistance with the manuscript and publication fee supported by FJGXY grant 04009.
REFERENCES1 Al-Chaer ED, Kawasaki M, Pasricha PJ. A new model of
chronic visceral hypersensitivity in adult rats induced by colon irritation during postnatal development. Gastroenterology 2000; 119: 1276-1285
2 Haley JE, Sullivan AF, Dickenson AH. Evidence for spinal N-methyl-D-aspartate receptor involvement in prolonged chemical nociception in the rat. Brain Res 1990; 518: 218-226
3 Woolf CJ, Thompson SW. The induction and maintenance of central sensitization is dependent on N-methyl-D-aspartic acid receptor activation; implications for the treatment of post-injury pain hypersensitivity states. Pain 1991; 44: 293-299
4 Mayer ML, Westbrook GL, Guthrie PB. Voltage-dependent block by Mg2+ of NMDA responses in spinal cord neurons. Nature 1984; 309: 261-263
5 Dickenson AH, Sullivan AF. Evidence for a role of the NMDA receptor in the frequency dependent potentiation of deep rat dorsal horn nociceptive neurones following C fibre stimulation. Neuropharmacology 1987; 26: 1235-1238
6 Dickenson AH. A cure for wind up: NMDA receptor antagonists as potential analgesics. Trends Pharmacol Sci 1990; 11: 307-309
7 Dubner R, Ruda MA. Activity-dependent neuronal plasticity following tissue injury and inflammation. Trends Neurosci 1992; 15: 96-103
8 Woolf CJ, Costigan M. Transcriptional and posttranslational plasticity and the generation of inflammatory pain. Proc Natl Acad Sci U S A 1999; 96: 7723-7730
9 Woolf CJ, Salter MW. Neuronal plasticity: increasing the gain in pain. Science 2000; 288: 1765-1769
10 Graven-Nielsen T, Aspegren Kendall S, Henriksson KG, Bengtsson M, Sörensen J, Johnson A, Gerdle B, Arendt-Nielsen L. Ketamine reduces muscle pain, temporal summation and referred pain in fibromyalgia patients. Pain 2000; 85: 483-491
11 Park KM, Max MB, Robinovitz E, Gracely RH, Bennett GJ. Effects of intravenous ketamine, alfentanil, or placebo on pain, pinprick hyperalgesia, and allodynia produced by intradermal capsaicin in human subjects. Pain 1995; 63: 163-172
12 Kolhekar R, Gebhart GF.Modulation of spinal visceral nociceptive transmission by NMDA receptor activation in the rat. J Neurophysiol 1996; 75: 2344-2353
13 Zhai QZ, Traub RJ. The NMDA receptor antagonist MK-801

6502 ISSN 1007-9327 CN 14-1219/ R World J Gastroenterol November 7, 2005 Volume 11 Number 41
attenuates c-Fos expression in the lumbosacral spinal cord following repetitive noxious and non-noxious colorectal distention. Pain 1999; 83: 321-329
14 Coutinho SV, Meller ST, Gebhart GF. Intracolonic zymosan produces visceral hyperalgesia in the rat that is mediated by spinal NMDA and non-NMDA receptors. Brain Res 1996; 736: 7-15
15 Silva E, Cleland CL, Gebhart GF. Contributions of glutamate receptors to the maintenance of mustard oil-induced hyperalgesia in spinalized rats. Exp Brain Res 1997; 117: 379-388
16 Lin C, Al-Chaer ED. Long-term sensitization of primary afferents in adult rats exposed to neonatal colon pain. Brain Res 2003; 971: 73-82
17 Lin C, Al-Chaer ED. Differential effects of glutamate receptor antagonists on dorsal horn neurons responding to colorectal distension in a neonatal colon irritation rat model. World J Gastroenterol 2005;11:6495-6502
18 Zimmermann M. Ethical guidelines for investigations of experimental pain in conscious animals. Pain 1983; 16: 109-110
19 Ji Y, Traub RJ. Differential effects of spinal CNQX on two populations of dorsal horn neurons responding to colorectal distension in the rat. Pain 2002; 99: 217-222
20 Takahashi Y, Nakajima Y, Sakamoto T. Dermatome mapping in the rat hindlimb by electrical stimulation of the spinal nerves. Neurosci Lett 1994; 168: 85-88
21 Ness TJ, Gebhart GF. Colorectal distension as a noxious v i scera l s t imulus : phys io log ic and pharmacolog ic characterization of pseudaffective reflexes in the rat. Brain Res 1988; 450: 153-169
22 Lin C, Al-Chaer ED. Primary afferent sensitization in an animal model of chronic visceral pain. The Journal of Pain 2002; 3: 27, #706. American Pain Society, 2002
23 Anand KJ, Coskun V, Thrivikraman KV, Nemeroff CB, Plotsky PM. Long-term behavioral effects of repetitive pain in neonatal rat pups. Physiol Behav 1999; 66: 627-637
24 Anand KJ, Scalzo FM. Can adverse neonatal experiences alter brain development and subsequent behavior? Biol Neonate 2000; 77: 69-82
25 Coutinho SV, Plotsky PM, Sablad M, Miller JC, Zhou H, Bayati AI, McRoberts JA, Mayer EA. Neonatal maternal separation alters stress-induced responses to viscerosomatic nociceptive stimuli in rat. Am J Physiol Gastrointest Liver Physiol 2002 ; 282: G307-G316
26 Fi tzgera ld M , Beggs S . The neurobio logy o f pa in : developmental aspects, Neuroscientist 2001; 7: 246-257
27 Lidow MS, Song ZM, Ren K. Long-term effects of short-lasting early local inflammatory insult. Neuroreport 2001; 12: 399-403
28 Ruda MA, Ling QD, Hohmann AG, Peng YB, Tachibana T. Altered nociceptive neuronal circuits after neonatal peripheral inflammation. Science 2000; 289: 628-631
29 Taddio A, Katz J, Ilersich AL, Koren G. Effect of neonatal circumcision on pain response during subsequent routine vaccination. Lancet 1997; 349: 599-603
30 Taddio A, Shah V, Gilbert-MacLeod C, Katz J. Conditioning and hyperalgesia in newborns exposed to repeated heel lances. JAMA 2002; 288: 857-861
31 Pozo MA, Cervero F. Neurons in the rat spinal trigeminal complex driven by corneal nociceptors: receptive-field properties and effects of noxious stimulation of the cornea. J Neurophysiol 1993; 70: 2370-2378
32 Traub RJ. The spinal contribution of substance P to the generation and maintenance of inflammatory hyperalgesia in the rat. Pain 1996; 67: 151-161 33 Woolf CJ. Evidence for a central component of post-injury pain hypersensitivity. Nature 1983; 306: 686-688
33 Woolf CJ. Evidence for a central component of post-injury pain hypersensitivity. Nature 1983;306:686-688
34 Al-Chaer ED, Feng Y, Willis WD. Comparative study of viscerosomatic input onto postsynaptic dorsal column and spinothalamic tract neurons in the primate. J Neurophysiol 1999; 82: 1876-1882
35 Al-Chaer ED, Lawand NB, Westlund KN, Willis WD. Pelvic visceral input into the nucleus gracilis is largely mediated by the postsynaptic dorsal column pathway. J Neurophysiol 1996; 76: 2675-2690
36 Al-Chaer ED, Westlund KN, Willis WD. Sensitization of postsynaptic dorsal column neuronal responses by colon inflammation. Neuroreport 1997; 8: 3267-3273
37 Honda CN. Visceral and somatic afferent convergence onto neurons near the central canal in the sacral spinal cord of the cat. J Neurophysiol 1985; 53: 1059-1078
38 Ness TJ, Gebhart GF. Characterization of neuronal responses to noxious visceral and somatic stimuli in the medial lumbosacral spinal cord of the rat. J Neurophysiol 1987; 57: 1867-1892
39 Cervero F, Laird JM, Pozo MA. Selective changes of receptive field properties of spinal nociceptive neurones induced by noxious visceral stimulation in the cat. Pain 1992; 51: 335-342
40 Olivar T, Laird JM. Differential effects of N-methyl-D-aspartate receptor blockade on nociceptive somatic and visceral reflexes. Pain 1999; 79: 67-73
41 Rice AS, McMahon SB. Pre-emptive intrathecal administration of an NMDA receptor antagonist (AP-5) prevents hyper-reflexia in a model of persistent visceral pain. Pain 1994; 57: 335-340
42 McRoberts JA, Coutinho SV, Marvizón JC, Grady EF, Tognetto M, Sengupta JN, Ennes HS, Chaban VV, Amadesi S, Creminon C, Lanthorn T, Geppetti P, Bunnett NW, Mayer EA. Role of peripheral N-methyl-D-aspartate (NMDA) receptors in visceral nociception in rats. Gastroenterology 2001; 120: 1737-1748
43 Ji Y, Traub RJ. Spinal NMDA receptors contribute to neuronal processing of acute noxious and nonnoxious colorectal stimulation in the rat. J Neurophysiol 2001; 86: 1783-1791
44 Traub RJ , Zhai Q, Ji Y, Kovalenko M. NMDA receptor antagonists attenuate noxious and nonnoxious colorectal distention-induced Fos expression in the spinal cord and the visceromotor reflex. Neuroscience 2002; 113: 205-211
45 Kozlowski CM, Bountra C, Grundy D. The effect of fentanyl, DNQX and MK-801 on dorsal horn neurones responsive to colorectal distension in the anaesthetized rat. Neurogastroenterol Motil 2000; 12: 239-247
46 Song XJ, Zhao ZQ. Involvement of NMDA and non-NMDA receptors in transmission of spinal visceral nociception in cat. Zhongguo Yao Li Xue Bao 1999; 20: 308-312 Science Editor Kumar M and Guo SY Language Editor Elsevier HK

PO Box 2345, Beijing 100023, China World J Gastroenterol 2005;11(41):6503-6507www.wjgnet.com World Journal of Gastroenterology ISSN [email protected] © 2005 The WJG Press and Elsevier Inc. All rights reserved.E L S E V I E R
• CLINICAL RESEARCH•
Narrow portion of the terminal choledochus is a cause of upstream biliary dilatation in patients with anomalous union of the pancreatic and biliary ducts
Tatsuya Nomura, Yoshio Shirai, Toshifumi Wakai, Naoyuki Yokoyama, Jun Sakata, Katsuyoshi Hatakeyama, Division of Digestive and General Surgery, Niigata University Graduate School of Medical and Dental Sciences, 1 Asahimachi-dori, Niigata, 951-8510, JapanCorrespondence to: Dr. Yoshio Shirai, Division of Digestive and General Surgery, Niigata University Graduate School of Medical and Dental Sciences, 1 Asahimachi-dori, Niigata, 951-8510, Japan. [email protected]: +81-25-227-2228 Fax: +81-25-227-0779Received: 2005-04-13 Accepted: 2005-04-30
AbstractAIM: To clarify the pathogenesis of biliary dilatation associated with anomalous union of the pancreatic and biliary ducts (AUPBD).
METHODS: Direct cholangiopancreatograms of 350 adult patients with or with suspicion of hepatobiliary or pancreatic disorders were reviewed. AUPBD was diagnosed cholangiopancreatographically, when the pancreaticobiliary ductal union was located above the narrow distal segment of the bile duct, which represents the action of the sphincter of Oddi. The narrow portion of the terminal choledochus was defined as symmetrical stricture of the common bile duct just above the pancreaticobiliary ductal union.
RESULTS: AUPBD was found in 36 patients. Among ch-olangiopancreatographic features, the narrow portion of the terminal choledochus was the most pathognomonic for AUPBD (accuracy, 98%); it was present in 29 (81%) patients with AUPBD, but was not found in any patients without AUPBD. Among patients with AUPBD, biliary dilatation (>10 mm) was more frequent in those with the narrow portion of the terminal choledochus (23/29) than in those without (2/7; P = 0.018) AUPBD. Among the patients with both AUPBD and the narrow portion of the terminal choledochus, there was a strong negative correlation between the minimum diameter of the narrow portion and the maximum diameter of the choledochus(r = -0.78, P <0.001), suggesting that the degree of biliary narrowing at the narrow portion correlates with that of upstream biliary dilatation.
CONCLUSION: The narrow portion of the terminal choledochus, a pathognomonic radiologic feature of
AUPBD, may be a cause of biliary dilatation in patients with AUPBD.
© 2005 The WJG Press and Elsevier Inc. All rights reserved.
Key words: Anomalous; Biliary dilatation; Congenital biliary dilatation; Congenital choledochal cyst; Terminal choledochus; Cholangiopancreatography
Nomura T, Shirai Y, Wakai T, Yokoyama N, Sakata J, Hatakeyama K. Narrow portion of the terminal choledochus is a cause of upstream biliary dilatation in patients with anomalous union of the pancreatic and biliary ducts. World J Gastroenterol 2005; 11(41):6503-6507http://www.wjgnet.com/1007-9327/11/6503.asp
INTRODUCTIONAnomalous union of the pancreatic and biliary ducts (AUPBD) is an uncommon congenital condition, which predisposes to various pancreaticobiliary disorders including congenital choledochal cyst[1-5], biliary cancer[6-8], and pancreatitis[9-12], and is more commonly seen in Asian than in Western countries[13]. This anomaly is defined as the pancreaticobiliary ductal union located above the action of the sphincter of Oddi as first described by Babbitt[1]. Although direct cholang-iopancreatography is the most reliable means of detecting this anomaly[14-16] , the pathognomonic cholangiopancreatographic features of AUPBD have not been fully delineated.
AUPBD is f requent ly accompanied by b i l iar y dilatation[1-5], but some patients with AUPBD show no biliary dilatation[8,17]. The causal relationship between AUPBD and biliary dilatation associated with this anomaly has not been fully established.
The aims of this study were to elucidate the cholang-iopancreatographic features specific to AUPBD and to clarify the pathogenesis of biliary dilatation associated with AUPBD, by analyzing direct cholangiopancreatograms of 350 Japanese adult patients with or without AUPBD.
MATERIALS AND METHODSPatients From January 1988 to July 1999, 535 consecutive adultpatients with or with suspicion of hepatobiliary orpancreatic disorders underwent direct cholangiopancrea-
Tatsuya Nomura, Yoshio Shirai, Toshifumi Wakai, Naoyuki Yokoyama, Jun Sakata, Katsuyoshi Hatakeyama

tography before surgical intervention in our hospital. All were Japanese. Direct cholangiopancreatography included endoscopic retrograde cholangiopancreatography (ERCP) and percutaneous transhepatic cholangiography (PTC). One hundred and seventy-six patients were excluded due to biliary involvement from pancreaticobiliary malignancies which precluded opacification of the pancreaticobiliary ductal union, lack of opacification of one or both ducts, or failure to localize the pancreaticobiliary ductal union despite opacification of both ductal systems. Nine patients in whom the common bile and main pancreatic ducts entered separately into the duodenum were also excluded. The remaining 350 patients, in whom ERCP (n = 324) or PTC (n = 26) opacified the pancreaticobiliary ductal union, formed the basis of this retrospective study, including 174 women and 176 men with ages ranging from 18 to 86 years (median, 61 years). They included 118 patients with biliary malignancy, 118 with gallstone disease, 27 with liver tumor, 17 with pancreatic cancer, 16 with congenital choledochal cyst, 11 with chronic pancreatitis, and 43 with miscellaneous disorders.
Cholangiopancreatographic diagnosis of AUPBDAlthough the cr i ter ia for AUPBD have not been standardized, the essential feature of this condition is the
6504 ISSN 1007-9327 CN 14-1219/ R World J Gastroenterol November 7, 2005 Volume 11 Number 41
pancreaticobiliary ductal union located above the action of the sphincter of Oddi as first described by Babbitt[1]. Thus, in this study, AUPBD was diagnosed cholangiopancreato-graphically when the pancreaticobiliary ductal union was located above the narrow distal segment (NDS), which represents the functional region of the sphincter of Oddi (Figures 1 and 2)[8,16,17].
Terminology of cholangiopancreatographic featuresDirect cholangiopancreatograms were reviewed in each of our patients to elucidate the presence or absence of the following major radiologic features: narrow portion of the terminal choledochus, biliary dilatation, and proximal dilatation of the main pancreatic duct.
The narrow portion of the terminal choledochus was defined as symmetrical stricture of the common bile duct just above the pancreaticobiliary ductal union and is a synonym for “stenosis of the distal choledochus”[3],“narrow segment distal to the common bile duct”[18], “narrow segment of the terminal bile duct”[19], “narrow portion of the choledochus”[20], “narrow segment of the common bile duct distal to choledochal cyst”[21], and “narrowed duct segment distal to the biliary cyst”[22]. The narrow portion of the terminal choledochus was always located just below choledochal cysts, when cysts were
Figure 1 Endoscopic retrograde cholangiopancreatogram in a 55-year-old woman with gallbladder cancer associated with AUPBD and cylindrical biliary dilatation (A). Diagram of the cholangiopancreatogram (B). The minimum diameter of the narrow portion of the terminal choledochus is 4 mm, and the maximum diameter of the upstream choledochus is 15 mm. AUPBD: anomalous union of the pancreatic and biliary ducts; NDS: narrow distal segment; P-B ductal union: pancreaticobiliary ductal union; narrow portion: narrow portion of the terminal choledochus; MPD: main pancreatic duct.
Figure 2 Endoscopic retrograde cholangiopancreatogram in a 21-year-old woman with AUPBD and cystic biliary dilatation (A). Diagram of the cholangiopancreatogram (B). The minimum diameter of the narrow portion of the terminal choledochus is 1.5 mm, and the maximum diameter of the upstream choledochus is 57 mm. Proximal dilatation of the MPD is also seen. AUPBD: anomalous union of the pancreatic and biliary ducts; NDS: narrow distal segment; P-B ductal union: pancreaticobiliary ductal union; narrow portion: narrow portion of the terminal choledochus; GB: gallbladder; MPD: main pancreatic duct.
Biliary involvement from gallbladdercancer
Catheter
Narrow protion MPD
Dilatedcholedochus
P-B ductal unionupper borderof NDS
Choledochal cyst
GB
Narrow poRtionP-B ductal union
Upper borderof NDS
Proximal dilatation of MPD
A B
A B

Nomura T et al. Anomalous pancreaticobiliary ductal union 6505
present. The minimum diameter of the narrow portion of the terminal choledochus (if any) and the maximum diameter of the upstream choledochus were measured on cholangiopancreatograms in each patient (Figures 1 and 2).
Biliary dilatation was defined as a diameter exceeding 10 mm[17]. Biliary dilatation was classified as cystic, fusiform, or cylindrical based on its contours on cholangio-pancreatogram[23].
Proximal dilatation of the main pancreatic duct was defined as the proximal portion of the main pancreatic duct with a diameter exceeding 5 mm[24,25].
Kune first demonstrated that the NDS of the bile duct as visualized on cholagiopancreatography represents the functional region of the sphincter of Oddi[26-28]. The NDS was defined as the region lying between the upper border of the “notch” of the bile duct, sudden narrowing of the choledochal lumen just above the ampulla of Vater[29], and the orifice of the ampulla of Vater (Figures 1 and 2).
Statistical analysisStatistics were calculated with the SPSS 9.0 J software package for Windows (SPSS Japan Inc., Tokyo, Japan). Fisher’s exact test and the Spearman's rank correlation were used for data analysis. P values of <0.05 were accepted as statistically significant.
RESULTSAUPBD was diagnosed in 36 patients (10%) on direct cholangiopancreatograms, including 27 women and 9 men. They had concomitant pancreaticobiliary disorders, including congenital choledochal cyst (n = 16), gallbladder cancer (n = 13), benign gallbladder polyps (n = 3), chronic pancreatitis (n = 2), carcinoma of the common bile duct(n = 1), and adenomyomatosis of the gallbladder (n = 1).
Cholangiopancreatographic features specific to AUPBDThe accuracy of cholangiopancreatographic features for the detection of AUPBD is summarized in Table 1. The narrow portion of the terminal choledochus was present in 29 (81%) patients with AUPBD, but was not found in any patients without AUPBD.
Relationship between the narrow portion of the terminal choledochus and upstream biliary dilatationIn 36 patients with AUPBD, biliary dilatation was more frequent in patients with the narrow portion of the terminal choledochus (23/29, 79%) than in those without (2/7, 28%; P = 0.018) AUPBD. Thus, the presence of the narrow portion of the terminal choledochus was associated with upstream biliary dilatation.
3
3
Table 1 Diagnostic accuracy of cholangiopancreatographic features for the detection of AUPBD
Narrow portion of the terminal 81 100 100 98 98 choledochus (n = 29) Biliary dilatation (>10 mm) (n = 25) 69 68 20 95 68Proximal dilatation of the main 19 100 100 91 92 pancreatic duct (>5 mm) (n = 7)
Cholangiopancreatographic feature Sensitivity(%) Specificity(%) Positive predictive value (%) Negative predictive value (%) Accuracy(%)
AUPBD: anomalous union of the pancreatic and biliary ducts.
Among the 29 patients with both AUPBD and the narrow portion of the terminal choledochus, there was a strong negative correlation between the minimum diameter of the narrow portion of the terminal choledochus and the maximum diameter of the upstream choledochus (r = -0.78, P < 0.001) (Figure 3). Thus, the degree of biliary narrowing at the narrow portion of the terminal choledochus correlated with that of upstream biliary dilatation.
Also, among the 29 patients with both AUPBD and the narrow portion of the terminal choledochus, a strong positive correlation was noted between patient’s age and the minimum diameter of the narrow portion of the terminal
Figure 4 Patient’s age was strongly correlated with the minimum diameter of the narrow portion of the terminal choledochus (r = 0.78, P<0.001).
Figure 3 There was a strong negative correlation between the minimum diameter of the narrow portion of the terminal choledochus and the maximum diameter of the upstream choledochus (r = -0.78, P < 0.001).
1 7654320
60
50
40
30
20
10
70
80M
axim
um d
iam
eter
of
the
chol
edoc
hus
(mm
)
Minimum diameter of the narrow portion of the terminal choledochus (mm)
1
7
6
5
4
3
2
0 605040302010 70
Min
imum
dia
met
er o
f th
e na
rrow
por
tion
of
the
term
inal
cho
ledo
chus
(m
m)
Patient age (yr)

choledochus (r = 0.78, P < 0.001) (Figure 4), whereas there was a negative correlation between patient’s age and the maximum diameter of the choledochus(r = -0.53, P = 0.001) (Figure 5). Thus, younger the patient, the more marked were the biliary narrowing at the narrow portion of the terminal choledochus and upstream biliary dilatation.
DISCUSSIONThe narrow portion of the terminal choledochus is a characteristic feature of congenital biliary dilatation[18-22]. The cur rent study demonstrated that i t i s a lso a pathognomonic feature of AUPBD. AUPBD is often associated with congenital biliary dilatation[2-5]. Thus, we hypothesized that the narrow portion of the terminal choledochus contributes to the development of upstream biliary dilatation frequently seen in AUPBD patients.
Previous studies from Japan reported a prevalence of AUPBD on ERCP ranging from 1.5% to 3.2%[6,10,30]. The extremely high prevalence of AUPBD in our series (10%) may be explained by the fact that our hospital is a tertiary referral center and that only surgical patients were included in this study.
While pancreaticobiliary ductal union located above the sphincteric action[16,17,31], long common channel[10,30], and concomitant cystic biliary dilatation[2-5] have been advocated as characteristic radiologic findings, the diagnostic significance of the narrow portion of the terminal choledochus has not been emphasized. The current study revealed that the narrow portion is present in most adult patients with AUPBD and is a pathognomonic radiologic feature of AUPBD. The narrow portion of the terminal choledochus is an important finding when diagnosing AUPBD by direct cholangiopancreatography.
Previous studies suggested that the narrow portion of the terminal choledochus may lead to the development of congenital biliary dilatation in pediatric patients[18,32,33]. Ito et al[18] reported that the length rather than the width of the narrow portion of the terminal choledochus is positively correlated with the degree of upstream choledochal dilatation in children with congenital biliary dilatation.
Experimental studies revealed that bile duct obstruction causes cystic biliary dilatation in young animals, while it leads to cylindrical, not cystic, biliary dilatation in adult animals[32,34,35], suggesting that increased intraluminal pressure leads to cystic dilatation of the bile duct, only if the ductal wall is immature. This may explain the fact that cystic biliary dilatation is more common in pediatric patients[6,36] and that the degree of biliary dilatation was more marked in younger patients in our series. The current study is the first demonstration that biliary narrowing at the narrow portion correlates with upstream biliary dilatation even in adult patients with AUPBD. In summary, increased intraluminal pressure due to the narrow portion of the terminal choledochus may cause upstream biliary dilatation in both pediatric and adult patients with AUPBD, although the form of upstream biliary dilatation appears to differ between pediatric and adult patients.
Another possible cause of biliary dilatation in patients with AUPBD is the reflux of pancreatic juice into the bile duct. It has been reported that the refluxed pancreatic juice into the bile duct may lead to increased intraluminal pressure and dilatation of the bile duct[1,37,38]. However, the strong negative correlation between the minimum diameter of the narrow portion of the terminal choledochus and the maximum diameter of the upstream choledochus in the current study suggests that increased intraluminal pressure due to biliary narrowing, rather than refluxed pancreatic juice, may cause upstream biliary dilatation in patients with AUPBD.
Kusunoki e t a l [20 ,39 ] r epor ted the presence of “oligoganglio-nosis” in the choledochal wall just below the cystic dilatation in patients with congenital choledochal cyst, suggesting that autonomic dysfunction at the “oligoganglionic” segment of the bile duct may play a role in the development of upstream biliary dilatation. This “oligoganglionic” segment appears to correspond to the narrow portion of the terminal choledochus, as defined in the current study, and may functionally obstruct biliary passage through the segment. It is unknown, however, whether the “oligoganglionosis” was present in our patients because histologic specimens of the narrow portion of the terminal choledochus were not available in any of our patients.
The limitations of the current study include the fact that it was retrospective, and that 176 patients were excluded due to inadequate opacification of the pancreaticobiliary ductal system. However, we feel that these limitations did not significantly influence the outcome of the study because the correlations between variables were too marked to have resulted from chance. The current results are the clearest demonstration to date of the causal relationship between the narrow portion of the terminal choledochus and upstream biliary dilatation in patients with AUPBD.
In conclusion, the narrow portion of the terminal choledochus is a pathognomonic radiologic feature of AUPBD and may be a cause of biliary dilatation in patients with AUPBD.
6506 ISSN 1007-9327 CN 14-1219/ R World J Gastroenterol November 7, 2005 Volume 11 Number 41
Figure 5 Patient’s age was negatively correlated with the maximum diameter of the choledochus (r = –0.53, P = 0.001).
10 7060504030200
60
50
40
30
20
10
70
80
Max
imum
dia
met
er o
f th
e ch
oled
ochu
s (m
m)
Patient's age (yr)

REFERENCES1 Babbitt DP. Congenital choledochal cysts: new etiological
concept based on anomalous relationships of the common bile duct and pancreatic bulb. Ann Radiol 1969; 12: 231-240
2 Kimura K, Ohto M, Ono T, Tsuchiya Y, Saisho H, Kawamura K, Yogi Y, Karasawa E, Okuda K. Congenital cystic dilatation of the common bile duct: relationship to anomalous pancreaticobiliary ductal union. Am J Roentgenol 1977; 128: 571-577
3 Todani T, Watanabe Y, Fujii T, Uemura S. Anomalous arrangement of the pancreatobiliary ductal system in patients with a choledochal cyst. Am J Surg 1984; 147: 672-676
4 Okada A, Nakamura T, Higaki J, Okumura K, Kamata S, Oguchi Y. Congenital dilatation of the bile duct in 100 instances and its relationship with anomalous junction. Surg Gynecol Obstet 1990; 171: 291-298
5 Lipsett PA, Pitt HA, Colombani PM, Boitnott JK, Cameron JL. Choledochal cyst disease. A changing pattern of presentation. Ann Surg 1994; 220: 644-652
6 Kimura K, Ohto M, Saisho H, Unozawa T, Tsuchiya Y, Morita M, Ebara M, Matsutani S, Okuda K. Association of gallbladder carcinoma and anomalous pancreaticobiliary ductal union. Gastroenterology 1985; 89: 1258-1265
7 M i s r a S P , G u l a t i P , T h o r a t V K , V i j J C , A n a n d B S . Pancreaticobiliary ductal union in biliary diseases. An endoscopic retrograde cholangiopancreatographic study. Gastroenterology 1989; 96: 907-912
8 Sandoh N, Shirai Y, Hatakeyama K. Incidence of anomalous union of the pancreaticobiliary ductal system in biliary cancer. Hepatogastroenterology 1997; 44: 1580-1583
9 Misra SP, Dwivedi M. Pancreaticobiliary ductal union. Gut 1990; 31: 1141-1149
10 Sugiyama M, Atomi Y, Kuroda A. Pancreatic disorders associated with anomalous pancreaticobiliary junction. Surgery 1999; 126: 492-497
11 Guelrud M, Morera C, Rodriguez M, Prados JG, Jaén D. Normal and anomalous pancreaticobiliary union in children and adolescents. Gastrointest Endosc 1999; 50: 189-193
12 Guelrud M, Morera C, Rodriguez M, Jaen D, Pierre R. Sphincter of Oddi dysfunction in children with recurrent pancreatitis and anomalous pancreaticobiliary union: an etiologic concept. Gastrointest Endosc 1999; 50: 194-199
13 Sautereau D, Sava P, Dupuy JF, Cessot F, Cubertafond P, Claude R, Pillegand B. Cancer des voies biliaires extra-hépatiques et anomalie de la jonction bilio-pancréatique. Gastroenterol Clin Biol 1989; 13: 298-301
14 Yamao K, Mizutani S, Nakazawa S, Inui K, Kanemaki N, Miyoshi H, Segawa K, Zenda H, Kato T. Prospective study of the detect ion of anomalous connect ions of pancreatobiliary ducts during routine medical examinations. Hepatogastroenterology 1996; 43: 1238-1245
15 Matos C, Nicaise N, Deviére J, Cassart M, Metens T, Struyven J, Cremer M. Choledochal cysts: comparison of findings at MR cholangiopancreatography and endoscopic retrograde cholangiopancreatography in eight patients. Radiology 1998; 209: 443-448
16 Nomura T, Shirai Y, Sandoh N, Nagakura S, Hatakeyama K. Cholangiographic criteria for anomalous union of the pancreatic and biliary ducts. Gastrointest Endosc 2002; 55: 204-208
17 Mori K, Nagakawa T, Ohta T, Nakano T, Kayahara M, Kanno M, Ueno K, Izumi R, Miyazaki I. Association between gallbladder cancer and anomalous union of the pancreaticobiliary ductal system. Hepatogastroenterology 1993; 40: 56-60
18 Ito T, Ando H, Nagaya M, Sugito T. Congenital dilatation of the common bile duct in children.-- The etiologic significance
of the narrow segment distal to the dilated common bile duct. Z Kinderchir 1984; 39: 40-45
19 Matsumoto Y, Uchida K, Nakase A, Honjo I. Clinicopathologic classification of congenital cystic dilatation of the common bile duct. Am J Surg 1977; 134: 569-574
20 Kusunoki M, Saitoh N, Yamamura T, Fujita S, Takahashi T, Utsunomiya J. Choledochal cysts. Oligoganglionosis in the narrow portion of the choledochus. Arch Surg 1988; 123: 984-986
21 Suda K, Matsumoto Y, Miyano T. Narrow duct segment distal to choledochal cyst. Am J Gastroenterol 1991; 86: 1259-1263
22 Matsumoto Y, Fujii H, Itakura J, Mogaki MA, Matsuda M, Morozumi A, Fujino M, Suda K. Pancreaticobiliary maljunction: etiologic concepts on radiologic aspects. Gastrointest Endosc 2001; 53: 614-619
23 Todani T, Watanabe Y, Narusue M, Tabuchi K, Okajima K. Congenital bile duct cysts. Classification, operative procedures, and review of thirty-seven cases including cancer arising from choledochal cyst. Am J Surg 1977; 134: 263-269
24 Rattner DW, Schapiro RH, Warshaw AL. Abnormalities of the pancreatic and biliary ducts in adult patients with choledochal cysts. Arch Surg 1983; 118: 1068-1073
25 Wiedmeyer DA, Stewart ET, Dodds WJ, Geenen JE, Vennes JA, Taylor AJ. Choledochal cyst : findings on cholangiopancreatography with emphasis on ectasia of the common channel. Am J Roentgenol 1989; 153: 969-972
26 Kune GA. Surgical anatomy of common bile duct. Arch Surg 1964; 89: 995-1004
27 Kune GA. The influence of structure and function in the surgery of the biliary tract. Ann R Coll Surg Engl 1970; 47: 78-91
28 Kune GA, Sali A. The practice of biliary surgery. 2nd ed. Oxford: Blackwell Sci Pub 1980: 1-31
29 Hand BH. An anatomical study of the choledochoduodenal area. Br J Surg 1963; 50: 486-494
30 Kato O, Hattori K, Suzuki T, Tachino F, Yuasa T. Clinical significance of anomalous pancreaticobil iary union. Gastrointest Endosc 1983; 29: 94-98
31 Nagata E, Sakai K, Kinoshita H, Kobayashi Y. The relation between carcinoma of the gallbladder and an anomalous connection between the choledochus and the pancreatic duct. Ann Surg 1985; 202: 182-190
32 Miyano T, Suruga K, Suda K. Abnormal choledocho-pancreatico ductal junction related to the etiology of infantile obstructive jaundice diseases. J Pediatr Surg 1979; 14: 16-26
33 Shimotake T, Iwai N, Yanagihara J, Inoue K, Fushiki S. Innervation patterns in congenital biliary dilatation. Eur J Pediatr Surg 1995; 5: 265-270
34 Kato T, Asakura Y, Kasai M. An attempt to produce choledochal cyst in puppies. J Pediatr Surg 1974; 9: 509-513
35 Spitz L. Experimental production of cystic dilatation of the common bile duct in neonatal lambs. J Pediatr Surg 1977; 12: 39-42
36 Chaudhary A, Dhar P, Sachdev A, Kumar N, Vij JC, Sarin SK, Broor SL, Sharma SS. Choledochal cysts - differences in children and adults. Br J Surg 1996; 83: 186-188
37 Ohkawa H, Sawaguchi S, Yamazaki Y, Ishikawa A, Kikuchi M. Experimental analysis of the ill effect of anomalous pancreaticobiliary ductal union. J Pediatr Surg 1982; 17: 7-13
38 Oguchi Y, Okada A, Nakamura T, Okumura K, Miyata M, Nakao K, Kawashima Y. Histopathologic studies of congenital dilatation of the bile duct as related to an anomalous junction of the pancreaticobiliary ductal system: clinical and experimental studies. Surgery 1988; 103: 168-173
39 Kusunoki M, Yamamura T, Takahashi T, Kantoh M, Ishikawa Y, Utsunomiya J. Choledochal cyst. Its possible autonomic involvement in the bile duct. Arch Surg 1987; 122: 997-1000
Science Editor Ma JY and Guo SY Language Editor Elsevier HK
Nomura T et al. Anomalous pancreaticobiliary ductal union 6507
PO Box 2345, Beijing 100023, China World J Gastroenterol 2005;11(41):6508-6511www.wjgnet.com World Journal of Gastroenterology ISSN [email protected] © 2005 The WJG Press and Elsevier Inc. All rights reserved.E L S E V I E R
• RAPID COMMUNICATION •
Adolfo Francesco Attili, Adriano De Santis, Fabia Attili, GI Unit, Department of Clinical Medicine, University of Roma “La Sapienza”, ItalyEnrico Roda, Davide Festi, Department of Internal Medicine, University of Bologna, ItalyNicola Carulli, Department of Internal Medicine, University of Modena, ItalySupported by the SANOFI-Synthelabo SpACorrespondence to: Adolfo Francesco Attili , GI Unit, Department of Clinical Medicine, Policlinico Umberto I, Rome 00185 , Italy. [email protected]: +39-6-491671Received: 2004-11-23 Accepted: 2004-12-20
Prevalence of gallstone disease in first-degree relatives of patients with cholelithiasis
Adolfo Francesco Attili, Adriano De Santis, Fabia Attili, Enrico Roda, Davide Festi, Nicola Carulli
AbstractAIM: To evaluate the influence of familiality on the prevalence of gallstone disease (GD) in Italy.
METHODS: Families of 79 subjects with gallstones (cases) and of 79 subjects without gallstones (controls) were investigated for the presence of gallstones by ultrasonography. Index cases and index controls were matched for age, sex, and operative unit. Sixty-three and sixty-two husbands and wives of index cases and index controls, respectively, were also studied.
RESULTS: Ove ra l l , t he p reva l ence o f GD was significantly higher ( χ 2=14.52, P <0.001) in the 202 first-degree relatives of subjects with gallstones than that in the 201 first-degree relatives of subjects without gallstones (28.6% vs 12.4%, relative risk (RR) 1.80, 95% confidence interval (CI) 1.29-2.63). In particular, prevalence of GD was significantly higher in mothers, fathers, and sisters of index cases than that in the respective family members of index controls. The highest RR was observed in mothers (RR=2.35, 95%CI 1.38-4.3). Prevalence of GD was not obviously different in brothers and also in husbands and wives of index cases and index controls. Family members of index cases did not differ from family members of control cases with respect to the most important risk factors for gallstones (age, diabetes, BMI, and number of pregnancies) with an exception of a higher prevalence of diabetes in fathers of index controls than in fathers of index cases.
CONCLUSION: This study confirms that familiality plays a very important role in the pathogenesis of gallstones.
© 2005 The WJG Press and Elsevier Inc. All rights reserved.
INTRODUCTIONGallstone disease (GD) is very common among the Western civilized countries. Nonetheless the literature concerning family inheritance is scarce, although consistent. Körner[1] collected 74 family pedigrees of probands with gallbladder disease and showed that gallstones were five times more common in families of affected individuals than in families of his control group. Van der Linden and Lindelöf[2] investigated the presence of gallstones in wives and husbands of subjects with gallstones and also in siblings of the same sex of the wife or husband, demonstrating the data of a clear 2:1 ratio in favor of familial occurrence. Because familial occurrence does not necessarily reflect genetic factors, Van der Linden and Westlin[3] studied the occurrence of GD in spouses who had lived together continuously and presumably shared the same environment, especially diet, during adult life. They found that women married to subjects with gallstones do not suffer more often from the disease than do other women. The importance of familiality has been well identified also in epidemiological studies. Jorgensen[4] in Denmark demonstrated a relative risk (RR) of 2:1 in first degree relatives of gallstone patients. The Sirmione study[5] found a RR of 3.3:1 in sons of subjects with gallstones with respect to sons of subjects without gallstones. Similarly, in Israel[6] and in India[7] too, an elevated prevalence of gallstones has been demonstrated in family members of subjects with gallstones with respect to family members of subjects without gallstones. The MICOL study[8] demonstrated that subjects with a family history of GD are at an increased risk for the presence of gallstones in their gallbladder. To our knowledge, a formal family study for gallstones is lacking in Italy. We, therefore, aimed to evaluate the influence of familiality on the prevalence of GD in Italy.
MATERIALS AND METHODS
Key words: Gallstones; Familiality
Attili AF, De Santis A, Attili F, Roda E, Festi D, Carulli N. Prevalence of gallstone disease in first-degree relatives of patients with cholelithiasis. World J Gastroenterol 2005;11(41): 6508-6511http://www.wjgnet.com/1007-9327/11/6508.asp

Attili A F et al. Familial occurrence of gallstones in Italy 6509
This study was performed in 16 operative units (5 in the north, 5 in the center and 6 in the south of Italy). Each operative unit was equipped with an ultrasonographic apparatus of similar characteristics (i.e., equipped with a 3.5-MHz linear transducer) and was instructed to follow an identical protocol (all the subjects were examined in the supine and left decubitus position). Seventy-nine families of cases and 79 families of controls were enrolled in the study. All subjects with gallstones consecutively observed by the medical staff of the operative units were included as cases (case subjects), if at least one parent and a sibling were living and gave their consent to participate in the study. For each case subject, a control subject matching the sex and age (±3 years) wasselected among those who attended the outpatient echographic services of the single operative unit and did not show any presence of gallstones or were previously submitted to cholecystectomy. Cases and controls were matched not only for age and sex, but they did not differ also for the other most important risk factors for gallstones: BMI, number of pregnancies (for females) and prevalence of diabetes (Table 1). Families without a matching family within the same operative unit were excluded from the calculations.
All the available first degree relatives of cases were invited to participate in the study. Husbands and spouses were also studied, when available. Participations among living first degree relatives of cases and controls were 82% and 80%, respectively; among living spouses and husbands of cases and controls were 88% and 89%, respectively. A precoded questionnaire regarding personal,
physiological and pathological history, dietary habits and number of pregnancies (females) was administered by a member of the medical staff to all the family members. Each family subject was also submitted to anthropometric measurements (weight and height) and ultrasonographic examination of the biliary tract. BMI was calculated by dividing the weight (kg) by the square of height (m). Subjects were considered as having GD, if they showed presence of gallstones in their gallbladder or had already been submitted to cholecystectomy.
Statistical analysisAll statistical analyses were carried out with the NCSS statistical software program, 329 North 1000 East Kaysville, UT 84037, USA. The Student’s t-test and the χ2 test were used when appropriate. A P value less than 0.05 was considered statistically significant. We computed Mantel-Haenszel estimates of RR with 95% confidence intervals (CI).
RESULTSOverall, prevalence of GD was significantly higher (χ2=14.52, P<0.001) in the 202 first-degree relatives of subjects with gallstones than that in the 201 first-degree relatives of subjects without gallstones (28.6% vs 12.4%, RR 1.80, 95%CI 1.29-2.63)(Table 1). In particular, 13 of the 31 (41.9%) fathers of the index cases and 6 of the 34 fathers of the index controls had GD. The difference was significant according the χ2 test although the lower limit of the 95%CI of the RR was below 1 (Table 2). Fathers of cases and controls did not differ for age and BMI, but fathers of controls had a significantly higher prevalence of diabetes (Table 2). Prevalence of GD was significantly higher among the 51 mothers of index cases as compared to the 51 mothers of index controls (56.9% vs 21.6%, RR 2.35 95%CI 1.38-4.3, Table 2). Mothers of cases did not differ from mothers of controls as far as the most important risk factors for gallstones were concerned, i.e. age, BMI, prevalence of diabetes, and number of pregnancies. Brothers of cases and brothers of controls (Table 3) showed similar prevalences of GD and similar levels of risk factors for gallstones, i.e. age, BMI, and prevalence of diabetes. Among the sisters, prevalence of GD
aP<0.05 vs controls (χ 2 = 4.15); cP<0.05 vs controls (χ 2 = 4.66; RR = 1.75 (0.98-2.6 95% CI); bP<0.001 vs controls (χ 2 = 13.32; RR = 2.35 (1.38-4.3 95% CI).
Table 1 Levels of the most important risk factors for gallstones in cases with or without gallstones
Male/female (n) 30/49 30/49 NS
Age (yr); mean (CI) 48.6 (45.8–51.4) 48.5 (45.7–51.4) NS
BMI; mean (CI) 25.5 (24,9–26.4) 25.7 (24.7–26.7) NS
Number of pregnancies 1.71 (1.29–2.13) 1.47 (1.04–1.89) NS
(females); mean (CI)
Cases Controls Pn = 79 n = 79
Table 2 Prevalence of GD and levels of the most important risk factors for gallstones in fathers and mothers of subjects with or without gallstones
Age (yr); mean (CI) 70.0 (66.7-73.4) 70.9 (67.6-74.2) 72.4 (69.2-75.5) 71.8 (71.8-74.8)
BMI; mean (CI) 25.7 (24.4-27.0) 27.5 (26.3-28.6) 26.3 (25.1-27.6) 26.3 (25.4-27.3)
Diabetes (%) 3.4a 20.6 20.0 21.2
Number. of pregnancies; mean (CI) - - 2.9 (2.4-3.4) 2.9 (2.5-3.4)
GD (%) 41.9c 17.6 56.9b 21.6
Fathers of Mothers ofCases Controls Cases Controlsn = 31 n = 34 n = 51 n = 51

6510 ISSN 1007-9327 CN 14-1219/ R World J Gastroenterol November 7, 2005 Volume 11 Number 41
was significantly higher among the sisters of index cases as compared to the sisters of controls (25.6% vs 9.1%; χ2= 4.04, P < 0.05), but the lower limit of the RR confidence interval was below 1 [RR = 2.03 (0.94-6.22 95%CI)]. The sisters of cases and sisters of controls did not differ in age, BMI, prevalence of diabetes, and number of pregnancies. None of the sons of the cases and controls had GD. No significant difference was observed in prevalence of GD among husbands and spouses of the index cases and controls (Table 4). Husbands and wives of index cases or controls also did not differ for the most important risk factors for gallstones (Table 4).
DISCUSSIONThis study confirms that genetic factors play a very important role in the pathogenesis of GD. Overall, the prevalence of GD was significantly higher in the first-degree relatives of subjects with gallstones than in those of subjects without gallstones. The highest relative risks were found in female family members (mothers and sisters). This finding might be explained by the fact that GD is inherited as a sex-linked dominant trait. One might argue that an increased familial prevalence of gallstones might not necessarily involve a genetic defect, but rather reflects a common environmental risk factor. However, our results regarding the prevalence of GD in husbands and wives of index cases and index controls were in agreement with previous data by Van Der Linden and Westlin[3] and Leoci
Table 3 Prevalence of GD and levels of the most important risk factors for gallstones in brothers and sisters of subjects with or without gallstones
Brothers of Sisters of
Cases Controls Cases Controls n = 50 n = 47 n = 39 n = 44
Age (yr); mean (CI) 48.5 (45.4-51.6) 44.9 (41.4-48.3) 43.9 (39.0-48.8) 48.9 (44.9-52.8)
BMI ; mean (CI) 25.6 (24.6-26.5) 25.5 (24.4-26.6) 24.8 (23.4-26.1) 25.8 (24.5-27.1)
Diabetes (%) 5.9 0 2.7 11.4
No. of pregnancies; mean (CI) - - 1.3 (0.9-1.7) 1.5 (1.0-1.9)
GD (%) 10.0 8.5 25.6a 9.1
aP<0.05 vs controls (χ 2 = 4.04; RR = 2.03 [0.94-6.22 95%CI])
et al[9]. On the other hand, family members of index cases and control cases had similar levels of the most important risk factors for GD. These results support the hypothesis that the differences in GD prevalences were due to genetic rather than to environmental factors. The results of our study further confirmed that a positive family history of GD might be included among the variables that can be used in order to select populations with a higher prevalence of gallstones than that predicted simply on the basis of age and sex. Using a similar approach[10], we were able to demonstrate that selection of subjects with multiple factors associated with gallstones increases the a priori probability of gallstone diagnosis by a factor 2 in females and 3 in males. Some studies have identified genes (Lith1 on Chr 2, Lith 2 on Chr 19, Lith 3 on Chr 17) that are resporsible for increased gallstone formation in mice[11-18]. Although there is no evidence yet, that any of the Lith genes in the mouse is important in human gallstone susceptibility, some are likely to be and an era of “pre-gallstone disease” identification and possibly prevention seems open.
ACKNOWLEDGMENTSParticipating Operative Units are as follows: (1). Correggio (Reggio Emilia) - Ospedale Civile, Marchi M; (2). Parma -Ospedale Civile, Colla G; (3). Faenza (Ravenna)- Ospedale degli Infermi, Stefanini G; (4). Abano Terme (Padova)-Presidio Ospedaliero USSL 16, Parisi G; (5).Genova, Cattedra di Gastroenterologia, Celle G; (6).Castel Fiorentino (Firenze)-Ospedale Civile. Tafi A; (7).Livorno-Ospedale Civile, Vivaldi I; (8). Pisa-Ospedale Cisanello, Bresci G; (9). Roma - Campus Biomedico, Cicala M; (10). Roma-Policlinico Umberto I, De Santis A; (11).Enna-Ospedale Umberto I, Trimarchi M; (12). Lecce- Ospedale Civile Delle Fonti Di Scorano, Paiano A; (13).Foggia-Ospedali Riuniti Di Foggia, Vinelli F; (14). Salerno -Ospedale Civile S Leonardo, Romano M; (15). Mercato S Severino (Salerno)-Ospedale Civile, Maurano A; (16).Reggio Calabria-Ospedale Morelli, Polimeni N.
REFERENCES1 Körner G. Über die familiare harfung den gallenblasenkrankh
eitern. Z Mensch Vererb Konstitutionsl 1937; 20: 526-582 2 Van der Linden W, Lindelöf G. The familial occurrence of
Husbands and wives of
Cases Controls P n = 63 n = 62
Males/females 40/23 39/23 NSAge (yr); mean (CI) 50.2 (48.8-51.4) 50.6 (48.9-51.7) NSBMI ; mean (CI) 25.9 (24.9-26.6) 26.0 (24.9-27.0) NSNo. of pregnancies (female); 1.5 (1.0-2.2) 1.6 (0.8-2.1) NSmean (CI)Diabetes (%) 4.8 3.2 NSGD (%) 9.5 11.2 NS
Table 4 Prevalence of GD and levels of the most important risk factors for gallstones in husbands and wives of subjects with or without gallstones

Attili AF et al. Familial occurrence of gallstones in Italy 6511
gallstone disease. Acta Genet Stat Med. 1965; 15 : 159-164 3 Van der Linden W, Westlin N. The familial occurrence of
gallstone disease II. Occurrence in husbands and wives. Acta Genet Stat Med 1966; 16: 377-382
4 Jørgensen T. Gallstones in a Danish population: familial occurrence and social factors. J Biosoc Sci 1988; 20: 111-120
5 Barbara L, Sama C, Morselli Labate AM, Taroni F, Rusticali AG, Festi D, Sapio C, Roda E, Banterle C, Puci A. A population study on the prevalence of gallstone disease: the Sirmione Study. Hepatology 1987; 7: 913-917
6 Gilat T, Feldman C, Halpern Z, Dan M, Bar Meir S. An increased familial frequency of gallstones. Gastroenterology 1983; 84: 242-246
7 Sarin SK, Negi VS, Dewan R, Sasan S, Saraya A. High familial prevalence of gallstones in the first-degree relatives of gallstone patients. Hepatology 1995; 22: 138-141
8 Attili AF, Capocaccia R, Carulli N, Festi D, Roda E, Barbara L, Capocaccia L, Menotti A, Okolicsanyi L, Ricci G, Lalloni L, Mariotti S, Sama C, Scafato E. Factors associated with gallstone disease in the MICOL experience. Multicenter Italian Study on Epidemiology of Cholelithiasis. Hepatology 1997; 26: 809-818
9 Leoci C, Chiloiro M, Guerra V, Misciagna G. [Genetic epidemiology of cholelithiasis. A case-control study of a population] Minerva Gastroenterol Dietol 1991; 37: 35-39
10 Attili AF, Pazzi P, Galeazzi R. Prevalence of previously undiagnosed gallstones in a population with multiple risk factors. Dig Dis Sci 1995; 40: 1770-1774
11 Khanuja B, Cheah YC, Hunt M, Nishina PM, Wang DQ, Chen HW, Billheimer JT, Carey MC, Paigen B. Lith1, a major
gene affecting cholesterol gallstone formation among inbred strains of mice. Proc Natl Acad Sci United States 1995; 92: 7729-7733
12 Lammert F , Wang DQ, Wit tenburg H, Bouchard G, Hillebrandt S, Taenzler B, Carey MC, Paigen B. Lith genes control mucin accumulation, cholesterol crystallization, and gallstone formation in A/J and AKR/J inbred mice. Hepatology 2002; 36: 1145-1154
13 Wittenburg H, Lammert F, Wang DQ, Churchill GA, Li R, Bouchard G, Carey MC, Paigen B. Interacting QTLs for cholesterol gallstones and gallbladder mucin in AKR and SWR strains of mice. Physiol Genomics 2002; 8: 67-77
14 van Erpecum KJ, Wang DQ, Lammert F, Paigen B, Groen AK, Carey MC. Phenotypic characterization of Lith genes that determine susceptibility to cholesterol cholelithiasis in inbred mice: soluble pronucleating proteins in gallbladder and hepatic biles. J Hepatol 2001; 35: 444-451
15 Paigen B, Schork NJ, Svenson KL, Cheah YC, Mu JL, Lammert F, Wang DQ, Bouchard G, Carey MC. Quantitative trait loci mapping for cholesterol gallstones in AKR/J and C57L/J strains of mice. Physiol Genomics 2000; 4: 59-65
16 Lammert F, Wang DQ, Paigen B, Carey MC. Phenotypic characterization of Lith genes that determine susceptibility to cholesterol cholelithiasis in inbred mice: integrated activities of hepatic lipid regulatory enzymes. J Lipid Res 1999; 40: 2080-2090
17 Wang DQ, Lammert F, Paigen B, Carey MC. Phenotypic characterization of lith genes that determine susceptibility to cholesterol cholelithiasis in inbred mice. Pathophysiology Of biliary lipid secretion. J Lipid Res 1999; 40: 2066-2079
18 Wang DQ, Paigen B, Carey MC. Phenotypic characterization of Lith genes that determine susceptibility to cholesterol cholelithiasis in inbred mice: physical-chemistry of gallbladder bile. J Lipid Res 1997; 38: 1395-1411
Sciencel Editor Kumar M and Guo SY Language Editor ELsevier HK

PO Box 2345, Beijing 100023, China World J Gastroenterol 2005;11(41):6512-6517www.wjgnet.com World Journal of Gastroenterology ISSN [email protected] © 2005 The WJG Press and Elsevier Inc. All rights reserved.E L S E V I E R
• ������ ������������� •������ ������������� • •
Genistein inhibits invasive potential of human hepatocellular carcinoma by altering cell cycle, apoptosis, and angiogenesis
Yan Gu, Chen-Fang Zhu, Hitoshi Iwamoto, Ji-Sheng Chen
Yan Gu, Chen-Fang Zhu, Department of General Surgery, The Ninth People’s Hospital, Shanghai Second Medical University, Shanghai 200011, ChinaHitoshi Iwamoto, Fifth Department of Surgery, Tokyo Medical University, Tokyo 193-8639, JapanJi-Sheng Chen, Department of Hepatobiliary Surgery, Sun Yat-Sen Memorial Hospital, Sun Yat-Sen University, Guangzhou 510120, ChinaSupported by the Basic Research Key Project of the Science Foundation of Shanghai Municipal Commission of Science and Technology, No. 02JC14001Correspondence to: Yan Gu, Division of Liver and Pancreas Transplantation, The Dumont-UCLA Transplant Center, Los Angeles, CA 90095, United Stutes. [email protected]: +1-323-397-8941Received: 2005-03-18 Accepted: 2005-04-11
AbstractAIM: To study the in vitro and in vivo inhibitory effects of genistein on invasive potential of Bel 7402 hepatocellular carcinoma (HCC) cells and to explore the underlying mechanism.
METHODS: Bel 7402 HCC cel ls were exposed to genistein. The invasive activity of tumor cells was assayed in transwell cell culture chamber. p125FAK expression and cell cycle were evaluated by a functional assay. Cell apoptosis analysis was performed with TUNEL method. In addition, bilateral subrenal capsule xenograft transplantation of HCC was performed in 10 nude mice. Genistein was injected and the invasion of HCC into the renal parenchyma was observed. Microvessels with immunohistochemical staining were detected.
RESULTS: Genistein significantly inhibited the growth of Bel 7402 cells, the inhibitory rate of tumor cells was 26–42%. The invasive potential of Bel 7402 cells in vitro was significantly inhibited, the inhibitory rate was 11–28%. Genistein caused G2/M cell cycle arrest, S phase decreased significantly. The occurrence of apoptosis in genistein group increased significantly. The expression of p125FAK in 5 μg/mL genistein group (15.26±0.16%) and 10 μg/mL genistein group (12.89±0.36%) was significantly lower than that in the control group (19.75±1.12%, P<0.05). Tumor growth in genistein-treated nude mice was significantly retarded in comparison to control mice, the inhibitory rate of tumor growth was about 20%. Genistein also significantly inhibited the invasion of Bel 7402 cells into the renal parenchyma of nude mice
with xenograft transplant. The positive unit value of microvessels in genistein-treated group (10.422 ± 0.807) was significantly lower than that in control group (22.330 ± 5.696, P < 0.01).
CONCLUSION: Genistein can effectively inhibit the invasive potential of Bel 7402 HCC cells by altering cell cycle, apoptosis and angiogenesis, inhibition of focal adhesion kinase may play a significant role in this process.
© 2005 The WJG Press and Elsevier Inc. All rights reserved.
Key words: Genistein; Human hepatocellular carcinoma; Invasion; Cell cycle; Apoptosis; Angiogenesis
Gu Y, Zhu CF, Iwamoto H, Chen JS. Genistein inhibits invasive potential of human hepatocellular carcinoma by altering cell cycle, apoptosis, and angiogenesis. World J Gastroenterol 2005; 11(41): 6512-6517http://www.wjgnet.com/1007-9327/11/6512.asp
INTRODUCTIONGenistein (5,7,4’-trihydroxyisoflavone), an isoflavinoid in soy beans, has been identified as a potential cause for the low incidence of certain types of tumor such as breast cancer, gastric cancer, colon cancer, prostate cancer, etc.[1-4]. As a natural tyrosine kinase inhibitor[5-7], genistein can suppress the formation and development of these tumors [8-11]. However, only limited data are available to demonstrate the effects of genistein on human HCC. The purpose of this study was to investigate the invasive potential and apoptotic effects of genistein in vitro and in vivo on HCC cells and to gain insights regarding the underlying mechanism mediating the effects of genistein.
MATERIALS AND METHODSCell culture and genisteinThe human HCC cell line, Bel 7402, was obtained from Cancer Institute of Sun Yat-Sen University in Guangzhou. The cel ls were maintained in RPMI 1640 medium supplemented with 10% fetal bovine serum (FBS), penicillin (100 U/mL), and streptomycin (100 μg/mL) and cultured at 37 °C in a humidified atmosphere containing 50 mL/L CO2 in air. Genistein purchased from Sigma

Chemical Co. was suspended in dimethylsulfoxide (DMSO) for the experiments.
In vitro assays of Bel 7402 cell growth and viabilityThe cells were seeded at the density of 1×10⁴ cells with 1mLof medium/well onto 24 plates and incubated with or without genistein for 6 d. On the indicated day thereafter, cells were trypsinized and the number of cells was scored. An equivalent volume of DMSO was added to control cultures.
Cel l viabi l i ty was assayed using methyl thiazol tetrazolium (MTT) method. A 96-well plate was incubated with exponentially growing cells at the density of 1×10⁴/well, following incubation of Bel 7402 cells with or without genistein in different columns of 96-well microtiter plates on d 1, 3, 5, and 7, MTT was added to each well and incubated at 37 °C for further 4 h before 595 nm absorbance (A595nm) was detected. Each assay was performed in quadruplicate.
Inhibitory rate of tumor cell growth = (average A595 nm value of control group-average A595 nm value of genistein group)/average A595 nm value of control group[12].
In vitro assays of Bel 7402 cell adhesion and invasionNinety-six-well microtiter plates were precoated with20 mg/L fibronectin and incubated at 4 °C overnight. Wells were blocked with 2% BSA for 45 min at 37 °C. The cells were cultured in 2% serum-containing medium for 24 h, harvested at about 70% confluency, resuspended in serum-free RPMI 1640 medium supplemented with 0.1% BSA and distributed to wells (8×10⁴/well). The cells were incubated at 37 °C in a 50 mL/L CO2 atmosphere for 20, 40, 60, and 90 min with or without genistein. The wells were washed thrice with PBS to remove unattached cells, then the attached cells were incubated with MTT and the absorbance was measured at 595 nm. Each assay was performed in triplicate.
Adhesion rate = average A595 nm value of genistein group/average A595 nm value of control group×100%.
Inhibitory rate of adhesion = (average A595 nm value of control group-average A595 nm value of genistein group)/average A595 nm value of control group×100%.
The invasive activity of Bel 7402 cells was assayed in transwell cell chambers (Corning Inc., USA), according to the method reported by Kido et al[13]. The basement membrane Matrigel was obtained from the Department of Cell Biology, Peking University Health Science Center. Polyvinylpyrrolidone-free polycarbonate filters with an 8.0-μm pore size were precoated with 5 μg of fibronectin in a volume of 50 μL on the lower surface. The Matrigel was diluted to 100 μg/mL with cold PBS and applied to the upper surface of the filters (5 μg/filter), and dried overnight under a hood at room temperature. The coated filters were washed extensively in PBS, and then dried immediately before use. Log-phase cell cultures of Bel 7402 cells were harvested and washed thrice with serum-free RPMI 1640, and resuspended to a final concentration of 2×10⁶/mL in RPMI 1640 with 0.1% BSA. Cell suspensions (100 μL) with or without genistein were added
to the upper compartment and incubated for 10-20 h at37°C in a 50 mL/L CO2 atmosphere. The filters were fixed with methanol and stained with Giemsa. The cells on the upper surface of the filters were removed by wiping with cotton swabs. The cells invading the lower surface of the filter through Matrigel and filter were manually counted under a microscope at a magnification of ×400, and each assay was performed in triplicate.
Invasion rate = average cell numbers invading the lower surface of the filter in genistein group/average cell numbers invading the lower surface of the filter in control group×100%.
Inhibitory rate of invasion=(average cell numbers invading the lower surface of the filter in control group-average cell numbers invading the lower surface of the filter in genistein group)/average cell numbers invading the lower surface of the filter in control group×100%.
Cell cycle analysisBel 7402 cells were seeded at the density of 5×10⁵/well in six-dishes. After 24 h, the cells were treated with or without genistein for 72 h and harvested by trypsinization. The cells were then centrifuged at 300 r/min for 10 min, washed in PBS, and resuspended in cold 70% ethanol. The cells were then subjected to flow cytometric analysis on a FACScan cytofluorimeter (Becton Dickinson) after propidium iodide labeling.
Detection of focal adhesion kinase expression by flow cytometry assayOn d 3 of cell culture, control and genistein-treated Bel 7402 cells were centrifuged at 300 r/min for 10 min,washed and fixed in 1 mL 70% ethanol at 4 °C, treated wi th 0 .1% Tr i ton X-100 and 1% FBS, and ant i -focal adhesion kinase (FAK C-20 sc-558, Santa Cruz Biotechnology, Inc., USA) and IgG1 (1∶100) were added. Cells were then treated with RNAse (1 mg/mL, Sigma, USA) and propidium iodide (10 μg/mL) for 30 min at room temperature. FAK expression was measured using a FACScan cytofluorimeter (Becton Dickinson).
Terminal deoxynucleotidyl transferase-mediated dUTP nick end-labeling (TUNEL) assayControl cells and genistein-treated cells were harvested at 72 h by trypsinization and collected by centrifugation. Cells were washed twice in PBS-0.1% bovine serum albumin and prepared for TUNEL assay. Cells were fixed for 30 min in 4% paraformaldehyde, washed twice in PBS, and then permeabilized in 0.1% Triton-X 100 and 0.1% sodium citrate. Cells were labeled with terminal deoxynucleotidyl transferase for 60 min at 37 °C in a dark humidified incubator. The samples were washed twice, resuspended in 500 μL of PBS, and then analyzed on a FACScan cytofluorimeter (Becton Dickinson).
In vivo experimentsSix-week-old male BALB/C nu/nu mice were obtained from the Medical Laboratory Animal Center, Sun Yat-Sen University, China. They were kept under sterile conditions
Gu Y. Inhibitory edect of genistein on human HCC 6513

was 26.71% ± 10.2% and 42.64 ± 16.1%, respectively. The inhibitory rate of tumor cell growth in 10 μg/mL genistein group was significantly higher than that in 5 μg/mL genistein group (P<0.01). The dose-dependent effects of genistein on Bel 7402 cell growth are presented in Figure 1.
Figure 1 Effects of genistein on Bel 7402 cell proliferation In vitro effects of genistein on adhesion and invasion of Bel 7402 cells.
The adhesion rate of Bel 7402 cells for 20, 40, 60, and 90 min was 30.61%, 56.48%, 61.89% and 81.55% in 5 μg/mL genistein group, and 17.78%, 15.82%, 42.98% and 64.48% in 10 μg/mL genistein group. The inhibitory rate of Bel 7402 cells for 20, 40, 60, and 90 min was 69.39%, 43.52%, 38.11%, and 18.45% in 5 μg/mL genistein group, and 82.22%, 84.18%, 57.02%, and 35.52% in 10 μg/mL genistein group. Our results showed that genistein could inhibit tumor cell adhesion to fibronectin-coated substrates in a concentration-dependent fashion, and more potent inhibitory effect of genistein on adhesion occurred within 40 min.
We also investigated the capability of metastatic tumor cells through reconstituted basement membrane Matrigel. The cells invading the lower surface of the filter through Matrigel in control group, 5 μg/mL genistein group, and 10 μg/mL genistein group were 243.7±12.6/filed, 216.7±21.3/filed, and 174.5±9.6/filed, respectively. The invasion rate in 5 and 10 μg/mL genistein group was 88% and 71%, respectively, the inhibitory rate of invasion was 11% and 28%, respectively. Our results showed that genistein could inhibit the in vitro invasion of Bel 7402 cells, the inhibitory effect on invasion of Bel 7402 cells in 10 μg/mL genistein group was more significant than that in 5 μg/mL genistein group (P<0.05).
In vitro effects of genistein on cell cycle progression Bel 7402 cells treated with genistein in the G0/G1 and G2/M phases increased significantly than cells in control group, the increase of cells in G0/G1 and G2/M phases was more remarkable in 10 μg/mL genistein group than in 5 μg/mL genistein group (P<0.05). S fractions decreased significantly in cells treated with genistein (P<0.05). Percentage of apoptotic cells in genistein-treated
in autoclaved cages with filter bonnets in laminar flow units and fed with sterilized MF pellets and distilled water. The mice were maintained in accordance with institutional accredited guidelines.
Bel 7402 cells were grown to 80-90% of confluence and detached with 0.25% trypsin. The cells were washed twice, counted, and resuspended in PBS at 1×10⁷/mL (viability over 95%). Cells (0.3 mL) were injected into the male nude mice. Each animal received two injections, one on each side of the neck. Animals were killed 3 wk after tumor inoculation, when the largest tumors reached about 10 mm in diameter. Surgical excision of primary tumor was carried out, and tumor tissues were cut into 1-mm3 pieces for bilateral subrenal capsule xenograft transplantation in next 10 nude mice anesthetized with chloral hydrate. The xenograft volume was assessed and calculated by the formula: length×width×depth×0.5236.
Mice bearing subrenal capsule xenograft transplant were randomly selected for the treatment with genistein (n = 5) and those without genistein treatment served as control (n = 5). Genistein (50 mg/kg) was administered ip daily to each mouse in genistein group for 15 d, while control animals were given the same vehicle. The animals were killed by cervical dislocation 16 d after transplantation of the tissues. Autopsies were performed and the kidney was excised, fixed, and embedded in paraffin, and examined histologically. The inhibitory rate of transplant growth was calculated by comparing the changes in xenograft transplant volume[15,16]. The criteria for invasive capacity of tumor cells in subrenal capsule xenograft transplant were as previously described[14,16,17].
Immunohistochemical determination of angiogenesisAfter deparaffinization, dehydration, and washing, sections from xenograft transplant were incubated with trypsin at 37 °C for 30 min, quenched with 0.3% H2O2-methanol for 30 min, and blocked with 10% normal goat serum in a buffer containing 100 mL of PBS, 1.0 g of BSA, and 0.1 mL of Tween-20. The sections were treated with a rabbit polyclonal antibody against human factor VIII-related antigen at a 1∶100 dilution with the PBS-BSA-Tween-20 buffer, followed by a biotinylated universal antibody at a 1∶100 dilution. The sections were then treated with avidin-biotin complex followed by 3,3-diaminobenzidine as a substrate for staining. Positive unit (PU) of the microvessels with staining was tested and calculated according to the method described by Shen[17].
Statistical analysisThe statistical significance of difference between the groups was determined by applying the one-way ANOVA and χ2 using the Stata 6.0 program.
RESULTSIn vitro effects of genistein on Bel 7402 cell growthGenistein significantly inhibited Bel 7402 cell growth over the 7 d of experiment. The inhibitory rate of tumor cell growth in 5 and 10 μg/mL genistein groups
Cell
num
bers
(×
1000
0)
35
30
25
20
15
10
5
00 1 2 3 4 5 6
Time (d)
Control group
Genistein 5μ g/mL
Genstein 10μg/mL
6514 ISSN 1007-9327 CN 14-1219/ R World J Gastroenterol November 7, 2005 Volume 11 Number 28

group increased significantly compared to that in control group (P<0.05). The results of cell cycle analysis by flow cytometry in Bel 7402 cells are presented in Table 1.
Cell cycle phase
Treatment Apoptosis (%) G0/G1 (%) G2/M (%) S (%)
Control 64.58 ± 8.46 0.78 ± 0.02 34.64 ± 1.36 0.47 ± 0.01
Genistein 5 μg/mL 71.74 ± 4.46 2.75 ± 0.03b 25.50 ± 2.28b 1.02 ± 0.06a
Genistein 10 μg/mL 75.27 ± 6.12ac 6.37 ± 0.08d 18.36 ± 1.53b 2.12 ± 0.12b
aP < 0.05 vs control; bP < 0.01 vs control; cP < 0.05 vs 5 μg/mL genistein; dP < 0.01 vs control and 5 μg/mL genistein.
Effects of genistein on induction of apoptosis of Bel 7402 cellsTUNEL assay in our studies showed that the percentage of cells undergoing apoptosis was significantly higher in 10 μg/mL genistein group (1.05 ± 0.09%) and 5 μg/mL genistein group (0.80 ± 0.12%) than in control group (0.43 ± 0.08%, P < 0.01 and P < 0.05, respectively) being consistent with genistein’s ability to induce apoptosis observed in cell cycle analysis.
Evaluation of expression of p125FAK proteinWe investigated whether genistein could modulate protein expression of the signal transduction molecule-p125FAK. After 72-h treatment with genistein, p125FAK expression in 10 μg/mL genistein group (12.89 ± 0.36)% was significantly lower than that in control group (19.75% ± 1.12%, P < 0.05). p125FAK expression in 5 μg/mL genistein group (15.26 ± 0.16)% also decreased, but there was no statistically significant difference between 5 μg/mL genistein group and control group (P > 0.05).
Effects of genistein on growth of subrenal capsule xenograft transplantThe anti-tumor activity of genistein was evaluated in nude mice bearing subrenal capsule xenograft transplant. Treatment with genistein inhibited the local tumor growth significantly compared to the control group. At the end of the treatment (15 d post implantation), the increase of tumor volume in genistein group (63.32±8.96 mm3) was significantly less than that in control group (79.25±6.85 mm3, P<0.05). Tumors in mice treated with genistein reduced in volume by 20% compared to the control group.
Effects of genistein on in vivo tumor invasionThe criteria for invasive capacity of tumor cells in subrenal capsule xenograft transplant were as previously described[17]. The 0-IV invasion rank to renal parenchyma was recorded[14,16]. In the control group, invasion rank 0 was observed in 1 of 10 mice (1/10), invasion rank I in 8 of 10 mice (8/10), and invasion rank II in 1 of 10 mice (1/10). In genistein-treated group, invasion rank 0 was
observed in 8/10, rank I in 2/10 and rank II in 0/10 mice. No rank III or rank IV invasion was observed in both groups. Our results showed that treatment with genistein could significantly inhibit the invasion of Bel 7402 cells to the renal parenchyma (P<0.05). Hematoxylin-eosin stained specimens are shown in Figure 2.
Figure 2 Tumor invasion of renal parenchyma in control (A) and genistein-treated nude mice (B). HE, magnification ×200.
Effects of genistein on tumor angiogenesisIn untreated tumor tissues, tumor cells were arranged in large nests with plenty of blood sinusoids. Whereas, in genistein-treated tumor tissue, tumor cells were characterized by small cancerous nests with scanty blood vessels. PU value of microvessels in the subrenal capsule xenograft transplant, as a marker of tumor angiogenesis, significantly decreased in genistein group (10.422±0.807) compared to that in control group (22.330±5.696, P<0.01). Immunohistochemical staining for the determination of angiogenesis in subrenal capsule xenograft transplant of the nude mice is shown in Figure 3.
Figure 3 Tumor tissue with plenty of blood vessels (A) and scanty blood vessels (B) in control and genistein-treated nude mice. HE, magnification ×200.
DISCUSSIONInvasion and metastasis are the most devastating aspects of cancer. Advances in surgical techniques and adjuvant therapies have been proved to be useful in the treatment of primary tumors[18]. However, invasion and metastasis remain a major cause of poor prognosis and death in cancer patients. Reports from epidemiological and experimental studies indicate that genistein plays an important role in the prevention and inhibition of tumors such as breast cancer, prostate cancer, colon cancer, leukemia, melanoma, etc.[19]. However, there are still a few reports of studies on the correlation between genistein and the invasion and metastasis of human HCC. Our data provide evidence that genistein can also inhibit HCC cell proliferation and invasion.
In this report, we haveshould for the first time that genistein could significantly inhibit the growth and
A B
A B
Table 1 Effects of genistein on cell cycle progression in Bel 7402 cell line (mean±SD)
Gu Y et al. Inhibitory ffect of genistein on human HCC 6515

viability of Bel 7402 cells. The inhibitory rate of tumor cell growth was about 26%-42%. We also found that genistein induced cell cycle arrest in the G0/G1 and G2/M phases. These findings are in agreement with other reports[19-24]. Although the exact mechanisms of genistein await further elucidation, induction of apoptosis may be partly responsible[25-27]. In our studies with TUNEL assay, the percentage of Bel 7402 cells undergoing apoptosis was significantly higher in genistein group than in control group, which is consistent with those found in other studies[28,29].
The adhesion and invasiveness of tumor cells represent some important properties necessary for the formation of metastases. We investigated the effect of genistein on the adhesive properties of Bel 7402 cells, and found that genistein could inhibit tumor cell adhesion to fibronectin-coated substrates, the most potent inhibitory effect of genistein on adhesion occurred within 40 min, demonstrating that reduction in cell adhesion after the treatment with genistein may account for the ability of Bel 7402 cells to transgress normal tissue boundaries and disperse to the adjacent sites. The invasion assay both in vitro and in vivo was further performed in our experiments. Bel 7402 cells invading the lower surface of the filter through Matrigel was significantly inhibited in genistein-treated groups compared to control group. Our experiments with the subrenal capsule xenograft transplant of nude mice showed that the treatment with genistein could significantly inhibit the invasion of Bel 7402 cells to the renal parenchyma, which was correlated with the biological behavior in vitro.
Inhibition of angiogenesis was observed in our studies. Angiogenesis is virtually absent in the healthy adult organism and is restricted to a few conditions including wound healing, placenta, endometrium, etc., representing the ordered and self-limited processes[30,31]. In certain pathological conditions, angiogenesis is dramatically enhanced and is no longer self-limited[30]. The most important manifestation of pathological angiogenesis is induced by solid tumors[32]. In our immunohistochemical studies, tumor cells were characterized by small cancerous nests with scanty blood vessels in genistein-treated mice. The PU value of microvessels was significantly decreased in genistein group compared to the control group. As angiogenesis is an important step in the invasion and metastasis process of tumors[33,34], the changes in angiogenesis caused by genistein may play a crucial role in inhibition of the invasiveness of Bel 7402 cells.
FAK is a cytoplasmic tyrosine kinase that plays an important role in integrin-mediated signal transduction pathways closely related to cell adhesion, motility, and growth[35-39]. Upregulation of FAK expression is associated with oncogenesis[40-43] and decrease in FAK is associated with the loss of ability to attach, decreased migration and induction of apoptosis[44-48]. We have reported that FAK is overexpressed in HCC, the expression of FAK in invasive or metastatic HCC is significantly higher than that in non-invasive or non-metastatic HCC[16]. Therefore, FAK seems to be an important pharmacologic target site[49]. In the
present study, a significant downregulation of p125FAK after genistein treatment was observed, suggesting that genistein may serve as a potential important anticancer agent for HCC progression by blocking the FAK signaling process, which play a crucial role in angiogenesis and apoptosis. In summary, our results provide the preliminary evidence that genistein is an effective chemopreventive agent for HCC. Further in-depth studies coupled with clinical trials are needed to establish the scientific basis for the use of genistein in the prevention and treatment of HCC.
REFERENCES1 P a r k O J , S u r h Y J . C h e m o p r e v e n t i v e p o t e n t i a l o f
epigallocatechin gallate and genistein: evidence from epidemiological and laboratory studies. Toxicol Lett 2004; 150: 43-56
2 Magee PJ, Rowland IR. Phyto-oestrogens, their mechanism of action: current evidence for a role in breast and prostate cancer. Br J Nutr 2004; 91: 513-531
3 Sarkar FH, Li Y. Soy isoflavones and cancer prevention. Cancer Invest 2003; 21: 744-757
4 Sarkar FH, Li Y. Mechanisms of cancer chemoprevention by soy isoflavone genistein. Cancer Metastasis Rev 2002; 21: 265-280
5 Adlercreutz CH, Goldin BR, Gorbach SL, Höckerstedt KA, Watanabe S, Hämäläinen EK, Markkanen MH, Mäkelä TH, Wähälä KT, Adlercreutz T. Soybean phytoestrogen intake and cancer risk. J Nutr 1995: s757-s770
6 Spinozzi F, Pagliacci MC, Migliorati G, Moraca R, Grignani F, Riccardi C, Nicoletti I. The natural tyrosine kinase inhibitor genistein produces cell cycle arrest and apoptosis in Jurkat T-leukemia cells. Leukemia Res 1994; 18: 431-439
7 Liu XJ, Yang L, Mao YQ, Wang Q, Huang MH, Wang YP, Wu HB. Effects of the tyrosine protein kinase inhibitor genistein on the proliferation, activation of cultured rat hepatic stellate cells. World J Gastroenterol 2002; 8: 739-745
8 Burke TR, Yao ZJ, Liu DG, Voigt J, Gao Y. Phosphoryltyrosyl mimetics in the design of peptide-based signal transduction inhibitors. Biopolymers 2001; 60: 32-44
9 Suthar AC, Banavalikar MM, Biyani MK. Pharmacological activities of Genistein, an isoflavone from soy. Indian J Exp Biol 2001; 39: 511-519
10 Dixon RA, Ferreira D. Genistein. Phytochemistry 2002; 60: 205-211
11 Schweigerer L, Christeleit K, Fleischmann G, Adlercreutz H, Wähälä K, Hase T, Schwab M, Ludwig R, Fotsis T. Identification in human urine of a natural growth inhibitor for cells derived from solid paediatric tumours. Eur J Clin Invest 1992; 22: 260-264
12 Gu Y, Chen JS, Zhou XD. Inhibitory effects of antisense focal adhesion kinase oligodeoxynucleotides on the invasion of Bel 7402 hepatocellular carcinoma cells. Zhonghua Ganzangbin Zazhi 2003, 10: 612-615
13 Kido A, Krueger S, Haeckel C, Roessner A. Inhibitory effect of antisense aminopeptidase N (APN/CD13) cDNA transfection on the invasive potential of osteosarcoma cells. Clin Exp Metastasis 2003; 20: 585-592
14 Wang JJ, Gao Y, XU Q. Progress of mechanism, diagnosis and treatment of tumor metastasis. 1st. Shanghai: Second Military Medical Press , 2002: 217
15 Gu Y, Hao QJ, Chen JS, Zhou XD,Gao JS. Effects of antisense FAK ODN transfection on xenograft hepatocellular carcinoma in nude mice. Zhonghua Shiyan Waike Zazhi 2003; 20: 616-618
16 Gu Y, Chen JS, Zhou XD,Gao JS. Overexpression of focal
6516 ISSN 1007-9327 CN 14-1219/ R World J Gastroenterol November 7, 2005 Volume 11 Number 28

adhesion kinase (FAK) and its relationship with the invasion and metastasis of human hepatocellular carcinoma. Zhonghua Shiyan Waike Zazhi 2003; 20: 4-5
17 S h e n H . S t u d y o n t h e q u a n t i t a t i v e m e t h o d o f immuneohistochemistry (III). Zhongguo Zuzhi Huaxue Yu Xibao Huaxue Zazhi 1995; 4: 89-92
18 Entschladen F, Drell TL, Lang K, Joseph J, Zaenker KS. Tumour-cell migration, invasion, and metastasis: navigation by neurotransmitters. Lancet Oncol 2004; 5: 254-258
19 Powis G, Hill SR, Frew TJ, Sherrill KW. Inhibitors of phospholipid intracellular signaling as antiproliferative agents. Med Res Rev 1995; 15: 121-138
20 Toi M, Mukaida H, Wada T, Hirabayashi N, Toge T, Hori T, Umezawa K. Antineoplastic effect of erbstatin on human mammary and esophageal tumors in athymic nude mice. Eur J Cancer 1990; 26: 722-724
21 Constantinou A, Kiguchi K, Huberman E. Induction of differentiation and DNA strand breakage in human HL-60 and K-562 leukemia cells by genistein. Cancer Res 1990; 50: 2618-2624
22 Yamashita Y, Kawada S, Nakano H. Induction of mammalian topoisomerase II dependent DNA cleavage by nonintercalative flavonoids, genistein and orobol. Biochem Pharmacol 1990; 39: 737-744
23 Alhasan SA, Pietrasczkiwicz H, Alonso MD, Ensley J, Sarkar FH. Genistein-induced cell cycle arrest and apoptosis in a head and neck squamous cell carcinoma cell line. Nutr Cancer 1999; 34: 12-19
24 Li Y, Upadhyay S, Bhuiyan M, Sarkar FH. Induction of apoptosis in breast cancer cells MDA-MB-231 by genistein. Oncogene 1999; 18: 3166-3172
25 Yanagihara K, Ito A, Toge T, Numoto M. Antiproliferative effects of isoflavones on human cancer cell lines established from the gastrointestinal tract. Cancer Res 1993; 53: 5815-5821
26 Pagliacci MC, Smacchia M, Migliorati G, Grignani F, Riccardi C, Nicoletti I. Growth-inhibitory effects of the natural phyto-oestrogen genistein in MCF-7 human breast cancer cells. Eur J Cancer 1994; 30: 1675-1682
27 Yousefi S, Blaser K, Simon HU. Activation of signaling pathways and prevention of apoptosis by cytokines in eosinophils. Int Arch Allergy Immunol 1997; 112: 9-12
28 Matsukawa Y, Marui N, Sakai T, Satomi Y, Yoshida M, Matsumoto K, Nishino H, Aoike A. Genistein arrests cell cycle progression at G2-M. Cancer Res 1993; 53: 1328-1331
29 Kyle E, Neckers L, Takimoto C, Curt G, Bergan R. Genistein induced apoptosis of prostate cancer cells is preceded by a specific decrease in focal adhesion kinase activity. Mol Pharmacol 1997; 51: 193-200
30 Denekamp J. Vascular attack as a therapeutic strategy for cancer. Cancer Metastasis Rev 1990; 9: 267-282
31 Kreuter M, Bielenberg D, Hida Y, Hida K, Klagsbrun M. Role of neuropilins and semaphorins in angiogenesis and cancer. Ann Hematol 2002; 81 Suppl 2: S74
32 Folkman J. Tumor angiogenesis. Adv Cancer Res 1985; 43: 175-203
33 Fotsis T, Pepper MS, Aktas E, Breit S, Rasku S, Adlercreutz H, Wahala K, Montesano R, Schweigerer L. Flavonoids,
dietary-derived inhibitors of cell proliferation and in vitro angiogenesis. Cancer Res 1997; 57: 2916-2921
34 Fotsis T, Pepper M, Adlercreutz H, Hase T, Montesano R, Schweigerer L. Genistein, a dietary-ingested isoflavonoid, inhibits cell proliferation and in vitro angiogenesis. J Nutr 1995; 125: 790S-797S
35 Hynes RO. Integrins: versatility, modulation, and signaling in cell adhesion. Cell 1992; 69: 11-25
36 Weimar IS, de Jong D, Muller EJ, Nakamura T, van Gorp JM, de Gast GC, Gerritsen WR. Hepatocyte growth factor/scatter factor promotes adhesion of lymphoma cells to extracellular matrix molecules via alpha 4 beta 1 and alpha 5 beta 1 integrins. Blood 1997; 89: 990-1000
37 Hedin U, Thyberg J, Roy J, Dumitrescu A, Tran PK. Role of tyrosine kinases in extracellular matrix-mediated modulation of arterial smooth muscle cell phenotype. Arterioscler Thromb Vasc Biol 1997; 17: 1977-1984
38 Schlaepfer DD, Hauck CR, Sieg DJ. Signaling through focal adhesion kinase. Prog Biophys Mol Biol 1999; 71: 435-478
39 Schaller MD, Borgman CA, Cobb BS, Vines RR, Reynolds AB, Parsons JT. pp125FAK a structurally distinctive protein-tyrosine kinase associated with focal adhesions. Proc Natl Acad Sci U S A 1992; 89: 5192-5196
40 Hill TD, Dean NM, Mordan LJ, Lau AF, Kanemitsu MY, Boynton AL. PDGF-induced activation of phospholipase C is not required for induction of DNA synthesis. Science 1990; 248: 1660-1663
41 Hollenberg MD. Tyros ine k inase -media ted s igna l transduction pathways and the actions of polypeptide growth factors and G-protein-coupled agonists in smooth muscle. Mol Cell Biochem 1995; 149-150: 77-85
42 Bergan R, Kyle E, Nguyen P, Trepel J, Ingui C, Neckers L. Genistein-stimulated adherence of focal adhesion kinase to beta-1-integrin. Clin Exp Metastasis 1996; 14: 389-398
43 Agochiya M, Brunton VG, Owens DW, Parkinson EK, Paraskeva C, Keith WN, Frame MC. Increased dosage and amplification of the focal adhesion kinase gene in human cancer cells. Oncogene 1999; 18: 5646-5653
44 Fotsis T, Pepper M, Adlercreutz H, Fleischmann G, Hase T, Montesano R, Schweigerer L. Genistein, a dietary derived inhibitor of in vitro angiogenesis. Proc Natl Acad Sci USA 1993; 90: 2690-2694
45 Ogawara H, Akiyama T, Watanabe S, Ito N, Kobori M, Seoda Y. Inhibition of tyrosine protein kinase activity by synthetic isoflavones and flavones. J Antibiot (Tokyo) 1989; 42: 340-343
46 Xu LH, Owens LV, Sturge GC, Yang X, Liu ET, Craven RJ, Cance WG.. Attenuation of the expression of the focal adhesion kinase induces apoptosis in tumor cells. Cell Growth Differ 1996; 7: 413-418
47 Hunter T. The proteins of oncogenes. Sci Am 1984; 251: 70-79 48 Peterson G. Evaluation of the biochemical targets of genistein
in tumor cells. J Nutr 1995; 125: 784S-789S 49 Perandones CE, Illera VA, Peckham D, Stunz LL, Ashman RF.
Regulation of apoptosis in vitro in mature murine spleen T cells. J Immunol 1993; 151: 3521-3529
Science Editor Wang XL and Guo SY Language Editor Elsevier
Gu Y et al. Inhibitory ffect of genistein on human HCC 6517

PO Box 2345, Beijing 100023, China World J Gastroenterol 2005;11(41):6518-6520www.wjgnet.com World Journal of Gastroenterology ISSN [email protected] © 2005 The WJG Press and Elsevier Inc. All rights reserved.E L S E V I E R
• ������ ������������� •������ ������������� • •
Effects of Helicobacter pylori eradication on atrophic gastritis and intestinal metaplasia: A 3-year follow-up study
Bin Lu, Ming-Tao Chen, Yi-Hong Fan, Yan Liu, Li-Na Meng, Department of Gastroenterology, Affiliated Hospital of Zhejiang Traditional Chinese Medicine College, Hangzhou 310006, Zhejiang Province, ChinaSupported by the Scientific Research Fund of the Health Bureau of Zhejiang Province, No. 2001QN012Correspondence to: Dr. Bin Lu, Department of Gastroenterology, Affiliated Hospital of Zhejiang Traditional Chinese Medicine College, Hangzhou 310006, Zhejiang Province China. [email protected]: +86-571-87032028 Fax: +86-571-87077785Received: 2004-12-28 Accepted: 2005-03-24
AbstractA I M : To i n v e s t i g a t e t h e e f f e c t o f H p y l o r i eradicat ion on atrophic gastr i t is and intest inal metaplasia (IM).
METHODS: Two hundred and fifty-nine patients with atrophic gastritis in the antrum were included in the study, 154 patients were selected for H pylori eradication therapy and the remaining 105 patients served as untreated group. Gastroscopy and biopsies were performed both at the beginning and at the end of a 3-year follow-up study. Gastritis was graded according to the updated Sydney system.
RESULTS: One hundred and seventy-nine patients completed the follow-up, 92 of them received H pylori eradication therapy and the remaining 87 H pylori -infected patients were in the untreated group. Chronic gastritis, active gastritis and the grade of atrophy significantly decreased in H pylori eradication group (P<0.01). However, the grade of IM increased in H pylori -infected group (P<0.05).
CONCLUSION: H pylori eradication may improve gastric mucosal inflammation, atrophy and prevent the progression of IM.
©2005 The WJG Press and Elsevier Inc. All rights reserved.
Key words: H pylori ; Atrophic gastritis; Intestinal metaplasia
Lu B, Chen MT, Fan YH, Liu Y, Meng LN. Effects of H pylori eradication on atrophic gastritis and intestinal metaplasia: A 3-year follow-up study. World J Gastroenterol 2005; 11(41): 6518-6520http://www.wjgnet.com/1007-9327/11/6518.asp
INTRODUCTIONH pylori-infected gastric mucosa evolves through stages of chronic gastritis, glandular atrophy (GA) and intestinal metaplasia (IM) which is a main cause of intestinal type of gastric adenocarcinoma. H pylori infection induces gastric epicyte apoptosis. The index of apoptosis and proliferation decrease after H pylori eradication[1,2]. H pylori eradication can prevent gastric cancer. Whether the precancerous lesions are reversed or terminated after H pylori eradication is crucial to evaluate this therapy for a preventive purpose. To investigate the histological changes in the gastric mucosa, we followed up chronic atrophic gastritis patients who received H pylori eradication therapy for 3 years.
MATERIALS AND METHODSA total of 259 H pylori-infected patients, who were diagnosed as having antral atrophic gastritis (without organic gastropathy, e.g., ulcer, tumor, etc.) by gastroscopy and biopsy in our hospital during 1997 to 1999, were followed up in our study; 154 of them received H pylori eradication therapy and the remaining 105 did not receive H pylori eradication therapy. Patients who failed to respond to H pylori eradication therapy and had uncertain H pylori infection were excluded. Patients who did not return for re-evaluation or became H pylori negative without receiving H pylori eradication therapy were also excluded. A total of 179 patients including 82 men and 97 women aged 30-74 years (92 in the H pylori eradicated group and 87 in the control group) completed the 3-year follow-up study.
All the subjects underwent gastroscopy when they entered the study and fulfilled the 3-year follow-up; some patients underwent gastroscopy every year. During gastroscopy, 3 antral biopsy specimens (from the greater and lesser curvatures 2-3 cm from the pylorus) were taken. One antral biopsy specimen was submitted to rapid urease test (RUT) and the other two were cut into sections for histological examination.
The patients were confirmed to have H pylori infection only when both RUT and histological stain (modified Giemsa stain) produced positive results. Otherwise they were considered as non-H pylori-infected healthy volunteers. Uncertain cases that were positive in one test and negative in the other test should be excluded. After they were treated for more than 4 wk, H pylori status was determined by 14C-urea breath test.
Biopsy specimens were stained with H&E. A single pathologist, who was unaware of the conditions of the patients and assigned treatment of biopsies, performed
Bin Lu, Ming-Tao Chen, Yi-Hong Fan, Yan Liu, Li-Na Meng

the histological assessment. The gastritis was graded using the visual analog scales of the updated Sydney system[3] as none (0), mild (1), moderate (2), or marked (3). Histological grading of the same subject before and 3 years after the therapy was compared and classified as improvement, no improvement, or exacerbation.
To e rad i ca te H py l o r i i n fec t ion , the pa t i en t s received omeprazole (20 mg) or lansoprazole (30 mg), clarithromycin (500 mg), amoxicillin (1 g) or furazolidone (0.1 g), twice daily for 1 wk. During the whole follow-up period, two group patients received expectant treatment.
Statistical analysisThe results of histology score were expressed as mean .The differences between the two groups before treatment with respect to histological grades were calculated using Mann-Whitney U test. Changes in histological grading in H pylori eradication and control groups before and 3 years after the treatment were compared by Stuart-Maxwell test. Differences in the proportions of histological grading with improvement, no improvement and exacerbation between two groups were made using the χ2 test. P < 0.05 was considered statistically significant (two-sided).
RESULTSThe H pylori eradicated group and control group were comparable in age and sex ratio (P>0.05). At entry into the study, the percentage of mild and moderate GA was 75% in H pylori-eradiated group and 25% in control group. The percentage of mild, moderate and marked GA was 77%, 21.8% and 1.2%, respectively. IM was 51% in H pylori-eradicated group and 58.6% in control group.
Active (AI) and chronic inflammation (CI) were found in both groups. Overall, the pretreatment histological scores were comparable in two treatment groups (Table 1).
Histological scores in paired samples before and after 3-year treatment in two groups are shown in Table 2.
After cure of infection, scoring of CI, AI and GA decreased significantly (P < 0.01) and that of IM increased slightly with no significant difference (P > 0.05). In control group, scoring of IM increased significantly (P < 0.05), but that of other pathologic changes had no statistical significance (P > 0.05).
The histological changes in paired samples before and after 3-year treatment in H pylori-eradicated group and control group are shown in Figure 1. CI and AI were improved by 38.04% and 63.04% in H pylori-eradicated
Table 1 Histological scores at entry of study in H pylori-eradicated group and control group (mean±SD)
H pylori-eradicated group (n = 92) Control group (n = 87)
Chronic inflammation 1.95 ± 0.40 1.97 ± 0.32Active inflammation 1.84 ± 0.41 1.90 ± 0.40Glandular atrophy 1.25 ± 0.44 1.24 ± 0.46Intestinal metaplasia 0.64 ± 0.76 0.63 ± 0.57
Table 2 Histological scores at baseline and 3 yr after treatment (mean±SD)
H pylori-eradicated group (n = 92) Control group (n = 87)
Baseline 3-yr Baseline 3-yr
Chronic inflammation 1.95 ± 0.40 1.56 ± 0.53b 1.97 ± 0.32 1.91 ± 0.47Active inflammation 1.84 ± 0.41 0.39 ± 0.19d 1.90 ± 0.40 1.78 ± 0.44Glandular atrophy 1.25 ± 0.44 0.97 ± 0.83b 1.24 ± 0.46 1.19 ± 0.82Intestinal metaplasia 0.64 ± 0.76 0.73 ± 0.77 0.63 ± 0.57 0.83 ± 0.87a
aP < 0.05, bP < 0.01, dP < 0.001 vs baseline
group, but only by 17.24% and 21.84% in the control group (P < 0.01). The GA was improved by 28.26% in the treatment group and 14.94% in the control group. GA was exacerbated by 4.35% in treatment group and 4.6% in control group (P > 0.05). IM was improved by 23.91% and exacerbated by 31.52% in H pylori-eradicated group, and by 20.69% and 33.33% in the control group (P > 0.05).
DISCUSSIONH pylori is one of the causative factors for gastric cancer. Its eradication may play an important role in the prevention of gastric cancer. GA and IM are pre-cancerous lesions, but data on the effects of anti-H pylori therapy on GA and IM are conflicting. Vander Hulst et al[4] reported that the severity of GA and IM does not change after treatment. Forbes et al[5]showed that no changes in GA and IM are to be found after H pylori eradication treatment.
Sung et al[6] showed that IM in the gastric antrum is slightly improved in H pylori-eradicated patients and GA in the corpus is significantly improved in H pylori- infected patients. Ohkusa et al[7]demonstrated that 89% of GA and 61% of IM are improved. Ito et al[8] have reported a marked decrease in the average grade of IM and GA after treatment. Correa et al[9]reported the proportions of GA and IM are increased significantly in H pylori-eradicated
Bin Lu et al. H pylori eradication on atrophic gastritis and intestinal metaplasia 6519
Improvement No change ExacerbationHp Control Hp- Control Hp- Control Hp- Control 0
20
40
60
80
100
CIb AId GA IM
Figure 1 Percentage changes in gastric histology 3 years after treatment in H pylori-eradicated group and control group. bP < 0.01, dP < 0.001 vs baseline. CI: chronic inflammation; AI: active inflammation; GA: glandular atrophy; IM: intestinal metaplasia; Hp-: H pylori-eradicated group; Control: the control group.
(﹪)

patients. Ruiz et al [10]showed that GA in the antrum improves significantly after H pylori eradication, but no significant change is observed by standard visual scoring method.
In our study, after a 3-year follow-up the scoring of GA decreased significantly in H pylori-eradicated group, while no significant change was found in control group (P < 0.01). The proportion of change in GA was higher in H pylori-eradicated group than in control group (28.26% vs 14.94%), but it was not statistically significant (P > 0.05). Though the GA grade in our study was mild and moderate, the results showed that eradication of H pylori was beneficial to some patients with GA in the antrum. Compared with GA, IM had no significant change after H pylori eradication. But the scoring of IM in the control group demonstrated that eradication of H pylori could prevent the further development of IM.
The reasons for these discrepancies may be due to the difference in sample size, follow-up time, histological standard, quantity and location of biopsy specimens and other gastric diseases. But the normal subjects or atrophic gastritis patients may cause deviation in statistics leading to different conclusions. Therefore, patients with different lesions (e.g., GA and IM) should be observed at different grades and at different times to demonstrate the possibility of reversal.
Whether GA and IM could be reversed is controversial, since bile reflux and other bacterial infections can also cause GA and IM. Moreover, age and dietary structure influence gastric mucosa lesions. Therefore, eradication of H pylori cannot cure all GA and IM.
Kokkola et al[11] reported that inflammation, GA and IM decrease significantly in patients with severe atrophic gastritis, including that GA and IM can be reversed by H pylori eradication. Dixon[12] considered that it is impossible to reverse GA and IM by H pylori eradication.
Our follow-up study demonstrated that gastritis activity and CI severity decreased significantly in H pylori-eradicated group but not in control group, suggesting that H pylori eradication can effectively treat gastritis. If we eradicate H pylori at the stage of gastric mucosa inflammation, the lesions can be reserved and will not develop into GA and IM. Therefore, in order to prevent gastric carcinoma, eradication of H pylori infection will be more beneficial, if the therapy is given at the early stage of lesions, i.e. before the formation of pre-cancerous lesions.
Science Editor Wang XL Language Editor Elsevier HK
6520 ISSN 1007-9327 CN 14-1219/ R World J Gastroenterol November 7, 2005 Volume 11 Number 41
REFERENCES1 Lu B, Wang HP, Xiang BK, Meng LN , Zhu LX. The effect
of Helicobacter pylori infection on gastric epithelial cell apoptosis and oncogen expression. Zhonghua Neike Zazhi 2000; 39: 255-258
2 Liu WZ , Zheng X, Dong QJ, Shi Y,Xiao SD. Effect of Helicobacter pylori infection on gastric epithelial proliferation in progression from normal mucosa to gastriccarcinoma. World J Gastroenterol 1998;4:246-248
3 Dixon MF, Genta RM, Yardley JH, Correa P. Classification and grading of gastritis. The updated Sydney System. International Workshop on the Histopathology of Gastritis, Houston 1994. Am J Surg Pathol 1996; 20: 1161-1181
4 van der Hulst RW, van der Ende A, Dekker FW, Ten Kate FJ, Weel JF, Keller JJ, Kruizinga SP, Dankert J, Tytgat GN. Effect of Helicobacter pylori eradication on gastritis in relation to cagA: a prospective 1-year follow-up study. Gastroenterology 1997; 113: 25-30
5 Forbes GM, Warren JR, Glaser ME, Cullen DJ, Marshall BJ, Collins BJ. Long-term follow-up of gastric histology after Helicobacter pylori eradication. J Gastroenterol Hepatol 1996; 11: 670-673
6 Sung JJ, Lin SR, Ching JY, Zhou LY, To KF, Wang RT, Leung WK, Ng EK, Lau JY, Lee YT, Yeung CK, Chao W, Chung SC. Atrophy and intestinal metaplasia one year after cure of HH pylori infection: a prospective, randomized study. Gastroentero-logy 2000; 119: 7-14
7 Ohkusa T, Fujiki K, Takashimizu I, Kumagai J, Tanizawa T, Eishi Y, Yokoyama T, Watanabe M. Improvements in atrophy gastritis and intestinal metaplasia in patients in whom he-licobacter pylori was eradicated. Ann Intern Med 2001; 134; 380-386.
8 Ito M, Haruma K, Kamada T, Mihara M, Kim S, Kitadai Y, Sumii M, Tanaka S, Yoshihara M, Chayama K. Helicobacter pylori eradication therapy improves atrophic gastritis and intestinal metaplasia: a 5-year prospective study of patients with atrophic gastritis. Aliment Pharmacol Ther 2002; 16: 1449-1456
9 Correa P, Fontham ET, Bravo JC, Bravo LE, Ruiz B, Zarama G, Realpe JL, Malcom GT, Li D, Johnson WD, Mera R. Chemoprevention of gastric dysplasia: randomized trial of antioxidant supplements and anti-helicobacter pylori therapy. J Natl Cancer Inst 2000; 92: 1881-1888
10 Ruiz B, Garay J, Correa P, Fontham ET, Bravo JC, Bravo LE, Realpe JL, Mera R. Morphometric evaluation of gastric antral atrophy: improvement after cure of Helicobacter pylori infection. Am J Gastroenterol 2001; 96: 3281-3287
11 Kokkola A, Sipponen P, Rautelin H, Härkönen M, Kosunen TU, Haapiainen R, Puolakkainen P. The effect of Helicobacter pylori eradication on the natural course of atrophic gastritis with dysplasia. Aliment Pharmacol Ther 2002; 16: 515-520
12 Dixon MF. Prospects for intervention in gastric carcinogenesis: reversibility of gastric atrophy and intestinal metaplasia. Gut

PO Box 2345, Beijing 100023, China World J Gastroenterol 2005;11(41):6521-6524www.wjgnet.com World Journal of Gastroenterology ISSN [email protected] © 2005 The WJG Press and Elsevier Inc. All rights reservedE L S E V I E R
• ������ ������������� •������ ������������� • •
Significance and relationship between infiltrating inflammatory cell and tumor angiogenesis in hepatocellular carcinoma tissues
Shao-Hua Peng, Hong Deng, Jian-Feng Yang, Ping-Ping Xie, Cheng Li, Hao Li, De-Yun Feng
Shao-Hua Peng, Hong Deng, Jian-Feng Yang, Ping-Ping Xie, Cheng Li, Hao Li, Department of Pathology, Medical College, Hunan Normal University, Changsha 410006, Hunan Province, ChinaDe-Yun Feng, Department of Pathology, Xiangya School of Medicine, Central South University, Changsha 410078, Hunan Province, ChinaSupported by the Hunan Provincial Natural Science Foundation of China, No. 03-JJY5031Co-first authors: Shao-Hua Peng and Hong DengCo-correspondent: De-Yun FengCorrespondence to: Shao-Hua Peng, Department of Pathology, Medical College, Hunan Normal University, Changsha 410006, Hunan Province, China. [email protected]: +86-731-8630309Received: 2004-09-13 Accepted: 2004-12-26
AbstractAIM: To inves t igate the re la t ionsh ip between infiltrating inflammatory cell and tumor angiogenesis in hepatocellular carcinoma (HCC) tissues and their clinicopathological features.
METHODS: The paraff in-embedded spec imens from 70 cases with HCC were stained using EliVision immunohistochemistry with mAbs against CD68, tryptase, and CD34. The counts of tumor-associated macrophage (TAM), mast cell (MC) and tumor microvessel (MV) were performed in the tissue sections.
RESULTS: The mean counts of TAM, MC, and MV in HCC tissues were significantly higher than those in pericarcinomatous liver tissues (TAM: 69.31 ± 11.58 vs 40.23 ± 10.36; MC: 16.74 ± 5.67 vs 7.59 ± 4.18; MV: 70.11 ± 12.45 vs 38.52 ± 11.16, P<0.01). The MV count in the patients with metastasis was markedly higher than that with non-metastasis (P < 0.01). In addition, the MC count in the patients with poorly differentiated HCC was obviously higher than that with well differentiated HCC (P < 0.01). The correlation analysis showed that the TAM count was significantly correlated with the count of MV (r = 0.712, P < 0.01), and the MC count was obviously correlated with the MV count (r = 0.336, P < 0.05).
CONCLUSION: TAM and MC might be closely related to the enhancement of tumor angiogenesis. The MV count might be associated with tumor invasion and metastasis. Moreover, the MC count might be associated with tumor
differentiation and prognosis of HCC.
© 2005 The WJG Press and Elsevier Inc. All rights reserved.
Key words: Hepatocel lular carcinoma; Mast cel l; Microvessel; Macrophage
Peng SH, Deng H, Yang JF, Xie PP, Li C, Li H, Feng DY. Significance and relationship between infiltrating i n f l ammato ry ce l l and tumor ang iogenes i s i n hepatocellular carcinoma tissues. World J Gastroenterol2005; 11(41):6521-6524http://www.wjgnet.com/1007-9327/11/6521.asp
INTRODUCTIONTumor ang iogenes i s i s one of the fundamenta l requirements for tumor growth and proliferation, and the regulatory mechanisms of tumor angiogenesis are very complicated. The tumor neovascularization and its controlling factors have become investigative hot points in current tumor studies[1-5]. Tumor infiltrating inflammatory cells in the microenvironment plays very important functions in tumor angiogenesis[6-8]. Hepatocellular carcinoma (HCC) is a kind of a familiar malignant tumor in our country, though the treatment of HCC has obtained the substantial advance, the total treatment results are still unsatisfactory[9-12]. Until recently, there is some lack of knowledge in literature regarding the relationship among the count of tumor-associated macrophage (TAM), mast cell (MC), and microvessel (MV)_ in HCC tissues and their relation to the clinicopathological characteristics of HCC. In this study, we applied immunohistochemical method to detect the count of TAM, MC, and MV in HCC, and to investigate their relation to the clinicopathological characteristics of HCC, so that we could understand the regulating function of microenvironment in tumor angiogenesis. We believed that this study would offer some new clues for tumor angiogenesis research and biological therapeutic approach, such as suppressing tumor angiogenesis.
MATERIALS AND METHODSMaterialsFresh surgical specimens were obtained from 70 HCC

6522 ISSN 1007-9327 CN 14-1219/ R World J Gastroenterol November 7, 2005 Volume 11 Number 41
patients (all specimens contained pericarcinomatous liver tissues) who had undergone partial hepatectomy during the period from January 1996 to February 2003 in Xiangya Hospital. All specimens were fixed in 40 g/L formaldehyde, embedded in paraffin, sliced into consecutive sections, and pathologically diagnosed explicitly. Of 70 HCC patients, 53 were males and 17 were females with average age of 53.4 years (range, 27-68 years). The size of tumors was less than 5 cm in 25 cases, 5.1-10 cm in 29 cases and larger than 10 cm in 16 cases. Among all cases, 19 cases contained several tumor tubercles in liver tissues. None of the patients received any preoperative treatment, such as radiotherapy and chemotherapy. The HCC tissues were graded according to the Edmondson standard. Of them, 11 cases had grade I, 31 cases grade II, 23 cases grade III, and 5 cases grade IV tumors. All the pericarcinomatous liver tissues had liver fibrosis with cirrhosis of different degrees and 22 pericarcinomatous liver tissues had dysplasia. The antibodies against CD68, trypsin of MC and CD34, and “two step” EliVisions reagent box were all obtained from Maixin Biochemical Development Company of Fuzhou.
Immunohistochemical stainingBrief ly, after the sections were deparaffinized, the endogenous peroxidase was blocked by incubation with30mL/L hydrogen peroxide for 30 min, followed bycarrying out the two-step method of immunohistochemi-stry according to the manufacturer’s instructions. The sections were incubated with the primary antibodies at room temperature overnight. For negative control, the primary antibodies were replaced with PBS.
Brown-yellow staining was observed in the cytoplasm of TAM, whereas brown-yellow grains were observed both in the cytoplasm and nucleus of MC. According to the count method of Molin et al[13], we chose five random microscopic fields in each section under high power, counting the number of TAM and MC in each visual field, respectively. In addition, in the same visual field, we counted the number of MC that had the phenomenon of taking-off grains. MV and its endothelial cells showed brown-yellow staining. Similarly, according to the count method of Weidner e t al [14], we chose five random microscopic fields in each section under high power, counting the number of MV in each visual field.
Statistical analysisThe data were analyzed using t test and relativity analyses in the statistical computer software SPSS10.0. A P value less than 0.05 was considered statistically significant.
RESULTSExpressional characteristics of CD68, MC, CD34The cytoplasm of CD68-positive cells was stained with brown-yellow color. We could observe in all the sections, that most of the CD68-positive cells had the characteristic of microphage in appearance and the TAM was primarily distributed in the perimeter of tumor cells. Moreover,
brown-yellow grains were observed in the cytoplasm and nucleus of MC. In the relatively normal areas, MC was circular or oval with complete cell membrane, clear outline, abnormally dyed grains in cytoplasm and some of the MCs appearing to have the phenomenon of taking-off grains. But in the HCC tissue and its adjacent areas, the number of MC was obviously increased, the physical volume enlarged with a different appearance, and the majority of MC appeared to have the phenomenon of taking-off grains. The CD34 staining was located in the cytoplasm of vascular endothelial cells. We could observe a single endothelial cell or a cluster of cells in some areas containing partly irregular tube cavity and irregular MV distribution, which could mostly be seen in the perimeter areas of the tumor.
Counts of TAM, MC, and MVT h e c o u n t s o f T A M , M C , a n d M V w e r e a l l obviously higher in HCC tissues compared with the pericarcinomatous liver tissues (P<0.01, Table 1).
Relationship between the counts of TAM, MC, and MV and the clinicopathological characteristics of HCCThe counts of TAM, MC, and MV were significantly higher in metastatic HCC than that in non-metastatic HCC, and the count of MC in low grade HCC tissues was markedly higher compared to high grade HCC tissues (P<0.05). In addition, we also discovered that MC having the phenomenon of taking-off grains was more and more
TAM MC MVHCC tissues 69.31± 11.58 16.74±5.67 70.11±12.45
Pericarcinomatous 40.23±10.36b 7.59±4.18b 38.52±11.16b
liver tissuesbP<0.01 vs HCC tissues
Table 1 Counts of TAM, MC, and MV in HCC t issues and pericarcinomatous liver tissues (mean±SD)
Pathologic n TAM MC MV
characteristics
Stage of HCC
Ⅰ 11 68.86 ± 10.23 13.68 ± 5.21 65.86 ± 12.05
II 31 68.95 ± 9.82 17.03 ± 6.11 67.84 ± 11.54
III 23 70.11 ± 13.16 19.95 ± 4.29a 72.11 ± 10.84
IV 5 69.84 ± 12.57 23.56 ± 3.86a 68.70 ± 9.53
Tumor size
≤5 cm 25 69.32 ± 10.17 16.57 ± 5.56 66.56 ± 11.84
5.1–10 cm 29 71.35 ± 9.54 16.98 ± 4.81 65.84 ± 10.53
>10 cm 16 70.83 ± 12.11 17.02 ± 6.12 73.13 ± 11.30
Metastasis
Yes 29 68.36 ± 12.17 16.99 ± 6.49 73.49 ± 12.32c
No 41 69.14 ± 11.69 16.76 ± 6.88 64.39 ± 13.17aP<0.05 vs stage I; cP<0.05 vs non-transferred.
Table 2 Relationship of the counts of TAM, MC, and MV with the clinicopathological characteristics of HCC (mean ± SD)

6523
familiar in low grade HCC tissues. However, no obvious relationship was found between the counts of TAM, MC, and MV and the clinicopathological characteristics of HCC (Table 2).
Relationship of the counts of TAM and MC with the count of MV in HCC tissuesUsing the relativity analyses of the counts of TAM and MC with the count of MV in HCC tissues, we found that the TAM count and MV count in HCC tissues had a close and positive relationship of high degree (r = 0.712, P < 0.01), and the MC count and MV count in HCC tissues had a close and positive relationship (r = 0.336, P < 0.05).
DISCUSSIONTumor growth and proliferation are highly dependent on tumor neovascularization. Tumor angiogenesis is mediated by tumor-secreted angiogenic factors that interact with their surface receptors expressed on endothelial cells[15-19]. In fact, the mechanisms of regulation of tumor angiogenesis have become one of the investigative hot points in current tumor studies[1-5]. Our study showed that the MV count was significantly higher in HCC tissues as compared with the pericarcinomatous liver tissues, and also higher in the metastatic HCC compared with the metastatic HCC, suggesting that tumor angiogenesis has a crucial role in the development and metastasis of HCC. Tumor angiogenesis is a complicated process, including many regulating factors[20-24]. The angiogenic response in the microvasculature is associated with the changes in cellular adhesive interactions between adjacent endothelial cells, pericytes and surrounding extracellular matrix. In addition, the infiltrating inflammatory cells in tumor are closely related with tumor angiogenesis. The infiltrating inflammatory cells in tumor, such as neutrophil, microphage, lymphocyte, eosinophil, MC, etc., can produce various cell factors and enzymes which participate in the growth and spread of tumor. Microphage is a main composition of the infiltrating inflammatory cells in the tumor and usually belongs to TAM in tumor tissues[23-28]. On one hand, it can produce several growth-stimulating and repressing factors, and albumen hydrolyze enzymes, such as fibroblast growth factor, vascular endothelial growth factor, etc. and thereby plays an important role in chain responding of tumor angiogenesis. On the other hand, tumor cells also can produce various chemoattractant factors, such as monocyte chemoattractant proteins, macrophage colony-stimulating factor etc, which have an important effect on the activation and migration of macrophage. These TAMs, being closely related to microvessel density, also have something to do with tumor angiogenesis, metastasis, and prognosis. In this study, we found that the count of TAM was obviously higher in HCC tissues as compared with the pericarcinomatous liver tissues, suggesting that TAM plays an important role in the development of HCC. In addition, the TAM count and the MV count in HCC tissues had a close and positive relationship, which suggested that TAM might promote
tumor angiogenesis.Several studies have shown that MCs in the local
milieu may have something to do with the growth, invasion, metastasis, and neovascularization of malignant tumor[29-30]. Our results showed that the MC count was obviously higher in HCC tissues as compared with the pericarcinomatous liver tissues, suggesting an important role of MC in the development of HCC. We also found that the MC count in the lower grade HCC tissues was higher than that in the higher grade HCC, which suggested that the high MC count might be related to the low grade and poor prognosis of HCC. In addition, we observed that MC showing the phenomenon of taking-off grains was more and more familiar in low grade HCC tissues; however, its concrete relationship still needs further research. The counts of MC and MV in HCC tissues had a close and positive relationship, which revealed that MC might promote HCC angiogenesis.
REFERENCES 1 Saar is to A, Karpanen T , Al i ta lo K . Mechanisms of
angiogenesis and their use in the inhibition of tumor growth and metastasis. Oncogene 2000; 19: 6122-6129
2 Lutsenko SV, Kiselev SM, Severin SE. Molecular mechanisms of tumor angiogenesis. Biochemistry(Mosc) 2003; 68: 286-300
3 Boudreau N, Myers C. Breast cancer-induced angiogenesis: multiple mechanisms and the role of the microenvironment. Breast Cancer Res 2003; 5: 140-146
4 Rofstad EK, Halsør EF. Vascular endothelial growth factor, interleukin 8, platelet-derived endothelial cell growth factor, and basic fibroblast growth factor promote angiogenesis and metastasis in human melanoma xenografts. Cancer Res 2000; 60: 4932-4938
5 Zheng S, Han MY, Xiao ZX, Peng JP, Dong Q. Clinical significance of vascular endothelial growth factor expression and neovascularization in colorectal carcinoma. World J Gastroenterol 2003; 9: 1227-1230
6 Kataki A, Scheid P, Piet M, Marie B, Martinet N, Martinet Y, Vignaud JM. Tumor infi l trating lymphocytes and macrophages have a potential dual role in lung cancer by supporting both host-defense and tumor progression. J Lab Clin Med 2002; 140: 320-328
7 Yu JL, Rak JW. Host microenvironment in breast cancer development: inflammatory and immune cells in tumour angiogenesis and arteriogenesis. Breast Cancer Res 2003; 5: 83-88
8 Elpek GO, Gelen T, Aksoy NH, Erdoğan A, Derts iz L, Demircan A, Keleş N. The prognostic relevance of angiogenesis and mast cells in squamous cell carcinoma of the oesophagus.J Clin Pathol 2001; 54: 940-944
9 Lu SY, Sui YF, Li ZS, Ye J, Dong HL, Qu P, Zhang XM, Wang WY, Li YS. Superantigen-SEA gene modified tumor vaccine for hepatocellular carcinoma: an in vitro study. World J Gastroenterol 2004; 10: 53-57
10 Harris AL, Reusch P, Barleon B, Hang C, Dobbs N, Marme D. Soluble Tie2 and Flt1 extracellular domains in serum of patients with renal cancer and response to antiangiogenic therapy. Clin Cancer Res 2001; 7: 1992-1997
11 Zhao WH, Ma ZM, Zhou XR, Feng YZ, Fang BS. Prediction of recurrence and prognosis in patients with hepatocellular carcinoma after resection by use of CLIP score. World J Gastroenterol 2002; 8: 237-242
12 Qin LX, Tang ZY. The prognostic molecular markers in hepatocellular carcinoma. World J Gastroenterol 2002; 8: 385-392
13 Molin D, Edström A, Glimelius I, Glimelius B, Nilsson G,
Peng SH et al . Inflammatory cell and tumor angiogenesis in HCC

22 Mitsuhashi N,Shimizu H, Ohtsuka M, Wakabayashi Y, Ito H, Kimura F, Yoshidome H, Kato A, Nukui Y, Miyazaki M. Angiopoietins and Tie-2 expression in angiogenesis and proliferation of human hepatocellular carcinoma. Hepatology 2003; 37: 1105-1113
23 Feoktistov I, Ryzhov S, Goldstein AE, Biaggioni I. Mast cell mediated stimulation of angiogenesis: cooperative interaction between A2B and A3 adenosine receptors. Circ Res 2003; 92: 485-492
24 Aoki M, Pawankar R, Niimi Y, Kawana S. Mast cells in basal cell carcinoma express VEGF, IL-8 and RANTES. Int Arch Allergy Immunol 2003; 130: 216-223
25 Torisu H, Ono M, Kiryu H, Furue M, Ohmoto Y, Nakayama J, Nishioka Y, Sone S, Kuwano M. Macrophage infiltration correlates with tumor stage and angiogenesis in human malignant melanoma: possible involvement of TNFalpha and IL-1alpha. Int J Cancer 2000; 85: 182-188
26 Ishigami S, Natsugoe S, Tokuda K, Nakajo A, Okumura H, Matsumoto M, Miyazono F, Hokita S, Aikou T. Tumor-associated macrophage (TAM) infiltration in gastric cancer. Anticancer Res 2003; 23: 4079-4083
27 Li C, Shintani S, Terakado N, Nakashiro K, Hamakawa H. Infiltration of tumor-associated macrophages in human oral squamous cell carcinoma. Oncol Rep 2002; 9: 1219-1223
28 Ono M, Torisu H, Fukushi J, Nishie A, Kuwano M. Biological implications of macrophage infiltration in human tumor angiogenesis. Cancer Chemother Pharmacol 1999; 43: S69-71
29 Hiromatsu Y, Toda S. Mast cells and angiogenesis. Microsc Res Tech 2003; 60: 64-69
30 Ribatti D, Ennas MG, Vacca A, Ferreli F, Nico B, Orru S, Sirigu P. Tumor vascularity and tryptase-positive mast cells correlate with a poor prognosis in melanoma. Eur J Clin Invest 2003; 33: 420-425
Science Editor Guo SY Language Editor Elsevier HK
Sundström C, Enblad G. Mast cell infiltration correlates with poor prognosis in Hodgkin's lymphoma. Br J Haematol 2002; 119: 122-124
14 Weidner N, Carroll PR, Flax J, Blumenfeld W, Folkman J. Tumor angiogenesis correlates with metastasis in invasive prostate carcinoma. Am J Pathol 1993; 143: 401-409
15 Strohmeyer D, Rössing C, Bauerfeind A, Kaufmann O, Schlechte H, Bartsch G, Loening S. Vascular endothelial growth factor and its correlation with angiogenesis and p53 expression in prostate cancer. Prostate 2000; 45: 216-224
16 Guang-Wu H, Sunagawa M, Jie-En L, Shimada S, Gang Z, Tokeshi Y, Kosugi T. The relationship between microvessel density, the expression of vascular endothelial growth factor (VEGF), and the extension of nasopharyngeal carcinoma. Laryngoscope 2000; 110: 2066-2069
17 Fidler IJ. Angiogenesis and cancer metastasis. Cancer J 2000; 6 Suppl 2: S134-S141
18 Streit M, Detmar M. Angiogenesis, lymphangiogenesis, and melanoma metastasis. Oncogene 2003; 22: 3172-3179
19 Yamaguchi R, Yano H, Nakashima Y, Ogasawara S, Higaki K, Akiba J, Hicklin DJ, Kojiro M. Expression and localization of vascular endothelial growth factor receptors in human hepatocellular carcinoma and non-HCC tissues. Oncol Rep 2000; 7: 725-729
20 Etoh T, Inoue H, Tanaka S, Barnard GF, Kitano S, Mori M. Angiopoietin-2 is related to tumor angiogenesis in gastric carcinoma: possible in vivo regulation via induction of proteases. Cancer Res 2001; 61: 2145-2153
21 Yudoh K, Kanamori M, Ohmori K, Yasuda T, Aoki M, Kimura T. Concentration of vascular endothelial growth factor in the tumour tissue as a prognostic factor of soft tissue sarcomas.Br J Cancer 2001; 84: 1610-1615
6524 ISSN 1007-9327 CN 14-1219/ R World J Gastroenterol November 7, 2005 Volume 11 Number 41
PO Box 2345, Beijing 100023, China World J Gastroenterol 2005;11(41):6525-6529www.wjgnet.com World Journal of Gastroenterology ISSN [email protected] © 2005 The WJG Press and Elsevier Inc. All rights reserved.
E L S E V I E R
• RAPID COMMUNICATION•
Zhong-Min Huang, Qi-Wen Huang, Ya-Qin Qin, Chun-He Huang, Hou-Ji Qin, Yiao-Nan Zhou, Xiang Xu, Chun-Lei Lu, Department of Infectious Diseases, The Affiliated Hospital of Youjiang Medical College for Minority Nationalities, Baise 533000, Guangxi Zhuang Autonomous Region, ChinaSupported by the Natural Science Foundation of Guangxi Zhuang Autonomous Region, No. 49 (2002), Key Program of Youjiang Medical College for Minority Nationalities, No. (2004) 86Co-Correspondence: Ya-Qin Qin and Zhang-Min HuangCorrespondence to: Dr. Ya-Qin Qin Department of Infectious Diseases, The Affiliated Hospital of Youjiang Medical College for Minority Nationalities, Baise 533000, Guangxi Zhuang Autonomous Region, China. [email protected]: +86-776-2836942 Fax: +86-776-2825603Received: 2004-09-23 Accepted: 2004-11-04
AbstractAIM: To investigate the distribution of HBV genotypes and the i r YMDD mutat ions in Guangx i Zhuang population, China, and to study the relationship between HBV genotypes and clinical types of HB, ALT, HBV DNA, HBe system as well as the curative effect of Lamivudine (LAM) on hepatitis B.
METHODS: A total of 156 cases were randomly chosen as study subjects from 317 patients with chronic hepatitis B (CHB). HBV genotypes were determined by PCR-microcosmic nucleic acid cross-ELISA. YMDD mutations were detected by microcosmic nucleic acid cross-nucleic acid quantitative determination. HBV DNA was detected by fluorescence ratio PCR analysis. LAM was given to 81 cases and its curative effect was observed by measuring ALT, HBV DNA load, HBeAg, and HBeAg/HBeAb conversion rate.
RESULTS: HBV genotypes B, C, D, and non-classified genotypes were found in Guangxi Zhuang population. accounting for 25.6%, 47.4%, 58.3%, and 16.0%, respectively. Seventy-four cases were CD-, CB-, BD-mixed genotypes (47.7%). Forty-six (29.5%) cases had YMDD mutations. Genotype B was mostly found in mild and moderate CHB patients. Genotypes C, D and mixed genotype mostly occurred in severe CHB cases. Genotypes D and CD HBV-infected patients had higher ALT and HBV DNA than patients with other types of HBV infection. There was no significant difference among the genotypes in YMDD mutations, clinical types, ALT and HBV DNA level. Non-classified types geno had a significantly lower positive rate of HBeAg than other
Clinical characteristics and distribution of hepatitis B virus genotypes in Guangxi Zhuang population
Zhong-Min Huang, Qi-Wen Huang, Ya-Qin Qin, Chun-He Huang, Hou-Ji Qin, Yiao-Nan Zhou, Xiang Xu, Chun-Lei Lu
genotypes (χ2=12.841, P<0.05). There was no significant difference in ALT recovery rate, HBV DNA load, HBeAg, and HBeAg/HBeAb conversion rate, 48 wk after LAM treatment between groups of genotypes D, CD, and non-classified type.
CONCLUSION: Genotypes B, C, and D, non-classified and mixed genotype of HBV are identif ied in the Guangxi Zhuang population. Variations in genotypes are associated with clinical severity and serum ALT levels, but not with YMDD mutation or HBV DNA load. Therapeutic effects of LAM on clinical parameters are not influenced by differences in genotypes. Further studies are needed to gain an in-depth understanding of the relationship between HBV genotypes and serum HBeAb and HBeAg.
© 2005 The WJG Press and Elsevier Inc. All rights reserved.
Key words: Hepati t is B virus; Chronic hepat i t is; Genotype; YMDD mutation; Lamivudine; Zhuang nationality
Huang ZM, Huang QW, Qin YQ, Huang CH, Qin HJ, Zhou YN, Xu X, Lu CL. Clinical characteristics and distribution of hepatitis B virus genotypes in Guangxi Zhuang population. World J Gastroenterol 2005; 11(41):6525-6529http://www.wjgnet.com/1007-9327/11/6525.asp
INTRODUCTIONGuangxi Zhuang Autonomous Region is an endemic area of HBV infection. To examine the distribution of HBV genotypes and their associations with clinical characteristics of hepatitis B (HB) in Zhuang population, a total of 156 cases selected randomly from chronic hepatitis B (CHB) 317 patients without any previous antiviral treatment were studied, and some cases were given Lamivudine (LAM) treatment. The results reported are as follows.
MATERIALS AND METHODSGeneral data of patientsA total of 156 patients, 89 males and 67 females, aged 15-70 years, were selected randomly from CHB 317 patients from out-patient and in-patient departments of our hospital during January 2001 to June 2003. These patients received no previous LAM treatment or any antiviral treatment within a year. Their serum HBsAg, HBeAg or HBcAb and HBV DNA were positive. Those

6526 ISSN 1007-9327 CN 14-1219/R World J Gastroenterol November 7, 2005 Volume 11 Number 41
infected with HCV, HDV, and HIV were excluded. All cases fulfilled the diagnostic criteria modified at the Tenth Viral Hepatitis Conference of Chinese Medical Association[1].
Detection of HBV genotypesHBV DNA genotypes were detected by PCR-microcosmic nucleic acid cross-ELISA. One hundred microliters of serum samples was mixed with a reaction solution in a 0.5 mL centrifuge tube, heated to 100 °C for 15 min, and centrifuged at 12 000 g for 5 min. Twelve-microliter supernatant from the previous step was centrifuged at 10 000 g for 10 s before being placed in a PCR reactor, pre-denatured at 94 °C for 2 min, amplified for 35 cycles (at 94 °C for 50 s, at 53 °C for 50 s, and at 72 °C for 65 s), followed by extension at 72 °C for min and a final extension at 98 °C for 10 min. The samples were chilled immediately in an ice-bath for 10 min. Package was pinked at the microcosmic openings at 37 °C for 14 min in NaHCO3 solution (pH 9.6). Nonspecific conjugate at the microcosmic openings was sealed by seal reagent. Ninety microliters of (three drops) hybridization liquid, 20 μL denatured output, 23 μL each nucleic pink (one kind was added to one opening) were added to different reaction openings, mixed up lightly and put into 50 °C water bath for 60 min, and poured completely. Then, 200 μL (eight drops) lotion was added at 37 °C for 3-5 min, poured completely and baptized once again. One hundred microliters of enzyme-antibody liquid (two drops) was added and kept at 37 °C for 30 min, poured and dried by water absorber, 200 μL (eight drops) lotion was added and kept at room temperature for 3-5 min, baptized twice, then color reagents A and B (one drop) were added, respectively, kept at room temperature in the dark for 10 min. Then, 2 mol/L H2SO4 solution (one drop) was added and the photoabsorption degree value (A) was detected at 450 nm. HBV DNA was considered positive, if P/N≥2.1 and negative if P/N<2.1. Positive result in hybridization indicated the virus gene
Detection of YMDD mutationReagent kits were provided by Biomedicine Diagnosis and Research Center of Basic Medicine Department of the First Military Medical University. YMDD mutations were detected by PCR. Twenty-five specimens were tested in Biomedicine Diagnosis and Research Center of Basic Medicine Department of the First Military Medical University, and the other 131 specimens were tested according to the manual of the kits and results were evaluated by experts at the Central Laboratory of our hospital.
Quantitative determination of HBV DNAFX990 micro-fluorometer and HBV-PCR fluoroscopy reagent kits (detection limit is 103 copies/mL) were used to detect HBV DNA according to the instructions of the kits and results were evaluated by experienced experts.
Detection of HBVMHBVM was detected by ELISA. Reagent kits were provided by Zhongshan Bioengineering Co., Ltd, Guangdong, China. The function of the l iver was examined by the method of Laishi, and the normal level of ALT was lower than 40 U/L
TreatmentAccording to the common clinical practice[2], LAM (10 mg/d.p.o.) was g iven to 30 pat ients wi th s ing le genotypes B, C, or D, and 35 patients with mixed genotypes CD, CB, or DB, and 16 non-classified types. HBV DNA and ALT were high, and HBeAg was positive in all cases selected. Twenty-eight cases had YMDD mutation. Liver function, HBVM and HBV DNA load were detected every 4 wk, for 48 wk.
Statistical analysisThe incidence rate of YMDD mutations, the rate of various clinical types of HB, the abnormal rate of ALT, the high loading rate of HBV DNA, and the positive rate of HBeAg in different genotypes of HBV were compared before and after LAM treatment by χ2 using SAS statistical software. P<0.05 was considered statistically significant.
RESULTSHBV genotypes in 156 CHB patientsGenotypes in 156 selected cases included B, C, D, mixed, and non-classified types. Genotypes A, E, and F were tested but not discovered. Genotype D accounted for 58.3% (91/156), type C 47.4% (74/156), type B 25.6% (40/156), and non-classified type 16.0% (25/156), mixed types (CD, CB, and BD) 47.4% (74/156). Single genotypes (B, C, or D) accounted for 36.5% (57/156, Table 1)
Patterns of A B C D E F CD CB BD Non-A–Fgenotype
n – 9 15 33 – – 43 16 15 25
Incidence rate (%) – 5.8 9.6 21.2 – – 27.6 10.3 9.6 16.0
Relationship between different HBV genotypes and YMDD mutations, clinical types of CHB, ALT, and HBV DNA, and HBe systemNatural YMDD mutations occurred in 46 cases (29.5%). Genotype B had no YMDD mutation. Genotypes had a different incidence rate of YMDD mutations, but there was no significant difference among them. Genotype B was seen mostly in mild and moderate CHB patients, while genotypes C, D and mixed types of CD, BD occurred mostly in severe CHB patients. The abnormal rate of ALT and the high loading rate of HBV DNA in genotypes D, and CD were higher than those in other genotypes, but there was no significant difference. The positive rate of HBeAg in non-classified genotype was low, and there was a significant difference between non-classified and other genotypes (χ2 = 12.841, P<0.05, Table 2).
Table 1 Distribution of HBV genotypes in 156 cases

Huang ZM et al. Distribution of hepatitis B virus genotype 6527
Table 2 Relationship between different HBV genotypes and YMDD mutations, clinical types of CHB, ALT, and HBV DNA level, HBe system
Genotypes n Rate of YMDD Clinical type of CHB Clinical test mutation (%) Mild and moderate SevereCHB (%) Abnormal rate HBV DNA >105 HBeAg(+)/HBeAb(–) CHB (%) of ALT (%) copies/mL (%)
B 9 – 8 (88.9) 1 (11.1) 3 (33.3) 4 (44.4) 7/2
C 15 6 (40.0) 4 (26.7) 11 (73.3) 8 (53.3) 9 (60.0) 10/5
D 33 7 (21.2) 14 (42.4) 19 (57.6) 23 (69.7) 22 (66.7) 23/10
CD 43 15 (34.9) 19 (44.2) 24 (55.8) 32 (74.4) 30 (69.8) 28/15
CB 16 6 (37.5) 9 (56.3) 7 (43.7) 9 (56.3) 10 (62.5) 12/4
BD 15 4 (26.7) 7 (46.7) 8 (53.3) 8 (53.3) 9 (60.0) 9/6
Non-A–F 25 8 (32.0) 15 (60.0) 10 (40.0) 12 (48.0) 10 (40.0) 8/17
χ2 2.788 11.272 9.858 7.448 12.841
P >0.05 >0.05 >0.05 >0.05 <0.05
Observation of curative effects of LAMALT and HBV DNA level in all genotypes decreased in different degrees, 4 wk after LAM treatment. There was no significant difference in ALT recovery rate, HBV DNA level, HBeAg, and HBeAg/HBeAb conversion rate 48 weeks after treatment between the groups (Table 3). Twenty-eight cases showed natural mutations of single mixed and non-classified genotypes. After 48 weeks, HBV DNA level decreased in 22 cases to a level <103 copies/mL and ALT became normal. Rebound of HBV DNA level and base line of ALT were not found. HBeAg became negative in 15 cases and 10 cases had HBeAg/HBeAb conversion 48 weeks after the treatment.
DISCUSSIONResearch data indicate that HBV can be divided into eight genotypes[3], ranging from A to H. Genotype A is frequently found in northwest Europe and Africa. Genotypes B and C are common in Asia, while genotype D is prevalent in the Mediterranean and Near East.
Genotype E is restricted to Sub-Saharan Africa, and F is localized in American aboriginal population. Genotype G has been found in France and USA, and genotypes A–H[4] have been found in patients with HBV infection in San Francisco. The distribution of HBV genotypes is related to immigration[5–7] and race background of the carriers. In China, genotypes B and C are predominant, while genotypes A and D are rare. But type D has a high percentage in minority nationalities. In our study, HBV genotypes were determined in 156 Zhuang CHB patients by PCR-microcosmic nucleic acid cross-ELISA. Genotypes B–D and non-classified type were identified. HBV genotype D was mostly found (58.3%), followed by genotypes C (47.4%), and B (25.6%). Non-classified type (16.0%) was significantly higher than that reported in Taiwan[8]. The distribution of genotypes B and C is consistent with most reports[9–11] in China. Type D is the predominant genotype in Zhuang population, which is different from other reports[11]. It may be related to the geographical and ethnic characteristics of Zhuang population. There was a high rate (47.4%) of mixed
Table 3 Curative effect after 48 weeks of LAM treatment
Group n Recovery rate HBV DNA level HBeAg negative HBeAg/HBeAb of ALT (%) <103 copies/mL (%) conversion rate (%) conversion rate (%)
Single genotypes 30 23 (76.7) 24 (80.0) 16 (53.3) 11 (36.7)
Mixed genotypes 35 28 (80.0) 29 (82.9) 18 (51.4) 12 (34.3)
Non-classified genotypes 16 13 (81.3) 14 (87.5) 10 (62.5) 6 (37.5)
χ2 0.168 0.411 0.561 0.065
P >0.05 >0.05 >0.05 >0.05

6528 ISSN 1007-9327 CN 14-1219/R World J Gastroenterol November 7, 2005 Volume 11 Number 41
our study is in accordance with that reported by Zhang et al[15]. showing that wild YMDD mutant strains exist in HBV DNA. There were differences of incidence rate of HBV YMDD wild mutant strains in HBV genotypes D, C, non-classified, and mixed genotypes of CD, BC, and CB. Although no significant difference was found among these genotypes, we cannot exclude the relation between YMDD mutations and HBV genotypes because of the limited samples in our study. The virus gene controls antigen expression, leading to different genotypes and disease spectrum after infection. However, the conclusions are controversial. It was reported that genotype A is related to chronic active hepatitis, genotype D is related to acute self-limited hepatitis[18], and HBV-D is related to chronic symptomatic carriers[19]. All chronic HBV infections found in Jeju Island are genotype C[20]. But most scholars[21–23] found that genotype C is related to severe hepatitis or the aggravation of illness. Yuen et al[24] reported that genotype B has a higher mortality than genotype C because of decompensation of liver function. Our study showed that genotype A was not found in 156 CHB patients, while genotype D was predominant. This may be associated with uneven distribution of genotypes and simple clinical type, or the ethnic background. Genotype B was mainly found in chronic mild and moderate HBV patients, while genotypes C and D were mainly in chronic severe HBV patients. They seemed to increase with the progression of the illness. But there was no statistical significance. Studies on whether mixed genotype infection can worsen liver diseases are available[25–27], but the conclusion is controversial. In our study, mixed genotype CD and BD infections were mainly found in patients with chronic severe HBV infection, indicating that mixed genotype infection can lead to liver disease. More attention has been paid to the relationship between HBV genotype and HBe, ALT, and HBV DNA.
In our study, genotypes of CD and D had higher levels of ALT and HBV DNA than other genotypes, indicating that different genotypes are related with the level of ALT and HBV DNA. Compared to HBeAg-positive rate, there was a significant difference between non-classified and other genotypes (P<0.05), indicating that HBV genotype is related with HBe. Further studies are needed. LAM is one of the first-line medicines for CHB patients[28,29]. Whether the effect of LAM treatment is influenced by HBV genotype is a topic of the researchers. Some studies showed that the effect of LAM treatment is not influenced by HBV genotype[30–32]. In our study, the effect of LAM treatment was not influenced by HBV genotype, suggesting that determination of HBV genotype cannot predict antiviral effect before LAM treatment[30]. Among the 28 cases with YMDD mutations, after 48 weeks of LAM treatment, HBV DNA levels in 22 cases decreased to below 103 copies/mL, and ALT became normal, and HBeAg became negative in 15 cases and 10 cases had HBeAg/HBeAb conversion, showing that LAM has a short-term effect in patients with YMDD wild mutation. This may be associated with the fact that wild viral strains are in the dominant side, while YMDD mutational strains are in the weak side and have a lower duplication activity and weaker pathogenicity. In short, there are some unique characteristics in the distribution of HBV genotypes of Guangxi Zhuang population. This may be related to the geographic location and ethnics. HBV genotypes are not correlated with YMDD mutation, ALT, and HBV DNA level. The effect of LAM is not influenced by these factors. Further studies are needed to examine the relationship between the characteristics of HBV genotype, the mutation of pre-C-zone and different genotypes, as well as the conversion and prognosis of the disease.
REFERENCES1 Hepatology branch-conference of infectious diseases, parasitic
diseases association of Chinese medical association. Schemes of prevention and cure for viral hepatitis. Zhonghua Ganzangbing Zazhi 2000; 8: 324-329
2 Lamivudine Clinical Practice Group. Lamivudine treatment consensus from relative experts in 2003. Zhonghua Ganzangbing Zazhi 2003; 11: 497-499
3 Miyakawa Y, Mizokami M. Classifying hepatitis B virus genotypes. Intervirology 2003; 46: 329-338
4 Kato H, Gish RG, Bzowej N, Newsom M, Sugauchi F, Tanaka Y, Kato T, Orito E, Usuda S, Ueda R, Miyakawa Y, Mizokami M. Eight genotypes (A-H) of hepatitis B virus infecting patients from San Francisco and their demographic, clinical, and virological characteristics. J Med Virol 2004; 73: 516-521
5 Yuen MF, Sablon E, Tanaka Y, Kato T, Mizokami M, Doutreloigne J , Yuan HJ, Wong DK, Sum SM, Lai CL. Epidemiological study of hepatitis B virus genotypes, core promoter and precore mutations of chronic hepatitis B infection in Hong Kong. J Hepatol 2004; 41: 119-125
6 Sallam TA, William Tong CY. African links and hepatitis B virus genotypes in the Republic of Yemen. J Med Virol 2004; 73: 23-28
7 Chu CJ, Keeffe EB, Han SH, Perrillo RP, Min AD, Soldevila-Pico C, Carey W, Brown RS, Luketic VA, Terrault N, Lok AS. Hepatitis B virus genotypes in the United States: results of a
population or random mechanism. YMDD motif, located in the C-domain of the catalytic site of the polymerase gene, is also the binding site of the antiviral drug LAM. Long-term treatment with LAM induces mutation of the YMDD motif; however, it was reported recently that YMDD mutations are occurring naturally[13-16]. Original research considered that the natural occurrence of YMDD mutant strains is associated with a great amount of HBV existing in patients[13]. Further research revealed that YMDD mutations occur spontaneously as they gain fitness without any particular cause[17]. The detection rate (29.5%) of mutant strains in
genotypes. The mixed infection occurred between genotypes B and C or B and D, but mostly between genotypes D and C, which is also different from other reports[9] in China. The reasons may be as follows: (1) super infection and mixed infection, patients are easily treated, (2) gene mutation, detection methods, recombination of different genotypes[12]. Our study did not rule out the possibility of recombination of different genotypes. Further studies are needed to explore whether it is related to the special genobackground of Zhuang
Huang ZM et al. Distribution of hepatitis B virus genotype 6529
nationwide study. Gastroenterology 2003; 125: 444-4518 Lee CM, Chen CH, Lu SN, Tung HD, Chou WJ, Wang JH, Chen
TM, Hung CH, Huang CC, Chen WJ. Prevalence and clinical implications of hepatitis B virus genotypes in southern Taiwan. Scand J Gastroenterol 2003; 38: 95-101
9 Zhu B, Luo K, Hu Z. Establ ishment of a method for classification of HBV genome and it's application Zhonghua Shi Yan He Lin Chuang Bing Du Xue Za Zhi 1999; 13: 309-313
10 Xia G, Nainan OV, Jia Z. Characterization and distribution of hepatitis B virus genotypes and subtypes in 4 provinces of China Zhonghua Liu Xing Bing Xue Za Zhi 2001; 22: 348-351
11 Ge XM, Li DY, Fang ZL, Huang GY, Jiang SQ, Pan HD, Du Y, Wang CY, Ding X, Masashi M. Distribution of hepatitis B virus genotypes and its clinical significance in Guangxi Zhonghua Shi Yan He Lin Chuang Bing Du Xue Za Zhi 2003; 17: 174-179
12 Sugauchi F, Mizokami M, Orito E, Ohno T, Kato H, Suzuki S, Kimura Y, Ueda R, Butterworth LA, Cooksley WG. A novel variant genotype C of hepatitis B virus identified in isolates from Australian Aborigines: complete genome sequence and phylogenetic relatedness. J Gen Virol 2001; 82: 883-892
13 Kobayashi S, Ide T, Sata M. Detection of YMDD motif mutations in some lamivudine-untreated asymptomatic hepatitis B virus carriers. J Hepatol 2001; 34: 584-586
14 Yan MH, Zhang C, Ling Q, Zhou RF. Detection of YMDD motif mutations in lamivudine-untreated patients with chronic hepatitis B Zhonghua Gan Zang Bing Za Zhi 2003; 11: 430-431
15 Zhang XH, Zhang YX, Sun LR, Wen Q, Zhou LQ, Fan GX, Zhang X, Yang DG. Study of gene chips in the detection of YMDD mutations in the region of HBV polymeras Zhonghua Yi Xue Za Zhi 2003; 83: 459-462
16 Matsuda M, Suzuki F, Suzuki Y, Tsubota A, Akuta N, Hosaka T, Someya T, Kobayashi M, Saitoh S, Arase Y, Satoh J, Takagi K, Kobayashi M, Ikeda K, Kumada H. Low rate of YMDD motif mutations in polymerase gene of hepatitis B virus in chronically infected patients not treated with lamivudine. J Gastroenterol 2004; 39: 34-40
17 Kobayashi S. Clinical characteristics of asymptomatic hepatitis B virus carriers with YMDD mutant not treated with lamivudine. Kurume Med J 2003; 50: 87-90
18 Mayerat C, Mantegani A, Frei PC. Does hepatitis B virus (HBV) genotype influence the clinical outcome of HBV infection? J Viral Hepat 1999; 6: 299-304
19 Duong TN, Horiike N, Michitaka K, Yan C, Mizokami M, Tanaka Y, Jyoko K, Yamamoto K, Miyaoka H, Yamashita Y, Ohno N, Onji M. Comparison of genotypes C and D of the hepatitis B virus in Japan: a clinical and molecular biological
study. J Med Virol 2004; 72: 551-55720 Kim BJ, Song BC. Distribution of hepatitis B virus genotypes
according to the clinical outcomes in patients with chronic hepatitis B virus infection in Jeju island. Korean J Gastroenterol 2003; 42: 496-501
21 Wang Y, Zhou G, Li X, Zhou Z, Zhou S, Ruan L, Chen M, Deng W. Genotyping of hepatitis B virus and clinical investigation Zhonghua Shi Yan He Lin Chuang Bing Du Xue Za Zhi 2002; 16: 367-369
22 Ding X, Mizokami M, Yao G, Xu B, Orito E, Ueda R, Nakanishi M. Hepatitis B virus genotype distribution among chronic hepatitis B virus carriers in Shanghai, China. Intervirology 2001; 44: 43-47
23 Kao JH, Chen PJ, Lai MY, Chen DS. Hepatitis B genotypes correlate with clinical outcomes in patients with chronic hepatitis B. Gastroenterology 2000; 118: 554-559
24 Yuen MF, Sablon E, Wong DK, Yuan HJ, Wong BC, Chan AO, Lai CL. Role of hepatitis B virus genotypes in chronic hepatitis B exacerbation. Clin Infect Dis 2003; 37: 593-597
25 Kato H, Orito E, Gish RG, Bzowej N, Newsom M, Sugauchi F, Suzuki S, Ueda R, Miyakawa Y, Mizokami M.Hepatitis B e antigen in sera from individuals infected with hepatitis B virus of genotype G. Hepatology 2002; 35: 922-929
26 Kao JH, Chen PJ, Lai MY, Chen DS.Clinical and virological aspects of blood donors infected with hepatitis B virus genotypes B and C. J Clin Microbiol 2002; 40: 22-25
27 Kao JH, Chen PJ, Lai MY, Chen DS. Acute exacerbations of chronic hepatitis B are rarely associated with superinfection of hepatitis B virus. Hepatology 2001; 34: 817-823
28 Pramoolsinsup C. Management of viral hepatit is B. J Gastroenterol Hepatol 2002; 17 Suppl: S125-S145
29 Alberti A, Brunetto MR, Colombo M, Craxì A. Recent progress and new trends in the treatment of hepatitis B. J Med Virol 2002; 67: 458-462
30 Yuen MF, Wong DK, Sablon E, Yuan HJ, Sum SM, Hui CK, Chan AO, Wang BC, Lai CL. Hepatitis B virus genotypes B and C do not affect the antiviral response to lamivudine. Antivir Ther 2003; 8: 531-534
31 Yuen MF, Tanaka Y, Lai CL. Hepatitis B genotypes in chronic hepatitis B and lamivudine therapy. Intervirology 2003; 46: 373-376
32 Akuta N, Suzuki F, Kobayashi M, Tsubota A, Suzuki Y, Hosaka T, Someya T, Kobayashi M, Saitoh S, Arase Y, Ikeda K, Kumada H.The influence of hepatitis B virus genotype on the development of lamivudine resistance during long-term treatment. J Hepatol 2003; 38: 315-321
Science Editor Wang XL and Zhu LH Language Editor Elsevier HK

PO Box 2345, Beijing 100023, China World J Gastroenterol 2005;11(41):6530-6534www.wjgnet.com World Journal of Gastroenterology ISSN [email protected] © 2005 The WJG Press and Elsevier Inc. All rights reserved.E L S E V I E R
• RAPID COMMUNICATION •
Correlation between CK18 gene and gastric carcinoma micrometastasis
Wei Xu, Ming-Wei Zhang, Jing Huang, Xin Wang, Shu-Fen Xu, Yan Li, Shu-Jie Wang
AbstractAIM: To explore the biological behavior of gastric carcinoma micrometastasis (MM) with a marker of cytokeratin 18 (CK18) and to evaluate the clinical stage of gastric carcinoma and its prognosis.
METHODS: Reverse transcription-polymerase chain reaction (RT-PCR) was used to examine the expression of CK18 mRNA in 298 lymph nodes from 35 patients with gastric carcinoma and 20 lymph nodes from 10 patients with chronic peptic ulcer and gastric perforation diagnosed by pathological examination and surgery. CK18 mRNA expression of peripheral blood from 54 patients with gastric carcinoma and 10 healthy people were also examined.
RESULTS: Expression of CK18 mRNA was not found in 10 patients with benign pathological changes. CK18 mRNA expression in gastric carcinoma tissues was strongly positive. In gastric carcinoma patients, pathological examination revealed that 99 of 298 (33.2%) lymph nodes were positive, while RT-PCR showed that 133 of 298 (44.6%) lymph nodes had expression of CK18 mRNA. The difference was significant (P < 0.05). Among the 199 negative lymph nodes identified by pathological examinations, 34 (17.1%) displayed positive expression of CK18 mRNA by RT-PCR. The positive expression of CK18 mRNA was associated with lymph node micrometastasis (LMM) of gastric carcinoma. CK18 mRNA was negatively expressed in all 10 healthy cases and positively expressed in 38.9% of 54 blood specimens from gastric carcinoma patients. The positive rate was not correlated with tumor invasion of gastric carcinoma, but was significantly associated with TNM stage, lymph node metastasis (P = 0.0290, P < 0.05) and tumor differentiation (P = 0.2956, P<0.05).
CONCLUSION: RT-PCR with CK18 mRNA as a molecular marker is highly sensitive and specific in detecting LMM of gastric carcinoma. It can benefit the diagnosis of MM and guide studies on biological behavior, clinical phase, and therapy as well as relapse monitoring.
© 2005 The WJG Press and Elsevier Inc. All rights reserved.
Key words: Gastric carcinoma; CK18; RT-PCR; Biological behavior
Xu W, Zhang MW, Huang J, Wang X, Xu SF, Li Y, Wang SJ. Correlation between CK18 gene and gastric carcinoma micrometastasis. World J Gastroenterol 2005;11(41):6530-6534http://www.wjgnet.com/1007-9327/11/6530.asp
INTRODUCTION Gastric carcinoma ranks second in alimentary canal diseases and third in all tumors in China. Metastasis and relapse are two major reasons for the death of patients. The two important metastatic pathways of gastric carcinoma are lymph nodes and peripheral blood, which are important factors for the prognosis of patients after curative surgery. This study used reverse transcription-polymerase chain reaction (RT-PCR) to detect the expression of cytokeratin 18 (ck18) mRNA and to explore its correlation with gastric carcinoma micrometastasis (MM).
MATERIALS AND METHODSPatients and tissue samplesEnrolled in this study were 54 patients (24 females, 30 males) undergone curative gastrectomy for gastric carcinoma at the First and Second Hospitals of Jilin University between October 2001 and August 2002. The patients’ age ranged from 34 to 74 years (mean age of 51.2 years). Control group I included 10 patients with peptic ulcer, control group II consisted of 10 healthy people. A total of 298 lymph nodes were obtained from 54 patients with gastric carcinoma. Lymph nodes were divided into two parts: one for pathological examination and the other stored at -80 °C for use. Five milliliters of peripheral blood was collected from 54 patients with gastric carcinoma. Blood specimens were anti-coagulated with heparin. Peripheral blood
Wei Xu, Jing Huang, Xin Wang, Shu-Fen Xu, Yan Li, Shu-Jie Wang, Department of Laboratory, The First Hospital of Jilin University, Changchun 130021, Jilin Province, ChinaMing-Wei Zhang, Department of General Surgery, The Second Hospital of Jilin University, Changchun 130041, Jilin Province, ChinaSupported by the Natural Science Foundation of Jilin Province, No. 20010594Correspondence to: Wei Xu, Department of Laboratory, The First Hospital of Jilin University, Changchun 130021, Jilin Province, China. [email protected]: +86-431-5612622 Fax: +86-431-5612622Received: 2005-03-18 Accepted: 2005-04-30

6531 ISSN 1007-9327 CN 14-1219/ R World J Gastroenterol November 7, 2005 Volume 11 Number 41
mononuclear cells (PBMC) were separated from the whole blood by Ficoll-Hypaque density-gradient centrifugation and stored at -70 °C for use. Five milliliters of peripheral blood was collected from negative controls.
Preparation of RNA samples and RT-PCR RNA was isolated from PBMC and lymph nodes with TRIzol reagent. Lymph nodes were collected from normal controls and gastric carcinoma patients in 1 mL of TRIzol reagent per 100 mg of tissue using power homogenizer. RNA pellet was dried and RNA dissolved in RNase-free water was stored at -70 °C for use. RNA was used as a template for amplification. Oligonucleotides as specific primers and probes for CK18 were synthesized by a company (Biotechnology, Dalian, China). As a PCR control reaction, β-actin was also detected in each run. The sequences of primers are as follows: CK18: 5’-PCR primer AAGAAAACCCGAAGAGG, 3’-PCR primer CTGACTCAAGGTGCAGC; β-actin: 5’-PCR primer GTGGGGCGCCCCAGGCACCA, 3’-PCR primer CTTCCTTAATGTCACGCACGATTTC. The expected sizes of PCR products were 402 bp for CK18 and 540 bp for β-actin. Complementary (c) DNA was synthesized using Rous-associated virus reverse transcriptase (TAKARA Biomedicals).
PCR was performed following the procedure: briefly 130 ng of RNA was used for RT-PCR. For cDNA synthesis, 130 ng in 4 μL of sample RNA solution and2 μL of oligo dT were heated at 70 °C for 5 min and cooled rapidly. After adding 1 μL of a ribonuclease inhibitor (Takara, Dalian, China), 4 μL of 2.5 mmol/L dNTP (dATP, dCTP, dGTP, dTTP, Takara, Dalian, China) and 4 μL of Rous-associated virus reverse transcriptase (Takara, Dalian, China), 10 μL of 5×PCR buffer, 25 μL of DEPC-water, the mixture was incubated at 65 °C for 60 min, and then at 95 °C for 5 min. The PCR mixture contained 25 μL of cDNA , 7.5 μL of 10×PCR buffer, 6μL of 25 mmol/L MgCl2 ,8 μL of 2.5 mmol/L dNTP, 50 μL of DEPC-water , 2 μL of 5’- and 3’-PCR primer , 0.5 μL of μ-actin and 1.0 μL of thermostable Taq polymerase (Takara, Dalian, China). The amplification was done with a DNA thermal cycler (Geneam PCR System 2400). After denaturation at 94 °C for 4 min, the amplification was conducted for 35 cycles at 94 °C for 45 s, at 55 °C for 45 s, and at 72 °C for 60 s. This was followed by a final extension for 1 min at 72 °C. Ten microliter aliquots of the product was analyzed by electrophoresis on a 2% agarose gel and visualized by UV fluorescence after being stained with ethidium bromide.
Standard of result assessment The expected sizes of PCR products were 402 bp for CK18 and 540 bp for β-actin. CK18 mRNA expression of two DNA bands in the corresponding location was positive. CK18 mRNA expression of one 540 bp band was negative (Figure 1).
Statistical analysisData were analyzed by χ2 test using Instat software. P<0.05
was considered statistically significant.
Classification standard for lymph node metastasisAccording to the 1997 International Union Contrele Cancer (UICC)/American Joint Committee on Cancer (AJCC) pN classification, PN0: without lymph node metastasis, PN1: 1-6 lymph node metastases, PN2: 7-15 lymph node metastases, PN3: >15 lymph node metastases.
RESULTSExpressions of CK18 mRNA in lymph nodes and peripheral blood are shown in Figure 1. Lymph node MM, correlation between CK18 mRNA expression in lymph nodes, peripheral blood and tissue differentiation, tumor stage and invasion are summarized in Tables 1-3.
Positive 99 0 99
Negative 34 165 199
Sum 133 165 298
Pathological diagnosisof lymph nodes(carcinoma cells)
RT-PCR(CK18 mRNA) Sum
Positive Negative
8 7 6 5 4 3 2 1
2 000
1 000
750
500
250
100
B
1 2 3 4 5 6 7 8 9
2 000
1 000
750
500
250
100
A
Table 1 Lymph node MM
Figure 1 Expression of CK18 mRNA gene in lymph nodes (A) and peripheral blood (B). Lane 1: 2-kb DNA ladder marker; lane 2: positive gastric carcinoma tissue; lanes 3-6: positive peripheral blood specimens; lanes 7 and 8: negative lymph nodes.

Xu W et al. CK18 gene in gastric carcinoma micrometastasis 6532
Table 2 Correlation between expression of CK18 mRNA in lymph nodes, peripheral blood and TNM stage
Pathologic Lymph nodes Peripheral blood
parameters n + – P n + – P
Tissue
differentiation
Well-moderate
Poor
Tumor invasion
Muscularis
Serosa
Lymph node
metastasis
Yes
No
TNM stage
I+II
III+IV
>0.05 <0.05
15 4 11 29 7 22
20 10 10 25 14 11
<0.05 >0.05
11 1 10 23 6 17
24 13 11 31 15 16
<0.05 <0.05
14 2 12 20 3 17
21 12 9 34 18 16
>0.05 <0.05
15 4 11 21 4 17
20 11 9 33 17 16
+: positive cases; –: negative cases.
Table 3 Correlation between expression of CK18 mRNA in lymph nodes, tissue differentiation and tumor invasion
Tissue differentiation >0.05
Well-moderate 31 11 20
Poor 267 122 145
Tumor invasion <0.05
Muscularis 62 12 50 (T1+T2)
Serosa 236 121 115
(T3+T4)
Pathologic CK18 mRNA expression of lymph Pparameters nodes
n Positive Negative
DISCUSSIONMicrometastasisMM spreads from primary tumor to distant secondary tumors in lymph system, blood circulat ion, bone marrow, liver, kidney, lung, and other organs during the development of malignant neoplasm in non-hematopoietic system. It often has no clinical symptoms[1,2]. Gastric carcinoma is one of the most common malignant neoplasms in China. Many patients showing lymph node metastasis of gastric carcinoma experience relapse and eventually die after curative surgery. Even those with no metastasis of gastric carcinoma ultimately die in the relapse of metastasis. The essential reason is MM, that cannot be detected. MM has become the focus in recent studies on malignant neoplasm. The growth and metastasis of gastric carcinoma are a complicated process with a variety of gene mutations. Although most carcinoma cells entering into circulation are destroyed through mechanisms such as immunization, the residual carcinoma cells can disseminate through a number of mechanisms, such as changes of cell modulation, excretion of protease,
growth of blood vessels, and increase of cell dynamics[3]. MM of malignant tumor is controlled by the positive and negative functions of a number of genes at molecule level. Successful clones of ”correlating genes of tumor metastasis” and ”restraining genes of tumor metastasis” are related with tumor metastasis. Genes at molecule level such as c-met, ras, myc and HER-2/neu, and restraining genes of tumor metastasis such as nm23, p53 and CD44 are related to tumor metastasis[4]. Loss, mutation and abnormal expression of the genes are correlated with invasive metastasis of tumor. Lymph node MM is the main pathway of gastric carcinoma MM. Lymph node MM has been considered as cancer metastasis that cannot be detected by traditional pathological methods[4]. MM foci of lymph node could be easily ignored or missed. Amplifying tumor- or tissue-specific mRNA by RT-PCR can detect tumor cells from 106 to 107 normal cells, and further detect the MM foci of lymph nodes. Patients with MM identified by RT-PCR are often in the developing stage of the disease, and symptoms are likely to turn out to be negative after the therapy. Therefore, lymph node metastasis is not only a prognosis indicator but also an indicator for assessing the effectiveness of therapy and monitoring early relapse[5]. Lymph node metastasis was not only an index of dys-outcome, but also has curative effect and monitoring earlier period relapse[3]. The hematogenous dissemination is another pathway of gastric carcinoma MM. Although the presence of carcinoma cells in blood does not necessarily lead to metastasis, entry of carcinoma cells into blood is the first step for the occurrence of tumor transfer in remote areas. Tumor cells shedding from pro-foci in perioperative or postoperative periods have spread to blood, lymph nodes, marrow or other organs even before pro-foci formation. However, it is difficult to detect metastasis in patients without clinical symptoms by traditional methods such as imaging and clinical pathology. Therefore, many researchers are dedicated in searching sensitive and specific methods to detect MM.
CK18 as a marker for micrometastasisCytokeratins (CKs) constitute the cytoskeleton of intermediate filament type in most epithelial cells. They consist of at least 20 members, designated as CK1–CK20 according to their molecular weights and isoelectric points[6,7]. Each type of epithelial cells has a rather stable CK composition, termed as CK pattern, which has been used in the identification of different epithelial tissues and their neoplasms[7]. CKs are expressed in the epithelial tissues, but not in the intermediate filament tissues (blood vessel, nerve, lymph tissues). They are continuously expressed in epithelial cells during malignant transformation and tumor formation, but not in normal lymph nodes, which provides the basis for applying CKs in diagnosing gastric carcinoma MM[8]. Molecular markers of malignant tumor MM from epithelial tissues have been explored recently[9–11]. For example, Liu et al[9] from abroad used CK20 mRNA as a marker to examine large intestine carcinoma with RT-PCR. With CK19 mRNA as a marker Ueda et al[10] examined lung carcinoma with RT-

6533 ISSN 1007-9327 CN 14-1219/ R World J Gastroenterol November 7, 2005 Volume 11 Number 41
PCR. Noguchi et al[11] examined CK19 mRNA in lymph nodes from 10 cases of gastric carcinoma with RT-PCR. Domestic researchers have detected lymph node MM of gastric carcinoma by targeting CK19, CK20 with RT-PCR technique[12,13]. Lymph node MM of gastric carcinoma by choosing CK7, CK8 with immunofluorescence stain and immunocyte chemical technique[1]. Different from other CKs, CK18 has a stricter specific distribution in epithelial cells and a specific expression in cells from glandular epithelium[14]. Therefore, if CK18 mRNA is expressed in lymph nodes from gastric carcinoma patients, it indicates the existence of tumor metastasis in lymph nodes; If CK18 mRNA is expressed in peripheral blood from gastric carcinoma patients, it indicates the possibility that metastasis has been transferred to other distant organs.
Correlation between gastric carcinoma micrometastasis and CK18 expressionRT-PCR was used in this study to detect CK18 mRNA. Results from analyzing 298 lymph nodes of gastric carcinoma and 20 lymph nodes from control group I indicate that: (1) In contrast to the findings of negative expression in all the benign pathological changes of lymph nodes, CK18 mRNA showed positive expression in gastric carcinoma tissues, indicating that RT-PCR technique has a high specificity for detecting CK18 mRNA. Expression of CK18 mRNA was detected in lymph nodes from patients with gastric carcinoma, indicating that the cancer is transferred. CK18 mRNA was positively expressed in 34 of 199 lymph nodes (17.1%), showing that RT-PCR has a high sensitivity for detecting lymph node metastasis of gastric carcinoma. As lymph node metastasis of gastric carcinoma directly affects the prognosis of gastric carcinoma patients, lymph nodes around gastric carcinoma tissues should be removed. According to UICC/AJCC new classification of lymph node metastasis of gastric carcinoma in 1997[15], 199 lymph nodes with PN0 from 35 patients with gastric carcinoma demonstrated by pathological examination in postoperative, contained 17.1% lymph node micrometastases by RT-PCR that should be classified into PN1. The main risk factors for lymph node metastasis include the size of primitive tumor, the degree of differentiation and depth of invasion[16]. Fukagawa et al [17] have found that metastasis occurs more often from tumescent growth tumors than from invasive growth tumors. The current study has revealed that lymph node MM is highly correlated with the depth of invasion (T)[18]. It was reported that patients (PT3N0) without lymph node metastasis detected by routine pathological examination have lymph node metastasis (PT3N1) detected by RT-PCR[19]. Suggesting that MM examination should be conducted for PN0 to improve the accuracy of clinical stage of gastric carcinoma, MM in peripheral blood does not necessarily develop clinical symptoms, but it correlates with biological behavior of gastric carcinoma. Zhang et al[20] demonstrated that CK20 mRNA is a marker of gastric carcinoma MM. Chausovsky et al[21] used CK20 mRNA as a target gene to examine MM of gastric carcinoma in peripheral blood from 116 patients
with malignant neoplasm, and found that CK20 mRNA is a target gene for MM of epithelial tumor. Majima et al[22] took CK19 and CK20 mRNA as target genes to examine MM in peripheral blood from 52 patients with gastric carcinoma and found that CK19 mRNA is better than CK20 mRNA as a marker. The current study detected the expression of CK18 mRNA in peripheral blood from 54 patients with gastric carcinoma and found that the positive expression was 38.9% (21/54) compared to control group II, suggesting that patients with gastric carcinoma develop MM in peripheral blood. Suppressed by the organic defense mechanism, carcinoma cells in peripheral blood are in dormant status after they disseminate into the organs. However, carcinoma cells can grow and reproduce again due to multiple factors such as aggravation of the disease which eventually lead to clinical metastasis and relapse, thus influencing prognosis. Therefore, examination of MM in peripheral blood among patients with gastric carcinoma is recommended. It helps to determine relevant assistant therapy and to evaluate prognosis. In conclusion, RT-PCR has a high specificity and sensitivity in detecting CK18 mRNA in gastric carcinoma patients and can be used to evaluate metastasis of gastric carcinoma at the molecule level.
REFERENCES1 Chen XM, Chen GY, Zhang X. The cytological examination of
cancer cells in peripheral blood of patients with gastric cancer. Zhonghua Xiaohua Zazhi 2002; 22: 481-484
2 Zheng JJ, Hu P, F JX. Clinical significance and detection of micrometastasis with gastric carcinoma. Fubu Waike 2002; 15: 63
3 Liu Y. The evaluation of PCR in diagnosis of genes with gastric carcinoma. Xibei Minzu Zazhi 2002; 23: 50-51
4 Weng DS,Ding YQ. Studying progression of gene controlling of tumor metastasis. Yixue Zongshu 2003; 9: 131-133
5 Xiao WD, Peng CH, Wang ML, Zhou YQ, Cheng H, Zhu PQ. Detecting micrometastasis of pathology negative lymph nodes with gastric carcinoma by RT-PCR. Zhongguo Puwai Jichu yu Linchuang Zazhi 2003; 10: 487-488
6 Gong YL, Zhou QH. Study progression of moleculor diagnosis of lung carcinoma micrometastasis. Zhongguo Feiai Zazhi 2002; 3: 75
7 Moll R, Löwe A, Laufer J, Franke WW. Cytokeratin 20 in human carcinomas. A new histodiagnostic marker detected by monoclonal antibodies. Am J Pathol 1992; 140: 427-447
8 Yang XW, Liu HW. Studying progression of lymph nodes with gastric carcinoma.Yixue Zongshu,2001; 7: 645
9 Lowe A, Laufer J, Franke WW. Cytokeratin 20 in human carcinomas. A new histodiagnostic marker detected by monoclonal antibodies. Chin Med J 2002, 115: 529-531
10 Ueda Y, Fujita J, Bandoh S, Hojo S, Yamaji Y, Ohtsuki Y, Dobashi N, Takahara J. Expression of cytokeratin 19 mRNA in human lung cancer cell lines. Int J Cancer 1999, 81: 939-943
11 Noguchi S,Hiratsuka M, Furukawa H, Aihara T, Kasugai T, Tamura S, Imaoka S, Koyama H, Iwanaga T. Detection o f gas t r i c cancer micrometas tases in lymph nodes
by ampl i f i ca t ion of kerat in 19 mRNA with reverse transcriptase-polymerase chain reaction. Jpn J Cancer Res 1996; 87: 650-654
12 Dong Q, Zhang YCh, Hong HQ,J BC, Xu J,Qian HQ. Detecting lymph nodes micrometastasis with gastric carcinoma by reverse transcriptase-polymerase chain reaction. Zhonghua Waike Zazhi 2000, 38: 621

Xu W et al. CK18 gene in gastric carcinoma micrometastasis 6534
Science Editor Wang XL and Guo SY Language Editor ELsevier HK
13 Lu J, Wu YG, Mu QL,Wu TH. Studying of micrometastasis of peripheral blood preoperative and postoperative with gastric carcinoma. Shandong Yiyao 2002; 42: 1-3
14 Chen YD, Liu FK, Qi XP,Li JT. The studing of bone marrow micrometastasis and proliferation in gastric carcinoma. Yixue Yanjiusheng Bao 2001; 14: 297-298
15 Roder JD, Böttcher K, Busch R, Wittekind C, Hermanek P, Siewert JR. Classification of regional lymph node metastasis from gastric carcinoma. German Gastric Cancer Study Group. Cancer 1998; 82: 621-631
16 Maehara Y,Orita H,Okuyama T,Moriguchi S,Tsujitani S, Korenaga D,Sugimachi K.Predictors of lymph node metastasis
in early gastric cancer. Br J Surg 1992; 79: 245-247 17 Fukagawa T, Sasako M, Mann GB, Sano T, Katai H, Maruyama
K, Nakanishi Y, Shimoda T. Immunohistochemically detected micrometastases of the lymph nodes in patients with gastric carcinoma. Cancer 2001; 92: 753-760
1 8 I s h i d a K , K a t s u y a m a T , S u g i y a m a A , K a w a s a k i S . I m m u n o h i s t o c h e m i c a l e v a l u a t i o n o f
l y m p h n o d e m i c r o m e t a s t a s e s f r o m g a s t r i c c a r c i n o m a s . C a n c e r 1 9 9 7 ; 7 9 : 1 0 6 9 - 1 0 7 6 .
19 Matsumoto M.Detecting lymph nodes and lymph location drawing with PN0 gastric carcinoma by reverse transcriptase-polymerase chain reaction(British). Guowai Yixue Waikexue Fence 2003; 1: 62-63
20 Zhang XW, Fan P, Yang HY, Yang L, Chen GY. Significance of detecting disseminated tumor cells in peripheral blood of gastric and colorectal cancer patients. Zhonghua Zhongliu Zazhi 2003; 25: 66-68
21 Chausovsky G, Luchansky M, Figer A, Shapira J, Gottfried M, Novis B, Bogelman G, Zemer R, Zimlichman S, Klein A. Expression of cytokeratin 20 in the blood of patients with disseminated carcinoma of the pancreas, colon, stomach, and lung. Cancer 1999; 86: 2398-2405
22 Majima T, Ichikura T, Takayama E, Chochi K, Mochizuki H. Detecting circulating cancer cells using reverse transcriptase-polymerase chain reaction for cytokeratin mRNA in peripheral blood from patients with gastric cancer. Jpn J Clin Oncol 2000; 30: 499-503

PO Box 2345, Beijing 100023, China World J Gastroenterol 2005;11(41):6535-6537www.wjgnet.com World Journal of Gastroenterology ISSN [email protected] © 2005 The WJG Press and Elsevier Inc. All rights reserved.E L S E V I E R
• ������ ������������� •������ ������������� • •
Quantitative evaluation of diffusion-weighted magnetic resonance imaging of focal hepatic lesions
Xi-Jie Sun, Xian-Yue Quan, Fan-Heng Huang, Yi-Kai Xu
© 2005 The WJG Press and Elsevier Inc. All rights reserved.
Xi-Jie Sun, Xian-Yue Quan, Fan-Heng Huang, Imaging Center, Affiliated Zhujiang Hospital of Southern Medical University, Guangzhou 510282, Guangdong Province, ChinaYi-Kai Xu, Imaging Center, Affiliated Nanfang Hospital of Southern Medical University, Guangzhou 510515, Guangdong Province, ChinaSupported by the Natural Science Foundation of Guangdong Province, China, No. 32830 and 101595Correspondence to: Dr. Xian-Yue Quan, Imaging Center, Affiliated Zhujiang Hospital of Southern Medical University, Guangzhou 510282, Guangdong Province, China. [email protected]: +86-20-61643460 Fax: +86-20-61643460Received: 2005-01-12 Accepted: 2005-01-26
AbstractAIM: To explore the quantitative analysis of diffusion-weighted magnetic resonance imaging (DWMRI) in differential diagnosis of focal hepatic lesions.
METHODS: DWMRI was performed in 149 hepatic lesions, including hepatocellular carcinoma (34 cases), hepatic metastases (37 cases), cavernous hemangioma (42 cases), hepatic cyst (36 cases). Apparent diffusion coefficient (ADC) values were evaluated using four different b values in different sequences. The ratio of ADC values of lesion/liver in hepatocellular carcinoma and hepatic metastases was also calculated.
RESULTS: The mean ADC values of hepatic lesions were as follows: hepatocellular carcinoma (0.95 ± 0.11)×10-3 mm2/s, hepatic metastasis (1.13 ± 0.21)×10-3 mm2/s, cavernous hemangioma (1.86 ± 0.36)×10-3 mm2/s, hepatic cyst (3.14 ± 0.31)×10-3 mm2/s. The ratio of ADC values in lesion/liver in hepatocellular carcinoma was 0.91± 0.11, being significantly different from that in hepatic metastasis (1.21 ± 0.18, P < 0.05).
CONCLUSION: ADC values and quantitative analysis of focal hepatic lesions are of significant values in differential diagnosis of focal hepatic lesions.
Key words: Diffusion-weighed magnetic resonance imaging; Hepatic lesion; Quantitative analysis
Sun XJ, Quan XY, Huang FH, Xu YK. Quantitative
INTRODUCTIONDiffusion-weighted magnetic resonance imaging (DWMRI) is a new technique of magnetic resonance imaging (MRI) at the level of molecular movements and can reflect the functions and structures of the body without trauma. It has been used to diagnose diseases in the central nervous system[1-3]. Radiologists have paid more attention to its values in differential diagnosis of focal hepatic lesions[4-6].This study was to evaluate the value of DWMRI in differential diagnosis of focal hepatic lesions by quantifying apparent diffusion coefficient (ADC) values.
MATERIALS AND METHODSIn this study, DWMRI was performed in 149 patients with focal hepatic lesions (31 women and 109 men, aged 24-89 years, mean 52.37 years), including 34 hepatocellular carcinomas, 37 hepat ic metastases, 42 cavernous hemangiomas, 36 hepatic cysts. The diameter of the above lesions was 1.1-20.5, 0.8-25.8, 0.9-8.6, and 0.8-2.7 cm, respectively.
The criteria for selecting the patients were as follows: (1) The diagnosis of all cases of hepatocellular carcinoma was confirmed by α-fetal protein, clinical data, ultrasound, CT or/and MR imaging, and pathology. (2) All cases of hepatic metastasis of primary malignant tumors were surgically confirmed. (3) The diagnosis of all the cases of cavernous hemangioma and hepatic cyst was confirmed by clinical data, ultrasound, CT or/and MR imaging, and follow-up observation.
DWMRI was performed by 1.5 T MR scanner with a body coil (Signa, Horizon LX, GE, USA). All data were measured in control console. All lesions were scanned with spin-echo (SE) T1WI and fast SE T2WI in the axial plane. The imaging parameters of DWMRI with SE-echo planar imaging (EPI) sequence were set as follows: repetition time ms/echo time ms: 10 000/90; matrix: 128×128; field of view: 36 cm×36 cm; section thickness: 8 mm; gap: 2 mm; slice number: 10-15; one signal. Four different b values (b=0 mm2/s, 100, 500, 1 000 mm2/s) and three directions were used, total acquisition time was 40 s.
evaluation of diffusion-weighted magnetic resonance imaging of focal hepatic lesions. World J Gastroenterol 2005; 11(41): 6535-6537http://www.wjgnet.com/1007-9327/11/6535.asp

6536 ISSN 1007-9327 CN 14-1219/ R World J Gastroenterol Novebmer 7, 2005 Volume 11 Number 41
The standards of measurement of signal intensities in hepatic lesions on DWMRI were as follows: the largest diameter of lesions was measured, three regions of interest in each lesion were marked off and measured, the regions of blood vessels and artifacts were rejected, the edges of parenchyma in the lesion were measured, when apparent necrosis was present, and regions of interest should involve parenchyma and the diameter of it should be longer than 1 cm, the same area of the section should be chosen for the measurement of different sequences, the signal intensity of each ROI was measured thrice and a mean value of SI was acquired for ADC calculation.
ADC values were evaluated with the following formula: ADC=(ln[Sl+Sh])/(bh-bl), where ln is the natural logarithm, Sl and Sh are the signal intensities of low b value and high b value, respectively.
All data were expressed as mean±SD. Statistical analysis was performed by t-test using SPSS software 10.0. P<0.05 was considered statistically significant.
RESULTSIn this study, 149 focal hepatic lesions were detected by DWMRI, the DWMRI sensitivity was 100%. We used four different b values (b = 0, 100, 500, and 1 000 mm2/s). The higher the b values on the DWMRI (b = 1 000 mm2/s). The lower the b values on DWMRI (b = 100 mm2/s), the higher the ADC values. Thus, we measured the highest b value (b = 1 000 mm2/s) on DWMRI. Table 1 shows the ADC values in focal hepatic lesions.
The ADC values in hepatic cyst were significantly higher than those in hepatic hemangioma, metastasis, and hepatocellular carcinoma, respectively; the t-test value was 2.329-3.237 (P < 0.01). There was a significant difference in ADC values of hepatic hemangioma, hepatic metastasis, and hepatocellular carcinoma, respectively, with the t-test value being 1.139-3.467 (P < 0.05). No significant difference was demonstrated between hepatic metastasis and hepatocellular carcinoma with the t-test value being 1.432 (Table 2).
The ratio of ADC values of lesion/liver between hepatocellular carcinoma and hepatic metastasis was significantly different with the t-test value being 2.328 (Table 3).
DISCUSSIONDiffusion is known as the Brownian motion caused by thermal movement of molecules, and is arbitrary and irregular. The effect of molecular diffusion movement is weak, but it can result in MR signal missing converge, the attenuation degree lies on MR gradient intensity and amplitude of molecular movement[7,8]. DWMRI is an imaging method to observe microcosmic molecular movemen t u s ing mac roscop i c a l f l ow ing pha se displacement theory. Body diffusion coefficient is affected by microcirculation factors[9], such as humoral flowing, cellular osmosis and temperature, perfusion of capillary vessels, glutinous degree and proportion of intra- and extra-cellular water, direction of cellular membrane transition. It is also affected simultaneously by macro factors and circadian function, such as breath, pulsate, and peristalsis. In fact, apparent diffusion coefficient (ADC) regularly replaces the diffusion coefficient, and is always greater than the latter[10,11].
In theory, ADC value can be obtained by one pulsate sequence using two different b values. In experimental researches and clinical applications, ADC values are constantly related to the kinds and quantities of b value in sequences and perfusion of tissue[12-14]. The bigger the b value, the more accurately the ADC value. We measured the four different b values in different sequences (b=0, 100, 500, and 1 000 mm2/s), and found that ADC values had higher stabilization with higher b values. The technique of EPI, which has a more rapid imaging speed and higher section efficiency, could complete signal collection of single images in several milliseconds and freeze-up artifact of physiological functions. Therefore, it is the commonly used diffusion imaging sequence[15-17]. We adopted images of 1 000 mm2/s as a reference to give enough attention to attenuation degrees of four different lesions.
Animal experiments and clinical researches indicate that ADC value depends on imaging materials and molecular spatial distribution[18,19]. Cavernous hemangioma and hepat ic cyst are main ly composed of l iqu id component, which has more movement freedom in the two lesions; ADC values are greater than those in hepatic parenchymatous mass. Cavernous hemangioma often presents fiber septation, scar, and hemorrhage, and the blood glutinous degree is higher than that of hydatid fluid in hepatic cyst. This is why the ADC value in hepatic cyst is lower than that in cavernous hemangioma[20-22]. Thus,
Hepatic lesion ADC value (×10-3 mm2/s)
Hepatocellular carcinoma 0.95 ± 0.11
Hepatic metastases 1.13 ± 0.21
Cavernous hemangioma 1.86 ± 0.36
Hepatic cyst 3.14 ± 0.31
Hepatic lesion Coverage Ratio of ADC values of lesion/liver
Hepatocellular carcinoma 0.73-1.05 0.91 ± 0.11
Hepatic metastases 1.07-1.43 1.21 ± 0.18
Table 3 Ratio of ADC values of lesion/liver between hepatocellular carcinoma and hepatic metastasis (mean ± SD)
Hepatic lesion b = 100 b = 500 b = 1 000Hepatocellular carcinoma 0.56-1.33 0.60-1.31 0.57-1.23
Hepatic metastases 0.75-1.62 0.71-1.59 0.72-1.35
Cavernous hemangioma 1.26-2.54 1.32-2.36 1.37-2.21
Hepatic cyst 2.70-3.85 2.73-3.71 2.78-3.51
Table 1 ADC values in focal hepatic lesions (×10–3 mm2/s)
Table 2 ADC value in focal hepatic lesions (b = 1 000 mm2/s, mean±SD)

6537
entity mass, cavernous hemangioma and hepatic cyst have significantly different ADC values. These findings are consistent with the results in our study.
Our results indicate that the different ADC values in DWMRI could differentiate hepatic cyst and cavernous hemangioma from other hepatic entity masses[23]. We also analyzed the ratio of ADC values of the lesion/liver. Statistical analysis demonstrated that ADC ratio was different between hepatocellular carcinoma and hepatic metastasis.
We believe that the ratio of ADC value of lesion/liver could differentiate hepatocellular carcinoma from hepatic metastasis, and provide some information for the diagnosis of focal hepatic lesions that are less than 3 cm in diameter. This theory is based on the situation in our country that hepatocellular carcinoma generally results from cirrhosis, but hepatic metastasis is not the case[24-26]. Although the ADC values in hepatic metastasis foci are slightly greater than those in hepatocellular carcinoma foci, the ADC values in liver parenchyma with hepatic metastasis are lower than those in hepatocellular carcinoma. Patients with hepatic metastasis have a higher ratio of ADC values of lesion/liver than those with hepatocellular carcinoma. In conclusion, DWMRI is a new functional MRI technique, and is of great value in the differential diagnosis of focal hepatic lesions.
REFERENCES1 Furukawa M, Terae S, Chu BC, Kaneko K, Kamada H,
Miyasaka K. MRI in seven cases of tacrolimus (FK-506) encephalopathy: utility of FLAIR and diffusion-weighted imaging. Neuroradiology 2001; 43: 615-621
2 Berman JI, Berger MS, Mukherjee P, Henry RG.. Diffusion-tensor imaging-guided tracking of fibers of the pyramidal tract combined with intraoperative cortical stimulation mapping in patients with gliomas. J Neurosurg 2004; 101: 66-72
3 Takeuchi M, Harada M, Hisaoka S, Nishitani H, Mori K, Sakama M. Magnetic resonance imaging and proton MR spectroscopy of the brain in a patient with carbohydrate-deficient glycoprotein syndrome type I. J Magn Reson Imaging 2003; 17: 722-725
4 Boulanger Y, Amara M, Lepanto L, Beaudoin G, Nguyen BN, Allaire G, Poliquin M, Nicolet V. Diffusion-weighted MR imaging of the liver of hepatitis C patients. NMR Biomed 2003 ; 16: 132-136
5 Bianco F, Fattapposta F, Locuratolo N, Pierallini A, Rossi M, Ruberto F, Bozzao L. Reversible diffusion MRI abnormalities and transient mutism after liver transplantation. Neurology 2004; 62: 981-983
6 Geschwind JF, Artemov D, Abraham S, Omdal D, Huncharek MS, McGee C, Arepally A, Lambert D, Venbrux AC, Lund GB. Chemoembolization of liver tumor in a rabbit model: assessment of tumor cell death with diffusion-weighted MR imaging and histologic analysis. J Vasc Interv Radiol 2000; 11: 1245-1255
7 Flemming K, Ulmer S, Duisberg B, Hahn A, Jansen O. MR spectroscopic findings in a case of Alpers-Huttenlocher syndrome. AJNR Am J Neuroradiol 2002; 23: 1421-1423
8 McCabe K, Tyler K, Tanabe J. Diffusion-weighted MRI abnormalities as a clue to the diagnosis of herpes simplex encephalitis. Neurology 2003; 61: 1015-1016
9 Au WL, Lim TC, Seow DC, Koh PL, Loh NK, Lim MS, Tan IK, Yee WC. Serial diffusion-weighted magnetic resonance imaging
in adult-onset citrullinaemia. J Neurol Science 2003; 209: 101-104
10 Inoha S, Inamura T, Nakamizo A, Ikezaki K, Amano T, Fukui M. Magnetic resonance imaging in cases with encephalopathy secondary to immunosuppressive agents. J Clin Neurosci 2002; 9: 305-307
11 Cheryauka AB, Lee JN, Samsonov AA, Defrise M, Gullberg GT. MRI diffusion tensor reconstruction with PROPELLER data acquisition. Magn Reson Imaging 2004; 22: 139-148
12 Hori M, Ichikawa T, Sou H, Tsukamoto T, Kitamura T, Okubo T, Araki T, Amemiya Y, Okamoto E, Obara M. [Improving diffusion-weighted imaging of liver with SENSE technique: a preliminary study] Nippon Igaku Hoshasen Gakkai Zasshi 2003; 63: 177-179
13 Eastwood JD, Vollmer RT, Provenzale JM. Diffusion-weighted imaging in a patient with vertebral and epidural abscesses. AJNR Am J Neuroradiol 2002; 23: 496-498
14 Byun WM, Shin SO, Chang Y, Lee SJ, Finsterbusch J, Frahm J. Diffusion-weighted MR imaging of metastatic disease of the spine: assessment of response to therapy. AJNR Am J Neuroradiol 2002 :23: 906-912
15 Chow LC, Bammer R, Moseley ME, Sommer FG. Single breath-hold diffusion-weighted imaging of the abdomen. J Magn Reson Imaging 2003 ; 18: 377-382
16 Ulmer S, Flemming K, Hahn A, Stephani U, Jansen O. Detection of acute cytotoxic changes in progressive neuronal degeneration of childhood with liver disease (Alpers-Huttenlocher syndrome) using diffusion-weighted MRI and MR spectroscopy. J Comput Assist Tomogr 2002 ; 26: 641-646
17 Blomqvist L. Preoperative staging of colorectal cancer-computed tomography and magnetic resonance imaging. Scand J Surg 2003; 92: 35-43
18 Colagrande S, Politi LS, Messerini L, Mascalchi M, Villari N. Solitary necrotic nodule of the liver: imaging and correlation with pathologic features. Abdom Imaging 2003; 28: 41-44
19 Kamel IR, Bluemke DA, Ramsey D, Abusedera M, Torbenson M, Eng J, Szarf G, Geschwind JF. Role of diffusion-weighted imaging in estimating tumor necrosis after chemoembolization of hepatocellular carcinoma. AJR Am J Roentgenol 2003 ;181: 708-710
20 Lodi R, Tonon C, Stracciari A, Weiger M, Camaggi V, Iotti S, Donati G, Guarino M, Bolondi L, Barbiroli B. Diffusion MRI shows increased water apparent diffusion coefficient in the brains of cirrhotics. Neurology 2004; 62: 762-766
21 Chan JH, Tsui EY, Luk SH, Fung AS, Yuen MK, Szeto ML, Cheung YK, Wong KP. Diffusion-weighted MR imaging of the liver: distinguishing hepatic abscess from cystic or necrotic tumor. Abdom Imaging 2001; 26: 161-165
22 Aubé C, Racineux PX, Lebigot J, Oberti F, Croquet V, Argaud C, Calès P, Caron C. [Diagnosis and quantification of hepatic fibrosis with diffusion weighted MR imaging: preliminary results] J Radiology 2004 ; 85: 301-306
23 Moteki T, Horikoshi H, Oya N, Aoki J, Endo K. Evaluation of hepatic lesions and hepatic parenchyma using diffusion-weighted reordered turboFLASH magnetic resonance images. J Magn Reson Imaging 2002; 15: 564-572
24 Glass NL, Lee L. Isolation of Neurospora crassa A mating type mutants by repeat induced point (RIP) mutation. Genetics 1992; 132: 125-33
25 Sun XJ, Quan XY, Liang W, Wen ZB, Zeng S, Huang FH, Tang M. [Quantitative study of diffusion weighted imaging on magnetic resonance imaging in focal hepatic lesions less than 3 cm] Zhonghua Zhong liu za zhi 2004; 26:165-167
26 Mürtz P, Flacke S, Träber F, van den Brink JS, Gieseke J, Schild HH. Abdomen: diffusion-weighted MR imaging with pulse-triggered single-shot sequences. Radiology 2002; 224: 258-264
Sun XJ et al . DWMRI in diagnosis of focal hepatic lesions
Science Editor Kumar M and Guo SY Language Editor Elsevier HK
PO Box 2345, Beijing 100023, China World J Gastroenterol 2005;11(41):6538-6542www.wjgnet.com World Journal of Gastroenterology ISSN [email protected] © 2005 The WJG Press and Elsevier Inc. All rights reserved.
E L S E V I E R
• ������ ������������� •������ ������������� • •
Dual effects of 8-Br-cAMP on differentiation and apoptosis of human esophageal cancer cell line Eca-109
Hong-Mei Wang, Department of Laboratory Medicine, First Affiliated Hospital of Zhengzhou University, Zhengzhou 450052, Henan Province, ChinaNai-Gang Zheng, Jing-Lan Wu, Yi-Ling Wang, Molecular Cell Biology Research Center, Zhengzhou University, Zhengzhou 450052, Henan Province, ChinaCui-Cui Gong, Laboratory Medicine Center, PLA No. 153 Hospital, Zhengzhou 450042, Henan Province, ChinaSupported by the Research Science Foundation of Henan Province, No. 2000180007Correspondence to: Dr. Jing-Lan Wu, Molecular Cell Biology Research Center, Zhengzhou University, Zhengzhou 450052, Henan Province, China. [email protected]: +86-371-66117733Received: 2004-09-18 Accepted: 2004-12-26
AbstractAIM: To investigate the effects of 8-Br-cAMP on differentiation and apoptosis of human esophageal cancer ce l l l ine Eca-109, and the re lated gene expression.
METHODS: The cultured Eca-109 cells were divided into four groups: E1 group (co-cultured with 8-Br-cAMP for 24 h); E2 group (co-cultured with 8-Br-cAMP for 48 h); C1 group (treated without 8-Br-cAMP for 24 h); and C2 group (treated without 8-Br-cAMP for 48 h). The same concentration of cell suspension of each group was dropped separately onto the slides and nitrocellulose membranes (NCM). The biotin-labeled cDNA probes for c-myc, wild-type (wt) p53, bcl-2 and iNOS were prepared for in situ hybridization. The expressions of epidermal growth factor receptor (EGFR), p38 kinase, FAS, FasL and caspase-3 were detected using immunocytochemistry, and the NOS activity and the ratio of differentiated cells/proliferating cells were examined by cytochemistry. Immunocytochemistry, cytochemistry, and in situ hybridization were separately carried out on both slides and NCM specimens for each group. In addition, TUNEL was used to detect the cell apoptosis rate in each group.
RESULTS: The apoptot ic rate of E2 group was significantly higher compared to E1 group, while there was no difference in the ratio of differentiated cells/proliferating cells between E1 and E2 groups. The signals of wt p53 and iNOS were markedly stronger, while the signals of c-myc and EGFR were obviously weaker in E1 group than those in C1 group (P<0.05). Moreover, the signals of wt p53, iNOS, p38 kinase, caspase-3 and NOS
activity were significantly stronger, whereas, the signals of bcl-2, c-myc and Fas/FasL were markedly weaker in E2 group than those in C2 group (P<0.05).
CONCLUSION: The differentiation and apoptosis of human esophageal cancer cell Eca-109 can be induced after 24- and 48-h treatment with 8-Br-cAMP, respectively. Upregulation of wt p53, iNOS and downregulation of c-myc may be associated with differentiation and apoptosis of Eca-109 cells. Furthermore, upregulation of FasL, p38 kinase and caspase-3 as well as downregulation of bcl-2, and Fas may be involved in the apoptosis of Eca-109 cells.
©2005 The WJG Press and Elsevier Inc. All rights reserved.
Key words: Differentiation; Apoptosis; Gene expression; 8-Br-cAMP; Eca-109 cell line
Wang HM, Zheng NG, Wu JL, Gong CC, Wang YL. Dual effects of 8-Br-cAMP on differentiation and apoptosis of human esophageal cancer cell line Eca-109. World J Gastroenterol 2005;11(41): 6538-6542http://www.wjgnet.com/1007-9327/11/6538.asp
INTRODUCTIONThere are two isoforms of cAMP receptor proteins, type I (PKAI) and type II (PKAII). PKAI can stimulate cell growth, while PKAII can inhibit it. Cho-Chung[1] have reported that the nontoxic 8-Br-cAMP is one of the site-selective cAMP analogs to combine with the PKAII attractively and 8-Br-cAMP could induce cancer cell differentiation via regulatory balance of the intracellular signal transducers of cAMP. It was reported that cAMP analogs or upregulation of cAMP/PKA pathway could suppress tumor malignancy through growth inhibition and differentiation induction[2,3]. In our previous studies, we found that 8-Br-cAMP could inhibit growth-related gene expressions in Eca-109 cells mainly through regulation of c-myc, epidermal growth factor receptor (EGFR), c-fos and wild-type (wt) p53 expressions; and facilitate retinoblastoma Rb44 cell differentiation mainly through iNOS gene expression[4,5]. Some studies demonstrated that the acid-denatured and methyl green-pyronin stain could be used for the identification of differentiated non-proliferating cells[6-8]. It is known that the oncogene/proto-oncogene, EGFR and c-myc can enforce cell proliferation, while the anti-oncogene, wt p53, can inhibit it; iNOS,
Hong-Mei Wang, Nai-Gang Zheng, Jing-Lan Wu, Cui-Cui Gong, Yi-Ling Wang

p38 kinase, Fas/FasL and caspase-3 are mainly associated with apoptosis, while bcl-2 is of anti-apoptotic; besides, different expression levels of the same gene may result in different effects. In this study, we aimed to investigate the effects of 8-Br-cAMP on differentiation and apoptosis of human Eca-109 cells, and to examine the alteration of related gene expressions by using in situ hybridization, immunocytochemistry and cytochemistry.
MATERIALS AND METHODSCell cultureThe human esophageal cancer cell line Eca-109 was cultured in DMEM (Gibco BRL, USA) supplemented with 100 mL/L fetal bovine serum. The Eca-109 cells were cultured with 2×10⁻⁵ mol/L of 8-Bromo-cAMP (Sigma, USA) for 24 h as the experimental 1 (E1) group and for 48 h as the experimental 2 (E2) group. The Eca-109 cells were cultured with the same medium without any drug for 24 h as the control 1 (C1) group and for 48 h as the control 2 (C2) group.
Preparation of specimenThe cultured cell suspension (1×10⁶ cells) of each group was dropped onto the pretreated slides and then the slides were dried, followed by fixation with 20-40 g/L paraformaldehyde and stored at -20 °C.
Furthermore, the cultured cell suspension (1×10⁶
cells) of each group was dropped onto the nitrocellulose membrane (NCM, ProtranTM, USA) pretreated with 20 × SSC for dot blot hybridization or with RNase-free water for immunodot blotting, and then NCM specimens were dried and stored at -20 °C.
Labeling and sensitivity detection of cDNA probesThe denatured cDNAs of wt p53, c-myc, bcl-2, and iNOS were labeled with biotin-11-dUTP (Sigma, USA) by random primer system (Promega, USA), and the sensitivity of each probe was detected using DNA dot blotting.
In situ hybridizationAfter being pretreated with 5 mg/mL final concentration of proteinase K (Promega, USA) for 10 min, post-fixation with paraformaldehyde and pre-hybridization without the cDNA probes for 3 h, the slide specimens of each group were hybridized with each kind of cDNA probes in final concentration of 0.5 µg/mL at 42 °C overnight. Then the slides were stringently washed four times with 0.1× SSC at 42 °C for 15 min. The streptavidin-alkaline phosphatase (dilution 1:1 000, Promega, USA) was added onto the slides after blocking with 10 g/L acetylated BSA. The nitroblue tetrazolium and 5-bromo 4-chloro 3-indole phosphate (NBT-BCIP, Promega, USA) were used as the substrate to develop the signals in bluish-violet color. For detection of intact cell using dot blot hybridization, the NCM specimens were first rinsed rapidly with chloroform, followed by treating at 80 °C under vacuum for 2 h and subsequently treated basically as aforementioned procedures for the slides.
ImmunocytochemistryThe slide specimens of respective groups were treated with 3 g/L Triton X-100/PBS for 10 min, 30 mL/L H2O2
5 min, 0.01 mol/L citrate buffer (pH 6.0) at 95 °C for10 min, washed with 1× PBS after each step. The slides were treated with 100 mL/L normal goat serum for 2 0 m i n, followed by incubation with the primary mAbs against EGFR (Sigma, USA) for E1 and C1 groups, and against p38 kinase and caspase-3 (Invitrogen, USA) for E2 and C2 groups at a dilution of 1:100 at 4 °C overnight. The HRP-labeled or alkaline phosphatase-labeled goat anti-mouse serum was added onto the slides for 1 h as the secondary antibody. The slides were thoroughly washed with PBS after treatment with respective antibodies. The DAB/H2O2 was used as the substrate to develop the positive signals in brownish color, while NBT/BCIP was used as the substrate to develop bluish-violet color. The specific primary antibodies were replaced by PBS for the negative controls. For detection of immunodot blotting, the NCM specimens were treated using the above procedures except for substitution of 0.5 g/L Tween 20 in TBS (Tris-Cl buffer saline) for PBS.
CytochemistryThe slides of each group were incubated with phosphate buffer (PB) containing 1.0 mg/mL reduced form of NAD 1 (co-enzyme 1) and 0.5 mg/mL NBT at 37 °C for 1.5 h. The negative control was performed simultaneously except for the addition of PB alone.
Ratio of differentiated cells/proliferating cellsThe slides of each group were re-fixed with ice-cold Carnoy’ s fixative for 15 min, followed by digestion of intra-nuclear DNA with 1 mol/L HCL in 800 mL/L ethanol for 5 min. The slides were stained with 5 g/L methyl green and pyronin GS (BDH, UK) in an acetate buffer (pH 4.8) for 5-7 min, subsequently washed with D.H2O and acetone.
Detection of apoptosis rate by TUNELThe slides of each group were treated with 50 mg/mL levamizol in ethanol for 15 min, followed by digestion with proteinase K and post-fixation with paraformaldehyde. Then the slides were incubated with 1 mg/mL terminal deoxyribonucleotidyl transferase (TdT, Promega, USA), biotin-11-UTP (Sigma, USA) and dNTP in TdT buffer at 4 °C overnight. The following procedures were performed similarly as those for in situ hybridization. The negative control was carried out at the same time except for incubation with TdT buffer alone in the total incubation substrate.
Statistical analysisEach kind of dot blotting was repeated six times. The dot blotting in violet color was scanned at 560 nm by thin-layer chromatography scanner (Shimada, Japan), and that in brownish color was scanned at 420 nm. The signal intensity in slide specimens was calculated as
Wang HM, et al. Effects of 8-Br-cAMP on Eca-109 cell differentiation and apoptosis 6539

total integration value in more than 100 cells under oil-microscope. The data were analyzed with SSPS 10. A P value less than 0.05 was considered statistically significant.
RESULTSThe sensitivity of each kind of biotin-labeled cDNA probe, including wt p53, c-myc, bcl-2, and iNOS, could approach to 1.0 ng/L as detected by DNA dot blotting. The apoptotic signals in violet color were localized in the nuclei mostly translocated towards cell periphery. The cell apoptosis rate and the ratio of differentiated cells (D)/proliferating cells (P) in each group are shown in Table 1 and Figures 1 A-D.
The results showed that there was a significant difference in apoptosis whereas no significant difference in differentiation between E1 and E2 groups.The signals of both in situ hybridization (gene transcription of c-myc, wt p53 and iNOS) and EGFR-immunoreactivity (IR) were all localized in the cytoplasm. The hybridization signals appeared as violet color granules; the signal intensity of wt p53 and iNOS in E1 group was markedly higher than that in the C1 group, whereas that of c-myc and EGFR in E1 group was significantly lower than that in the C1 group. The scanning values on NCM specimens for each kind of signals are shown in Table 2.
Table 2 Comparison of signal scanning values on NCM between E1 group and C1 group (mean±SD)
Groups c-myc mRNA Wt p53 mRNA iNOS mRNA EGFR-IR
E1 group 3.38 ± 0.99 2.74 ± 0.83 4.52 ± 0.74 2.37 ± 1.05C1 group 5.18 ± 1.39 0.38 ± 0.27 2.63 ± 0.13 4.38 ± 0.48
P < 0.05, E1 vs C1 for each signal.
The hybridization signals in violet-colored granules
of c-myc, wt p53 and iNOS were localized in the cytoplasm, while that of Fas-IR and FasL-IR were located surrounding the cytomembrane. The signal intensity of bcl-2, c-myc gene expression and Fas/FasL-IR was obviously decreased in E2 group as compared to C2 group, while that of wt p53 and iNOS was markedly increased in E2 group as compared to C2 group. The scanning values of each signal on NCM specimens are shown in Table 3.
The brownish-colored granules of caspase-3 IR were scattered in the cytoplasm, the signal intensity of E2 group was obviously higher than that of C2 group. In C2 group, the p38-IR staining appeared as yellow-brownish colored granules in the cytoplasm, while in E2 group, the p38-IR staining with stronger intensity was mostly located in the nuclei (the activated p38 kinase translocated from cytoplasm into nuclei). The violet-colored NOS activity located in the cytoplasm was markedly increased in E2 group as compared to C2 group (Table 4).
DISCUSSIONIt is well known that DNA can be stained by methyl green, and RNA by pyronin in cytochemistry. Sen et al [8] demonstrated that the proliferating cells were different ia l ly s ta ined by methyl g reen in bluish-
Table 3 Comparison of signal scanning values on NCM between E2 group and C2 group (mean±SD)
Groups bcl-2 c-myc iNOS Wt p53 Fas/FasL-I
P < 0.05, E2 vs C2 for each signal.
mRNA mRNA mRNA mRNA RE2 group 1.36 ± 0.54 1.72 ± 0.76 5.47 ± 0.35 4.76 ± 1.28 2.69 ± 0.73C2 group 3.49 ± 1.53 5.22 ± 1.44 2.65 ± 1.22 0.42 ± 0.28 4.17 ± 0.92
Table 4 Comparison of total integration of signal intensities for p38-IR, caspase-3-IR and NOS activity between E2 and C2 groups
Group p38-IR Caspase-3 IR NOS activity
P < 0.05, E2 vs C2 for each signal.
E2 group 184 348 302C2 group 122 207 138
Figure 1 A :HCl denaturation and methyl green-pyronin staining of differentiated Eca-109 cells (×1 000); B: HCl denaturation and methyl green-pyronin staining of proliferating Eca-109 cells (×1 000); C: TUNEL assay showing apoptotic Eca-109 cells (×1 000); D:TUNEL assay showing non-apoptotic Eca-109 cells (×1 000).
Table 1 Apoptosis rate and ratio of differentiated cells (D)/proliferating cells (P) in each group
E1 group C1 group E2 group C2 group
Apoptosis rate 16%a 3.0% 54%c 4.0%Ratio of D/P 1.7 (63/37)e 0.2 (17/83) 2.3 (70/30)g 0.16 (14/86)
Apoptosis rate: aP<0.05 vs C1 and E2 groups; cP<0.05 vs C2 group. Ratio of D/P:eP<0.05 vs C1, gP<0.05 vs C2.
6540 ISSN 1007-9327 CN 14-1219/ R World J Gastroenterol November 7, 2005 Volume 11 Number 41
A B
C D

green color and the differentiated cells were stained mainly by pyronin in red color, since the nuclear DNA of prol iferat ing cel ls was less sensit ive to hydro lys i s w i th hydroch lor i c ac id as compared to the differentiated cells. In this study, the ratio of differentiated cells/proliferating cells had no significant difference between E1 and E2 groups, the effect of cell differentiation or proliferation inh ib i t ion could be demonstra ted ear l i e r in E1 group induced with 8-Br-cAMP for 24 h. However, there was a significant difference in the apoptosis rate between E1 and E2 groups.
It was reported that the activation of EGFR, c-myc oncogene, and inactivation of wt p53 tumor suppressor gene could be detected in the development of squamous cell carcinoma of the esophagus[9]. The wt p53 encoded by wt p53 tumor suppressor gene antagonized cell cycle progression to inhibit cell growth with contrary effect to EGFR and c-myc through p21waf1, which was elucidated in our previous study[4]. It is known that the EGF receptor in the esophageal cancer, homologous to v-erbB, is a truncated form of EGFR with deletion of extra-cellular ligand domain, and a persistent tyrosine kinase activity displayed to stimulate the cancer cell growth independent of EGF ligand. The c-myc proto-oncogene encodes transcriptional regulator; upregulation of myc enforces cell growth; while abrupt downregulation of myc or withdrawal of any growth cytokine from environmental factors may have an association with cell differentiation and apoptosis[10]. In this experiment, downregulation of myc may be associated with decreased expression of EGFR. The precise mechanism of myc-induced pathways to contribute to apoptotic response is still largely unsolved[11].
It was found that multifunctional gene p53 could be involved in cell differentiation and apoptosis in malignant tumors[12]. Schwartz et al[13] reported that the osteoblasts in an osteosarcoma cell line could be induced by p53 to produce osteocalcin product. Tsumamoto et al [14] indicated that NO could induce cell differentiation in the rat retinal ganglion cells. Our previous study showed that NO and NOS could induce the retinoblastoma HXO-Rb44 cells towards differentiation with enhanced enolase expression[5]. The wt p53 could be upregulated by NO[15]; and apoptosis of human carcinoma cells could be induced by inducible NOS expression[16,17]. The exogenous wt p53 at higher level could inhibit proliferation of K562 cells and induce apoptosis; but could induce the cell differentiation at lower p53 level[18]. Similarly, the NO, product of NOS, in a small amount could involve cell protection, while a great amount of NO could cause cytotoxicity or apoptosis[19]. Interestingly, in this study, we observed that downregulation of EGFR and c-myc and upregulation of wt p53 and iNOS in E1 group (after treatment with 8-Br-cAMP for 24 h) might be associated with differentiation; and further downregulation of c-myc and upregulation of wt p53 and iNOS in E2 group (after treatment with 8-Br-cAMP for 48 h) might be associated with apoptosis in Eca-109 cells.
Our previous study demonstrated that the decreased ratio of bcl-2/bax expression was associated with inhibition of cell apoptosis. The downregulation of anti-apoptotic bcl-2 could cause the cells sensitive to apoptosis, and p53 could inhibit the bcl-2 expression and promote expression of pro-apoptotic Fas; besides, bcl-2 could participate in NO-mediated and p53-mediated apoptosis[14]. The Fas has been shown as a target gene for transcription and activation by p53[20]. The combination of Fas with FasL could participate in apoptosis of tumors, such as ovarian cancer, etc.[21]. In this experiment, the decreased Fas/FasL ratio implicated that the decreased Fas with increased FasL might be induced by 8-Br-cAMP after 48 h of treatment.
Among the mitogen-activated protein kinase (MAPK) family, the p38-MAPK has been reported to be involved in apoptosis, while ERK-1 oppositely stimulated cell growth; and the p53 could be activated by p38 through N-terminal serine in p53 phosphorylated by p38-MAPK[22]. Kim e t a l[23] indicated that NO-induced p38 kinase activity was an induction signal for apoptosis of chondrocytes in association of p53 accumulation, caspase-3 activation and differentiation status. The caspase-3 is a downstream effector member in the caspase family, playing a role in the final common pathway of apoptosis. It was reported that Fas could induce apoptosis through caspase effector pathway directly, not necessary to be gene-mediated[24]. Our results suggested that 8-Br-cAMP-induced Eca-109 cel l apoptosis might mainly be mediated through downregulation of bcl-2 by wt p53 and upregulation of wt p53 by p38 kinase; or wt p53-mediated Fas/NO effector pathway may finally come to the common pathway of activated caspase-3. Hence, upregulation of wt p53 may play an important role, synergistically in combination with regulation of related gene expressions to form a regulatory network involved in Eca-109 cell differentiation and apoptosis. Understanding of the regulatory network may contribute to providing novel strategy and bright insight for cancer therapy.
REFERENCES1 Cho-Chung YS. Role of cyclic AMP receptor proteins in
growth, differentiation, and suppression of malignancy: new approaches to therapy. Cancer Res 1990; 50: 7093-7100
2 Carlson CC, Burnham LL, Shanks RA, Dransfield DT. 8-Cl-adenosine induces differentiation in LS174T cells. Dig Dis Sci 2001; 46: 757-764
3 Chen TC, Hinton DR, Zidovetzki R, Hofman FM. Up-regula-tion of the cAMP/PKA pathway inhibits proliferation, induces differentiation, and leads to apoptosis in malignant gliomas. Lab Invest 1998; 78: 165-174
4 Chen KS, Zheng NG, Wu JL, Ding Y, Wang YL. Effects of 8-Br-cAMP on growth related gene expressions in human esophageal cancer Eca-109 cells. Acta Anatomica Sinica 1999; 30: 227-229
5 Deng X, Wu J, Guo X, Han X, Ding X. Effect of 8-bromo-cyclic AMP on neuron specific enolase, heat shock protein, nitric oxide, nitric oxide synthase and nitric oxide synthase mRNA in human retinoblastoma HXO-Rb44 cells and cell differentia-tion. Chin Med J (Engl) 2000; 113: 198-200
6 Iseki S, Mori T. Methyl green-pyronin stain distinguishes proliferating from differentiated nonproliferating cell nuclei
Wang HM, et al. Effects of 8-Br-cAMP on Eca-109 cell differentiation and apoptosis 6541

after acid denaturation of DNA. J Histochem Cytochem 1986; 34: 683-687
7 Chen KS,Zhang LQ,Wang HM, Wang YL, Wu JL. Effects of,Wang HM, Wang YL, Wu JL. Effects ofWang HM, Wang YL, Wu JL. Effects of 8-Br-cAMP on human esophageal cancer Eca-109 cell growth and differentiation, J Henan Med Univ 1998; 33: 99-101
8 Sen JY, Huang QY, Gao HY, Liu YL, Cheng CF. Modification and application of methyl green-pyronin stain after acid dena-turation of DNA. Progress Anat Sci 1999; 5: 272-273
9 Mandard AM, Hainaut P, Hollstein M. Genetic steps in the development of squamous cell carcinoma of the esophagus. Mutat Res 2000; 462: 335-342
10 Mata-Greenwood E, Cuendet M, Sher D, Gustin D, Stock W, Pezzuto JM. Brusatol-mediated induction of leukemic cell dif-ferentiation and G(1) arrest is associated with down-regulation of c-myc. Leukemia 2002; 16: 2275-2284
11 Nilsson JA, Cleveland JL. Myc pathways provoking cell sui-cide and cancer. Oncogene 2003; 22: 9007-9021
12 Mezencev R, Kohút A. [Apoptosis, tumor phenotype and pathogenesis of malignant tumors] Cesk Fysiol 2004; 53: 48-65
13 Schwartz KA, Lanciloti NJ, Moore MK, Campione AL, Chan-dar N. p53 transactivity during in vitro osteoblast differen-tiation in a rat osteosarcoma cell line. Mol Carcinog 1999; 25: 132-138
14 Tsumamoto Y, Yamashita K, Takumida M, Okada K, Mukai S, Shinya M, Yamashita H, Mishima HK. In situ localization of nitric oxide synthase and direct evidence of NO production in rat retinal ganglion cells. Brain Res 2002; 933: 118-129
15 Kitamura Y, Kamoshima W, Shimohama S, Nomura Y, Tani-guchi T. Nitric oxide donor-induced p53-sensitive cell death is enhanced by Bcl-2 reduction in human neuroblastoma cells.
Neurochem Int 1998; 32: 93-10216 Hajri A, Metzger E, Vallat F, Coffy S, Flatter E, Evrard S, Mar-
escaux J, Aprahamian M. Role of nitric oxide in pancreatic tumour growth: in vivo and in vitro studies. Br J Cancer 1998; 78: 841-849
17 Li L, Heldin NE, Grawé J, Ulmsten U, Fu X. Induction of apoptosis or necrosis in human endometrial carcinoma cells by 2-methoxyestradiol. Anticancer Res 2004; 24: 3983-3990
18 Liang M, Chen YZ, Wu Y, Yang XW, Lu LH. [Effects of Exog-enous Wild-Type p53 Gene on K562 Cells] Zhongguo Shi Yan Xue Ye Xue Za Zhi 2001; 9: 119-123
19 Alexander B. The role of nitric oxide in hepatic metabolism. Nutrition 1998; 14: 376-390
20 Kannan K, Amariglio N, Rechavi G, Givol D. Profile of gene expression regulated by induced p53: connection to the TGF-beta family. FEBS Lett 2000; 470: 77-82
21 Ghahremani M, Foghi A, Dorrington JH. Activation of Fas ligand/receptor system kills ovarian cancer cell lines by an apoptotic mechanism. Gynecol Oncol 1998; 70: 275-281
22 Sanchez-Prieto R, Rojas JM, Taya Y, Gutkind JS. A role for the p38 mitogen-acitvated protein kinase pathway in the transcriptional activation of p53 on genotoxic stress by chemo-therapeutic agents. Cancer Res 2000; 60: 2464-2472
23 Kim SJ, Ju JW, Oh CD, Yoon YM, Song WK, Kim JH, Yoo YJ, Bang OS, Kang SS, Chun JS. ERK-1/2 and p38 kinase oppo-sitely regulate nitric oxide-induced apoptosis of chondrocytes in association with p53, caspase-3, and differentiation status. J Biol Chem 2002; 277: 1332-1339
24 Fridman JS, Lowe SW. Control of apoptosis by p53. Oncogene 2003; 22: 9030-9040
Science Editor Kumar M , Li WZ and Guo SY Language Editor Elsevier HK
6542 ISSN 1007-9327 CN 14-1219/ R World J Gastroenterol November 7, 2005 Volume 11 Number 41

PO Box 2345, Beijing 100023, China World J Gastroenterol 2005;11(41):6543-6548www.wjgnet.com World Journal of Gastroenterology ISSN [email protected] © 2005 The WJG Press and Elsevier Inc. All rights reserved.E L S E V I E R
• ������ ������������� •������ ������������� • •
Discovery and analysis of pancreatic adenocarcinoma genes using cDNA microarrays
Gang Jin, Xian-Gui Hu, Yan Tang, Rui Liu, Yi-Jie Zhang, Zai-Ping Jing, Department of General Surgery, Changhai Hospital, Second Military Medical University, Shanghai 200433, ChinaKang Ying, Yi Xie, Yu-Min Mao, State Key Laboratory of Genetic Engineering, Institute of Genetics, School of Life Science, Fudan University, Shanghai 200433, ChinaSupported by the National Natural Science Foundation of China, No. 30000160Correspondence to: Jin Gang, Department of General Surgery, Changhai Hospital, Second Military Medical University, Shanghai 200433, China. [email protected]: +86-21-25070566 Fax: +86-21-65492727Received: 2004-12-07 Accepted: 2005-01-05
AbstractAIM: To study the pathogenetic processes and the role of gene expression by microarray analyses in expediting our understanding of the molecular pathophysiology of pancreatic adenocarcinoma, and to identify the novel cancer-associated genes.
METHODS: Nine histologically defined pancreatic head adenocarcinoma specimens associated with clinical data were studied. Total RNA and mRNA were isolated and labeled by reverse transcription reaction with Cy5 and Cy3 for cDNA probe. The cDNA microarrays that represent a set of 4 096 human genes were hybridized with labeled cDNA probe and screened for molecular profiling analyses.
RESULTS: Using this methodology, 184 genes were screened out for differences in gene expression level after nine couples of hybridizations. Of the 184 genes, 87 were upregulated and 97 downregulated, including 11 novel human genes. In pancreatic adenocarcinoma tissue, several invasion and metastasis related genes showed their high expression levels, suggesting that poor prognosis of pancreatic adenocarcinoma might have a solid molecular biological basis.
CONCLUSION: The application of cDNA microarray technique for analysis of gene expression patterns is a powerful strategy to identify novel cancer-associated genes, and to rapidly explore their role in clinical pancreatic adenocarcinoma. Microarray profiles provide us new insights into the carcinogenesis and invasive process of pancreatic adenocarcinoma. Our results suggest that a highly organized and structured process of tumor invasion exists in the pancreas.
©2005 The WJG Press and Elsevier Inc. All rights reserved.
Key words: Pancreat i c adenocarc inoma; cDNA microarrays; Cancer-associated genes
Jin G, Hu XG, Ying K, Tang Y, Liu R, Zhang YJ, Jing ZP, Xie Y, Mao YM. Discovery and analysis of pancreatic adenocarcinoma genes using cDNA microarrays. World J Gastroenterol 2005;11(41): 6543-6548http://www.wignet.com/1007-9327/11/6543.asp
INTRODUCTIONPancreatic carcinoma is the 12th most common cause of cancer death in China, which is one of the most aggressive form of human tumors and is virtually incurable. Its incidence and mortality rates are almost identical, even after receiving surgical resection and adjuvant chemo-radiotherapy, the overall 5-year survival rate is only 4.1%[1]. The etiology of pancreatic carcinoma is still unknown. There is clearly a need for novel and more effective diagnostic and therapeutic methods.
Oncog enes i s and deve lopment o f neop l a sm is a complex mult iphase process, which involves overexpression of oncogenes or inactivation of tumor suppressor genes, mutation or depletion of normal genes, pleiotropic effects and immunologic function. The genes are involved in vital processes of life, such as gene expression accommodation, immunology or cell differentiation, which are arranged in some gene clusters, in which all the members are being controlled in unity[2]. In the process of oncogenesis, there may exist some different clusters of tumor-related genes. Hence, it is important to find such unique gene clusters involved in carcinogenesis, invasion and metastasis processing.
Current focus of molecular profiling is the large-scale analysis of gene expression using new DNA array technology[3]. This powerful technology is being used to study many biological processes. The experimental or clinical goals range from insights to pathogenesis, cancer diagnosis and prediction of clinical outcome for identification of therapeutic targets. In this way, DNA array analysis is providing the first glimpse of a substantial improvement in our understanding of cancer biology and diagnosis. Identifying and sequencing a set of full-length cDNAs that represent all human genes would help in both gene discovery and functional analysis. It offers a
Gang Jin, Xian-Gui Hu, Kang Ying, Yan Tang, Rui Liu, Yi-Jie Zhang, Zai-Ping Jing, Yi Xie, Yu-Min Mao

great opportunity to study the pathogenetic processes and molecular pathophysiology of pancreatic carcinoma.
I n t h i s s t u d y, we a n a l y z e d n i n e p a n c r e a t i c adenocarcinomas using the cDNA microarray containing 4 096 human genes with the aim of understanding expression patterns and searching for carcinogenesis-related gene clusters and novel useful markers for the malignant potential of pancreatic carcinoma at the molecular level.
MATERIALS AND METHODSPatients and tissue specimensWe analyzed samples of pancreatic head adenocarcinoma from nine patients (five males, four females, 51-71 years) who underwent pancreaticoduodenectomy at Changhai Hospital, Shanghai, China, between November 1999 and May 2000. All samples were collected with informed consent and Ethics Committee approval. Samples were grossly dissected and snap-frozen in liquid nitrogen within 10 min of removal and stored at -80 °C. Initial diagnosis of each sample from the frozen section was later confirmed by detailed analysis of paraffin-embedded sections. Following the fourth Japanese edition of the Classification of Pancreatic Carcinoma (Japan Pancreas Society, 1993), the nine tumors were staged, including two stage I, two stage II, four stage III and one stage IVa. We isolated and purified total RNA from pooled, noncancerous, male adult human pancreas tissues and used as a reference “normal” sample for each microarray experiment.
RNA isolationTumor and normal tissue samples were ground into a fine powder in a 10-cm ceramic mortar (RNase-free) and total RNA was extracted according to the original single-step extraction procedure with slight modifications. Ground tissue was homogenized in Solution D containing 1% ß-mercaptoethanol. After centrifugation, the supernatant was extracted twice with an equal volume of phenol:chloroform (1:1) and once with an equal volume of acidic phenol:chloroform (5:1), discarding the organic phase each time. The aqueous phase was then precipitated by an equal volume of isopropylalcohol at 4 °C, centrifuged to pellet the RNA and dissolved in deionized (Milli-Q) H2O. mRNA was purified using an Oligotex-dT mRNA Midi Kit (Qiagen, Inc., Carlsbad, CA, USA), following the manufacturer’s instructions. The RNA concentration was measured by using spectrophotometry, and its integrity was assessed by electrophoresis on formaldehyde-agarosegel.
MicroarraysThe construction of the microarrays was carried out following Stanford University’s method[4]. The microarrays consist of 4 096 sequences, including full-length and partial complementary DNAs (cDNAs) representing novel, known and control genes provided by United Gene Holdings, Ltd. The known genes were selected from NCBI UniGene set and cloned into a plasmid vector.
6544 ISSN 1007-9327 CN 14-1219/ R World J Gastroenterol November 7, 2005 Volume 11 Number 41
The novel genes were obtained through systematic full-length cloning efforts carried out at United Gene Holding, Ltd. The control spots of non-human origin in 4 096 chip included the rice U2 RNA gene (8 spots), hepatitis C virus (HCV) coat protein gene (8 spots), and spotting solution alone without DNA (32 spots). The cDNA inserts were amplified by PCR using universal primers and then purified. All PCR products were examined by electrophoresis on an agarose gel to ensure the quality and identity of amplified clones as expected. Then the amplified PCR products were dissolved in a buffer containing 3× SSC solution. The solutions with amplified PCR products were spotted onto silylated slides (CEL Associates, Houston, TX, USA) using a Cartesian PixSys 7 500 motion control robot (Cartesian Technologies, Irvine, CA, USA) fitted with ChipMaker Micro-Spotting Technology (TeleChem International, Sunnyvale, CA, USA). Glass slides with spotted cDNA were then hydrated for 2 h in 70% humidity, dried for 0.5 h at room temperature, and UV cross-linked at a dose of 65 mJ/cm. They were further treated with 2 g/L sodium dodecyl sulfate (SDS) for 10 min, distilled H2O for 10 min, and 2 g/L sodium borohydride (NaBH4) for 10 min at room temperature. The slides were dried again and made ready for use.
Probe preparation and hybridizationThe fluorescent cDNA probes were prepared through reverse transcription of the isolated mRNAs and then purified. The RNA samples from healthy individuals were labeled with Cy3-dUTP and those from cancerous patients with Cy5-dUTP. The two color probes were then mixed, precipitated with ethanol and dissolved in 20 µL of hybridization solution. Microarrays were pre-hybridized with hybridization solution containing 0.5 mg/mLdenatured sa lmon sper m DNA at 42 °C for 6 h . Fluorescent probe mixtures were denatured at 95 °C for5 min, and the denatured probe mixtures were applied onto the pre-hybridized chip under a cover glass. Chips were hybridized at 42 °C for 15-17 h. The hybridized chips were then washed at 60 °C for 10 min each in solutions of 2× SSC and 2 g/L SDS, 0.1× SSC and 2 g/L SDS, and 0.1× SSC, and then dried at room temperature.
Data analysisThe chips were scanned with a ScanArray 3000 (GSI Lumonics, Billerica, MA, USA) at two wavelengths to detect emission from both Cy3 and Cy5. The acquired images were analyzed using ImaGene 3.0 software (BioDiscovery, Inc. , Los Angeles, CA, USA). The intensities of each spot at the two wavelengths represent the quantity of Cy3-dUTP and Cy5-dUTP, respectively, hybridized to each spot. Ratios of Cy3-Cy5 were computed for each location on each microarray. Overall intensities were normalized with a correction coefficient obtained using the ratios of 40 housekeeping genes (available at http://www.biodoor.com/).
We used the threshold value to define significant re lat ive express ion changes, which set at 2 .0 for overexpression and at 0.50 for underexpression on the

Jin G et al. cDNA microarrays in pancreatic adenocarcinoma 6545
basis of both the experimental variability in our data andthe manufacturer’s established performance criteria. Data filtering with this algorithm identified the genes overexpressed at least by twofold and underexpressed at least by 50% across, more than 66.7% (6/9) of all specimens. To minimize artifacts arising from low expression values, only the genes with raw intensity values for both Cy3 and Cy5 of >600 counts were chosen for differential analysis.
RESULTSSensitivity and reproducibility of the microarray systemThe purity and concentration of isolated RNA were analyzed f irst by using UV spectrophotometer at absorbance wavelengths of 260 and 280 nm (A260 and A280). The average A260/A280 ratio was higher than 1.9. Furthermore, the integrity of the RNA sample was verified by electrophoresis on 10 g/L agarose gel stained with ethidium bromide. The quality of the RNA was assessed by the visualization of the 28S and 18S ribosomal RNA bands. The bands were distinct and sharp, without being diffused and smeared. The results indicated that mRNA preparation expressed continuous polyadenylated transcripts between 0.9 and 4.0 kb in length.
In order to access the “noise” in the differential express ion assay, we employed se l f -compar ison experiments. A sample of mRNA from a single fetal liver tissue was divided into two equal aliquots and labeled with Cy3-dUTP and Cy5-dUTP, respectively. The labeled samples were then mixed together and hybridized to the microarray. The results revealed that approximately 1% of the 4 096 cDNA clones showed more than 2.0-fold difference in signal intensity between the two channels. Furthermore, this “noise” in the data was shown upon analysis to occur at random array positions in each microarray experiment. Figure 1 shows the scatter plots of the within-slide normalization experiment. The Cy3/Cy5 log ratios from the different print tip groups were centered around zero, indicating that the types of systematic errors were minimized. The spots in the experiments showed a highly concordant distribution pattern. Besides, hybridization experiments with probes prepared from human mRNA produced little or no signal at the positions of the negative controls (data not shown).
Gene expression analysis in patients with pancreatic adenocarcinomaThe hybridizations for each individual were repeated twice. Of all the 4 096 human genes analyzed through microarray experiments, a total of 184 genes (4.5%) revealed differential expression in more than 60.66% (6/9) of the pancreatic adenocarcinoma specimens using a fold ratio of >2 as criteria for cut-off. Of 184 genes, the expression of 87 genes (47.3%) was markedly increased in pancreatic adenocarcinoma tissues as compared with the normal pancreas tissues (Figure 1). In addition, the expression of 97 genes (52.7%) was significantly decreased in pancreatic adenocarcinoma tissues as compared with normal pancreatic tissues (Figure 2). The 184 genes corresponded to 173 genes represented in the GenBank and 11 novel sequences which have not been found in the GenBank. Scatter plots with cancerous tissues showed a wide distribution pattern (Figure 2), suggesting that genes are expressed differentially in cancer cells when compared with the normal cells. Scatter plot of the values of Cy3 and Cy5 fluorescent signals also revealed a pattern of tight distribution and clustered in an almost 45° diagonal line as expected.
In the 11 novel genes screened by our microarray experiments, an overexpressed clone in pancreatic adenocarcinomas was identified. The average Cy5/Cy3 ratio of the clone is 4.92. As we have reported recently[5], this clone is the full-length cDNA of the human gene S100P (GenBank accession number AF539739). The sequence is of 1 297 bp and encodes a protein identical to previously characterized human S100P, but it is much longer than the previously reported 439 bp. The cDNA is near full-length as confirmed by Northern blot analysis. We examined its distribution in tissues by using Northern blot and RT-PCR analysis, and found that it was abundantly expressed in many tissues including placenta, unlike the expression pattern of other S100 family genes.
DISCUSSIONDNA microarray technology has offered us a new insight into the secrets of life by monitoring the activities and
Figure 1 Scatter plots of average ratio/spot label distribution.
Figure 2 Microarray scatter plot for pancreatic adenocarcinoma mRNA labeled with Cy5 and normal pancreas mRNA labeled with Cy3. The “sameness line” drawn at a 45° angle denotes a 1:1 ratio of signal intensity between the Cy3 dye (Y axis) and the Cy5 dye (X axis) at each position on the array.
0 5 00 1000 1500 2 500 3 500 4 0003 0002 000
-100
-80
-60
-40
-20
0
Log
ratio
Index
6 000
3 000 6 0005 0004 0002 0001 0000
5 000
0
1 000
2 000
3 000
4 000
F653
Med
ian-
B653
F532 Median-B532

profiles of thousands clones simultaneously. The gene expression profiles can led us to mapping a cross-section of genetic activities and biological entity[6].
In this experiment, the genes identified as differentially expressed in microarrays revealed a wealth of information that pancreatic adenocarcinomas are complex tumors, as evidenced by the wide range of investigations [7-9]. However, these findings not only provide novel insight into the biology of pancreatic carcinoma, but also serve to identify numerous new targets for development into serologic markers or therapeutic target. The differentially expressed genes in pancreatic adenocarcinomas included oncogenes and tumor suppression genes, cell-cycle-related genes, signal transduction factors, extracellular matrix and
skeleton related genes, transcription factors, DNA damage and repair related genes and apoptosis-related genes (Tables1 and 2).
The screened genes with good concordance in these pancreatic adenocarcinoma patients may have the potential to become candidates for tumor markers and the molecular target for gene therapy, whereas genes that show concordance in a patient subset may reflect different disease stages or physiological and genetic differences between the patients.
Griffin et al [10] reported that more than 70% of pancreatic adenocarcinomas possessed consistent chromosome abnormalities. The most frequent whole chromosomal gains were chromosomes 20 and 7, and
6546 ISSN 1007-9327 CN 14-1219/ R World J Gastroenterol November 7, 2005 Volume 11 Number 41
Table 1 Representative list of highly expressed genes in pancreatic carcinoma
Categories Accessions Descriptions Symbols Gene map locus Average ratios
Oncogenes AF183421 RAB22b, RAS oncogene family Rab22b 18p11.3 3.530Cell cycle NM_001175 Rho GDP dissociation inhibitor Rho GDI 12p12.3 4.504 NM_001788 Cell division cycle 10 CDC10 7p14.3-14.1 3.219 NM_001798 Cyclin-dependent kinase 2 CDK2 12q13 2.853 NM_002592 Proliferating cell nuclear antigen PCNA 20pter-p12 3.388Signal transduction NM_002835 Protein tyrosine phosphatase, PTPN12 7q11.23 4.236 non-receptor type 12 NM_007039 Protein tyrosine phosphatase, PTPN21 14q31.3 2.65 non-receptor type 21 NM_004721 Mitogen-activated protein kinase MAPK13 3q25-29 2.361 kinase kinase 13 NM_000876 Insulin-like growth factor 2 receptor IGF2R 6q26 2.192 NM_000700 Annexin I ANXA1 9q12-21.2 4.092Extracellular matrix NM_002345 Lumican LUM 12q21.3-22 9.892 NM_000089 α2 type I collagen COL1A2 7q22.1 11.638 NM_000090 α1 type III collagen COL3A1 2q31 18.165 M26576 α1 type IV collagen preproprotein COL4A1 13q34 4.171 NM_000393 α2 type V collagen preproprotein COL5A2 2q14-32 3.677 NM_001920 Decorin DCN 12q13.2 3.633 NM_000582 Secreted phosphoprotein 1 SPP1 4q21-25 5.033 NM_004385 Chondroitin sulfate proteoglycan 2 CSPG2 5q14.3 6.073 NM_003380 Vimentin VIM 10p13 2.543 NM_033138 Caldesmon 1 CALD1 7q33 5.097 NM_002026 Fibronectin 1 FN1 q34 18.298 NM_003254 Tissue inhibitor of metalloproteinase1 TIMP1 Xp11.3-p11.23 13.791Cytoskeleton and NM_001613 α2 actin ACTa2 10q23.3 2.79motility NM_006009 Tubulin, α3 TUBA3 12q12-14.3 2.647 NM_005717 Actin related protein complex subunit 5 TPM1 15q22.1 2.113Cell surface antigen NM_002659 Plasminogen activator, urokinase UPAR 19q13 6.073 receptor NM_001769 CD9 antigen CD9 12p13 2.614Enzymes NM_000396 Cathepsin K preproprotein CTSK 1q21 2.809 NM_002654 Pyruvate kinase, muscle PKM2 15q22 3.186Cytokines NM_005534 Interferon γ receptor 2 IFNGR2 21q22.11 2.492 NM_003641 Interferon-induced transmembrane IFITM1 11 3.187 protein 1 NM_006435 Interferon-induced transmembrane IFITM2 11p15.5 4.149 protein 2 Transcription factor NM_007315 Signal transducer and activator of STAT1 2q32.2-32.3 2.945 transcription 1 BC007874 Fructose bisphosphatase 3 FBP3 9q34.2 2.35 NM_001530 Hypoxia-inducible factor 1, α HIF1α 14q21-242.796 NM_006940 SRY-box 5 isoform A SOX5 12p12.1 2.671 AF332192 Regulatory factor X, 4 RFX4 12q 2.094

the chromosomal losses were much more frequent in chromosomes 18, 13, 12, 17, and 6. Structural abnormalities were frequently involved in chromosomes 1p, 6q , 7q , 17p, 1q , 3p, 11p, and 19q. From our microarrays, we found that the overexpressed genes in pancreatic adenocarcinomas are mainly located in chromosomes 1, 2q, 7q, 9q, 12, 14q, 15q, and 21q, and the downexpressed genes are mainly located in chromosomes 1, 2, 3, 7q, 8q, 15q, 17, 19, and 22q, which are similar to the previous reports. This phenomenon suggests the existence of acquired genomic alterations in pancreatic carcinomas.
Among the genes overexpressed in pancreat ic adenocarcinomas, RAB22B and Rho GDP dissociation inhibitor (Rho GDI) are the members of Ras superfamily, whose Cy3/Cy3 ratios are 3.53 and 4.504, respectively.
As it is well known that many pancreatic carcinoma cells show “addiction” to K-ras mutation, while normal cells appear resistant to suppression of K-ras-mediated signaling by antisense K-ras RNA expression adenoviral vector[11]. So, overexpressed RAB22B may be the result of K-ras mutation in pancreatic adenocarcinoma. The Rho family proteins were found to reorganize cytoskeletons and regulate the cell migration via the activation of effector proteins. GTP-bound Rho is an active form, whereas the GDP-bound form is inactive. Rho GDI can block the conversion between the GTP- and GDP-bound forms. Expression of Rho family molecules has recently been reported in breast, lung, pancreas and colon carcinomas, and testicular germ cell tumors[12]. Moreover, three guanine nucleotide exchange factors (RCC1-like G
Table 2 Representative list of downregulated genes in pancreatic carcinoma
Categories Accessions Descriptions Symbols Gene map locus Average ratios
DNA injury and NM_006763 BTG family, member 2 BTG2 1q32 0.141repair NM_014877 Helicasewithzincfingerdomain HELZ 17q24.2 0.337 NM_014140 SWI/SNF-related matrix-associated actin regulator of chromatin a like 1 SMARCAL1 2q34-36 0.397Tumor suppressor NM_000551 Von Hippel–Lindau syndrome gene VHL 3p25 0.4Apoptosis NM_001229 Caspase 9 isoform αpreproprotein CASP9 1p36.3-36.1 0.29 NM_022173 TIA1 protein isoform 1 TIA1 2p13 0.413 Cell-cycle dependent NM_002923 Regulator of G-protein signaling 2 RGS2 1q31 0.186 NM_005381 Nucleolin NCL 2q12 0.411 NM_006341 MAD2 homolog 2 MAD2L2 1p36 0.348Adhesive molecule NM_001078 Vascular cell adhesion molecule 1 VCAM 1p32-31 0.363 NM_000216 Kallmann syndrome 1 protein KAL Xp22.32 0.444 NM_005655 TGFB inducible early growth response TIEG 8q22.2 0.431Ribosomal protein BC001365 Ribosomal protein L4 RPL4 15q22 0.399 NM_005617 Ribosomal protein S14 RPS14 5q31-33 0.319 NM_000969 Ribosomal protein L5 RPL5 1p21.3 0.375 NM_033301 Ribosomal protein L8 RPL8 8q24.3 0.398 NM_002950 Ribophorin I RPN1 3q21.3-25.2 0.314Guanine nucleotide NM_001268 RCC1-like G exchanging factor CHC1L 13q14.3 0.363 exchange factor NM_001960 Eukaryotic translation elongation EEF1D 19p13.13 0.242 factor 1-δ NM_001959 Eukaryotic translation elongation EEF1B2 2q33-34 0.305 factor 1-β2 Transcription factor NM_014390 EBNA-2 co-activator (100 ku) p100 7q31.3 0.322 NM_005080 X-box binding protein 1 XBP-1 22q12.1 0.325 NM_001880 Activating transcription factor 2 ATF2 2q32 0.314 NM_012082 Transcription factor GATA4 FOG2 8q23 0.348Signal transduction NM_004301 BRG1-associated factor BAF53a 3q27.1 0.25 NM_004236 Thyroid receptor interacting protein 15 SGN2 15q21.2 0.377 NM_002825 Pleiotrophin PTN 7q33-34 0.355 NM_002928 Regulator of G-protein signaling 16 RGS16 1q25-31 0.422 NM_005645 TBP-associated factor 13 TAF2K 1p13.1 0.462 NM_000596 Insulin-like growth factor binding IGFBP1 7p13-12 0.365 protein 1 NM_002514 IGFBP9 IGFBP9 8q24.1 0.376Enzymes NM_001979 Epoxide hydrolase 2 EPHX2 8p21-12 0.315 NM_001482 Glycine amidinotransferase GATM 15q15.3 0.179 NM_000170 Glycine dehydrogenase GLDC 9p22 0.428 NM_000382 Aldehyde dehydrogenase 3 family, ALDH3A2 17p11.2 0.393 member A2 NM_005600 Nitrilase 1 NIT1 1q21-22 0.358 NM_004990 Methionine-tRNA synthetase MARS 12q13.2 0.438 NM_001064 Transketolase TKT 3p14.3 0.317 NM_000221 Ketohexokinase KHK 2p23.3-2 0.309
Jin G et al. cDNA microarrays in pancreatic adenocarcinoma 6547

exchanging factor, eukaryotic translation elongation factor 1-δ, eukaryotic translation elongation factor 1-β2) were downexpressed in our microarrays, which implied that GDP-bound forms might be related to tumorigenesis of pancreatic adenocarcinoma. Furthermore, VHL gene, which has been confirmed as a tumor suppressor gene[13], was also downexpressed in pancreatic adenocarcinoma.
The result showed that pancreatic carcinoma cells are much more active than normal cells in many steps of multiple pathways of signal transduction. The stable state of normal somatic cells depends on the dynamic equilibrium of apoptosis and proliferation. Apoptosis-related genes were downexpressed in cancer. These findings revealed that the phenotypical similarities among different cancers are also reflected at the molecular level.
Gene expression profiling of pancreatic carcinoma has also provided new insights into the process of tumor invasion. In pancreatic carcinoma tissue, many invasion and metastasis related genes, such as ECM and cell skeleton related genes (type I collagen, type III collagen, type IV collagen, decorin, secreted phosphoprotein 1, vimentin, tissue inhibitor of matrix metalloproteinase 1, fibronectin 1,α2-actin, tubulin, tropomyosin 1, etc.), showed high expression level, reflecting the cellular components of the host stromal response seen in the presence of infiltrating carcinoma. Moreover, the urokinase-type plasminogen activator receptor (uPAR) was found highly expressed in pancreatic adenocarcinomas, which is a key molecule in the regulation of cell-surface plasminogen activation and, as such, plays an important role in many normal as well as pathologic processes[14]. Memarzadeh et al[15] concluded that uPAR is a useful prognostic marker for biologically aggressive forms of endometrial cancer. These phenomena suggest that poor prognosis of pancreatic carcinoma may have a solid molecular biological basis, and also indicate that a highly organized and structured process of tumor invasion exists in the pancreas.
The downregulated genes in the pat ients with pancreatic adenocarcinoma are also divided into distinct functional categories. Reduced expression was observed in genes encoding products that function in the apoptosis, immune system, cell regulation, DNA injury and repair processing and GTP/GDP signaling, which were in agreement with the previous reports[16,17].
In conclusion, the application of cDNA microarray technique for analysis of gene expression patterns is a powerful strategy to identify novel cancer-associated genes, and can rapidly explore their role in clinical pancreatic adenocarcinomas. Microarray profiles provide us new insights into the carcinogenesis and invasive process in pancreatic adenocarcinoma. Our results suggest that a highly organized and structured process of tumor invasion exists in the pancreas.
REFERENCES1 YeoCJ,Cameron JL, Sohn TA, Lillemoe KD, Pitt HA, Talamini
MA,HrubanRH,OrdSE,SauterPK,ColemanJ,ZahurakML,GrochowLB,AbramsRA.Sixhundredfiftyconsecutivepancreaticoduodenectomies in the 1990s: pathology, complications, and outcomes. Ann Surg 1997;226:248-57; discussion 257-260
2 HollandEC. Regulation of translation and cancer. Cell Cycle 2004; 3: 452-455
3 Wulfkuhle J, Espina V, Liotta L, Petricoin E. Genomic and proteomic technologies for individualisation and improvement of cancer treatment. Eur J Cancer 2004; 40: 2623-2632
4 ShalonD, Smith SJ, Brown PO. A DNA microarray system for analyzingcomplexDNAsamplesusingtwo-colorfluorescentprobe hybridization. Genome Res 1996; 6: 639-645
5 JinG,WangS,HuX, JingZ,Chen J,YingK,XieY,MaoY.Characterizationofthetissue-specificexpressionofthes100Pgene which encodes an EF-hand Ca2+-binding protein. Mol Biol Rep 2003; 30: 243-248
6 van deVijver MJ, He YD, van’t Veer LJ, Dai H, Hart AA, Voskuil DW, Schreiber GJ, Peterse JL, Roberts C, Marton MJ, Parrish M, Atsma D, Witteveen A, Glas A, Delahaye L, van der Velde T, Bartelink H, Rodenhuis S, Rutgers ET, Friend SH, Bernards R. A gene-expression signature as a predictor of survival in breast cancer. N Engl J Med 2002; 347: 1999-2009
7 Missiaglia E, Blaveri E, Terris B, Wang YH, Costello E, Neoptolemos JP, Crnogorac-Jurcevic T, Lemoine NR. Analysis of gene expression in cancer cell lines identifies candidate markers for pancreatic tumorigenesis and metastasis. Int J Cancer 2004; 112: 100-112
8 RyuB, Jones J, Blades NJ, Parmigiani G, Hollingsworth MA, Hruban RH, Kern SE. Relationships and differentially expressed genes among pancreatic cancers examined by large-scale serial analysis of gene expression. Cancer Res 2002; 62: 819-826
9 Tarbé N , Lösch S, Burtscher H, Jarsch M, Weidle UH. Identification of rat pancreatic carcinoma genes associated with lymphogenous metastasis. Anticancer Res 2002; 22: 2015-2027
10 GriffinCA, Hruban RH, Morsberger LA, Ellingham T, Long PP, Jaffee EM, Hauda KM, Bohlander SK, Yeo CJ. Consistent chromosome abnormalities in adenocarcinoma of the pancreas. Cancer Res 1995; 55: 2394-2399
11 YoshidaT, Ohnami S, Aoki K. Development of gene therapy to target pancreatic cancer. Cancer Sci 2004; 95: 283-289
12 AznarS, Fernández-Valerón P, Espina C, Lacal JC. Rho GTPases: potential candidates for anticancer therapy. Cancer Lett 2004; 206: 181-191
13 MaynardMA, Ohh M. Von Hippel-Lindau tumor suppressor protein and hypoxia-inducible factor in kidney cancer. Am J Nephrol 2004; 24: 1-13
14 Choong PF, Nadesapillai AP. Urokinase plasminogen activator system: a multifunctional role in tumor progression and metastasis. Clin Orthop Relat Res 2003; : S46-S58
15 MemarzadehS, Kozak KR, Chang L, Natarajan S, Shintaku P, Reddy ST, Farias-Eisner R. Urokinase plasminogen activator receptor: Prognostic biomarker for endometrial cancer. Proc Natl Acad Sci USA 2002;99: 10647-10652
16 GrützmannR, Foerder M, Alldinger I, Staub E, Brümmendorf T, Röpcke S, Li X, Kristiansen G, Jesenofsky R, Sipos B, Löhr M, Lüttges J, Ockert D, Klöppel G, Saeger HD, Pilarsky C. Geneexpressionprofilesofmicrodissectedpancreaticductaladenocarcinoma. Virchows Arch 2003; 443: 508-517
17 Logsdon CD , Simeone DM, Binkley C, Arumugam T, Greenson JK, Giordano TJ, Misek DE, Kuick R, Hanash S. Molecularprofilingofpancreaticadenocarcinomaandchronicpancreatitis identifiesmultiplegenesdifferentially regulatedin pancreatic cancer. Cancer Res 2003; 63: 2649-2657
6548 ISSN 1007-9327 CN 14-1219/ R World J Gastroenterol November 7, 2005 Volume 11 Number 41
ScienceEditorKumarM,LiWZandGuoSYLanguageEditor Elsevier HK

PO Box 2345, Beijing 100023, China World J Gastroenterol 2005;11(41):6549-6553www.wjgnet.com World Journal of Gastroenterology ISSN [email protected] © 2005 The WJG Press and Elsevier Inc. All rights reserved.
E L S E V I E R
• RAPID COMMUNICATION •
Sheng Hu, Qi-Bing Song, Ping-Fang Yao, Qing-Long Hu, Zhi-Rong Zeng, Rui-Ping Pang, Institute of Cancer, the Cancer Hospital of Hubei Province, Wuhan 430079, Hubei Province, ChinaQing-Long Hu, Department of Pathology, Creighton University Medical Center, 30th Street, Omaha NE 68131, United StatesPing-Jin Hu, Zhi-Rong Zeng, Rui-Ping Pang, Department of Gastroenterology, the First Affiliated Hospital of Sun Yat-Sen University of Medical Science, Guangzhou 510080, Guangdong Province, ChinaCorrespondence to: Hu Sheng, Institute of Cancer, the Cancer Hospital of Hubei Province, Wuhan 430079, Hubei Province, China. [email protected]: +86-27-87670057Received: 2005-01-12 Accepted: 2005-04-18
AbstractAIM: To investigate the influence of IL-1B-511 gene polymorphism on IL-1B mRNA expression and gastric acid output in individual with or without Helicobacter pylori (H pylori) infection.
METHODS: IL-1B mRNA expression and gastric acid secretion in 117 health volunteers were assayed using semi-quantitative RT-PCR and gastric juice assay, respectively. Pepsinogen (PG) I and II of 255 subjects (including 117 health volunteers) were also examined.
RESULTS: T/T genotype individuals with H pylori infection had a more decreased PG I/II ratio. In gastric antrum mucosa, the individuals with H pylori infection had higher IL-1B expression than those without H pylori infection, but there was no obvious difference among each genotype. In gastric corpus, the individuals with H pylori infection had a significantly higher IL-1B expression than those without H pylori infection. IL-1B-511T/T genotype was markedly higher as compared with the other two genotypes. Both maximal acid output and basic acid output were similar among each genotype in IL-1B-511 gene locus, regardless of H pylori infection.
CONCLUSION: IL-1B-511 T allele does not decrease gastric acid output, although it has a stimulated influence on IL-1B expression. Consequently, the pathway, through which IL-1B plays a central role in gastric cancer development, might not depend on low acid, but on the other regulation mechanisms.
© 2005 The WJG Press and Elsevier Inc. All rights reserved.
Key words: IL-1; Polymorphism; Stomach neoplasm; Gastric acid; Helicobacter pylori (H pylori)
No relationship between IL-1B gene polymorphism and gastric acid secretion in younger healthy volunteers
Sheng Hu, Qi-Bing Song, Ping-Fang Yao, Qing-Long Hu, Ping-Jin Hu, Zhi-Rong Zeng, Rui-Ping Pang
Hu S, Song QB, Yao PF, Hu QL, Hu PJ, Zeng ZR, Pang RP. No relationship between IL-1B gene polymorphism and gastric acid secretion in younger healthy volunteers. World J Gastroenterol 2005; 11(41):6549-6553http://www.wjgnet.com/1007-9327/11/6549.asp
INTRODUCTIONGastric cancer development is a multifactor and multi-step process. Clinical and epidemiological studies have suggested that environmental effects and dietary habits, such as smoking, alcohol consumption, low intake of fruits or vegetables and Helicobacter pylori (H pylori) infection, were the primary causes for the occurrence of carcinogenesis[1,2]. Furthermore, decades of researches have built up a variety of evidence that genetic risk factors also play an important role in cancer development[3]. Recently, through a case-control study, El-Omar et al[4] discovered that there was a strong relationship between IL-1 gene polymorphism and gastric cancer in the Polish population. The association between IL-1B-511 T allele and gastric carcinoma or atrophic gastritis was discovered by Machado et al[5] and Furuta et al[6] respectively. The results of several studies are in agreement with ours on Chinese population[7]. The epidemiological studies mentioned above were based on a hypothesis that IL-1B-511 and -31 gene polymorphisms contributed to stomach cancer development through T al lele upregulating IL-1B mRNA expression, and then inhibiting directly gastric acid secretion. Low gastric acid was reported as a risk factor for cancer, because it resulted in a change of the colonized place of H pylori from gastric antrum to the corpus[8,9]; unfortunately, corpus-predominant gastritis with bacterial overgrowth was at increased risk of atrophic gastritis (with several biomarkers, such as pepsinogen (PG)I, II or I/II ratio)[6,10] and even gastric cancer. Both increased intragastric pH value and H pylori infection could significantly enhance N-nitroso compounds concentration, which is a putative promoter of carcinogenesis and tumor progression[11]. Svendsen et al[12] discovered 5 gastric cancer patients among 114 patients with low gastric acid secretion in a long-term follow-up (mean 8.4 years) study. However, this model was only supported by animal studies[4,13]. It is unknown now whether IL-1B gene polymorphism increased IL-1β protein level and resulted in human hypochlorhydria and atrophic gastritis in vivo. In the present study, we investigated the effects of IL-1B-511 genetic polymorphism on IL-1β mRNA expression and gastric acid secretion in the gastric mucosa of human beings with or without H pylori infection.

6550 ISSN 1007-9327 CN 14-1219/ R World J Gastroenterol November 7, 2005 Volume 11 Number 41
MATERIALS AND METHODSSubjectsA total of 255 students (121 females and 132 males) from the Sun Yat-Sen University of Medical Sciences were enrolled in this study (Table 1). All subjects belonged to the ethnic group of Han and their age ranged from 19 to 24 years (mean 21.4±1.5 years). None of them had the histories of systemic lupus erythematosis, diabetes mellitus, rheumatoid arthritis, and inflammatory bowel disease. None of the subjects had received treatment for H pylori infection. Subjects with a family history of gastric cancer were also excluded.
After genotyping of IL-1B gene and test of H pylori antibody IgG, 117 subjects were randomly selected for the second step study on IL-1B-511 locus, but IL-1B-31 T/T genotype frequency is too low to be researched (Tables 1 and 2). Three biopsy specimens were collected from the antrum (two specimens for RNA extraction and another one for urease test) and two biopsy specimens from corpus for RNA extraction. In each genotypical group, no statistical difference in H pylori prevalence, sex, and age was observed (Table 2).
IL-1B-511 genotype (n =117)
T/T (n =37) C/T (n =40) C/C (n =40)
H pylori+ 14 15 181
Sex (F/M) 16/21 18/22 19/212
Age (yr) 21.9±1.5 22.1±1.6 22.3±1.63
Table 2 Common characteristics of 117 subjects (n, mean±SD)
1x2=0.6; 2x2=0.1, 3F=1.4
DNA extractionDNA was isolated from peripheral blood using the NaI method[14]. Briefly, heparinized whole blood (100 mL) was added to twofold volume of 6 mol/L NaI and fourfold volume of chloroform:isoamyl alcohol (24:1) and centrifuged at 5 000 r/min for 5 min. The aqueous layer was removed and isopropanol was added to the pellet to deposit DNA (centrifugation at 5 000 r/min for 5 min). Extracted DNA was rinsed 2-3 times with 700 mL/L alcohol and resuspended in 40 µL TE buffer (pH 8.0).
Genotyping of IL-1B-511 and -31 loci polymorphismPolymorphism of IL-1B-511 and -31 that encodes IL-1B was genotyped by polymerase chain reaction-restriction fragment length polymorphism (PCR-RFLP) A fragment conta ining the AvaI polymorphic s i t e a t p o s i t i o n - 5 1 1 o f t h e I L - 1 B g e n e w a s amp l i f i ed us ing PCR. T he o l i g onuc l eo t ide s, 5 ’- G C C T G A A C C C T G C A T A C C G T - 3 ’ a n d 5 ’-GCCAATAGCCCTCCCTTCT-3 ’ , f l ank ing th i s reg ion were used as pr imers. A luI po lymorphic site at position -31 was amplified using primers: 5’-AGAAGCTTCCACCAATACTC-3’ and 5’-ACCACCTAGTTGTAAGGAAG-3’. PCR was carried out as described previously by Zeng et al[7] PCR fragments were separated by electrophoresis on 30 g/L agarose with ethidium bromide staining. The C allele was designated, if two bands of 92 and 63 bp were obtained, and T allele was designated, if a single band of the undigested 155 bp was obtained. The genotype was designated as follows: C/C, 2 bands of 92 and 63 bp; C/T, 3 bands of 155, 92, and 63 bp; T/T, a single band of 155 bp.
Detection of IL-1B mRNA expressionThe biopsy specimens (5-10 mg) were mixed with 1 000 µL TRIzol (Invitrogen) and then homogenized for RNA extraction. RNA was resuspended in 40 µL TE buffer (RNase-free). RNA solution (5 µL) was diluted 10-fold and A260/280
ratio was examined. The total RNA was calculated as follows: RNAtotal=A260×40×N. IL-1B amplification was performed using the primers: IL-1B primers, P1 5’-gatgaagtgctccttccaggac-’3, P2 5’-tggagcaacaagtggtgttctcca-’3 (480 bp); and GAPDH primers, P1 5’-cacagtccatgccatcactg-’3, P2 5’-tactccttggaggccatgtg-’3 (480 bp). RT-PCR amplification was performed in a volume of 50 µL containing 2× AccessQuickTM Master mixture (Promega Company). The final PCR aliquot (10 µL) was analyzed by electrophoresis on 30 g/L agarose with ethidium bromide staining.
Measurement of gastric acid secretionGastric acid secretion was detected in 117 subjects following pentagastrin injection. For this, all subjects received no medication (e.g. antiacid, etc.) for 24 h and no food for 12 h before the test. On the morning of the test, a tube was passed into the stomach through the nose. The tube was securely fastened and subjects were made to lie
Examination of pepsinogen I and IIUsing ELISA assay, PG I and II of 255 subjects were examined. Blood samples were obtained after 10-h fasting, and then coagulated at room temperature for 30 min to extract serum. Finally, the ELISA assay was performed according to the manufacturer’s instructions (Orion Diagnostica Company). All analysis was done in duplicate and with an internal standard. The mean absorbance (A450) of each specimen was tested at 450 nm.
Table 1 Relationship between IL-1B-511 genotypes and H pylori status Loci Genotype H pylori+ H pylori– Total
(n=96) (n=159) (n=255)
IL-1B-511 C/C 34 63 97 C/T 46 75 121 T/T 16 211 37 (14.1%)IL-1B-31 C/C 72 120 192 C/T 22 37 59 T/T 2 22 4 (1.6%)
1H pylori+ vs H pylori–: x2=0.6; 2H pylori+ vs H pylori–: x2=0.3

Hu S et al. IL-1B gene and gastric acid secretion 6551
on their left-side. The gastric juices were then collected by applying continuous suction (at 30-50 mmHg below atmospheric pressure) to the tube.
Statistical analysesHardy–Weinberg equilibrium at individual loci was assessed using χ2 test in the statistics program SPSS (version 12.0, Chicago, IL, USA). Comparison of genotype frequencies between cases and controls was assessed by χ2 test. ANOVA or t-test was used for analysis of means. All P values were two-sided and considered statistically significant at P<0.05.
RESULTSAnalysis of pepsinogen I and I/II ratio in different IL1-1B-511 genotypesIn H pylori-positive cases, T/T genotype individuals had markedly decreased PGI/II ratio as compared with the other genotypes (F = 3.7, P = 0.03). On the contrary, no significant difference in PGI/II ratio was observed among the genotypical groups without H pylori infection. PGI level was similar in the three genotypes of infected subjects or non-infected subjects, although PGI level was lower in H pylori-positive subjects than that in negative subjects (Table 3).
Table 3 PG I and I/II ratio in different genotypes with or without Helicobacter pylori (H pylori) infection (mean±SD)
IL-1B-511 genotype
C/C (n = 97) C/T (n = 121) T/T (n = 37)
H pylori+ PGI 38.5 ± 6.7 40.3 ± 7.2 38.0 ± 6.7
(n=96) PGI/II 4.9 ± 0.4 5.0 ± 0.4 4.7 ± 0.31
H pylori– PGI 23.6 ± 4.3 24.0 ± 5.0 23.5 ± 3.5
(n=159) PGI/II 5.0 ± 0.3 4.9 ± 0.3 4.9 ± 0.4
F = 3.7, P = 0.03 (PT/TvsC/T = 0.008, PT/TvsC/C = 0.04).
Relationship between IL-1B-511 gene polymorphism and IL-1B mRNA expressionIn H pylori-negative individuals, the levels of IL-1B mRNA expression were markedly decreased in the gastric antrum, and similar among each genotype. However, in H pylori-positive subjects, IL-1β mRNA expression was significantly increased, but there was no difference among C/C, C/T, or T/T genotype (Figures 1 and 2) Furthermore, in the individuals without H pylori-infected corpus, no significant difference was detected in the expression of IL-1β mRNA among the genotype in IL-1B-511 single nucleotide polymorphism. In H pylori infection corpus, however, the level of IL-1β mRNA was higher. Individuals with T/T genotype had remarkably increased IL-1B mRNA than those with C/C or C/T genotype. No difference in IL-1B mRNA levels was observed between C/C and C/T genotypes. Meantime, we
discovered a carrier of both IL-1B-511 T/T and –31 T/T genotypes, which had the highest IL-1B gene expression among all the subjects (Figures 1 and 2).
1 2 3 4 5 6 7
Figure 1 Expression of IL-1βmRNA in antrum Lane 1: a standard DNA ladder, lane 2: C/C genotype without H pylori infection, lane 3: C/T genotype without H pylori infection, lane 4: T/T genotype without H pylori infection, lane 5: C/C genotype with H pylori infection, lane 6: C/T genotype with H pylori infection, lane 7: T/T genotype with H pylori infection.
Figure 2 Expression of IL-1βmRNA in corpus. Lane 8: a standard DNA ladder, lane 7: C/C genotype without H pylori infection, lane 6: C/T genotype without H pylori infection, lane 5: T/T genotype without H pylori infection, lane 4: C/C genotype with H pylori infection, lane 3: C/T genotype with H pylori infection, lane 2: T/T genotype with H pylori infection, lane 1: T/T genotype of -511 and -31 with H pylori infection.
IL-1B-511 genotype and gastric fluid analysisIn basic condition (basic acid output), gastric acid secretion was similar between H pylori-negative and -positive subjects (5.1±1.0 vs 5.2±1.1 mmol/h, t = 0.48), and also among three different genotypes (six groups comparison, F = 0.2, Figure 3). After a pentagastrin stimulation, there was no significant difference for maximal acid output between H pylori-negative and -positive subjects (18.3±2.3 vs 18.4±2.0 mmol/h, t = 0.1), and among three different genotypes (six groups comparison, F = 0.7, Figure 4). pH values of basic gastric juice and stimulated gastric fluid were 4.8±1.1 and 1.4±0.4, respectively. There was a slight increased pH value in H pylori infection subjects. Nevertheless, the individuals with T/T genotype did not show a much weaker ability to secrete hydrogen ion (Figure 5, F = 0.13 and 0.35).
DISCUSSIONSeveral studies revealed that hypochlorhydria induced
500 bp
GAPDH
IL-1β
1 2 3 4 5 6 7 8
GAPDHIL-1β
500 bp

6552 ISSN 1007-9327 CN 14-1219/ R World J Gastroenterol November 7, 2005 Volume 11 Number 41
10
8
6
4
2
0
5.2 5.1 5.1 5.1 5.1 5.3
C/C C/T T/T C/C C/T T/T Hp- Hp- Hp- Hp+ Hp+ Hp+
BAO mmol/h
30
20
10
0
18.4 18.0 19.0 18.3 18.8 18.5
C/C C/T T/T C/C C/T T/T Hp- Hp- Hp- Hp+ Hp+ Hp+
MAO mmol/h
Figure 4 MAO in different genotypes or H pylori status
by overexpression of IL-1B was regarded as a bridge to link IL-1 gene polymorphism to gastric cancer[4–7]. The ability of mucosa to secrete gastric acid has been considered as a critical factor to decide clinical outcomes and bacterial description of H pylori infection[14,15]. H pylori implanted predominantly in the antrum mucosa, a
10
8
6
4
2
0 C/C(Hp-) C/T(Hp-) T/T(Hp-) C/C(Hp+) C/T (Hp+) T/T(Hp+)
4.8 4.7 4.8 4.7 4.9 4.8
1.4 1.5 1.5 1.4 1.5 1.5
pH in MAO
pH in BAO
Figure 5 pH value of BAO and MAO in different genotypes or H pylori status.
place with a higher pH value, contrarily increased acid environment of corpus mucosa that resulted from a large number of B lymphocytes provides a habitat for H pylori to grow. However, for some special individuals with genetic hypochlorhydria, H pylori has a chance to migrate from antrum to the corpus. As a result, a large ulcer area resulted in a decreased acid level, which accumulates gastric atrophy or stomach carcinoma development[9]. Schepp et al [16] reported that rat parietal cells express IL-1 receptors mediating inhibition of H+ production. The antisecretory effect of IL-1B may contribute to hypoacidity secondary to acute H pylori infection or during chronic colonization by H pylori preferring the fundic mucosa. Another study reported that the efficacy of IL-1B to inhibit parietal cell H+ production was 100-fold and 6 000-fold higher as compared to proton pump inhibitors and H2 antagonists, respectively[17]. Recently, it has been identified that IL-1B exerts a potent function of gastric acid secretion through the other molecules and protein kinase pathway[18,19]. Until recently, however, no research has provided unambiguous and direct proofs suggesting that lower acid output resulted from higher IL-1B level in the human body except from a rodent model. In this study, we discovered that T/T genotype individuals infected with H pylori had a more decreased PGI/II ratio as compared with the other genotypes, which is partly consistent with the results reported by Furuta et al[6] suggesting that IL-1B-511 gene polymorphism might be a risk factor for gastric carcinoma. IL-1B mRNA expression in subjects without H pylori infection was not remarkable, and was similar in each genotype, showing that there might be a very low level of IL-1B mRNA expression in normal mucosa. In contrast, the results are more complex in H pylori-positive individuals. There was a remarkable upregulation in the antrum, but no relationship with genotype was observed. In the corpus mucosa, however, the level of IL-1B mRNA was markedly higher than that in the antrum mucosa. Furthermore, IL-1B-511 T/T genotype individual had a mild increased IL-1B mRNA level as compared with C/T and C/C genotype. So, these results indicated that this mutation of IL-1B-511 C→T might upregulate IL-1B mRNA expression in corpus but not in the antrum, as these results are consistent to the results reported by Hwang et al[20]
The association of IL-1B-31 locus and IL-1B expression is not investigated because genetically mutated subject is too small (about 1%) to be collected. Fortunately, we found one female subject with H pylori positive and IL-1B-511 T/T and -31 T/T genotypes simultaneously had a markedly increased IL-1B mRNA level in corpus but not in the antrum. These results suggested a cooperative effect between –511 and –31 locus in IL-1B mRNA expression. These findings are also in agreement with the previous results reported by El-Omar et al[4] and Hwang et al[20]
We discovered that in basic or pentagastrin stimulation condition, gastric acid secretion was similar between H pylori-negative and -positive subjects. Acid secretion function did not show a marked heterogeneity among
Figure 3 BAO in different genotype or H pylori status

Hu S et al. IL-1B gene and gastric acid secretion 6553
three different genotypes of IL-1B-511. This data denoted that higher IL-1B level does not make a strong impact on gastric acid output. So, previous hypothesis that H pylori infection leads to IL-1B mRNA overexpression in IL-1B-511 T/T genotype, thereby directly inhibits gastric acid secretion is impossible, at least in vivo, in low gastric cancer prevalence region. Hence, we inferred that the other pathways (such as chronic inflammatory process[21]), but not low acid secretion regulated by IL-1B (a pre-inflammatory factor), lead to mucosal atrophy. Our results, also taking into consideration the reports of several studies, suggested that IL-1B gene polymorphism was a susceptibility factor to gastric carcinoma in population-based studies. Furthermore, Lundell et al[21,22] have reported that acid-suppressive therapy maintained for 3 years facilitates neither the development of gastric glandular atrophy of the corpus mucosa nor the occurrence of intestinal metaplasia in H pylori-infected GERD patients. Fox et al[23] argued that coca leaf chewers (added with slaked lime or ash) did not have a higher prevalence of H pylori infection, or a higher rate of progression to gastric atrophy. So, we propose a new hypothesis that IL-1B gene polymorphism acts as a gastric cancer risk factor via upregulating IL-1B expression but downregulating acid secretion. The individuals included in our study had a strong physiological captivity of acid output in the gastric mucosa as their age ranged from 19 to 24 years. This might be the reason that acid secretion levels were not seen significantly different between upregulated IL-1B mRNA and unchanged IL-1B mRNA groups. But using younger population in the present study is not unreasonable. As we know H pylori infection and genetic background play crucial roles in carcinogenesis beginning from early age. Further studies, however, should focus on larger age-range subjects or on other races to identify our results.
REFERENCES 1 Stadtländer CT, Waterbor JW. Molecular epidemiology,
pathogenesis and prevention of gastric cancer. Carcinogenesis 1999; 20: 2195-2208
2 Hohenberger P, Gretschel S. Gastric cancer. Lancet 2003; 362: 305-315
3 Rhyu MG. Genetic events underlying morphological complexity of gastric carcinoma. J Korean Med Sci 1998; 13: 339-349
4 El-Omar EM, Carrington M, Chow WH, McColl KE, Bream JH, Young HA, Herrera J, Lissowska J, Yuan CC, Rothman N, Lanyon G, Martin M, Fraumeni JF, Rabkin CS. Interleukin-1 polymorphisms associated with increased risk of gastric cancer. Nature 2000; 404: 398-402
5 Machado JC, Pharoah P, Sousa S, Carvalho R, Oliveira C, Figueiredo C, Amorim A, Seruca R, Caldas C, Carneiro F, Sobrinho-Simões M. Interleukin 1B and interleukin 1RN polymorphisms are associated with increased risk of gastric
carcinoma. Gastroenterology 2001; 121: 823-8296 Furuta T, El-Omar EM, Xiao F, Shirai N, Takashima M,
Sugimura H. Interleukin 1beta polymorphisms increase risk of hypochlorhydria and atrophic gastritis and reduce risk of duodenal ulcer recurrence in Japan. Gastroenterology 2002; 123: 92-105
7 Zeng ZR, Hu PJ, Hu S, Pang RP, Chen MH, Ng M, Sung JJ. Association of interleukin 1B gene polymorphism and gastric cancers in high and low prevalence regions in China. Gut 2003; 52: 1684-1689
8 El-Omar EM, Oien K, El-Nujumi A, Gillen D, Wirz A, Dahill S, Williams C, Ardill JE, McColl KE. Helicobacter pylori infection and chronic gastric acid hyposecretion. Gastroenterology 1997; 113: 15-24
9 Xu GP, Reed PI. N-nitroso compounds in fresh gastric juice and their relation to intragastric pH and nitrite employing an improved analytical method. Carcinogenesis 1993;14: 2547-2551
10 Broutet N, Plebani M, Sakarovitch C, Sipponen P, Mégraud F. Pepsinogen A, pepsinogen C, and gastrin as markers of atrophic chronic gastritis in European dyspeptics. Br J Cancer 2003; 88: 1239-1247
11 Stockbruegger RW. Bacterial overgrowth as a consequence of reduced gastric acidity. Scand J Gastroenterol Suppl 1985; 111: 7-16
12 Svendsen JH, Dahl C, Svendsen LB, Christiansen PM. Gastric cancer risk in achlorhydric patients. A long-term follow-up study. Scand J Gastroenterol 1986; 21: 16-20
13 Beales IL, Calam J. Inhibition of carbachol stimulated acid secretion by interleukin 1beta in rabbit parietal cells requires protein kinase C. Gut 2001; 48: 782-789
14 Loparev VN, Cartas MA, Monken CE, Velpandi A, Srinivasan A. An efficient and simple method of DNA extraction from whole blood and cell lines to identify infectious agents. J Virol Methods 1991; 34: 105-112
15 McColl KE, el-Omar E, Gillen D. Helicobacter pylori gastritis and gastric physiology. Gastroenterol Clin North Am 2000; 29: 687-703, viii
16 Schepp W, Dehne K, Herrmuth H, Pfeffer K, Prinz C. Identification and functional importance of IL-1 receptors on rat parietal cells. Am J Physiol 1998; 275: G1094-G1105
17 Wolfe MM, Nompleggi DJ. Cytokine inhibition of gastric acid secretion-a little goes a long way. Gastroenterology 1992; 102: 2177-2178
18 Mahr S, Neumayer N, Gerhard M, Classen M, Prinz C. IL-1beta-induced apoptosis in rat gastric enterochromaffin-like cells is mediated by iNOS, NF-kappaB, and Bax protein. Gastroenterology 2000; 118: 515-524
19 Beales IL, Calam J. Interleukin 1 beta and tumour necrosis factor alpha inhibit acid secretion in cultured rabbit parietal cells by multiple pathways. Gut 1998; 42: 227-234
20 Hwang IR, Kodama T, Kikuchi S, Sakai K, Peterson LE, Graham DY, Yamaoka Y. Effect of interleukin 1 polymorphisms on gastric mucosal interleukin 1beta production in Helicobacter pylori infection. Gastroenterology 2002;123: 1793-1803
21 Lundell L, Miettinen P, Myrvold HE, Pedersen SA, Thor K, Andersson A, Hattlebakk J, Havu N, Janatuinen E, Levander K, Liedman B, Nyström P. Lack of effect of acid suppression therapy on gastric atrophy. Nordic Gerd Study Group. Gastroenterology 1999;117: 319-326
22 Coussens LM, Werb Z. Inflammation and cancer. Nature 2002; 420: 860-867
23 Fox JG, Wang TC. Reply to "The 'African enigma' - another explanation". Nat Med 2000; 6: 1297-1298
Science Editor Kumar M and Guo SY Language Editor Elsevier HK

PO Box 2345, Beijing 100023, China World J Gastroenterol 2005;11(41):6554-6556www.wjgnet.com World Journal of Gastroenterology ISSN [email protected] © 2005 The WJG Press and Elsevier Inc. All rights reserved.E L S E V I E R
•CASE REPORT•
Peroral cholangioscopy for non-invasive papillary cholangio-carcinoma with extensive superficial ductal spread
Toshifumi Wakai, Yoshio Shirai, Katsuyoshi Hatakeyama, Division of Digestive and General Surgery, Niigata University Graduate School of Medical and Dental Sciences, Niigata, JapanCorrespondence to: Yoshio Shirai, MD, PhD, Division of Digestive and General Surgery, Niigata University Graduate School of Medical and Dental Sciences, 1-757 Asahimachi-dori, Niigata, Niigata 951-8510, Japan. [email protected]: +81-25-227-2228 Fax: +81-25-227-0779Received: 2005-01-06 Accepted: 2005-01-26
AbstractPapillary carcinoma arising from the extrahepatic bile duct often shows superficial ductal spread. We report herein the case of a patient with extensive superficial spread of non-invasive papillary cholangiocarcinoma, which was depicted with peroral cholangioscopy. A 65-year-old woman presented with the sudden-onset of severe epigastric pain. Ultrasonography revealed acute acalculous cholecystitis. Endoscopic retrograde cholangiography found small protruding lesions around the confluence of the cystic duct, suggestive of a cholangiocarcinoma. As the contour of the middle and upper bile ducts it was slightly irregular on the cholangiogram, the presence of superficial ductal spread was suspected. Peroral cholangioscopy revealed small papillary lesions around the confluence of the cystic duct and fine granular mucosal lesions in the middle and upper bile ducts and the right hepatic duct, suggesting a superficially spreading tumor. A right hepatectomy with bile duct resection was performed and no residual tumor was found. Histological examination revealed a non-invasive papillary carcinoma arising from the cystic duct with extensive superficial spread. Our experience of this case and a review of the literature suggest that a fine granular or fine papillary appearance of the ductal mucosae on cholangioscopy indicates superficial spread of papillary cholangiocarcinoma, for which peroral cholangioscopy is an efficient diagnostic option.
©2005 The WJG Press and Elsevier Inc. All rights reserved.
Key words: Cholangiocarcinoma; Bile duct neoplasms; Peroral cholangioscopy; Papillary carcinoma; Superficial ductal spread; Surgery
Wakai T, Shirai Y, Hatakeyama K. Peroral cholangioscopy for non-invasive papillary cholangiocarcinoma with extensive superficial ductal spread. World J Gastroenterol 2005; 11(41): 6554-6556http://www.wjgnet.com/1007-9327/11/6554.asp
INTRODUCTIONPapillary carcinoma arising from the extrahepatic bile duct often shows superficial ductal spread[1]. Peroral cholangioscopy, introduced in the 1970s by Rosch et al[2]
and Nakajima et al[3], provides direct visualization of the biliary ducts. We report herein the case of a patient with extensive superficial ductal spread of non-invasive papillary cholangiocarcinoma, which was depicted with peroral cholangioscopy.
CASE REPORTA 65-year-old woman presented with the sudden-onset of severe epigastric pain. No jaundice was observed on physical examination, and the serum total bilirubin level was 0.6 mg/dL (reference range: 0.3-0.9 mg/dL). The serum levels of carcinoembryonic antigen and carbohydrate antigen 19-9 were 0.7 ng/mL (reference range: 0-6 ng/mL) and 6 U/mL (reference range: 0-37 U/mL), respectively.
Ultrasonography revealed acute acalculous cholecystitis, for which percutaneous cholecystostomy was performed. Endoscopic retrograde cholangiography found small protruding lesions around the confluence of the cystic duct, suggestive of a cholangiocarcinoma (Figure 1). Smear cytology of the ductal bile aspirated during endoscopic retrograde cholangiography revealed that exfoliated cells were categorized into Papanicolaou class II. As the contour of the middle and upper bile ducts was slightly irregular on the cholangiogram, the presence of superficial ductal spread was suspected. In order to confirm this, peroral cholangioscopy using a fiberoptic endoscope(CHF-B20QY, Olympus, Tokyo, Japan) was performed, and both small papillary lesions around the confluence of the cystic duct (Figure 2) and fine granular mucosal lesions, brownish in color, in the middle and upper bile ducts were revealed, suggesting a superficially spreading tumor. Such mucosal lesions were also seen in the right hepatic duct (Figure 3).
After laparotomy, a bile duct resection with regional lymphadenectomy was performed. As the resection margin at the right hepatic duct was positive for in situ carcinoma on frozen-section examination, a right hepatectomy was additionally performed and no residual tumor was found. Histological examination of the resected specimen revealed a non-invasive papillary carcinoma arising from the cystic duct, with superficial spread extending up to the right anterior sectoral duct (pathologic T1N0M0, Stage IA, according to the tumor-node-metastasis staging system[4]).
Toshifumi Wakai, Yoshio Shirai, Katsuyoshi Hatakeyama
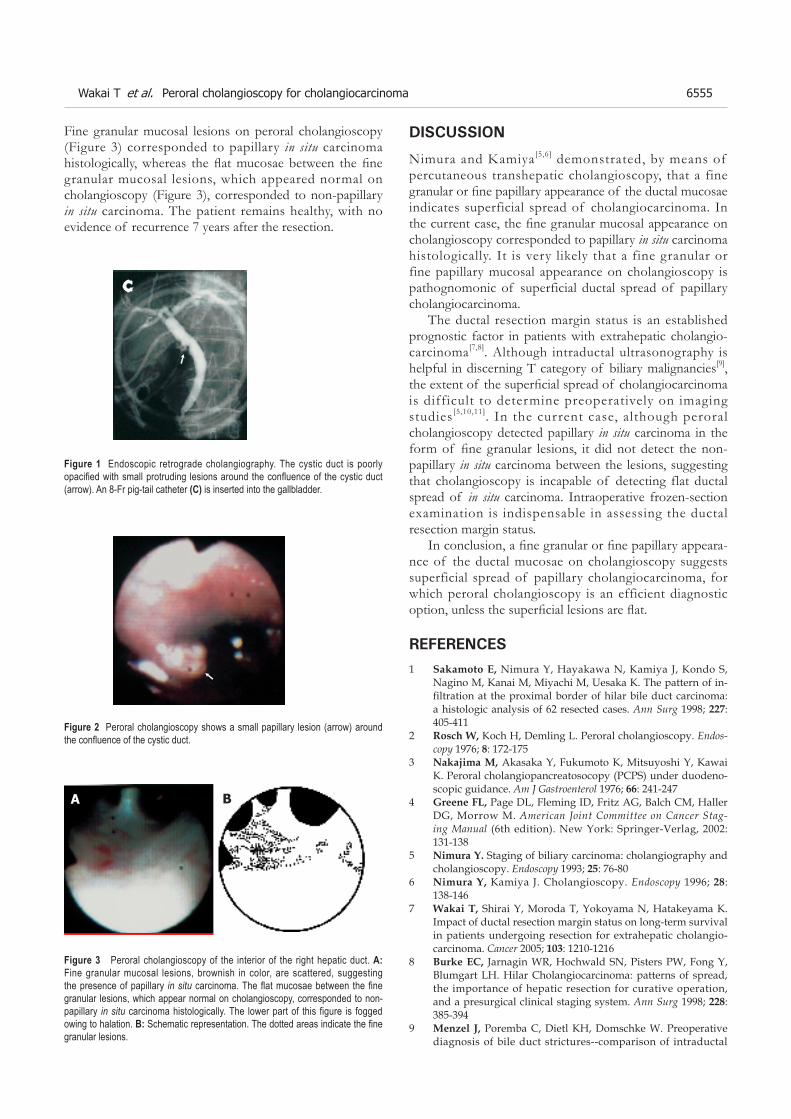
Figure 3 Peroral cholangioscopy of the interior of the right hepatic duct. A: Fine granular mucosal lesions, brownish in color, are scattered, suggesting the presence of papillary in situ carcinoma. The flat mucosae between the fine granular lesions, which appear normal on cholangioscopy, corresponded to non-papillary in situ carcinoma histologically. The lower part of this figure is fogged owing to halation. B: Schematic representation. The dotted areas indicate the fine granular lesions.
Fine granular mucosal lesions on peroral cholangioscopy (Figure 3) corresponded to papillary in situ carcinoma histologically, whereas the flat mucosae between the fine granular mucosal lesions, which appeared normal on cholangioscopy (Figure 3), corresponded to non-papillary in situ carcinoma. The patient remains healthy, with no evidence of recurrence 7 years after the resection.
Figure 1 Endoscopic retrograde cholangiography. The cystic duct is poorly opacified with small protruding lesions around the confluence of the cystic duct (arrow). An 8-Fr pig-tail catheter (C) is inserted into the gallbladder.
C
Figure 2 Peroral cholangioscopy shows a small papillary lesion (arrow) around the confluence of the cystic duct.
DISCUSSION
Nimura and Kamiya[5,6] demonstrated, by means of percutaneous transhepatic cholangioscopy, that a fine granular or fine papillary appearance of the ductal mucosae indicates superficial spread of cholangiocarcinoma. In the current case, the fine granular mucosal appearance on cholangioscopy corresponded to papillary in situ carcinoma histologically. It is very likely that a fine granular or fine papillary mucosal appearance on cholangioscopy is pathognomonic of superficial ductal spread of papillary cholangiocarcinoma.
The ductal resection margin status is an established prognostic factor in patients with extrahepatic cholangio-carcinoma[7,8]. Although intraductal ultrasonography is helpful in discerning T category of biliary malignancies[9], the extent of the superficial spread of cholangiocarcinoma is difficult to determine preoperatively on imaging studies[5,10,11]. In the current case, although peroral cholangioscopy detected papillary in situ carcinoma in the form of fine granular lesions, it did not detect the non-papillary in situ carcinoma between the lesions, suggesting that cholangioscopy is incapable of detecting flat ductal spread of in situ carcinoma. Intraoperative frozen-section examination is indispensable in assessing the ductal resection margin status.
In conclusion, a fine granular or fine papillary appeara-nce of the ductal mucosae on cholangioscopy suggests superficial spread of papillary cholangiocarcinoma, for which peroral cholangioscopy is an efficient diagnostic option, unless the superficial lesions are flat.
REFERENCES1 Sakamoto E, Nimura Y, Hayakawa N, Kamiya J, Kondo S,
Nagino M, Kanai M, Miyachi M, Uesaka K. The pattern of in-filtration at the proximal border of hilar bile duct carcinoma: a histologic analysis of 62 resected cases. Ann Surg 1998; 227: 405-411
2 RoschW, Koch H, Demling L. Peroral cholangioscopy. Endos-copy 1976; 8: 172-175
3 NakajimaM, Akasaka Y, Fukumoto K, Mitsuyoshi Y, Kawai K. Peroral cholangiopancreatosocopy (PCPS) under duodeno-scopic guidance. Am J Gastroenterol 1976; 66: 241-247
4 GreeneFL, Page DL, Fleming ID, Fritz AG, Balch CM, Haller DG, Morrow M. American Joint Committee on Cancer Stag-ing Manual (6th edition). New York: Springer-Verlag, 2002: 131-138
5 NimuraY. Staging of biliary carcinoma: cholangiography and cholangioscopy. Endoscopy 1993; 25: 76-80
6 NimuraY, Kamiya J. Cholangioscopy. Endoscopy 1996; 28: 138-146
7 WakaiT, Shirai Y, Moroda T, Yokoyama N, Hatakeyama K. Impact of ductal resection margin status on long-term survival in patients undergoing resection for extrahepatic cholangio-carcinoma. Cancer 2005; 103: 1210-1216
8 Burke EC, Jarnagin WR, Hochwald SN, Pisters PW, Fong Y, Blumgart LH. Hilar Cholangiocarcinoma: patterns of spread, the importance of hepatic resection for curative operation, and a presurgical clinical staging system. Ann Surg 1998; 228: 385-394
9 Menzel J, Poremba C, Dietl KH, Domschke W. Preoperative diagnosis of bile duct strictures--comparison of intraductal
Wakai T et al. Peroral cholangioscopy for cholangiocarcinoma 6555
A B

ultrasonography with conventional endosonography. Scand J Gastroenterol 2000; 35: 77-82
10 BarishMA, Yucel EK, Ferrucci JT. Magnetic resonance chol-angiopancreatography. N Engl J Med 1999; 341: 258-264
11 Tamada K, Ido K, Ueno N, Kimura K, Ichiyama M, Tomi-yama T. Preoperative staging of extrahepatic bile duct cancer with intraductal ultrasonography. Am J Gastroenterol 1995; 90: 239-246
ScienceEditorWang XL and Guo SY LanguageEditor Elsevier HK
6556 ISSN 1007-9327 CN 14-1219/ R World J Gastroenterol November 7, 2005 Volume 11 Number 41

PO Box 2345, Beijing 100023, China World J Gastroenterol 2005;11(41):6557-6559www.wjgnet.com World Journal of Gastroenterology ISSN [email protected] © 2005 The WJG Press and Elsevier Inc. All rights reserved.E L S E V I E R
• ����� �������� •����� �������� • •
Left paraduodenal hernia presenting as recurrent small bowel obstruction
Yu-Min Huang, Andy Shau-Bin Chou, Yung-Kang Wu, Chao-Chuan Wu, Ming-Che Lee, Haw-Tzong Chen,
Yao-Jen Chang
Yu-Min Huang, Yung-Kang Wu, Chao-Chuan Wu, Ming-Che Lee, Haw-Tzong Chen, Yao-Jen Chang, Department of Surgery, Buddhist Tzu Chi General Hospital, Hualien, Taiwan, ChinaAndy Shau-Bin Chou, Department of Radiology, Buddhist Tzu Chi General Hospital, Hualien, Taiwan, ChinaCorrespondence to: Dr. Yao-Jen Chang, Department of Surgery, Buddhist Tzu-Chi General Hospital, No. 707, Sec. 3, Chung Yang Road, Hualien City, Hualien County 970, Taiwan, China. [email protected]: +886-3-8561825-2229 Fax: +886-3-8577161Received: 2005-04-07 Accepted: 2005-04-30
AbstractInternal herniation of the small bowel is a relatively rare cause of intestinal obstruction. Left paraduodenal hernia resulting from abnormal rotation of the midgut during embryonic development is the most common form of congenital internal hernia. We report our experience in the diagnosis and management of a young male with left paraduodenal hernia presenting as recurrent intestinal obstruction. Correct preoperative diagnosis of left paraduodenal hernia had been difficult due to non-specific clinical presentations, but the advent of modern imaging technology makes early and correct diagnosis possible. Due to the risk of obstruction and strangulation, surgical treatment is indicated; however, timely intervention increases the likelihood of a favorable outcome.
© 2005 The WJG Press and Elsevier Inc. All rights reserved.
Key words: Internal hernia; Paraduodenal hernia; Small bowel obstruction
Huang YM, Chou ASB, Wu YK, Wu CC, Lee MC, Chen HT, Chang YJ. Left paraduodenal hernia presenting as recurrent small bowel obstruction. World J Gastroenterol 2005; 11(41): 6557-6559http://www.wjgnet.com/1007-9327/11/6557.asp
INTRODUCTIONcongenital internal hernias, paraduodenal hernias are the most common and account for 25%-53% of all cases[2]. Paraduodenal hernias result from abnormal rotation of the midgut during embryonic development and can be divided
into two subtypes, left and right paraduodenal hernias, according to their distinct pathogenesis and the resultant anatomical derangement. Correct preoperative diagnosis of paraduodenal hernia was once difficult, because of its non-specific presentations; however, with the advent of modern imaging technology, more information can be gained regarding the anatomical characteristics of the underlying lesion and allow for better treatment planning. We present our experience in the diagnosis and management of a patient with left paraduodenal hernia presenting as recurrent intestinal obstruction, as well as a brief review of the literature.
CASE REPORTThe patient was a slim 24-year-old male who visited our emergency room because of intermittent epigastric abdominal pain associated with bilious vomitus during the previous few hours. He had no history of previous abdominal surgery, but had a similar episode with pain and vomiting about 6 mo before. He had lost about 10 kg during that period. Physical examination revealed a non-tender, mildly distended abdomen with hyperactive bowel sounds. The only remarkable finding on plain abdominal film was loops of a dilated small bowel. Initial abdominal computed tomography (CT) revealed a mass lesion of soft tissue density located between the stomach, the pancreas, and the transverse colon (Figure 1A). For better elucidation
Figure 1 A: Computed tomography (CT) showing a soft tissue mass between the stomach, the pancreas, and the transverse colon (arrow); B: Upper gastrointestinal series showing a cluster of jejunum interposing between the stomach and the spine; C: The mass proved to be a cluster of intestinal loop after ingestion of contrast medium.
A
C
B

6558 ISSN 1007-9327 CN 14-1219/ R World J Gastroenterol November 7, 2005 Volume 11 Number 41
of the character of the mass lesion, we performed an upper gastrointestinal series with small intestinal follow-through, which revealed loops of jejunum clumping over the left upper quadrant of the abdomen (Figure 1B). The mass lesion proved to be a cluster of jejunum on follow-up CT (Figure 1C). The patient underwent surgery with a tentative diagnosis of left paraduodenal hernia with small bowel obstruction. Exploratory laparoscopy and laparotomy revealed that the jejunum did not emerge from the usual position at the base of transverse mesocolon; instead, only loops of the small bowel were visualized beh ind a th in l aye r o f pe r i toneum (Figure 2A). Further exploration revealed that the jejunum exited from an aperture of about 15 cm caudal to the usual location ofTreitz’s ligament. The initial 10 cm of intraperitoneal jejunum ran parallel and was adherent to both the inferior mesenteric artery (IMA) and the inferior mesenteric vein (IMV), which constitute the anterior rim of the orifice (Figure 2B). A 25 cm long segment of jejunum had herniated through the orifice into the space behind the descending mesocolon. We manually reduced the herniated bowel loops after opening the anterior wall of the hernial sac by dividing the adhesion between the jejunum and the IMV. We then closed the orifice of the hernial sac around the jejunum with interrupted 3-0 silk sutures (Figure 2C). The patient tolerated the procedure well and recovery was uneventful postoperatively. Follow-up upper gastrointestinal series revealed the smooth passage of contrast medium without evidence of abnormal aggregation of the small bowel.
DISCUSSIONLeft paraduodenal hernia is about three times more frequent than its right counterpart, and is reported to occur three times more often in men[3]. As mentioned previously, left paraduodenal hernia usually results from abnormal rotation of the midgut. In the 5 th wk of embryonic development, the rapidly elongating midgut herniates
into the umbilical cord. Later, the herniated midgut undergoes a counter clockwise rotation of 90° around the superior mesenteric artery (SMA), leaving the prearterial limb on the left side. The herniated intestinal loop, first the prearterial then the postarterial limb, returns to the abdominal cavity by the 10th week. During this process, the intestinal loop undergoes another 180° countercloc kwise rotation. In the end, the prearterial limb lies left to the SMA and the postarterial limb lies superior and right to the SMA[4]. Under normal circumstances, fusion of the mesocolon with the peritoneum of the body wall follows this process. Failure of the fusion to take place in time leaves a potential space (the fossa of Landzert) behind the mesocolon. A leftparaduodenal hernia results from invagination of the small intestine into this unsupported area through an opening bound anteriorly by the IMV and is established as the descending colon that seeks its normal attachment[2]. Although the left paraduodenal hernia is congenital, most patients are recognized between the 4th and 6th decades of life, and the mean age at the time of diagnosis is 38.5 years [3]. The most common presentations are those associated with small bowel obstruction and are nonspecific[5], ranging in severity from recurrent vague abdominal pain, nausea, and vomiting in partial, reversible obstruction to acute abdomen in cases of incarceration and strangulation.
Physical examination is usually unrevealing except for such nonspecific findings as abdominal tenderness, distension, and the occasional presence of a mass. Correct preoperative diagnosis has been difficult in the past, due to these ambiguous presentations; therefore, it is mandatory to maintain a high index of suspicion in patients with pertinent unexplained complaints. Under emergent settings, diagnosis is only possible at the time of surgery. In the absence of an abdominal emergency, however, a variety of diagnostic tools is available to help establish the correct diagnosis before surgery. Because of the ambiguous clinical presentation of this disease, a CT scan may be the initial tool of investigation. A characteristic finding is a cluster of small bowel loops between the stomach and pancreas[6,7]. In case that the trapped loops are collapsed and oral contrast is not used, the hernia contents may be mistaken for a soft tissue mass. A high index of suspicion is again required to avoid inadvertent invasive diagnostic procedures such as CT-guided biopsy, which may be disastrous under such circumstances. An upper gastrointestinal series with small bowel follow-through demonstrates contrast-filled loops of small bowel clustering over the left upper aspect of the abdomen, as is seen in our patient. Abdominal ultrasonography might also aid in the diagnosis of paraduodenal hernia. Suggestive findings include a cluster of bowel loops or a well-defined mass. Peristalsis of the bowel loops can be appreciated and made more obvious with the ingestion of water[8].
In earlier reports, the diagnosis and treatment of left paraduodenal hernia tended to be delayed and the result of treatment seemed to be less satisfactory[5]. With the diagnostic tools available today, correct diagnoses are
Figure 2 A: Loops of small bowel behind the mesocolon. Treitz’s ligament was not seen. SMV: superior mesenteric vein, J: jejunum; B: the orifice through which the small bowel herniated (arrow). IMV: inferior mesenteric vein; C: completion of the repair.

Huang YM et al . Left paraduodenal hernia 6559
possible even in the absence of acute symptoms, and treatment can commence promptly. Once diagnosed, left paraduodenal hernia should be surgically repaired because 50% of them cause intestinal obstruction[5,9]. The procedure consists of a manual reduction of the hernia contents followed by repair of the defect. If the herniated intestine is difficult to reduce because of its bulky size or adhesions within the sac, an incision can be made in the avascular portion of the hernial sac to the right of the inferior mesenteric vessels to enlarge the opening[2]. During this procedure, it is important to consider the relationship of the inferior mesenteric vessels to the sac opening and to take care to avoid injury to these structures. Although Bartlett indicated that these vessels can be divided without compromising blood supply to the colon[1], they should be preserved whenever possible. Intestinal resection is necessary in cases of strangulation and gangrene. In addition to the conventional “open” approach, successful laparoscopic repair of left paraduodenal hernia has been reported by Uematsu et al[10].
In conclusion, although relatively uncommon, left paraduodenal hernia should be included in the differential diagnosis of small bowel obstruction in patients who are relatively young, who have repetitive attacks, and who lack any history of previous abdominal surgery. The combination of a high index of suspicion, familiarity with this disease entity, and modern imaging technology
make preoperative diagnosis easier today. Timely surgical intervention effectively relieves the patient’s complaints and prevents further complications.
REFERENCES1 B a r t l e t t M K , W a n g C , W i l l i a m s W H . T h e s u r g i c a l
management of paraduodenal hernia. Ann Surg 1968; 168: 249-254
2 Brigham RA, Fallon WF, Saunders JR, Harmon JW, d'Avis JC. Paraduodenal hernia: diagnosis and surgical management. Surgery 1984; 96: 498-502
3 Khan MA, Lo AY, Vande Maele DM. Paraduodenal hernia. Am Surg 1998; 64: 1218-1222
4 Berardi RS. Paraduodenal hernias. Surg Gynecol Obstet 1981; 152: 99-110
5 Newsom BD, Kukora JS. Congenital and acquired internal hernias: unusual causes of small bowel obstruction. Am J Surg 1986; 152: 279-285
6 Olazabal A, Guasch I, Casas D. Case report: CT diagnosis of nonobstructive left paraduodenal hernia. Clin Radiol 1992; 46: 288-289
7 Warshauer DM, Mauro MA. CT diagnosis of paraduodenal hernia. Gastrointest Radiol 1992; 17: 13-15
8 Wachsberg RH, Helinek TG, Merton DA. Internal abdominal hernia: diagnosis with ultrasonography. Can Assoc Radiol J 1994; 45: 223-224
9 Isabel L, Birrell S, Patkin M. Paraduodenal hernia. Aust N Z J Surg 1995; 65: 64-66
10 Uematsu T, Kitamura H, Iwase M, Yamashita K, Ogura H, Nakamuka T, Oguri H. Laparoscopic repair of a paraduodenal hernia. Surg Endosc 1998; 12: 50-52
Science Editor Guo SY Language Editor Elsevier HK

PO Box 2345, Beijing 100023, China World J Gastroenterol 2005;11(41):6560-6562www.wjgnet.com World Journal of Gastroenterology ISSN [email protected] © 2005 The WJG Press and Elsevier Inc. All rights reserved.E L S E V I E R
• ����� �������� •����� �������� • •
Splenic angiosarcoma metastasis to small bowel presented with gastrointestinal bleeding
Jun-Te Hsu, Ting-Jun Wu, Han-Ming Chen, Tsann-Long Hwang, Yi-Yin Jan, Department of General Surgery, Chang Gung Memorial Hospital, Taoyuan, Taiwan, ChinaChin-Yew Lin, Department of Pathology, Chang Gung Memorial Hospital, Keelung, Taiwan, ChinaCorrespondence to: Dr. Han-Ming Chen, Department of General Surgery, Chang Gung Memorial Hospital, 5, Fushing Street, Kweishan Shiang, Taoyuan 333, TaiwanChina. [email protected]: +886-3-3281200-3219 Fax: +886-3-3285818Received: 2005-04-25 Accepted: 2005-05-12
AbstractPr imary sp l en i c ang iosa rcoma i s a ve ry ra re , aggressive neoplasm with a high metastatic rate and dismal prognosis. This neoplasm usually presents with abdominal pain, splenomegaly, anemia, and thrombocytopenia. Splenic angiosarcoma with bleeding gastrointestinal metastases is extremely rare. The literature contains only two case reports. This study reported a 44-year-old male patient with splenic angiosarcoma with sustained repeated gastrointestinal bleeding due to small bowel metastases. Salvage surgery was performed by splenectomy and resection of the metastatic small bowel tumors. The post-operative course was uneventful; the patient survived with the disease and had no GI bleeding, 7 mo after surgery.
© 2005 The WJG Press and Elsevier Inc. All rights reserved.
Key words: Gastrointestinal bleeding; Metastasis; Small bowel; Splenectomy; Splenic angiosarcoma
Hsu JT, Lin CY, Wu TJ, Chen HM, Hwang TL, Jan YY. Splenic angiosarcoma metastasis to small bowel presented with gastrointestinal bleeding. World J Gastroenterol 2005;11(41): 6560-6562http://www.wjgnet.com/1007-9327/11/6560.asp
INTRODUCTIONPrimary splenic angiosarcoma is a very rare neoplasm with a high metastatic rate and dismal prognosis. Langhans [1] f i rst ident if ied this disease in 1879. Presentations of splenic angiosarcoma are extremely variable and frequently cause diagnostic difficulties. The disease usually manifests with abdominal mass, abdominal pain, splenomegaly, and anemia. Distant metastases can
occur in the liver, lung, lymph node, and bone, and soft tissue[2]. To our knowledge, splenic angiosarcoma with bleeding gastrointestinal (GI) metastases is extremely rare. The literature contains only two case reports[3,4]. The present case is the first report of splenic angiosarcoma metastasis to the small bowel. This work describes the experience of the authors in the management of the splenic angiosarcoma with bleeding GI metastases.
CASE REPORTA 44-year-old male patient was admitted to Chang Gung Memorial Hospital on July 1, 2004, complaining of severe lower back pain and progressively weakness in his bilateral lower legs for 1 mo. Subconjunctiva hemorrhage and gingival bleedings were noted during initial examination mild pale conjunctiva, hepatomegaly, and splenomegaly. The hematogram measured hemoglobin at 108 g/L and platelet at 137 000/cm3. Prothrombin and activated partial thromboplastin times were normal. Magnetic resonance imaging of the spine identified abnormal enhancement at multiple bodies in the thoracic, lumbar, and sacral spines, which were assumed to be metastatic lesions. Unfortunately, the patient developed hematochezia 9 d after admission. Persistent passage of tarry stools resulted in severe anemia (the lowest hemoglobin level was43 g/L) and an episode of syncope. The patient received transfusions of packed RBC to a total of 12 U, before surgery. Both endoscopy and colonscopy failed to detect the site of bleeding. Abdominal computed tomography showed a diffusely heterogeneous density infiltrating the whole spleen (Figure 1) and did not detect any GI tumors. The scan of Tc-99m RBC revealed evidence of active bleeding in the left mid-abdominal region. The patient then underwent an exploratory laparotomy on July 17, 2004. During surgery, the spleen was enlarged with multiple dark-red nodules on its surface (Figure 2). Intra-operative endoscopy failed to identify any site of bleeding. The serosa of the small intestine was intact and multiple small hemorrhagic patches (number >5) were observed at the jejunum and ileum (Figure 3). Splenectomy and resection of the small intestine containing hemorrhagic patches were then performed.
Macroscopically, the surgical specimen of the spleen measured 14 cm×10 cm×9 cm with a weight of 400 g, and the splenic parenchyma was diffusely scattered with multiple, irregular sized and dark-red color nodules. Mucosal tumors (size <1 cm) were identified at the resected small intestine. Microscopically, the spleen revealed neoplastic sinusoidal endothelial cells with
Jun-Te Hsu, Chin-Yew Lin, Ting-Jun Wu, Han-Ming Chen, Tsann-Long Hwang, Yi-Yin Jan

counterparts of the splenic tumors such as hemangioma or hemangioendothelioma[7,8]. In this case, no such risk factors were noted.
Splenomegaly with left-side upper abdominal pain occurs in over 70% of patients with splenic angiosarcoma[2,5]. Anemia and thrombocytopenia are the frequent findings of hematogram and are reported in more than 70% of cases[5,6]. Spontaneous splenic rupture presenting with acute abdominal pain has been reported in 13%-32% of patients[2,5,10]. Other systemic symptoms such as body weight loss, gum bleeding, fatigue, weakness, fever, chest pain, and GI bleeding have also been observed[2,5].
Metastases of the splenic angiosarcoma are frequent, occurring in 69–100% of cases[2,5]. The most common metastasis sites are the liver, lung, lymph node, bone, bone marrow, and soft tissue. To the best of our knowledge, the present patient is the first case report of splenic angiosarcoma metastasis to the small bowel.
Figure 1 Abdominal computed tomography identifies an enlarged spleen with a heterogeneous density involving the whole spleen.
Figure 2 The splenic parenchyma is diffusely scattered with multiple, irregular sized and dark-red nodules.
Figure 3 Multiple small hemorrhagic patches are identified at the jejunum and ileum.
Figure 4A Photomicrography of the spleen reveals neoplastic sinusoidal endothelial cells with marked cytological atypia (arrowhead) lining the congested sinusoid spaces (hematoxylin and eosin staining, 200×); B: immunohistochemical staining of the neoplastic cells is positive for factor XIII associated antigen (immunostain, 200×); C: histological examination of the specimen of small intestine shows metastatic neoplastic cells primarily distributed within the submucosal layer and focally extending to the mucosal layer (hematoxylin and eosin staining, 100×); D: photomicrography of the intestinal vessel reveals presence of individual neoplastic cells (arrowhead) within the vascular lumen (hematoxylin and eosin staining, 400×).
marked cytological atypia lining the congested sinusoid spaces (Figure 4A). The tumor cells were immunoreactive to factor XIII associated antigen (polyclonal, 1:500, Calbiochem Novabiochem, CA, USA, Figure 4B). The neoplastic cells of the small intestine only involved the mucosal and submucosal layers (Figure 4C); the muscular layer and serosa were intact and free of malignancy. They formed anastomosing network of sinusoids lined by pleomorphic endothelial cells, similar to those seen in the spleen. In addition, individual tumor cells were identified within the small vessels (Figure 4D). The diagnosis of primary splenic angiosarcoma with metastases of bones and small intestine was confirmed.
The patient had an uneventful post-operative course. He received external beam radiation therapy for his bone pain postoperatively. He did not experience GI bleeding again and survived with the disease 7 mo after surgery.
DISCUSSIONPATIENTS WITH splenic angiosarcoma may occur at any age[2,5–7]. The mean age of the reported patients was 50-60 years[2,5,6]. The pathogenesis of splenic angiosarcoma remains unknown. Reported causes are exposed to ionizing radiation[8] or chemotherapy for lymphoma[9]. However, some authors believed that splenic angiosarcoma develops from a previously existing benign
A
B
C
D
Hsu JT et al. Splenic angiosarcoma with bleeding gastrointestinal metastases 6561

6262 ISSN 1007-9327 CN 14-1219/ R World J Gastroenterol November 7, 2005 Volume 11 Number 41
Malignancies of the small bowel can be either primary or metastatic. Primary small bowel malignant tumors are rare with the incidence of about 1 per 100000 and a prevalence of 0.6%[11]. Secondary neoplastic involvement of the small bowel is more frequent than primary small bowel neoplasm by hematogenous spread, direct invasion or intraperitoneal seeding[12]. Metastatic malignant tumors from the colon, ovary, uterus, and stomach generally invade the small bowel via direct invasion or intraperitoneal spread. The breast cancer, lung cancer, and melanoma usually metastasize to the small bowel hematogenously. Based on the operative and histopathologic findings, this case is the first report of small bowel metastases from the splenic angiosarcoma via hematogenous route.
The prognosis for splenic angiosarcoma is typically very dismal with a 6-mo survival for only 20% of cases[2,4]. Notably, survival of pediatric patients was reported as extremely poor ranging from less than 1 mo to 2 years[13]. However, Falk et al[5] had reported that two adults survived at the last follow-up, 1 with disease at 8 years and the other disease-free at 10 years. Survival is favorable for early diagnosis with splenectomy before rupture[4,10]. Montemayor and Caggiano[14] also found that patients with splenic angiosarcoma had longer survival, if splenectomy was performed prior to rupture compared to after rupture (14.4 vs 4.4 mo).
Table 1 shows only three cases including this case that have experienced GI bleeding due to GI metastasis from the splenic angiosarcoma (Table 1). In patients with either primary or metastatic GI angiosarcoma, repeated GI bleeding and the need for blood transfusion made them hospitalization-dependent and debilitated. These patients frequently die of uncontrolled GI bleeding[15]. The survival of these patients in Allison’s study ranges from 1 wk to 3 years after resection of the foci[15]. No consensus yet exists regarding the need to treat patients with disseminated metastases aggressively. Nevertheless, salvage surgery (resection of small bowel metastases) combined with splenectomy to control bleeding and confirm diagnosis was justified in the present case. The patient survived with the disease, 7 mo after surgery without evidence of GI bleeding.
In conclusion, splenic angiosarcoma with bleeding GI
metastases is extremely rare. This case is the first report of metastatic small bowel malignancy from the splenic angiosarcoma. Salvage surgery to control bleeding due to the GI metastases is justified in this case.
REFERENCES1 Langhans T. Pulsating cavernous neoplasm of the spleen with
metastatic nodules to the liver. Vichows Arch Pathol Anat 1879; 75: 273-291
2 Neuhauser TS, Derringer GA, Thompson LD, Fanburg-Smith JC, Miettinen M, Saaristo A, Abbondanzo SL. Splenic angiosarcoma: a clinicopathologic and immunophenotypic study of 28 cases. Mod Pathol 2000; 13: 978-987
3 Chung YF , Busmanis I , Hong GS , Soo KC. Sp len ic angiosarcoma--an unusual cause of bleeding gastrointestinal tract. Singapore Med J 1999; 40: 106-108
4 Jimenez-Heffernan JA, Hardisson D, Prieto-Nieto MI, Burgos E. Ruptured primary splenic angiosarcoma into the colon. Presentation as anal bleeding. Acta Gastroenterol Belg 1999; 62: 248-251
5 Falk S, Krishnan J, Meis JM. Primary angiosarcoma of the spleen. A clinicopathologic study of 40 cases. Am J Surg Pathol 1993; 17: 959-970
6 Chen KT, Bolles JC, Gilbert EF. Angiosarcoma of the spleen: a report of two cases and review of the literature. Arch Pathol Lab Med 1979; 103: 122-124
7 Alt B , Hafez GR, Tr igg M, Shahidi NT, Gi lber t EF . Angiosarcoma of the liver and spleen in an infant. Pediatr Pathol 1985; 4: 331-339
8 Sordillo EM, Sordillo PP, Hajdu SI. Primary hemangiosarcoma of the spleen: report of four cases. Med Pediatr Oncol 1981; 9: 319-324
9 Zwi LJ, Evans DJ, Wechsler AL, Catovsky D. Splenic angiosarcoma following chemotherapy for foll icular lymphoma. Hum Pathol 1986; 17: 528-530
10 Autry JR, Weitzner S. Hemangiosarcoma of spleen with spontaneous rupture. Cancer 1975; 35: 534-539
11 Attanoos R, Williams GT. Epithelial and neuroendocrine tumors of the duodenum. Semin Diagn Pathol 1991; 8: 149-162
12 Gill SS, Heuman DM, Mihas AA. Small intestinal neoplasms. J Clin Gastroenterol 2001; 33: 267-282
13 Kren L, Kaur P, Goncharuk VN, Dolezel Z, Krenova Z. Primary angiosarcoma of the spleen in a child. Med Pediatr Oncol 2003; 40: 411-412
14 Montemayor P, Caggiano V. Primary hemangiosarcoma of the spleen associated with leukocytosis and abnormal spleen scan. Int Surg 1980; 65: 369-373
15 Allison KH, Yoder BJ, Bronner MP, Goldblum JR, Rubin BP. Angiosarcoma involving the gastrointestinal tract: a series of primary and metastatic cases. Am J Surg Pathol 2004; 28: 298-307
Science Editor Guo SY Language Editor Elsevier HK
Table 1 Primary splenic angiosarcoma with bleeding gastrointestinal metastases
Chung[3] 1999 54/M ND Splenectomy DOD, 10 moJimenez-Heffernan[4] 1999 71/F Colon(splenicflexure) Splenectomy,left DOD,9mo hemicolectomy, radiation Hsu, present 45/M Small bowel Splenectomy, resection of small AWD, 7 mo bowel metastases, radiation
Author/yr Age/sex Site of GI metastasis Treatment Status and time of follow-up
AWD; alive with disease; DOD, dead of disease; GI, gastrointestinal; mo, months; ND, not described.
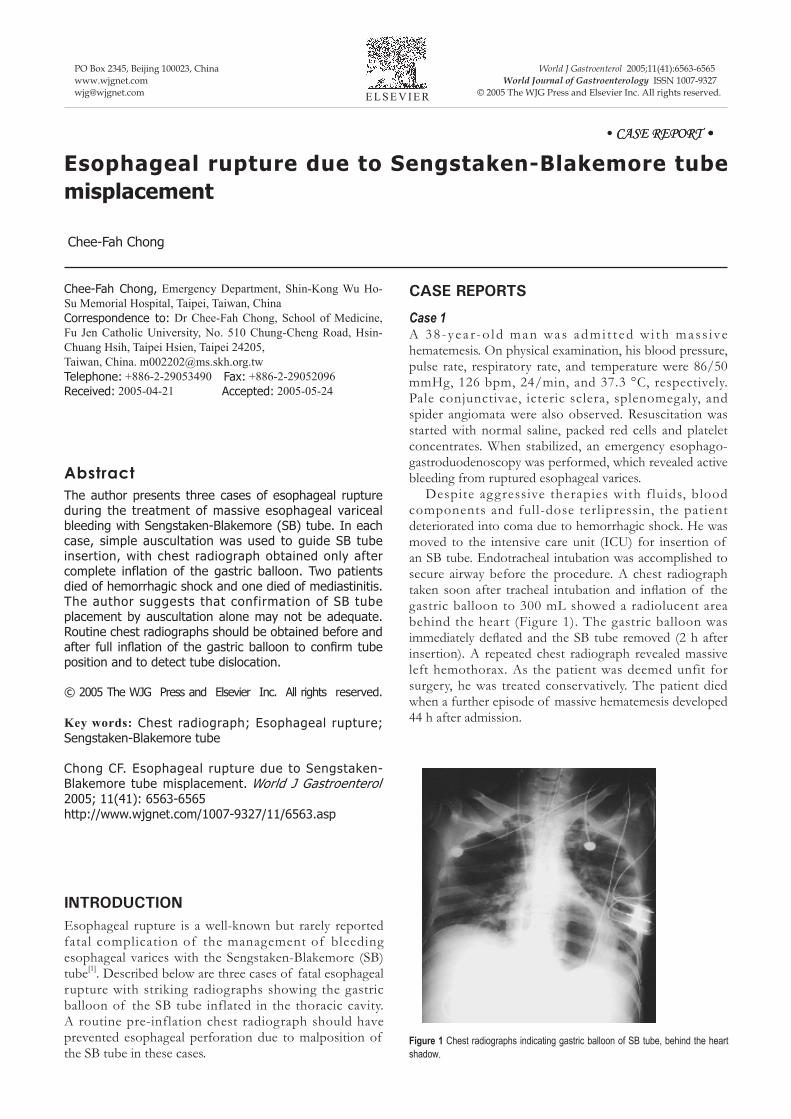
PO Box 2345, Beijing 100023, China World J Gastroenterol 2005;11(41):6563-6565www.wjgnet.com World Journal of Gastroenterology ISSN [email protected] © 2005 The WJG Press and Elsevier Inc. All rights reserved.E L S E V I E R
• ����� �������� •����� �������� • •
Esophageal rupture due to Sengstaken-Blakemore tube misplacement
Chee-Fah Chong
Chee-Fah Chong, Emergency Department, Shin-Kong Wu Ho-Su Memorial Hospital, Taipei, Taiwan, ChinaCorrespondence to: Dr Chee-Fah Chong, School of Medicine, Fu Jen Catholic University, No. 510 Chung-Cheng Road, Hsin-Chuang Hsih, Taipei Hsien, Taipei 24205, Taiwan, China. [email protected]: +886-2-29053490 Fax: +886-2-29052096Received: 2005-04-21 Accepted: 2005-05-24
AbstractThe author presents three cases of esophageal rupture during the treatment of massive esophageal variceal bleeding with Sengstaken-Blakemore (SB) tube. In each case, simple auscultation was used to guide SB tube insertion, with chest radiograph obtained only after complete inflation of the gastric balloon. Two patients died of hemorrhagic shock and one died of mediastinitis. The author suggests that confirmation of SB tube placement by auscultation alone may not be adequate. Routine chest radiographs should be obtained before and after full inflation of the gastric balloon to confirm tube position and to detect tube dislocation.
© 2005 The WJG Press and Elsevier Inc. All rights reserved.
Key words: Chest radiograph; Esophageal rupture; Sengstaken-Blakemore tube
Chong CF. Esophageal rupture due to Sengstaken-Blakemore tube misplacement. World J Gastroenterol 2005; 11(41): 6563-6565http://www.wjgnet.com/1007-9327/11/6563.asp
INTRODUCTIONEsophageal rupture is a well-known but rarely reported fatal complication of the management of bleeding esophageal varices with the Sengstaken-Blakemore (SB) tube[1]. Described below are three cases of fatal esophageal rupture with striking radiographs showing the gastric balloon of the SB tube inflated in the thoracic cavity. A routine pre-inflation chest radiograph should have prevented esophageal perforation due to malposition of the SB tube in these cases.
CASE REPORTS
Case 1A 38 -yea r-o ld man was admi t t ed w i th mas s ive hematemesis. On physical examination, his blood pressure, pulse rate, respiratory rate, and temperature were 86/50 mmHg, 126 bpm, 24/min, and 37.3 °C, respectively. Pale conjunctivae, icteric sclera, splenomegaly, and spider angiomata were also observed. Resuscitation was started with normal saline, packed red cells and platelet concentrates. When stabilized, an emergency esophago-gastroduodenoscopy was performed, which revealed active bleeding from ruptured esophageal varices. Despite aggressive therapies with f luids, blood components and full-dose terlipressin, the patient deteriorated into coma due to hemorrhagic shock. He was moved to the intensive care unit (ICU) for insertion of an SB tube. Endotracheal intubation was accomplished to secure airway before the procedure. A chest radiograph taken soon after tracheal intubation and inflation of the gastric balloon to 300 mL showed a radiolucent area behind the heart (Figure 1). The gastric balloon was immediately deflated and the SB tube removed (2 h after insertion). A repeated chest radiograph revealed massive left hemothorax. As the patient was deemed unfit for surgery, he was treated conservatively. The patient died when a further episode of massive hematemesis developed 44 h after admission.
Figure 1 Chest radiographs indicating gastric balloon of SB tube, behind the heart shadow.

6564 ISSN 1007-9327 CN 14-1219/ R World J Gastroenterol November 7, 2005 Volume 11 Number 41
Case 2A 49-year-old man was admitted to the ICU due to uncontrolled hematemesis from ruptured esophageal varices and hepatic encephalopathy. Physical examination showed that he was in deep coma (Glasgow coma scale of E2M1V1) and severe hypotension (BP 60/40 mmHg). Rapid endotracheal intubation followed by insertion of an SB tube was performed without difficulties. However, a chest radiograph ordered to check tube positions demonstrated a radiolucent circle (the gastric balloon) within the left hemithorax (Figure 2). The patient died of shock-related multiple organ failure on the third day of admission.
Case 3A 43-year-old male alcoholic was treated in the ICU for convulsions due to decompensated hepatic cirrhosis with grade IV encephalopathy. He was tracheally intubated with a Glasgow coma scale of E2M2VT. His vital signs were within the normal limits. However, he suffered a massive hematemesis on the third day of admission, which was the result of ruptured esophageal varices. An SB tube was inserted and a chest radiograph later showed a radiolucent area within the lower mediastinum (Figure 3). The patient developed fever, leukocytosis and shock in the following days and a chest computer tomography (CT) revealed findings compatible with mediastinitis. He died of sepsis 12 d after the admission.
DISCUSSIONThe management of acute bleeding episodes from r uptured esophagea l var ices cons is ts of volume replacement, pharmacological, mechanical (balloon tamponade), and surgical modes of arresting hemorrhage. While balloon tamponade using SB tube is effective in achieving initial hemostasis, it has a significant
complication rate. The most common complications of esophageal balloon therapy for varices include aspiration, esophageal perforation, and pressure necrosis of the mucosa[2]. The exact incidence of complications is difficult to determine, as it varies with the skill and experience of the surgical team, the duration of treatment, and the status of the patient. Aspiration of secretions is the most common complication of balloon tamponade, occurring in approximately 10%-20% of cases[3]. As described in past literature, cases with esophageal perforation can occur as a result of difficult SB tube inser tion[4], retching and vomiting[5], and repeated endoscopic sclerotherapy[6]. In each of our cases, the SB tube was inserted without documented difficulties. Intragastric position was confirmed with auscultation. A radiographic localization of the SB tube before full inflation of the gastric balloon was ignored. The diagnosis of esophageal perforation in each case was confirmed by a follow-up chest radiograph taken after full inflation of the gastric balloon. Though uncommon, esophageal rupture due to SB tube misplacement carries a high incidence of mortality from hemothorax or septic mediastinitis, as demonstrated in our patients. In conclusion, following insertion of the SB tube, confirmation of tube placement by auscultation alone may not be adequate. Routine chest radiographs should be obtained before and after full inflation of the gastric balloon to confirm correct tube position and to detect tube dislocation as soon as possible.
REFERENCES1 McGrath RB. Inadvertent gastric balloon inflation within the
chest in the management of esophageal varices. Crit Care Med 1986; 14: 580-582
2 Vlavianos P, Gimson AE, Westaby D, Williams R. Balloon tamponade in variceal bleeding: use and misuse. BMJ 1989; 298: 1158
3 Avgerinos A, Armonis A. Balloon tamponade technique and
Figure 3 Chest radiographs indicating gastric balloon of SB tube, in the lower mediastinum.
Figure 2 Chest radiographs indicating gastric balloon of SB tube, within the left lower hemithorax.

Chong CF. Complication of Sengstaken-Blakemore tube 6565
Science Editor Guo SY Language Editor Elsevier HK
efficacy in variceal haemorrhage. Scand J Gastroenterol Suppl 1994; 207: 11-16
4 Hamm DD, Papp JP. Rupture of esophagus during use of Sengstaken-Blakemore tube. Postgrad Med 1974; 56: 199-200
5 Zeid SS, Young Pc, Reeves Jt. Rupture of the esophagus
after introduction of the Sengstaken-Blakemore tube. Gastroenterology 1959; 36: 128-131
6 Crerar-Gilbert A. Oesophageal rupture in the course of conservative treatment of bleeding oesophageal varices. J Accid Emerg Med 1996; 13: 225-227