letter to shareholders - annualreports.com fellow shareholders: ... telsmith, inc. celebrates 95...
TRANSCRIPT


Dear Fellow Shareholders:
When I reflect on 2001, I am proud that our Company maintained stability, focus and energy in the face of considerable adversity. As the year began, we found ourselves in the midst of an economic recession that hit the manufacturing sector in the third quarter of 2000. We extended our string of consecutive profitable quarters to 18 through the first six months of 2001, the seasonally strongest portion of our year, but entered the third quarter facing a deepening recession, which further slowed customer orders, significantly lowered our revenues and resulted in a quarterly loss.
As the fourth quarter began, our domestic market was reeling from the deepening recession and the Godless, barbaric terrorist attack on our country on September 11. In addition, the strength of the U. S. dollar relative to foreign currencies made our products more expensive overseas and slowed the growth of our exports. These conditions caused us to fall well short of our sales projections and produced an even deeper quarterly loss than the third quarter.
All of these challenging market conditions led to disappointing finan-cial results for the year. In 2001, revenues were $455.8 million, down 12.5% from 2000. Net income in 2001 was $2.0 million, or $.10 per fully diluted share, down 92.4% from 2000.
Stability and Values. The recession of 2001 was the fourth we have weathered since the Company was founded in 1972. After each of these periods, we have emerged as a stronger and more vibrant company. Our experience in 2001 was no exception. Despite the extremely chal-lenging business environment, we stayed true to our company values by serving the customer, enhancing the skills of our associates, improving our business processes, introducing innovative new products, and growing our market share. We believe that the core purpose of our Company is to improve the quality of life for people all over the world by building the industry’s best equipment for improving the world’s infrastructure. We pursue this noble purpose by imbedding a value-centered culture in our business that produces daily behavior on the part of all our people that manifests these values.
Focus and Energy. As I reflect on my 35 years in the construction machinery manufacturing business, I find it interesting to examine the numerous management books that have been written and the business “models” that have been proposed. Many of these approaches seem to offer a simple solution for quick success and getting ahead of the competition. Business leaders spend hours upon hours strategizing and developing corporate structures that they claim will automatically get the job done without anyone having to get their hands dirty in the fundamentals and details of running a successful business.
One such business model, which is now popular in manufacturing, is to “outsource.” In this model, you don’t really manufacture anything; you just assemble. You don’t emphasize customer service, innovation or research. You build simple, antiquated equipment and sell it cheap while eliminating your workers and factories.
Lett
er T
o Sh
areh
olde
rs

If this “outsourcing” model for manufacturing construction machinery is correct, then the Astec model is totally wrong. We build specialized “niche” products. They require considerable application expertise, special design considerations, special attention and continuous education on how they should be operated. These functions cannot and should not be outsourced. Our business model may be “old-fashioned”, but we still believe in the day-to-day “blocking and tackling.” Our philosophy is to design, engineer, manufacture, install and service our products. We design and build as much of each product as we can. If we can outsource cheaper than we can build, we need to take another look at our manufacturing processes and improve them. We do that every day.
We continue to focus our energy on introducing innovative new products and serving the customers. In 2001, we launched several exciting new products that we believe will have a positive impact on our markets in the future. Each of our market segment groups came out with new products, which target specific challenges faced by our customers as they do their work. Among these new releases were:
• state of the art control systems; • Internet based parts and maintenance manuals; • a new generation of economical and high efficiency asphalt pavers and milling machines; • the only American made track-mounted jaw crusher; • new high production jaw crushers; and • three new modular aggregate processing plants.
We believe that it is our job to develop a steady stream of new products long before our customers realize that they need them—products that will reduce their costs, improve their quality, and make the roads they build even better. This requires a commitment to the long-term achievement of our industry and investment in engineering expertise, product development and R&D—all of which improve the quality of life on our planet. Our innovations in 2001 were products of this cultural commitment.
Looking Ahead. As we look forward to 2002, we believe we are well positioned to take advantage of a steady economic recovery that should produce significantly better financial performance.
Our business philosophy may be old-fashioned, but we believe it is the right one. We plan to continue it in the future, and we will train future generations to execute it even better than we do now. We are confident that this commitment will serve the interests of our customers, our industry as a whole, our associates and our shareholders by ensuring that Astec’s future will be even brighter than our past.
J. Don Brock, Ph.D. Chairman, President & CEO
Letter To Shareholders

The true measure of a visionary company lies not in the magnitude of its revenues and earnings or the range of its products or market share, but in the depth of its commitment to a core purpose and core values that manifest themselves in the behavior of the Company and its people.
Since its formation in 1972, Astec Industries, Inc. has become a visionary market leader known for its innovative and market leading products because it is driven by a culture embedded with a strong sense of purpose and sincerely held core values. The Astec Family’s core purpose, its fundamental reason for being, is:
To improve the quality of life for people all over the world by building equipment to improve the world’s infrastructure.
The Astec Family pursues its core purpose by doing business in accordance with its core values. These timeless guiding principles, which never change, are:
• Continuous devotion to meeting the needs of our customers; • Honesty and integrity in all aspects of business; • Respect for all individuals; • Preserving entrepreneurial spirit, innovation and focus through decentralization; and • Profit and growth as a means to ensure the success of the Company.
The value-centered pursuit of this noble core purpose produces visionary success that manifests itself in strong growth, stability, innovation and market leadership.
A Se
nse
of P
urpo
se &
Imbe
dded
Val
ues
A Sense of Purpose and Imbedded Values

The Company’s core purpose and the daily living of its core values have produced a future vision which continuously drives the business to excel. This vision is:
To grow and prosper by designing, manufacturing and selling the most innovative, productive and reliable equipment for building and restoring the world’s infrastructure, coupled with unparalleled customer service.
To achieve this vision, the Astec Family has established a number of principal goals that define the Compa-ny’s pursuit of continuous improvement and industry leadership. These goals are:
• Meet or exceed our customers’ expectations every day by providing a level of service, support and training that gives us a clear and sustainable competitive advantage;
• Be the industry’s most trusted, innovative and technologically advanced equipment resource;
• Produce equipment that represents the best blend of quality, performance and price and therefore the “best value” for our customers; • Create a respectful, fulfilling and invigorating work environment in which our associates are:
> Inspired to vigorously pursue our future vision; > Motivated to practice our core values; > Encouraged to grow personally and professionally; > Motivated to show initiative and take risks without fear; > Equipped to succeed; and > Recognized and rewarded for their contributions.
• Achieve and maintain the first or second largest geographic market share in each major product segment; and
• Continuously increase shareholder value by growing revenues on the average of 15% per year and net income even faster. Raise and solidify Astec’s visibility and attractiveness to the investment community.
The pursuit of these goals in a manner consistent with the Company’s core values has produced a highly motivated, value-centered family of associates whose innovation and devotion to service has produced a sustainable competitive advantage in Astec’s markets.
Vision & The Vigorous Pursuit of G
oals Vision and the
Vigorous Pursuit of Goals

••
••
••
••
Innovatorof the Industry
Innovatorof the Industry
Customer-DrivenCulture
Customer-DrivenCulture
Broadest Spectrumof Products
Broadest Spectrumof Products
ValueCentered
ValueCentered
A StrongSense of Purpose
A StrongSense of Purpose

AGGREGATE & MINING GROUPTelsmith, Inc.
Kolberg-Pioneer, Inc.Johnson Crushers International, Inc.
Breaker Technology Ltd.Production Engineered Products, Inc.
Superior Industries of Morris, Inc.Osborn Engineered Products SA (PTY) LTD.
Astec Systems, Inc.
ASPHALT GROUPAstec, Inc.
Pavement TechnologyHeatec, Inc.
CEI Enterprises, Inc.
MOBILE ASPHALT PAVING GROUPRoadtec, Inc.
Carlson Paving Products, Inc.
UNDERGROUND GROUPAmerican Augers, Inc.
Trencor, Inc.
FINANCIAL SERVICESAstec Financial Services, Inc.

Telsmith, Inc.Mequon, WisconsinTelsmith, Inc. celebrates 95 years of service to the aggregate and mining industries with innova-tive crushing, screening, and processing equipment. In 2001, Telsmith expanded its partner-ship role with the respective industries it serves by adding the “Iron Giant™” Jaw Crusher and the Modular Plant Guarantee to its product offering. The rugged “Iron Giant™” Jaw Crusher meets reliability and production needs for large aggregate producers while the Modular Plant Guarantee is the only “turnkey” modular system available in the industry.
Telsmith continues to expand the SBS “Silver Bullet® Series” cone crusher product line to fill the voids required in the industry and is currently developing “The QSP Plant”, an innovative solution for the dynamic and aggressive recycle marketplace.
Bolstering its sales organization and enhancing customer support through additional field tech-nicians are evidence of Telsmith’s desire to meet or exceed customer expectations every day.
Aggr
egat
e An
d M
inin
g G
roup
72” x 34ft. Track Mounted Heavy Duty VGF
Caption
57 SBS Cone Module
Core Products:• Jaw crushers• Cone Crushers• Horizontal shaft impactors• Vibrating feeders• Incline screens• Portable and stationary plant systems
8 x 20 Triple Deck Vibro-King® Screen Module
3858 Iron Giant Jaw Crusher

New modular plant at Vulcan Materials Sun City, Arizona quarry.

Kolberg-Pioneer, Inc.Yankton, South Dakota
Kolberg-Pioneer (KPI) offers advanced equipment that serves the entire crushed stone, sand and gravel process from crushing through screening, classifying and stockpiling. Major mar-kets served include: stationary crushed stone, sand & gravel operations, portable crushing and recycle operations.
In 2001, Kolberg-Pioneer’s focus on new product development produced the only American made Track Mounted crusher, Rocky Trax™. In addition, the new Vanguard jaw series was introduced along with the industry’s largest recycle jaw crusher. The Kolberg line of washing equipment and portable screening plants were significantly cost reduced in 2001 to be even more competitive in the marketplace. KPI also implemented machining equipment and factory work flow improvements to further increase manufacturing efficiency this past year.
Aggr
egat
e An
d M
inin
g G
roup
Kolberg classifying plant in Arkansas producing specification mason and concrete sands.
The Kolberg-Pioneer Rocky Trax™ is a portable track mounted jaw crusher. Twin Pioneer 4248 jaw crushers processing aggregate for an Interstate highway project in Utah.
Core Products:• Jaw crushers• Vertical shaft impactors• Horizontal shaft impactors• Washing and sand classification equipment• Portable screening plants• Portable and stationary conveyors• Portable plant systems
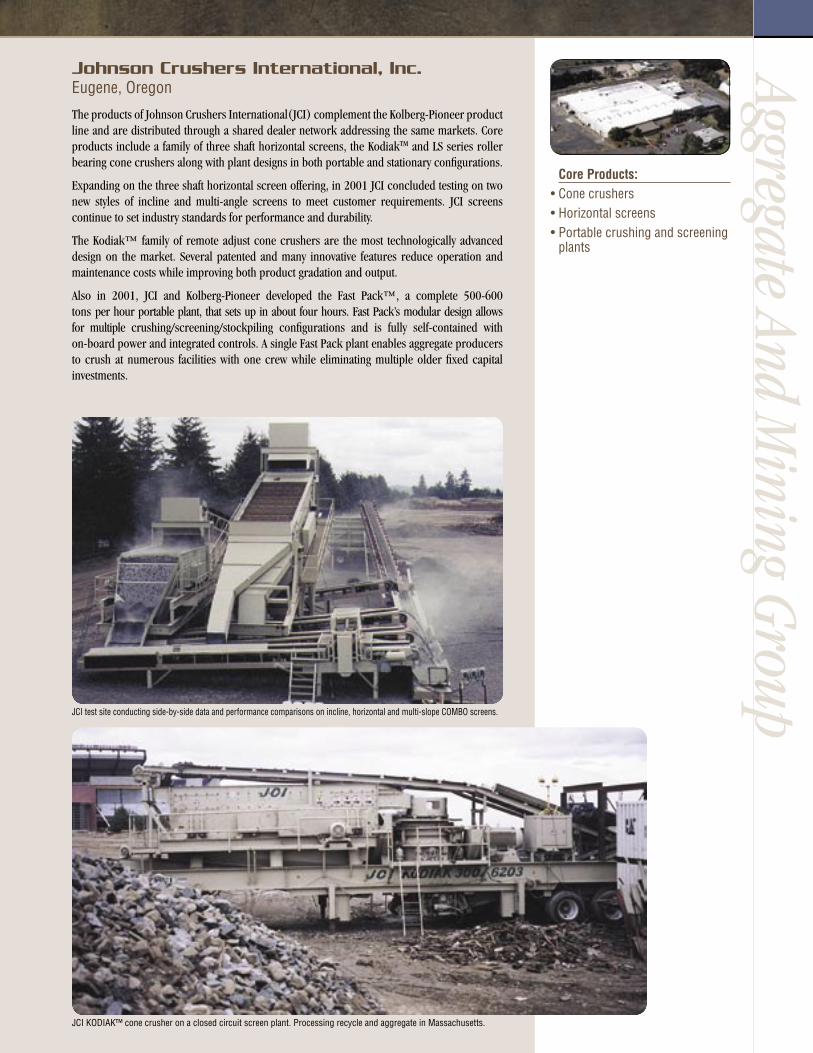
Johnson Crushers International, Inc.Eugene, Oregon
The products of Johnson Crushers International(JCI) complement the Kolberg-Pioneer product line and are distributed through a shared dealer network addressing the same markets. Core products include a family of three shaft horizontal screens, the KodiakTM and LS series roller bearing cone crushers along with plant designs in both portable and stationary configurations.
Expanding on the three shaft horizontal screen offering, in 2001 JCI concluded testing on two new styles of incline and multi-angle screens to meet customer requirements. JCI screens continue to set industry standards for performance and durability.
The Kodiak™ family of remote adjust cone crushers are the most technologically advanced design on the market. Several patented and many innovative features reduce operation and maintenance costs while improving both product gradation and output.
Also in 2001, JCI and Kolberg-Pioneer developed the Fast Pack™, a complete 500-600 tons per hour portable plant, that sets up in about four hours. Fast Pack’s modular design allows for multiple crushing/screening/stockpiling configurations and is fully self-contained with on-board power and integrated controls. A single Fast Pack plant enables aggregate producers to crush at numerous facilities with one crew while eliminating multiple older fixed capital investments.
Aggregate And Mining G
roup
JCI KODIAK™ cone crusher on a closed circuit screen plant. Processing recycle and aggregate in Massachusetts.
JCI test site conducting side-by-side data and performance comparisons on incline, horizontal and multi-slope COMBO screens.
Core Products:• Cone crushers• Horizontal screens• Portable crushing and screening plants
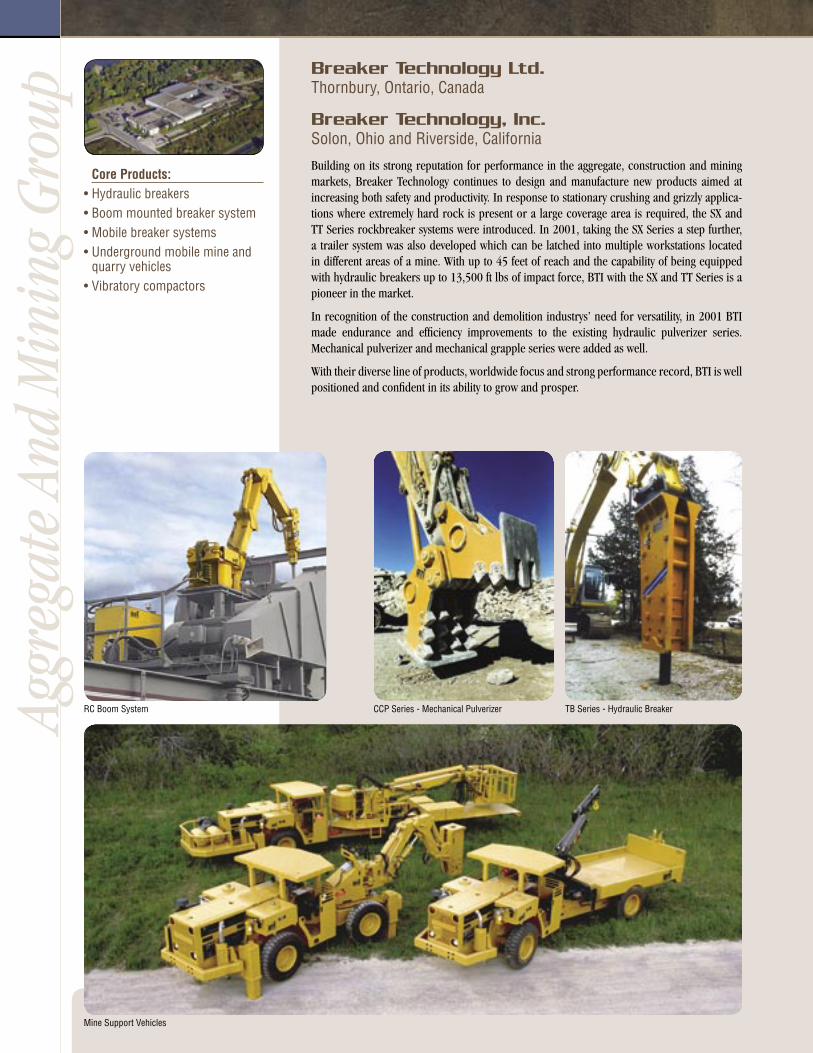
Breaker Technology Ltd.Thornbury, Ontario, Canada
Breaker Technology, Inc.Solon, Ohio and Riverside, California
Building on its strong reputation for performance in the aggregate, construction and mining markets, Breaker Technology continues to design and manufacture new products aimed at increasing both safety and productivity. In response to stationary crushing and grizzly applica-tions where extremely hard rock is present or a large coverage area is required, the SX and TT Series rockbreaker systems were introduced. In 2001, taking the SX Series a step further, a trailer system was also developed which can be latched into multiple workstations located in different areas of a mine. With up to 45 feet of reach and the capability of being equipped with hydraulic breakers up to 13,500 ft lbs of impact force, BTI with the SX and TT Series is a pioneer in the market.
In recognition of the construction and demolition industrys’ need for versatility, in 2001 BTI made endurance and efficiency improvements to the existing hydraulic pulverizer series. Mechanical pulverizer and mechanical grapple series were added as well.
With their diverse line of products, worldwide focus and strong performance record, BTI is well positioned and confident in its ability to grow and prosper.
Aggr
egat
e An
d M
inin
g G
roup
Mine Support Vehicles
RC Boom System CCP Series - Mechanical Pulverizer TB Series - Hydraulic Breaker
Core Products:• Hydraulic breakers• Boom mounted breaker system• Mobile breaker systems• Underground mobile mine and quarry vehicles• Vibratory compactors

Production Engineered Products, Inc.Sterling, Illinois
Recognized as an industry leader in fines removal, Production Engineered Products, Inc. serves the aggregate processing, asphalt and concrete recycling, and topsoil markets. PEP continued to strengthen its broad line of stationary and portable screening plants in 2001 with the introduction of the 3024 plant. This self-contained, portable plant has the same heavy-duty frame and quick set-up/teardown prevalent in all PEP portable screening plants. Expanding into untapped markets, the 3024 was designed and engineered specifically for low-volume production sites.
During the past year, PEP has taken a leadership role in the processing of recycled asphalt pavement (RAP) with their portable screening plants. This role has allowed asphalt producers to be more innovative in maximizing their usage of RAP for greater profitability and conserva-tion of resources. PEP plans to revolutionize the screening industry again in 2002 with the introduction of a new dual-frequency (DF) vibrating screen. The DF screen will combine the state-of-the-art high-frequency action introduced by PEP over 20 years ago with a more aggres-sive stroke. This type of screen will allow greater flexibility and significant cost-reduction to material producers.
Aggregate And Mining G
roup
PEP screening plant - PSP VV 2618M
PEP screening plant - Super Series III
PEP screening plant - Fold ‘n Go DV1612S
PEP stationary screen - VV 2618M
PEP screening plant - 4030 CF 2512
Core Products:• High-frequency vibrating screens• Portable and stationary tower structures for screens• Portable screening plants

Ag
greg
ate
And
Min
ing
Gro
upSuperior Industries of Morris, Inc.Morris, Minnesota
In 2001, Superior Industries continued to develop and add to its innovative line of conveying equipment and conveyor components. To complement a full line of belt conveyor idlers, Supe-rior introduced a full line of CEMA rated conveyor pulleys.
The demand for Superior’s TeleStacker™ conveyor continued to escalate. The fully automated telescoping conveyor method of stockpiling aggregates in windrows helps producers meet stringent specification requirements.
Dedication to customers will continue to drive Superior Industries as it develops new products that add to the broad line of portable and stationary conveying equipment and components available today.
Superior Conveyors, Shackopee Sand & Gravel, Shackopee, MN.
Idlers and pulleys. Superior field truss conveyors and TeleStackerTM - United Materials, Great Falls, Montana.
Core Products:• Portable and stationary conveyors• Conveyor idlers and pulleys• Portable telescoping stacking conveyors• Overland belt conveyors

Aggregate And M
ining Group
Osborn Engineered Products, SA (PTY) Ltd.Johannesburg, South Africa
Osborn has now completed its first fifteen months as a member of the Astec Family and the performance of the Company over this period has been solid. The Company manufactures a wide range of crushers, vibrating equipment, conveyors, other related products and complete systems for the aggregate processing and mining industries. South Africa is the main market, but exports include many countries among the sub-Saharan regions of Africa and off-shore Indian Ocean Islands, South America and Australia. Many of the company’s principal products are from the Telsmith line and have been adapted for Osborn’s markets over the course of its 50 year association with its sister company, Telsmith. In addition to a variety of “in-house” products, other smaller licenses with US and European OEMs complement the product and service range. The Company is looking to develop its established industry sectors and customer base and take advantage of opportunities outside of the traditional export territories.
Osborn’s IFE Exciter Driven vibrating screen.
Osborn plant and conveyor system at a coal mine in South Africa. Osborn Hadfields Single Toggle Jaw Crusher.
Osborn idlers and conveyor system at Samancor, South Africa.
Core Products:• Jaw crushers• Cone crushers• Double roll crushers• Rotary breakers• Processing and conveyor systems• Conveyor idlers• Vibrating screens and feeders

Ag
greg
ate
And
Min
ing
Gro
up
Aggregate And Mining G
roupAstec Systems, Inc.Chattanooga, Tennessee
Formed in late 2000 to capitalize on a growing market opportunity, Astec Systems, Inc. com-bines the systems engineering and construction expertise of Astec’s Asphalt Group with the broad product line and application knowledge of the Aggregate & Mining Group to offer a new generation of innovative modular aggregate processing plants. During 2001, three of these new generation systems were completed to rave reviews from customers. As the year drew to a close, several other plants were on the drawing boards. This new product line is expected to produce significant revenues in the future by offering customers highly efficient and productive state-of-the-art systems delivered for a fixed price on time in a turnkey installation.
All photos: New high production modular aggregate processing facility at Martin Marietta quarry near Freeport, Bahamas.

Astec, Inc.Chattanooga, Tennessee
Astec, Inc. is the undisputed world leader in hot mix asphalt production plants because it focuses on two things: service to the customer and the development of innovative products that guide the direction of the industry. Astec’s service department enjoys the reputation of being the industry’s customer service and customer training leader and strives to maintain this position every day. The research and development division is a separate operational arm within Astec and is dedicated to continuing the development of new products in the same spirit of innovation that Dr. J. Don Brock brought to the enterprise when he formed the company in the 1970’s.
The patented Double Barrel® drum mixer, and the Six Pack® series of highly portable plants, with refinements and improvements based on over 500 plants in service, continue to be the finest hot mix asphalt products on the market in the 21st century.
Asph
alt G
roup
Mobile hot mix asphalt facilities increase the contractor’s market area.
Technology for total facility control.
Permanent installations serve larger population centers.The exclusive Double Barrel® drum mixer has many unique features.
Core Products:• Stationary, relocatable and portable hot mix asphalt plants• Control systems• System design and installation


Pavement TechnologyCovington, GeorgiaPavement Technology (PTI), a division of Astec, Inc., is a manufacturer of asphalt and aggre-gate sampling and testing equipment and the nerve center of key industry research. Located in Covington, Georgia, PTI is the world’s leader in performance testing equipment. The Asphalt Pavement Analyzer (APA), PTI’s leading product, continues to help improve the quality of hot mix asphalt in the United States and around the world. The APA is used to predict the rutting, fatigue, and moisture susceptibility characteristics of asphalt mixes before the investment is made to place them on the roadway.
The Robotic Truck Sampling Device (RTSD) allows users to capture representative samples of asphalt from haul vehicles. These samples are used to check the quality of the mix being produced and determine changes that may be needed to the asphalt plant.
The PTI product line has become more diversified with increased emphasis on the aggregate industry. The Automatic Gradation Unit (AGU) is used to analyze large aggregate samples and produce real-time gradation results at aggregate processing plants.
PTI is also the home of Astec Corporate Materials and Research Lab known as “ROCDOC™”. This lab is now located in a new 3000 square foot building which includes a training center and focuses on the analysis of mix designs through research.
It appears that the hot mix asphalt industry is headed toward performance based specifications that will place greater emphasis on quality and greater responsibility on the asphalt construc-tion industry. With these trends imminent, PTI is well positioned to provide the industry with innovative products and technical expertise for the coming years.
Asphalt Group
Robotic Truck Sampling Device (RTSD) used to capture representative samples of hot mix asphalt or aggregate from haul vehicles.
Automatic Belt Sampler (ABS)captures a representative sample from a moving belt (asphalt or aggregate plant) without interruption to the production process.
Asphalt Pavement Analyzer (APA) used to predict the rutting, fatigue, and moisture damage characteristics of asphalt mixes.
Field Ignition Oven receives a representative sample from the Robotic Truck Sampling Device (RTSD), burns the sample, and produces a test report which is sent to the con-trol house at the asphalt plant.
Core Products:• Asphalt Pavement Analyzers• Asphalt Vibratory Compactors• Remote Truck Sampling Devices• Asphalt laboratory mixers• Mobile and stationary labs• Automatic Gradation Units• Belt samplers

As
phal
t Gro
upHeatec, Inc.Chattanooga, Tennessee
Heatec, Inc. specializes in manufacturing thermal fluid heating and storage equipment for the hot mix asphalt industry. Together with its sister company, CEI, Heatec enjoys a dominant market share in that market segment. Heatec has also enjoyed significant growth by introducing its wide range of products to other industries. In 2001, Heatec targeted a segment of the marine industry where heaters are used to heat certain types of cargo transported by barges.
Another industry in which Heatec has enjoyed success is the power generation industry. Work-ing closely with a major supplier of turbine engines has proved very fruitful. They use Heatec heaters to heat inlet combustion air for the turbines, enabling the turbines to operate at peak efficiencies and to prevent the formation of ice, which can destroy turbines.
At still other power plants Heatec has been involved in the development of a new concept for pre-treating natural gas that fuels the gas turbine engines. Heatec designed a system that heats the gas to prevent ice formation when its pressure is reduced for the engines. The system includes a heater and heat exchanger. It heats a solution of glycol-water, which in turn heats the gas as it is supplied the turbines.
Heatec also provided two heater systems for offshore platforms that were completed in 2001. The platforms produce oil and natural gas in the Gulf of Mexico. These highly specialized heater systems conform to the some of the strictest specifications found in the heating business. Heatec’s outstanding engineering, manufacturing and quality control departments make Heatec the supplier of choice for offshore heating equipment.
Heatec heater heats natural gas which fuels turbines at Ceredo electric generating station in West Virginia.
Anadarko’s Tanzanite offshore platform in the Gulf of Mexico uses a Heatec heater to process wellhead crude oil and gases.
Barge owned by PCS Phosphate in North Carolina uses Heatec heater to maintain cargo of sulphur in molten state.
Black Hills power plant in Gillette, Wyoming uses two Heatec heaters to heat inlet air for new gas-turbine generators.
Core Products:• Helical coil heaters• Astec cement tanks• Fuel storage tanks• Convectec™ heaters• Vertical serpentine heaters/ vaporizers• Vertical mixing tanks• Waste heat recovery units• Steam generators• Fuel metering systems• Terminal heaters• Portable and stationary polymer blending systems

Asphalt G
roupCEI Enterprises, Inc.Albuquerque, New Mexico
CEI Enterprises, Inc. enjoys a strong reputation in the thermal fluid heating, mixing, and stor-ing industry. CEI and its sister company, Heatec, Inc. have achieved the dominant market share for its products in the hot mix asphalt industry. Already a leader in the design and construc-tion of environmentally sensitive equipment, in 2001 CEI Enterprises introduced refinements to its asphalt/rubber blending equipment. The equipment enables customers to blend rubber from reclaimed tires with hot liquid asphalt, helping to reduce overall costs while cleaning the environment. The company also boosted its international presence with the introduction of the NOMAD™ Compact Asphalt Plant. Unusually small and completely portable, NOMAD™ was designed and engineered specifically for low-volume export markets.
Vertical AC Tank provides optimum agitation, heating, and storage for polymer modified asphalt.
PDM 6628 NOMAD™ Portable HMA Plant produces up to 130 TPH of hot mix. Now available for the domestic and international markets.
Complete storage systems for asphalt, polymer modified asphalt, or fuel.
Horizontal storage tanks for asphalt, fuel, and water. Coiled, direct fired, and electrical heated options available.
CEI’s Jacketed Firebox Heater provides reliable, efficient heating for all plant components. Outputs range from 1.2 to 6.3 million BTU/hr.
Core Products:• Astec cement tanks• Helical coil heaters• Jacketed firebox heaters• Fuel tanks• Reaction tanks• Asphalt rubber blending systems• NOMAD™ portable hox mix asphalt facilities

M
obile
Asp
halt
Pavi
ng G
roup
Roadtec, Inc.Chattanooga, Tennessee
2001 was a year of significant growth for Roadtec Inc., which designs, manufactures and markets a complete line of mobile asphalt paving and cold planing equipment. With the introduction of two new commercial class asphalt pavers, this Astec subsidiary experienced considerable growth in this segment of the market in 2001. Roadtec also experienced substan-tial increases in cold planer sales due to several product enhancements introduced in 2001. The centerpiece of Roadtec’s product line continues to be the revolutionary Shuttle Buggy® material transfer vehicle which continues to set new standards for productivity and pavement quality. The entire Roadtec product line is designed and engineered for unequaled productivity, versatility and ease of operation with an emphisis on simplicity and accessibility for low cost maintenance. Roadtec products continue to lead the way in the critical area of improved pave-ment quality.
The SB-2500B Shuttle Buggy® material transfer vehicle can store and transfer hot-mixed asphalt material from a truck to a paver for continuous paving.
The RP 155 is a powerful compact 8’ (2.5m) wide rubber track asphalt paver designed to work in all types of sub-grades and paving applications.
Roadtec’s RX-70 and RX-68B are shown here cold planing a section of I-65 near the Kentucky, Tennessee border.
The RP150 is an 8’ (2.5 m) wide asphalt paving machine with a shorter wheel-base, allowing for greater maneuverability without sacrificing performance.
Core Products:• Cold planer milling machines• Cold in-place recycling machines• Sidecutter attachments• Rubber tire and track-driven asphalt pavers• Shuttle Buggy® material transfer vehicles• Road widener attachments


Carlson Paving Products, Inc.Tacoma, Washington
Starting in January 2001, Carlson Paving Products continued its tradition of customer-driven product enhancements by upgrading the “EZIII” paver screed to all-electric heat and improved the newer “EZIV” in other significant ways. In May, two demonstration trucks were added and are used to market the EZIII and EZIV to potential customers. Based on customer responses and new sales, this is a success for the sales department. In November 2001, the first model of the “CP1220” utility cold planer milling machine rolled off the production line, adding a new dimension to Carlson’s core products. This new machine is used for the small jobs encountered during a resurfacing project and is just the right size for municipalities. Plans and prototypes are already in place for two new core products for 2002.
Mob
ile A
spha
lt Pa
ving
Gro
up
Carlson’s EZIII Screed has recently been upgraded adding electric wide blade heating elements and is a versitile screed designed to fit highway class and commercial pavers.
Specially fitted truck for demonstrating Carlson screeds to customers. The RX-10 also known as the CP1220 is a utility cold planer milling machine.
Core Products:• Cold planer milling machines• Screeds for highway class and commercial asphalt pavers

American Augers, Inc.West Salem, Ohio
American Augers has been a leader in the trenchless construction industry for more than 30 years. From its beginnings as a manufacturer of market-leading horizontal earth boring machines to its current role as the world’s known supplier of large directional drills, American Augers continues to sit at the forefront of this growing and changing industry.
In 2001, American Augers continued its award-winning tradition of innovation with the introduction of the DD-10 directional drill, which was named to the Construction Equipment Magazine Top 100 new products for 2001. The company also introduced the fi rst true 72” horizontal auger boring machine with the completion of its new 72-1200S . The Company was also recognized for its growth and vision when it was named as part of the Weatherhead 100, a prestigious list of the 100 fastest-growing companies in Northeastern Ohio. In addition, Ameri-can Augers received the Ohio Governor’s E-Award for Excellence in Exporting in 2001.
American Augers plans to produce several new large directional drilling machines during 2002, including a million-pound drill that will be the largest ever produced.
Underground Group
American Augers’ directional drills install oil and gas pipelines all over the world.
An American Augers DD-8 working outside Dallas, Texas.
American Augers also manufactures a variety of other products, like this MCM-4000 drilling fl uid cleaning and mixing system, for the trenchless construction industry.
One of American Augers’ DD-6 directional drills on the job in Detroit, Michigan.
International markets, especially the Far East, offer many opportunities for American Augers’ directional drilling products.
Core Products:• Auger boring machines• Directional drills• Drilling fl uid systems• Auger sections, drill pipe and
cutting heads• Mud pumps

Trencor, Inc.Grapevine, Texas
With the ability to cut a trench as big as 5-ft. wide and 32-ft. deep through solid rock in a single pass, Trencor, Inc. trenching equipment is the toughest and most durable in the world. Trencor’s large heavy-duty machines utilize a unique mechanical power train, which transfers maximum horsepower to the digging chain. Trencor machines are used in the pipeline, utility, communication and highway construction industries. Trencor’s patented Road Miner® attachment is used for rock excavation where blasting is not allowed. During 2001, Trencor introduced two new side shift trencher models. The 860C and 660C allow the contractor to trench next to a guardrail or other obstruction by shifting the digging mechanism either right or left as required. These new models are equipped with truck-loading conveyors so no spoil ever touches the ground. 2001 also saw the development of the 1660HDE Magnum, a 750 hp machine that is capable of trenching 72-inches wide. This machine was developed for the strong pipeline industry which is using larger and larger pipe.
Trencor operates from a modern 176,000-sq. ft. facility in Grapevine, Texas.
Unde
rgro
und
Gro
up
Core Products:• Hydrostatic chain trenchers• Mechanical chain trenchers• Rock saws• Wheel trenchers• Canal excavators• Drainage machines
A Trencor 1260 HD cutting on various ranging grades for a storm drainage project on I-35W, North of Fort Worth, Texas.
The Trencor Model 930HD Wheel Trencher cutting 1 meter wide and 2 meters deep thru frozen ground in Western Canada for a cross country gas pipeline.
The Trencor Model 1660HDE “Magnum” Chain Trencher. With a 72 inch maximum width cut and 12 foot digging depth this unit weighs 305,000 pounds.


Astec Financial Services, Inc.Chattanooga, Tennessee
Astec Financial Services, Inc., a multifaceted equipment financing operation is headquar-tered in Chattanooga, Tennessee. Astec Financial works directly with other Astec subsidiary companies to create and provide individual equipment financing packages which best meet the customers’ needs.
Equipment financing through Astec Financial is provided on a national basis to aggregate pro-cessing and hot-mix asphalt producers and paving companies. Transaction size ranges from $20 thousand to $15 million with flexible terms. Astec Financial has completed over $350 mil-lion in equipment financing transactions over the last 5 years.
Astec Financial offers the following products:
• Secured Term Loans — provided to companies for financing the acquisition of new Astec equipment or trade-ins.
• Tax Leases — structured for companies who prefer to pass the tax benefits of ownership to a lessor for lower financing costs.
• Lease Purchases — for companies who want short-term rental-purchase programs.
• Floor Plans — for dealers selling Astec products in various parts of the country.
Astec Financial’s service-oriented staff combines knowledge and expertise in all facets of the equipment industry. This expertise results in the design of innovative leasing and secured loan transactions which complement the equipment being financed.
With an emphasis on serving the needs of capital intensive companies, Astec Financial has the experience and the capital to creatively meet our customers’ equipment financing requirements.
Fina
ncia
l Ser
vice
s
Services Include:• Secured term loans• Tax leases• Lease purchases• Floor plans

Management’s Discussionand Analysis
•
Financial Statementsand Notes
Management’s Discussionand Analysis
•
Financial Statementsand Notes


33
SELECTED CONSOLIDATED FINANCIAL DATA(in thousands, except as noted*)
Second Quarter
ThirdQuarter
FourthQuarter
2001 2000 1999 1998 1997
Consolidated Income Statement Data
Net sales $ 455,839 $ 520,688 $ 449,627 $ 363,945 $ 265,365Selling, general and administrative expenses 71,691 69,011 56,280 46,796 36,125
Research and development 7,448 6,726 5,356 4,681 3,707Income from operations 11,784 47,138 52,521 40,427 24,661Interest expense 9,367 8,652 4,253 2,709 2,398Net income 1,992 26,281 31,712 24,436 13,809Earnings per common share*(1)Basic .10 1.37 1.66 1.30 .72Diluted .10 1.33 1.59 1.26 .71
Consolidated Balance Sheet Data
Working capital $ 161,867 $ 153,389 $ 127,569 $ 81,865 $ 71,459Total assets 400,691 398,795 355,437 248,320 192,243Total short-term debt 2,368 1,986 596 646 500Long-term debt, less current maturities 127,285 118,511 102,685 47,220 35,230Shareholders’ equity 197,347 194,623 167,258 132,658 105,612Book value per commonshare at year-end*(1) 10.07 10.07 8.75 7.44 6.12
Quarterly Financial Highlights (Unaudited)
2001 Net sales $ 143,310 $ 126,287 $ 103,124 $ 83,118Gross profit 31,323 29,422 17,192 12,986Net income 5,303 4,953 (1,346) (6,918)Earnings per common share* Basic .27 .26 (.07) (.35)Diluted .27 .25 (.07) (.35)
2000 Net sales $ 140,872 $ 159,726 $ 103,036 $ 117,054 Gross profit 33,758 40,858 24,608 23,651Net income 8,627 12,719 3,407 1,528Earnings per common share*Basic .45 .66 .18 .08Diluted .44 .64 .17 .08
Common Stock Price*
2001 High $ 14.81 $ 19.17 $ 19.27 $ 15.862001 Low 12.00 12.00 11.25 11.91
2000 High 28.06 29.88 25.50 14.382000 Low 16.75 22.81 9.94 8.38
First Quarter
The Company’s common stock is traded on the National Association of Securities Dealers Automated Quotation (NASDAQ) NationalMarket under the symbol ASTE. Prices shown are the high and low bid prices as announced by NASDAQ. The Company has never paidany dividends on its common stock.The number of common shareholders is approximately 6,000.
(1) Restated for 1998 and prior to retroactively reflect the two-for-one stock split effected in the form of a dividend on January 18, 1999.
34
MANAGEMENT’S DISCUSSION AND ANALYSIS OF FINANCIALCONDITION AND RESULTS OF OPERATIONS
Results of Operations; 2001 vs. 2000
The following discussion contains forward-looking statements that involve inherent risks and uncertainties. Actualresults may differ materially from those contained in these forward-looking statements. For additional informationregarding forward-looking statements, see “Forward-looking Statements” on page 17 of the Company’s Form 10-K.
Net income for 2001 was $1,992,000, or $.10 per diluted share, a decrease of $24,289,000, or 92.4%, comparedto net income of $26,281,000, or $1.33 per diluted share in 2000.The weighted average number of commonshares outstanding at December 31, 2001 was 19,753,226 compared to 19,721,288 at December 31, 2000.
Net sales for 2001 were $455,839,000, a decrease of $64,849,000, or 12.5%, compared to net sales of$520,688,000 in 2000. Excluding acquisitions, total sales declined $87,380,000, or 16.8%, to $433,308,000 in2001 from $520,688,000 in 2000.
The 2001 domestic sales decreased from $457,189,000 to $364,428,000, a decrease of $92,761,000, or20.3%, from 2000. Domestic sales are generated primarily from equipment purchases made by customers foruse in construction for privately funded infrastructure development and public sector spending on infrastructuredevelopment. Public sector spending at the federal, state and local levels is driven in large part by federalspending under the six-year federal-aid highway program, the Transportation Equity Act for the 21st Century(“TEA-21”) enacted in June 1998.TEA-21 authorized the appropriation of $217 billion in federal aid for road,highway and bridge construction, repair and improvement and other federal highway and transit projects forfederal fiscal years October 1, 1998 through September 30, 2003. During 2001, domestic sales were negative-ly impacted by a general economic slowdown and delays in capital expenditures by our customers who theCompany believes were concerned as to when the economy would improve.The Company believes that theterrorist attacks somewhat paralyzed sales order activity for six to eight weeks.The negative impact from theeconomic slowdown was felt throughout the year.
International sales in 2001 increased $27,912,000, or 44.0%, to $91,411,000 compared to 2000 internationalsales of $63,499,000. Increased sales in South Africa (Osborn acquisition), Europe, Central America, China,Korea, Japan and South America comprise most of the increase over 2000. Excluding acquisitions in SouthAfrica, international sales increased $10,875,000, or 17.1%. Sales in the asphalt, mobile asphalt paving andaggregate segments accounted for the increase in Europe.The increase in Central America was due to aggre-gate, underground and mobile asphalt paving segment sales.
Parts sales increased from $83,860,000 in 2000 to $93,493,000 in 2001, an increase of $9,633,000, or 11.5%.The increase was primarily due to the mobile asphalt paving and asphalt segments. Both segments havefocused heavily on parts sales improvements. Excluding acquisitions, parts sales incresed 4.7%.
Gross profit decreased to $90,924,000, or 20.0% of net sales in 2001 compared to $122,875,000, or 23.6% ofnet sales in 2000. A lack of utilization of capacity, decreased sales volumes (except mobile asphalt paving) andcompetitive price pressure resulted in all segments having reduced gross margins.
In 2001, selling, general and administrative expenses increased to $71,691,000, or 15.7% of net sales from$69,011,000, or 13.3% of net sales in 2000.The SG&A increase was the result of two acquisitions in the fourthquarter of 2000 being included in 2001 for a full twelve months. Excluding the increase from the acquisitions,SG&A would have decreased slightly in 2001 from 2000. Excluding increases in legal fees, legal settlementsand bad debt expenses related to one large repossession, the Company’s SG&A expense would have reflect-ed the expense reductions made throughout 2001.
Research and development expenses increased by $722,000, or 10.7%, from $6,726,000 in 2000 to$7,448,000 in 2001. Excluding 2000 acquisitions, research and development increased 4.3% as the Companycontinued developing innovative products.
Interest expense for 2001 increased to 2.1% of net sales from 1.7% of net sales for 2000.The increase in dol-lars related primarily to interest on borrowings required for acquisitions in 2000 and increased working capital.The percentage was impacted by decreased sales volume.
Income tax expense for 2001 was 41.2% of pre-tax income compared to 38.5% in 2000.The non-taxdeductible items in 2001 had a greater impact on the effective tax rate percentage relative to a smaller pre-taxincome.
The backlog at December 31, 2001 was $64,934,000 compared to $89,552,000 at December 31, 2000.Thebacklog for asphalt plant orders, aggregate orders, aggregate systems and mobile equipment decreased.TheCompany is unable to determine whether this backlog effect was experienced by the industry as a whole.Weare unable to assess the amount of the impact attributable to the TEA-21 legislation which became effective in October 1998.While the backlog reflects a decline, management believes that this is reflective of the current eco-nomic conditions in the United States and the current hesitancy of the Company’s customers to commit to capitalequipment purchases.The hesitancy is a result of our customers awaiting improvement of economic conditions orthe awarding of new contracts for jobs.The total value of highway contracts increased by $1.1 billion, or 3.6%, in2001 as reported by the American Road and Transportation Builders Association in January 2002.The number ofcontracts put in place in 2001 declined, but the average size increased. Some contracts are multi-year contracts.Highway funding in 2002 is dependent upon funding of highway programs by the states, TEA-21 federal fundingand the economy, which we expect to have a gradual recovery.
Forecasts by the Office of Management and Budget and the Treasury Department indicate a decline in funding forTEA-21 in 2003. Legislation has been introduced to restore part of the $8.6 billion projected shortfall and legisla-tive efforts are underway to restore all of the shortfall. Unquestionably, increased funding is needed to restore thenation’s highways to a quality level required for safety, fuel efficiency and mitigation of congestion.
Asphalt Group: This segment had a decrease in sales of $45,149,000, or 24.0%, and a segment profitdecrease of $12,975,000, or 72.1%, compared to 2000.The primary reason for the decrease in sales is theeconomic downturn. Competitive price pressure and lack of utilization of capacity significantly impacted grossprofits and segment income.
Aggregate and Mining Group: The 2001 sales for this segment decreased $8,063,000, or 4.2%, compared to2000. Excluding acquisitions, sales declined $25,102,000, or 13.1%.The decline in domestic sales, due to theweakness of the U.S. economy, was partially offset by increased international sales. Segment profit decreased$10,907,000, or 59.4% from 2000. Competitive price pressure, lack of utilization of capacity and product miximpacted gross profit and segment income.
Mobile Asphalt Paving Group: The 2001 sales in this segment increased $15,220,000, or 24.1%, compared to2000. Excluding acquisitions, sales increased $9,727,000, or 15.4%. Both domestic and international salesincreased over 2000 levels. Segment profit increased $677,000, or 8.1%. Product mix, lack of utilization of capacityand increased SG&A expenses impacted the 2001 profit.
Underground Group: The 2001 sales in this segment decreased by $27,093,000, or 35.8%, compared to 2000,primarily due to fewer small machine sales to the communications industry. Segment profit decreased$11,673,000, or 170.8%, primarily from lack of utilization of capacity and increased selling expenses fromefforts focused on generating sales to offset the negative impact of the communications industry.
Results of Operations; 2000 vs. 1999
Net income for 2000 was $26,281,000, or $1.33 per diluted share, a decrease of $5,431,000, or 17.1%, com-pared to net income of $31,712,000, or $1.59 per diluted share in 1999.The weighted average number of com-mon shares outstanding at December 31, 2000 was 19,721,288 compared to 19,930,376 at December 31, 1999.
Net sales for 2000 were $520,688,000, an increase of $71,061,000, or 15.8%, compared to 1999.The 2000domestic sales increased from $403,832,000 to $457,189,000, or $53,357,000, a 11.7% increase. During2000, domestic sales were negatively impacted by rising interest rates, volatile and rising gas and oil prices,the beginning stages of a general economic slowdown and delays in public sector highway projects. Most ofthis negative impact was felt in the second half of the year.The increase in total sales is attributed primarily to1999 acquisitions accounting for sales of $90,800,000 (with a full year of operations in 2000), offset by a$19,739,000, or 4.3% decline in internally generated sales.
International sales in 2000 increased $17,704,000, or 38.7%, to approximately $63,499,000 compared to 1999international sales of $45,795,000. Increased sales in Central America, Africa and Australia comprise most ofthe increase over 1999. Asphalt plant equipment and underground equipment accounted for the increase inAustralia.The increase in Africa and Central America was due to aggregate equipment sales.
Parts sales increased from $73,946,000 to $83,960,000, or 13.5%.
35
MANAGEMENT’S DISCUSSION AND ANALYSIS (CONTINUED)

36
MANAGEMENT’S DISCUSSION AND ANALYSIS (CONTINUED)
Gross profit was 23.6% of net sales in 2000 compared to 25.4% of net sales in 1999. Gross profit declines inasphalt and aggregate equipment accounted for most of the reduction.The erosion in both cases resulted fromcompetitive price pressure and a lack of utilization of capacity primarily due to lower sales volumes.
In 2000, selling, general and administrative expenses increased to 13.3% of net sales from 12.5% of net salesin 1999.The primary reason for the dollar increase in SG&A is related to acquisitions in 1999 and 2000.Thepercentage is impacted by lower than expected sales while being staffed and equipped for much larger vol-ume.
Research and development expenses increased by $1,370,000, or 25.6%, from $5,356,000 in 1999 to$6,726,000 in 2000. Excluding 1999 and 2000 acquisitions, research and development increased 9.7% as theCompany continued developing innovative products.
Interest expense for 2000 increased to 1.7% of net sales from 0.9% of sales for 1999.The increase in dollarsrelated primarily to borrowings required for acquisitions in 1999 and 2000 plus increased working capital.
Income tax expense for 2000 was $16,441,000 compared to $19,819,000 for 1999, or 38.5% of pre-taxincome for both years.
The backlog at December 31, 2000 was $89,552,000 compared to $96,572,000 at December 31, 1999 (restat-ed for acquisitions).The backlog for asphalt plant orders decreased significantly from 1999, while aggregateorders, primarily related to South Africa and aggregate systems business, increased from the prior year.
Asphalt Group: This segment had a decrease in sales of $4,703,000, or 2.4%, and a segment profit decreaseof $7,452,000, or 29.3%, compared to 1999.The primary reasons for the decrease in sales are instability ofgas and oil prices, delay of public sector construction projects and increasing interest rates. Competitive pricepressure and lack of utilization of capacity significantly impacted gross profits and segment income.
Aggregate and Mining Group: The 2000 sales for this segment increased $35,731,000, or 23.0%, over 1999, pri-marily due to the acquisitions of Superior Industries of Morris, Inc. and Breaker Technology Ltd. in late 1999 andOsborn Engineered Products SA (Pty) Ltd. in late 2000. Segment profit increased $168,000, or 0.9% over 1999.Competitive price pressure and lack of utilization of capacity impacted gross profits and segment income.
Mobile Asphalt Paving Group: The 2000 sales in this segment decreased $4,107,000, or 6.1% versus 1999.Segment profit also decreased $2,856,000, or 25.5%.The decrease in sales was present in all product lines.Therewas some competitive price pressure, but there was less gross profit percent impact than in other segments.
Underground Group: The 2000 sales in this segment increased by $44,238,000, or 140.4%, over 1999, primar-ily from sales by American Augers, Inc., a November 1, 1999 acquisition, which were included for the full yearof 2000.The directional drilling business of American Augers grew in connection with the optical fiber cableand other utility industries.The addition of American Augers’ volume required reporting of this new segmentunder the provisions of FAS 131.
Liquidity and Capital
During 2001, the Company continued to maintain a strong financial position while funding capital projects andworking capital needs with cash provided by operations, bank borrowings, Senior Secured Notes and low inter-est rate Industrial Revenue Bonds. At December 31, 2001, working capital totaled $161,867,000 compared to$153,389,000 at December 31, 2000.
Total short-term borrowings, including current maturities of long-term debt, were $2,368,000 at December 31,2001 compared to $1,986,000 at December 31, 2000. A financing agreement for imported, purchased invento-ry items accounted for $964,000 and $1,327,000 of the short-term borrowings at December 31, 2001 and2000, respectively, while outstanding Industrial Development Revenue Bonds accounted for $500,000 of thecurrent maturities of long-term debt at December 31, 2001 and December 31, 2000. Net cash provided byoperating activities for the twelve months ended December 31, 2001 was $1,452,000 compared to$23,288,000 for the twelve months ended December 31, 2000.The decrease in net cash provided by operat-ing activities is primarily due to decreased net income in 2001.

37
MANAGEMENT’S DISCUSSION AND ANALYSIS (CONTINUED)
Long-term debt, less current maturities, increased to $127,285,000 at December 31, 2001 from $118,511,000at December 31, 2000. At December 31, 2001, $80,000,000 was outstanding under the Note PurchaseAgreement, $28,013,000 was outstanding under the revolving credit facility and $19,200,000 was outstandingunder the long-term principal portion of Industrial Revenue Bonds.The increase in debt from December 31,2000 related primarily to funding working capital needs for the Company.
On September 10, 2001 the Company and Astec Financial Services, Inc., entered into a Note PurchaseAgreement for $80,000,000 of Senior Secured Notes, placed with private institutions, due September 10, 2011at a fixed rate of interest of 7.56%. On September 10, 2005 and on each September 10 thereafter, theCompany must make a principal payment of $11,428,571. Interest will be due and payable semiannually oneach March 10 and September 10. As part of this agreement, the Company must maintain certain net worthand fixed charge coverage ratios.
As of December 31, 2001, the Company was not in compliance with two financial ratio covenants contained inthe Note Purchase Agreement.These covenant violations were waived by a majority vote of the note holderseffective December 31, 2001. On March 12, 2002 an amendment was executed to the Note PurchaseAgreement.The amendment (1) served to relax certain financial ratio covenants for 2002, (2) provided for aninterest rate surcharge of 0.375% if the Company does not meet the original financial ratios required by suchcovenants and (3) provided for additional security for the note holders in certain situations.
The Company currently anticipates that it will satisfy the revised financial ratio covenants of the Note PurchaseAgreement for the next four calendar quarters. No assurances can be provided that financial ratio covenant vio-lations of the Note Purchase Agreement will not occur in the future or, if such violations occur, that the noteholders will not elect to pursue their contractual remedies under the Note Purchase Agreement, includingrequiring the immediate repayment in full of all amounts outstanding.There can also be no assurance that theCompany can secure adequate or timely replacement financing to repay its note holders in the event of anunanticipated repayment demand.
On September 10, 2001, the Company entered into an unsecured $125,000,000 revolving loan agreementwith a syndicate of banks which expires on September 10, 2004. At December 31, 2001, the Company wasutilizing $28,013,000 of the amount available under the credit facility for borrowing and an additional$19,943,000 to support outstanding letters of credit (primarily for industrial revenue bonds). At the time of enter-ing into the credit facility, Astec Industries, Inc. was able to borrow up to $105,000,000 while Astec FinancialServices, Inc., the Company’s captive finance company, was able to borrow up to $50,000,000, with the totalborrowing by both companies limited to $125,000,000. Advances to Astec Financial Services, Inc. under thisline of credit are limited to “Eligible Receivables” of Astec Financial Services, Inc. as defined in the credit agree-ment that governs the credit facility. Borrowings under the credit facility bear interest at the Company’s option,at a rate from prime to prime plus 0.875%, or from the London Interbank Offering Rate (“LIBOR”) plus 1.0% to1.875%, depending on the leverage ratio as defined by the agreement, applied to a sliding scale. At December31, 2001, Astec Financial Services, Inc. borrowings represented $17,929,000 of the total $28,013,000 out-standing under the credit facility.
Principal covenants under the loan agreement include (i) the maintenance of minimum levels of net worth,leverage and fixed charge coverage ratios, (ii) a limitation on capital expenditures and rental expense, (iii) aprohibition against the payment of dividends and (iv) a prohibition on large acquisitions except upon the con-sent of the lenders.There is a provision in the loan agreement allowing the borrowing of $10,000,000 from anysource for needs beyond the revolver provisions.
As of December 31, 2001, the Company was not in compliance with two financial ratio covenants contained inits credit facility.These covenant violations were waived by a required majority of the members of theCompany’s banking syndicate effective December 31, 2001. On March 12, 2002 an amendment was executedto the credit facility.The amendment (1) decreased the maximum amount available under the credit facility to$100,000,000, (2) relaxed certain financial ratio covenants for 2002, (3) provided for an interest rate surchargeof 0.375% if the Company does not meet the original financial ratios required by such covenants and (4) pro-vided for additional security for the banks in certain situations.
The Company currently anticipates that it will satisfy the revised financial ratio covenants of the credit facility forthe next four calendar quarters. No assurances can be provided that financial ratio covenant violations of thecredit facility will not occur in the future or, if such violations occur, that the members of the Company’s bankingsyndicate will not elect to pursue their contractual remedies under the credit facility, including requiring theimmediate repayment in full of all amounts outstanding.There can also be no assurance that the Companycan secure adequate or timely replacement financing to repay its banking syndicate in the event of an unantici-pated repayment demand.
38
In addition to the bank revolving credit facility, the Company’s South African subsidiary, Osborn EngineeredProducts SA (Pty) Ltd., has a credit facility available of $1,250,000 to finance short-term working capital needsand an additional $1,250,000 available to cover the short-term establishment of letter of credit performanceguarantees.
Capital expenditures in 2002 for plant expansion and for further modernization of the Company’s manufactur-ing processes are expected to be approximately $6,600,000.The Company expects to finance these expendi-tures using the available capacity under the Company’s revolving credit facility and internally generated funds.Capital expenditures (excluding those for equipment leased to others) for 2001 were $8,057,000 compared to$21,536,000 in 2000.
Subject to the matters discussed above regarding the Company’s ability to comply with the covenants in itsNote Purchase Agreement and credit facility or to obtain additional waivers related thereto, the Companybelieves that its current working capital, cash flows generated from future operations and available capacityremaining under its credit facility will be sufficient to meet the Company’s working capital and capital expendi-ture requirements through December 31, 2002.
For additional information on current and long-term debt, see Note 6 to the Consolidated Financial Statements.
Market Risk and Risk Management Policies
The Company is exposed to changes in interest rates, primarily from its revolving credit agreements and indus-trial revenue bonds. Under its current policies, the Company uses interest rate derivative instruments to man-age exposure to interest rate changes for a portion of its debt arrangements.Taking into account the effects ofinterest rate derivatives designated as hedges, a hypothetical 100 basis point adverse move (increase) in inter-est rates would have adversely affected interest expense by approximately $422,000 for the year endedDecember 31, 2001.The Company’s earnings and cash flows are also subject to fluctuations due to changesin foreign currency exchange rates; however, these fluctuations would not be significant to the Company’s con-solidated operations.
Contingencies
Management has reviewed all claims and lawsuits and, upon the advice of counsel, has made adequate provi-sion for any estimable losses. However, the Company is unable to predict the ultimate outcome of the out-standing claims and lawsuits.
Certain customers have financed purchases of the Company’s products through arrangements in which theCompany is contingently liable for customer debt aggregating $12,137,000 and $18,816,000 at December 31,2001 and 2000, respectively.These obligations average five years in duration and have minimal risk. AstecFinancial Services, Inc. sold both finance and operating leases with limited recourse, generally not exceeding15% of the purchase price, subject to elimination of recourse responsibilities through remarketing of equip-ment.
Other - The Company is contingently liable under letters of credit of approximately $19,943,000 primarily relat-ed to Industrial Revenue Bonds.
Environmental Matters
Based on information available, management believes the Company has adequately reserved for potentialenvironmental liabilities and does not believe the potential liability will materially impact the future financial posi-tion of the Company.
MANAGEMENT’S DISCUSSION AND ANALYSIS (CONTINUED)
39
MANAGEMENT’S DISCUSSION AND ANALYSIS (CONTINUED)
Critical Accounting Policies
The Company’s consolidated financial statements are prepared in accordance with accounting principles gen-erally accepted in the United States. Application of these principles requires the Company to make estimatesand judgments that affect the amounts as reported in the consolidated financial statements. Accounting poli-cies that are critical to aid in understanding and evaluating the results of operations and financial position of theCompany include the following:
Inventory Valuation: Inventories are valued at the lower of cost or market.The most significant component ofthe Company’s inventories is steel. Open market prices, which are subject to volatility, determine the cost ofsteel for the Company. During periods when open market prices decline, the Company may need to provide anallowance to reduce the carrying value of the inventory. In addition, certain items in inventory may be consid-ered obsolete, and as such, the Company may establish an allowance to reduce the carrying value of theseitems to their net realizable value.The amounts in these inventory allowances are determined by the Companybased on certain estimates, assumptions and judgments made from the information available at that time.
Allowance for Doubtful Accounts: The Company evaluates the collectibility of accounts receivable based on acombination of factors. In circumstances where the Company is aware of a specific customer’s inability to meetits financial obligations, a specific reserve for bad debts is recorded against amounts due to reduce the net rec-ognized receivable to the amount reasonably expected to be collected. Additionally, a general percentage ofpast due receivables is reserved, based on the Company’s past experience of collectibility. If circumstanceschange (i.e., higher than expected defaults or an unexpected material adverse change in a major customer’sability to meet its financial obligations), estimates of the recoverabiltiy of amounts due could be reduced by amaterial amount.
Litigation Contingencies: As a normal course of business in the industry, the Company is named as a defen-dant in a number of legal proceedings associated with product liability matters.The Company does not believethey are a party to any legal proceedings that will have a material adverse effect on the consolidated financialposition. It is possible, however, that future results of operations for any particular quarterly or annual periodcould be materially affected by changes in assumptions related to these proceedings.
As discussed in Note 9 of the consolidated financial statements, as of December 31, 2001, the Company hasaccrued its best estimate of the probable cost for the resolution of these claims.This estimate has been devel-oped in consultation with outside counsel that is handling the defense in these matters and is based upon acombination of litigation and settlement strategies. Certain litigation is being addressed before juries in stateswhere past jury awards have been significant.To the extent additional information arises or strategies change,it is possible that the Company’s best estimate of the probable liability in these matters may change.
Recently Issued Accounting Standards: In June 2001, the Financial Accounting Standards Board (FASB)issued Statement of Financial Accounting Standards No. 141, Business Combinations, and No. 142, Goodwilland Other Intangible Assets, effective for fiscal years beginning after December 15, 2001. Under the new rules,goodwill and intangible assets deemed to have indefinite lives will no longer be amortized but will be subject toannual impariment tests in accordance with SFAS No. 142. Other intangible assets will continue to be amor-tized over their useful lives.
The Company will apply the new rules on accounting for goodwill and other intangible assets beginning in thefirst quarter of 2002. Application of the non-amortization provisions of the Statement in 2002 is expected toincrease pre-tax income $2,154,000, or $.11 per share. During 2002, the Company will perform the first of therequired impairment tests of goodwill and indefinite lived intangible assets as of the beginning of its fiscal year.The Company has not yet determined what the effect of these tests will be on the income and financial posi-tion of the Company.

40
Assets 2001 2000
Current assets:Cash and cash equivalents Note 1 $ 6,670,178 $ 7,053,328Trade receivables less allowance for doubtful accounts of $1,806,000 in 2001 and $2,105,000 in 2000 53,057,092 55,500,511
Finance receivables Note 13 13,792,674 23,454,534Notes and other receivables 1,648,888 1,921,976Inventories Notes 1, 3 128,995,577 126,307,828Prepaid expenses 4,266,036 3,595,524Refundable income taxes 7,640,150 3,893,629Deferred tax asset Note 8 8,929,188 7,760,098Other current assets 260,809 159,059
Total current assets 225,260,592 229,646,487Property and equipment, net Note 4 123,394,035 126,927,532
Other assets:Goodwill 36,114,983 37,207,924Finance receivables Note 13 14,550,590 3,500,180Notes receivable 16,527 362,138Other 1,354,259 1,151,006
Total other assets 52,036,359 42,221,248
Total assets $400,690,986 $398,795,267
Liabilities and Shareholders’ Equity
Current liabilities:Current maturities of long-term debt Note 6 $ 2,368,496 $ 1,986,424Accounts payable 26,245,927 35,585,181Customer deposits 8,343,714 6,463,715Accrued product warranty 3,277,268 4,441,845Accrued payroll and related liabilities 3,389,987 14,019,935Other accrued liabilities 19,768,419 13,760,679Total current liabilities 63,393,811 76,257,779
Long-term debt, less current maturities Note 6 127,284,692 118,510,887Deferred tax liability Note 8 9,038,640 6,770,124Deferred retirement costs Note 7 1,916,424 1,648,226Other 1,361,160 537,123
Total liabilities 202,994,727 203,724,139Minority interest 349,611 448,188
Shareholders’ equity: Notes 1, 10Preferred stock - authorized 4,000,000 shares of $1.00 par value; none issued
Common stock - authorized 40,000,000 shares of $.20 par value; issued and outstanding -19,603,179 in 2001 and 19,319,746 in 2000 3,920,635 3,863,949
Additional paid-in capital 51,681,027 48,440,594Accumulated other comprehensive income (2,776,131) (210,298)Retained earnings 144,521,117 142,528,695
Total shareholders’ equity 197,346,648 194,622,940
Total liabilities and shareholders’ equity $400,690,986 $398,795,267
See Notes to Consolidated Financial Statements.
CONSOLIDATED BALANCE SHEETS
December 31,

41
CONSOLIDATED STATEMENTS OF INCOME
Year Ended December 31,
2001 2000 1999
Net sales $ 455,839,164 $ 520,687,851 $ 449,627,457Cost of sales 364,915,606 397,813,019 335,471,243Gross profit 90,923,558 122,874,832 114,156,214Selling, general and administrative expenses 71,690,984 69,011,339 56,279,937Research and development expenses 7,448,332 6,725,884 5,355,736Income from operations 11,784,242 47,137,609 52,520,541Other income (expense):
Interest expense (9,367,054) (8,652,339) (4,253,219)Interest income 1,585,039 2,239,786 1,136,777Amortization of goodwill and
other intangible assets (2,202,677) (2,032,724) (1,032,161)Other income (expense) - net 2,039,420 4,234,303 3,153,389
Equity in (loss) income of joint venture (241,922) (195,781) 6,096Income before income taxes 3,597,048 42,730,854 51,531,423Income taxes Note 8 1,480,748 16,441,440 19,819,145Income before minority interest 2,116,300 26,289,414 31,712,278Minority interest 123,878 8,328Net income $ 1,992,422 $ 26,281,086 $ 31,712,278
Earnings per Common Share Note 1
Net income:Basic $ 0.10 $ 1.37 $ 1.66Diluted 0.10 1.33 1.59
Weighted average number of common shares outstanding:
Basic 19,441,818 19,221,754 19,064,516Diluted 19,753,226 19,721,288 19,930,376
See Notes to Consolidated Financial Statements.
42
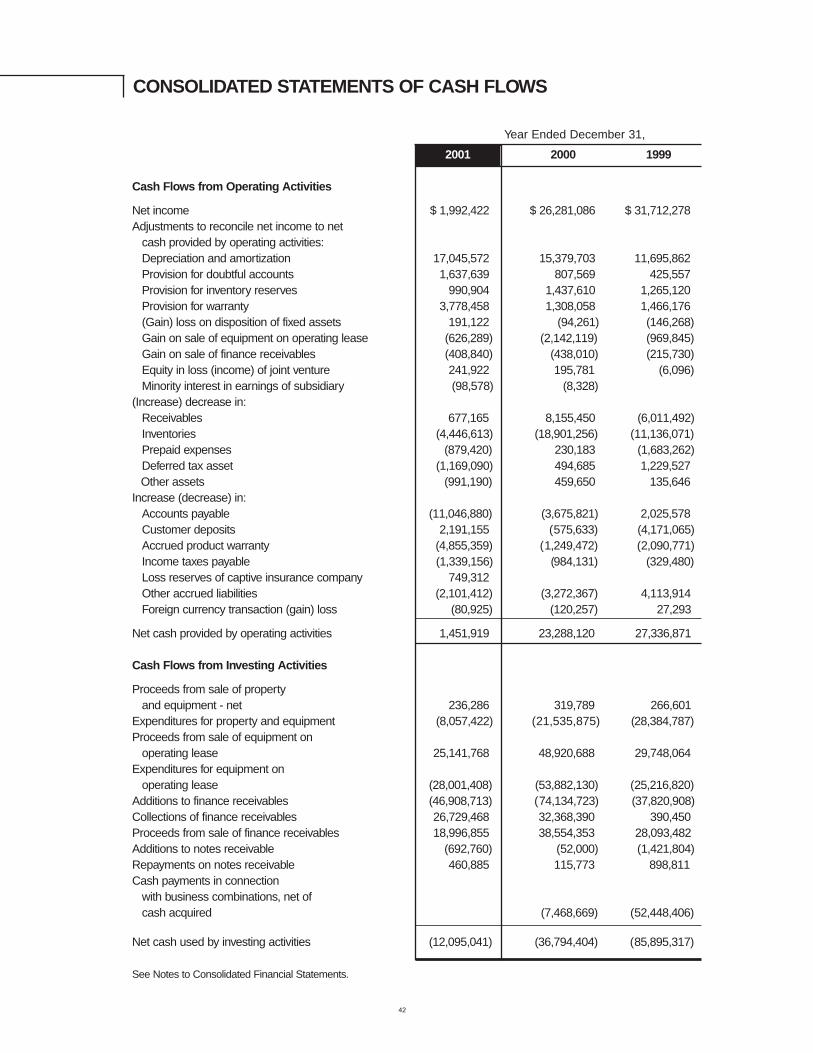
CONSOLIDATED STATEMENTS OF CASH FLOWS
Year Ended December 31,
2001 2000 1999
Cash Flows from Operating Activities
Net income $ 1,992,422 $ 26,281,086 $ 31,712,278Adjustments to reconcile net income to net
cash provided by operating activities:Depreciation and amortization 17,045,572 15,379,703 11,695,862Provision for doubtful accounts 1,637,639 807,569 425,557Provision for inventory reserves 990,904 1,437,610 1,265,120Provision for warranty 3,778,458 1,308,058 1,466,176(Gain) loss on disposition of fixed assets 191,122 (94,261) (146,268)Gain on sale of equipment on operating lease (626,289) (2,142,119) (969,845)Gain on sale of finance receivables (408,840) (438,010) (215,730)Equity in loss (income) of joint venture 241,922 195,781 (6,096)Minority interest in earnings of subsidiary (98,578) (8,328)
(Increase) decrease in:Receivables 677,165 8,155,450 (6,011,492)Inventories (4,446,613) (18,901,256) (11,136,071)Prepaid expenses (879,420) 230,183 (1,683,262)Deferred tax asset (1,169,090) 494,685 1,229,527Other assets (991,190) 459,650 135,646
Increase (decrease) in:Accounts payable (11,046,880) (3,675,821) 2,025,578Customer deposits 2,191,155 (575,633) (4,171,065)Accrued product warranty (4,855,359) (1,249,472) (2,090,771)Income taxes payable (1,339,156) (984,131) (329,480)Loss reserves of captive insurance company 749,312Other accrued liabilities (2,101,412) (3,272,367) 4,113,914Foreign currency transaction (gain) loss (80,925) (120,257) 27,293
Net cash provided by operating activities 1,451,919 23,288,120 27,336,871
Cash Flows from Investing Activities
Proceeds from sale of propertyand equipment - net 236,286 319,789 266,601
Expenditures for property and equipment (8,057,422) (21,535,875) (28,384,787)Proceeds from sale of equipment on
operating lease 25,141,768 48,920,688 29,748,064Expenditures for equipment on
operating lease (28,001,408) (53,882,130) (25,216,820)Additions to finance receivables (46,908,713) (74,134,723) (37,820,908)Collections of finance receivables 26,729,468 32,368,390 390,450Proceeds from sale of finance receivables 18,996,855 38,554,353 28,093,482Additions to notes receivable (692,760) (52,000) (1,421,804)Repayments on notes receivable 460,885 115,773 898,811Cash payments in connection
with business combinations, net ofcash acquired (7,468,669) (52,448,406)
Net cash used by investing activities (12,095,041) (36,794,404) (85,895,317)
See Notes to Consolidated Financial Statements.

43
CONSOLIDATED STATEMENTS OF CASH FLOWS
Year Ended December 31,
2001 2000 1999
Cash Flows from Financing Activities
Proceeds from issuance of common stock $ 748,153 $ 1,005,502 $ 1,364,275Net borrowings (repayments) under revolving credit loan (70,353,821) 16,285,337 55,788,775
Principal repayments of industrialbonds, loans and notes payable (4,520,082) (2,932,513) (503,057)
Proceeds from debt and notes payable 84,632,406 2,833,145 41,189
Net cash provided by financing activities 10,506,656 17,191,471 56,691,182Effect of exchange rates on cash (246,684) (356,929) 239,595
Increase (decrease) in cash and cash equivalents (383,150) 3,328,258 (1,627,669)Cash and cash equivalents, beginning of period 7,053,328 3,725,070 5,352,739
Cash and cash equivalents, end of period $ 6,670,178 $ 7,053,328 $ 3,725,070
Supplemental Cash Flow Information
Cash paid during the year for:
Interest $ 7,823,874 $ 8,499,094 $ 4,425,526
Income taxes $ 4,882,833 $ 17,934,641 $ 20,472,411
Tax benefits related to stock options:Refundable income taxes $ 1,051,615 $ 555,962 $ 856,000Additional paid-in capital (1,051,615) (555,962) (856,000)
Non-cash business combination:Investment in subsidiary $ 144,600 $ 1,576,844 $ 1,556,523Accrued liability 1,352,751 (1,576,844) (1,556,523)Common stock (26,735)Additional paid-in capital (1,470,616)
See Notes to Consolidated Financial Statements.

44
BalanceDecember 31, 1998 18,967,232 $3,793,446 $44,332,177 $84,535,331 $132,660,954
Net income 31,712,278 31,712,278
Other comprehensive income:
Foreign currency translation adjustment $266,888 266,888
Comprehensive income 31,979,166
Exercise of stock options,including tax benefit 139,609 27,922 2,189,534 2,217,456
Stock issued in businesscombination 14,296 2,859 397,141 400,000
Balance December 31, 1999 19,121,137 3,824,227 46,918,852 116,247,609 266,888 167,257,576
Net income 26,281,086 26,281,086
Other comprehensive income:
Foreign currency translation adjustment (477,186) (477,186)
Comprehensive income 25,803,900
Exercise of stock options,including tax benefit 198,609 39,722 1,521,742 1,561,464
BalanceDecember 31, 2000 19,319,746 3,863,949 48,440,594 142,528,695 (210,298) 194,622,940
Net income 1,992,422 1,992,422
Other comprehensive income:
Foreign currency translation adjustments (2,126,103) (2,126,103)
Unrealized loss on cash flowhedge, net of tax (439,730) (439,730)
Comprehensive income (573,411)
Exercise of stock options,including tax benefit 149,758 29,951 1,769,817 1,799,768
Stock issued in businesscombination 133,675 26,735 1,470,616 1,497,351
BalanceDecember 31, 2001 19,603,179 $3,920,635 $51,681,027 $144,521,117 $(2,776,131) $197,346,648
See Notes to Consolidated Financial Statements.
CONSOLIDATED STATEMENTS OF SHAREHOLDERS’ EQUITYFor the Years Ended December 31, 2001, 2000 and 1999
Common StockShares Amount
AdditionalPaid-inCapital
RetainedEarnings
AccumulatedOther
ComprehensiveIncome
Total Shareholders’
Equity

45
NOTES TO CONSOLIDATED FINANCIAL STATEMENTSFor the Years Ended December 31, 2001, 2000 and 1999
1. Summary of Significant Accounting Policies
Basis of Presentation - The consolidated financial statements include the accounts of Astec Industries, Inc.and its subsidiaries.The Company’s wholly-owned or consolidated subsidiaries at December 31, 2001 are asfollows:
American Augers, Inc. Heatec, Inc.Astec, Inc. Johnson Crushers International, Inc.Astec Financial Services, Inc. Kolberg-Pioneer, Inc.Astec Insurance Company Osborn Engineered Products SA (Pty) Ltd. (88%)Astec Systems, Inc. Production Engineered Products, Inc.Breaker Technology, Inc. Roadtec, Inc.Breaker Technology Ltd. Superior Industries of Morris, Inc.Carlson Paving Products, Inc. Telsmith, Inc.CEI Enterprises, Inc. Trencor, Inc.
All significant intercompany transactions have been eliminated in consolidation.
The Company’s investment in a 50% owned joint venture, Pavement Technology, Inc., was accounted for on anequity basis. On December 31, 2001, the Company acquired the remaining 50% interest in PavementTechnology, Inc. and merged it into Astec, Inc.
Use of Estimates - The preparation of the financial statements in conformity with accounting principles gener-ally accepted in the United States requires management to make estimates and assumptions that affect theamounts reported in the financial statements and accompanying notes. Actual results could differ from thoseestimates.
Cash Equivalents - The Company considers all highly liquid instruments purchased with a maturity of lessthan three months to be cash equivalents.
Inventories - Inventories (excluding used equipment) are stated at the lower of first-in, first-out cost or market.Used equipment inventories are stated at the lower of specific unit cost or market.
Property and Equipment - Property and equipment is stated at cost. Depreciation is calculated for financialreporting purposes using the straight-line method based on the estimated useful lives of the assets as follows:buildings (40 years) and equipment (3 to 10 years). Both accelerated and straight-line methods are used for taxreporting purposes.
Goodwill - Goodwill represents the excess of cost over the fair value of net identifiable assets acquired.Goodwill amounts are being amortized using the straight-line method over 20 years. Accumulated goodwillamortization was approximately $7,258,000 and $5,104,000 at December 31, 2001 and 2000, respectively.
Impairment of Long-lived Assets - In the event that facts and circumstances indicate that the carryingamounts of long-lived assets may be impaired, an evaluation of recoverability would be performed. If an evalua-tion is required, the estimated future undiscounted cash flows associated with the asset would be compared tothe asset’s carrying amount to determine if a writedown is required. If this review indicates that the assets willnot be recoverable, the carrying value of the Company’s assets would be reduced to their estimated marketvalue.
Revenue Recognition - A portion of the Company’s equipment sales represents equipment produced in theCompany’s plants under short-term contracts for a specific customer project or equipment designed to meet acustomer’s specific requirements. Equipment revenues are recognized in compliance with the terms and condi-tions of each contract, which is ordinarily at the time the equipment is shipped. Certain contracts include termsand conditions through which the Company recognizes revenues upon completion of equipment production,which is subsequently stored at the Company’s plant at the customer’s request. Revenue is recorded on suchcontracts upon the customer’s assumption of title and all risks of ownership.The Company has a limited num-ber of sales accounted for as multiple-element arrangements; related revenue on each product is recognizedwhen it is shipped, and the related service revenue is recognized when the service is performed.

46
Advertising Expense - The cost of advertising is expensed as incurred.The Company incurred approximately$4,447,000, $3,478,000 and $3,964,000 in advertising costs during 2001, 2000 and 1999, respectively.
Stock-based Compensation - The Company grants stock options for a fixed number of shares to employeeswith an exercise price equal to the fair value of the shares at the date of grant.The Company accounts foremployee stock options in accordance with APB Opinion No. 25, Accounting for Stock Issued to Employees,and, accordingly, recognizes no compensation expense for the stock option grants.The Company adoptedSFAS No. 123, Accounting for Stock-based Compensation, in 1996 and is utilizing the disclosure only optionpermitted by the statement for employee stock options. See Note 10.
Earnings Per Share - Basic and diluted earnings per share are calculated in accordance with SFAS No. 128,Earnings per Share. Basic earnings per share is based on the weighted average number of common sharesoutstanding and diluted earnings per share includes potential dilutive effects of options, warrants and convert-ible securities.
The following table sets forth the computation of basic and diluted earnings per share:
Year Ended December 31,
Derivatives and Hedging Activities - In June 1998, the Financial Accounting Standards Board issued SFASNo. 133, Accounting for Derivative Instruments and Hedging Activities, which was amended by SFAS Nos. 137and 138. SFAS 133 requires the Company to recognize all derivatives in the balance sheet at fair value.Derivatives that are not hedged must be adjusted to fair value through income. If the derivative is a hedge,depending on the nature of the hedge, changes in the fair value of derivatives are either offset against thechange in fair value of assets, liabilities, or firm commitments through income or recognized in other compre-hensive income until the hedged item is recognized in income.The ineffective portion of a derivative’s changein fair value is immediately recognized in income.The Company adopted SFAS 133 effective January 1, 2001.The adoption of SFAS 133 had no material impact on the Company’s income or financial position.
Shipping and Handling Fees and Cost - The Company records revenues earned for shipping and handlingas net sales, while the cost of shipping and handling is classified as cost of goods sold. Revenues and expens-es were $10,482,000 and $12,119,000 for 2001, $11,857,000 and $12,719,000 for 2000 and $9,169,000 and$8,706,000 for 1999, respectively.
New Accounting Standards - In June 2001, the Financial Accounting Standards Board issued SFAS No.141, Business Combinations and No. 142, Goodwill and Other Intangible Assets. SFAS 141 requires that thepurchase method of accounting be used for all business combinations initiated after June 30, 2001. SFAS 141also includes guidance on the initial recognition and measurement of goodwill and other intangible assets aris-
NOTES TO CONSOLIDATED FINANCIAL STATEMENTS
2001 2000 1999
Numerator:Net income $ 1,992,422 $ 26,281,086 $ 31,712,278
Denominator:Denominator for basicearnings per share 19,441,818 19,221,754 19,064,516
Effect of dilutive securities:Employee stock options 311,408 499,534 865,860
Denominator for dilutedearnings per share 19,753,226 19,721,288 19,930,376
Earnings per common share:Basic $ 0.10 $ 1.37 $ 1.66Diluted $ 0.10 $ 1.33 $ 1.59

2. Business Combinations
The Company’s acquisitions have been accounted for using the purchase method of accounting, and according-ly, the operating results of the acquired businesses are included in the Company’s consolidated financial state-ments from the respective acquisition dates.The assets acquired and liabilities assumed were recorded at esti-mated fair value.That portion of the purchase price in excess of the fair market value of the net identifiableassets acquired is recorded as goodwill and is being amortized using the straight-line method over 20 years.
On August 13, 1999, the Company acquired substantially all of the assets of Teledyne Specialty Equipment’sConstruction and Mining business unit from Allegheny Teledyne, Inc. for approximately $18,900,000 in cash.The acquired business unit, having operations in both the United States and Canada, operates as BreakerTechnology, Inc. in the U.S. and as Breaker Technology Ltd. in Canada (“BTI”). On October 29, 1999, theCompany purchased the operating assets and liabilities of American Augers, Inc. for approximately$15,500,000 in cash and repayment of approximately $6,200,000 of debt. On November 1, 1999, theCompany acquired the operating assets and liabilities of Superior Industries of Morris, Inc. (“Superior”) for$17,000,000 in cash.
On October 2, 2000, the Company acquired the operating assets and liabilities of Carlson Paving ProductsCompany, Inc. (“Carlson”) for $4,170,000 in cash and 144,162 shares of the Company’s stock valued atapproximately $1,577,000. On September 30, 2000, the Company purchased substantially all of the assetsand liabilities of Osborn MMD, a Boart Longyear group operation, from Anglo Operations Limited for approxi-mately $3,200,000 in cash.The acquired business is located in South Africa and operates as OsbornEngineered Products SA (Pty) Ltd.
A summary of the net assets acquired is as follows:
AMERICAN BTI AUGERS SUPERIOR OSBORN CARLSON
Current assets $12,218,333 $10,826,332 $ 6,446,529 $7,634,984 $2,229,110Property, plant and equipment 1,847,523 2,950,450 9,256,214 1,843,815 715,884Other assets 573,505 109,038 48,809 19,005Current liabilities (6,159,326) (5,796,498) (1,865,435) (4,667,809) (640,400) Other liabilities (6,208,004) (1,189,218) (964,365)Goodwill 11,025,239 11,700,858 2,548,938 (1,194,292) 4,385,025Less: Minority interest (439,861)Net assets acquired excluding cash 18,931,769 14,046,643 15,306,066 3,225,646 5,744,259Cash 1,445,543 1,693,934 2,585Net assets acquired $18,931,769 $15,492,186 $17,000,000 $3,225,646 $5,746,844
47
NOTES TO CONSOLIDATED FINANCIAL STATEMENTS
ing from business combinations completed after that date. SFAS 142 prohibits the amortization of goodwill andintangible assets with indefinite lives. SFAS 142 requires that these assets be reviewed for impairment at leastannually. Intangible assets with finite lives will continue to be amortized over their estimated useful lives.
The Company will adopt SFAS 142 effective January 1, 2002. Application of the non-amortization provision ofSFAS 142 is expected to result in an increase in net income of $2,154,000, or $.11 per share in 2002.TheCompany will test goodwill for impairment using the two-step process prescribed in SFAS 142.The first step isa screen for potential impairment, while the second step measures impairment, if any.The Company expectsto complete the first of the required impairment tests of goodwill as of January 1, 2002 in the first quarter of2002.The Company has not yet determined what the effect of these tests will be on the income and financialposition of the Company. Any impairment charge from the transitional tests would be recorded as the cumula-tive effect of a change in accounting principle in the first quarter of 2002.
Reclassifications - Certain amounts for 2000 and 1999 have been reclassified to conform with the 2001 presentation.

48
NOTES TO CONSOLIDATED FINANCIAL STATEMENTS
The following unaudited pro forma summary presents the consolidated results of operations as if the acquisi-tions had occurred at the beginning of the year.The unaudited pro forma results have been prepared for com-parative purposes only and include certain adjustments, such as goodwill amortization expense and interestexpense on acquisition debt.They do not purport to be indicative of the results that would have occurred hadthe acquisitions taken place at the beginning of the periods presented or of results which may occur in thefuture.
December 31,
2000Net sales $ 549,524,000Income from operations 54,138,000Net income 26,655,000Per common share outstanding:
Basic $ 1.39Diluted $ 1.35
On December 31, 2001, the Company acquired the remaining 50% interest in its joint venture investment,Pavement Technology, Inc., for 10,000 shares of the Company’s stock valued at approximately $143,000.
3. Inventories
Inventories consisted of the following: December 31,
2001 2000Raw materials and parts $ 42,745,772 $ 41,783,985Work-in-process 27,270,361 27,520,881Finished goods 37,645,041 39,574,507Used equipment 21,334,403 17,428,455Total $128,995,577 $126,307,828
4. Property and Equipment
Property and equipment consisted of the following: December 31,
2001 2000Land, land improvements and buildings $ 74,499,184 $ 72,799,811Equipment 106,544,080 101,544,216Less accumulated depreciation (67,562,056) (55,543,607)Land, buildings and equipment - net 113,481,208 118,800,420Rental property:Equipment 12,163,290 9,036,202Less accumulated depreciation (2,250,463) (909,090)Rental property - net 9,912,827 8,127,112Total $123,394,035 $ 126,927,532
Depreciation expense was approximately $14,807,000, $13,347,000 and $10,664,000 for the years endedDecember 31, 2001, 2000 and 1999, respectively.
5. Leases
The Company leases certain land, buildings and equipment that are used in its operations.Total rental expensecharged to operations under operating leases was approximately $4,072,000, $4,054,000 and $3,329,000 forthe years ended December 31, 2001, 2000 and 1999, respectively.
Minimum rental commitments for all noncancelable operating leases at December 31, 2001 are as follows:
2002 $ 3,046,2682003 2,242,3582004 1,654,6182005 218,5222006 39,770Thereafter -

6. Long-term Debt
Long-term debt consisted of the following: December 31,
2001 2000Revolving credit loan of $125,000,000 at December 31, 2001,
at interest rates from 4.38% to 5.63% at December 31, 2001 $ 28,012,794$80,000,000 Senior Secured Notes due September 10, 2011,
at 7.56%, payable in annual installments of $11,428,571beginning September 10, 2005 80,000,000
Revolving credit loan of $150,000,000 at December 31, 2000,originally expiring November 22, 2002, at interest ratesfrom 7.50% to 9.50% at December 31, 2000 $ 98,700,000
Industrial Development Revenue Bonds payable in annual installments of $500,000 through 2006 at weekly negotiated interest rates 2,500,000 3,000,000
Industrial Development Revenue Bonds due in 2019 at weeklynegotiated interest rates 8,000,000 8,000,000
Industrial Development Revenue Bonds due in 2028 at weeklynegotiated interest rates 9,200,000 9,200,000
Other current notes payable 1,940,394 1,597,311Total long-term debt 129,653,188 120,497,311Less current maturities 2,368,496 1,986,424Long-term debt less current maturities $127,284,692 $118,510,887
The Company has an unsecured $125,000,000 revolving line of credit.The agreement contains borrowingsub-limits which allow the Company and its subsidiary, Astec Financial Services, Inc., to borrow up to$105,000,000 and $50,000,000 respectively, not to exceed the total commitment amount. Advances underAstec Financial’s sub-limit are limited to eligible receivables as defined in the agreement. Amounts outstandingunder the agreement bear interest, at the Company’s option, at a rate from prime to prime plus .875%, or from1.0% to 1.875% above the London Interbank Offering Rate.The interest rate applied to borrowings is based ona leverage ratio, calculated quarterly, as defined by the credit agreement. Both the credit agreement and thesenior secured note agreement contain certain restrictive covenants relative to operating ratios and capitalexpenditures and also restrict the payment of dividends. At December 31, 2001, the Company was not incompliance with two covenants of the revolving credit facility and the senior secured note agreement.TheCompany obtained waivers of its noncompliance with the covenants of these agreements at December 31, 2001.The agreements were amended on March 12, 2002 to modify certain covenant requirements for periods afterDecember 31, 2001.The aggregate commitment under the line of credit was reduced on March 12, 2002 to$100,000,000 expiring September 10, 2004.
The aggregate of all maturities of long-term debt in each of the next five years is as follows:
2001 $ 2,368,496 2004 $ 28,523,4292002 539,124 2005 11,224,9212003 511,504 Thereafter 86,485,714
For 2001, the weighted average interest rate on short-term borrowings, which includes current maturities ofIndustrial Revenue Bonds, was 3.52%.
49
NOTES TO CONSOLIDATED FINANCIAL STATEMENTS
The Company also leases equipment to customers under contracts generally ranging from 36 to 48 months.Rental income under such leases was $2,846,000, $3,908,000 and $2,467,000 for the years endedDecember 31, 2001, 2000 and 1999, respectively.
Minimum rental payments to be received for equipment leased to others at December 31, 2000 are as follows:
2002 $ 1,726,235 2005 $ 1,760,8132003 1,257,956 2006 2,179,6952004 1,464,789 Thereafter 4,332,649

50
Net periodic benefit cost for 2001, 2000 and 1999 included the following components:
Pension Benefits Other Benefits2001 2000 1999 2001 2000 1999
Components of net periodic benefit costService cost $ 393,391 $ 351,320 $ 329,864 $ 117,596 $ 86,027 $ 80,326Interest cost 528,474 504,384 449,209 122,610 103,596 82,311Expected return on plan assets (558,237) (614,194) (592,008)Amortization of transition obligation 30,555 33,700 33,700Recognized net actuarial (gain) loss (12,164) (11,180)Net periodic benefit cost $ 363,628 $ 241,510 $ 187,065 $ 270,761 $211,159 $185,157
NOTES TO CONSOLIDATED FINANCIAL STATEMENTS
The weighted average annual assumed rate of increase in per capita health care costs is 11.0% for 2002 andis assumed to decrease gradually to 5.0% for 2009 and remain at that level thereafter. A 1.0% increase ordecrease in the medical inflation rate would not have a significant effect on either the benefit obligation or theaggregate service and interest cost components of net periodic benefit cost.
7. Retirement Benefits
The Company sponsors a defined benefit pension plan that covers all employees of its Kolberg-Pioneer sub-sidiary. Benefits paid under this plan are based on years of service multiplied by a monthly amount. In addition,the Company also sponsors two post-retirement medical and life insurance plans covering the employees of itsKolberg-Pioneer and Telsmith subsidiaries and retirees of its former Barber-Greene subsidiary.The Company’sfunding policy for all plans is to make the minimum annual contributions required by applicable regulations.
The following provides information regarding benefit obligations, plan assets and the funded status of the plans:
Pension Benefits Other Benefits
2001 2000 2001 2000Change in benefit obligationBenefit obligation at beginning of year $ 7,209,303 $ 6,307,948 $ 1,655,500 $ 1,390,967Service cost 393,391 351,320 117,596 86,027Interest cost 528,474 504,384 122,610 103,596Actuarial (gain) loss 358,657 368,022 105,865 211,149Participant contributions 367,665Benefits paid (313,656) (322,371) (85,147) (503,904)Benefit obligation at end of year 8,176,169 7,209,303 1,916,424 1,655,500
Change in plan assetsFair value of plan assets at beginning of year 6,372,805 6,992,158Actual return on plan assets (721,213) (296,982)Benefits paid (313,656) (322,371)Fair value of plan assets at end of year 5,337,936 6,372,805Funded status (underfunded) (2,838,233) (836,498) (1,916,424) (1,655,500)Unrecognized net actuarial (gain) loss 2,021,156 383,049 536,033 460,723(Accrued) benefit cost $ (817,077) $ (453,449) $(1,380,391) $(1,194,777)
Weighted-average assumptions as of December 31Discount rate 7.25% 7.75% 7.25% 7.75%Expected return on plan assets 9.00% 9.00%Rate of compensation increase 4.00% 4.00%

8. Income Taxes
For financial reporting purposes, income before income taxes includes the following components:Year Ended December 31,
2001 2000 1999United States $ 1,933,324 $ 41,692,857 $ 51,836,482Foreign 1,663,724 1,037,997 (305,059)Income before income taxes $ 3,597,048 $ 42,730,854 $ 51,531,423
The provision for income taxes consisted of the following:Year Ended December 31,
2001 2000 1999Current $ 381,396 $ 15,803,033 $ 19,188,853Deferred provision 1,099,352 638,407 630,292Total provision for income taxes $ 1,480,748 $ 16,441,440 $ 19,819,145
A reconciliation of the provision for income taxes at the statutory federal rate to the amount provided is as follows:
Year Ended December 31,2001 2000 1999
Tax at statutory rates $ 1,258,967 $ 14,934,626 $ 18,035,999Benefit from foreign sales corporation (474,315) (516,982) (241,012)State taxes, net of federal income tax benefit 1,586 1,389,290 1,578,250Income taxes of other countries (15,047) 66,030 (4,000)Permanent differences 859,329 844,758 563,021Other items (149,772) (276,282) (113,113)Income taxes $ 1,480,748 $ 16,441,440 $ 19,819,145
51
NOTES TO CONSOLIDATED FINANCIAL STATEMENTS
Deferred income taxes reflect the net tax effects of temporary differences between the carrying amounts ofassets and liabilities for financial statement purposes and the amounts used for income tax purposes.
Significant components of the Company’s deferred tax liabilities and assets are as follows:Year Ended December 31,
2001 2000Deferred tax assets:
Inventory reserves $ 2,762,332 $ 2,581,700Warranty reserves 979,683 1,381,700Bad debt reserves 911,759 774,300Other accrued expenses 5,577,996 4,250,000
Total deferred tax assets 10,231,770 8,987,700Deferred tax liabilities:
Property and equipment 9,823,277 7,933,400Other 517,945 64,400
Total deferred tax liabilities 10,341,222 7,997,800Net deferred tax asset (liability) $ (109,452) $ 989,900

52
NOTES TO CONSOLIDATED FINANCIAL STATEMENTS
9. Contingencies
Management has reviewed all claims and lawsuits and, upon the advice of counsel, has made adequate provi-sion for any estimable losses. However, the Company is unable to predict the ultimate outcome of the out-standing claims and lawsuits.
Certain customers have financed purchases of the Company’s products through arrangements in which theCompany is contingently liable for customer debt aggregating $12,137,000 and $18,816,000 at December 31, 2001and 2000, respectively.These obligations average five years in duration and have minimal risk. Astec FinancialServices, Inc. sold both finance and operating leases with limited recourse, generally not exceeding 15% of thepurchase price, subject to elimination of recourse responsibilities through remarketing of equipment.
Other - The Company is contingently liable under letters of credit of approximately $19,943,000 primarily relat-ed to Industrial Revenue Bonds.
10. Shareholders’ Equity
The Company has elected to follow Accounting Principles Board Opinion No. 25, Accounting for Stock Issuedto Employees (APB 25) and related interpretations in accounting for its employee stock options because, asdiscussed below, the alternative fair value accounting provided for under SFAS No. 123, Accounting for Stock-based Compensation, requires use of option valuation models that were not developed for use in valuingemployee stock options. Under APB 25, when the exercise price of the Company’s employee stock optionsequals or exceeds the market price of the underlying stock on the date of grant, no compensation expense isgenerally recognized.
Under terms of the Company’s stock option plans, officers and certain other employees may be grantedoptions to purchase the Company’s common stock at no less than 100% of the market price on the date theoption is granted.The Company has reserved shares of common stock for exercise of outstanding non-quali-fied options and incentive options of officers and employees of the Company and its subsidiaries at pricesdetermined by the Board of Directors. In addition, a Non-employee Directors Stock Incentive Plan has beenestablished to allow non-employee directors to have a personal financial stake in the Company through anownership interest. Directors may elect to receive their compensation in common stock, deferred stock or stockoptions. Options granted under the Non-employee Directors Stock Incentive Plan and the Executive OfficerAnnual Bonus Equity Election Plan vest and become fully exercisable immediately. All other options outstand-ing vest over 12 months. All stock options have a ten-year term.The shares reserved under the various stockoption plans are as follows: (1) 1992 Stock Option Plan - 300,948, (2) 1998 Long-term Incentive Plan -2,296,600, (3) Executive Officer Annual Bonus Equity Election Plan - 16,892 and (4) 1998 Non-employeeDirectors Stock Plan - 7,729.
Pro forma information regarding net income and earnings per share is required by SFAS No. 123, and hasbeen determined as if the Company had accounted for its employee stock options under the fair value methodof that Statement.The fair value for these options was estimated at the date of grant using a Black-Scholesoption pricing model with the following weighted-average assumptions for 1999, 2000, and 2001, respectively;risk-free interest rates of 5.58%, 5.25% and 3.93%, volatility factors of the expected market price of theCompany’s common stock of .381, .444 and .460; and a weighted-average expected life of the option of fouryears.
The Black-Scholes option valuation model was developed for use in estimating the fair value of traded optionswhich have no vesting restrictions and are fully transferable. In addition, option valuation models require theinput of highly subjective assumptions, including the expected stock price volatility. Because the Company’semployee stock options have characteristics significantly different from those of traded options, and becausechanges in the subjective input assumptions can materially affect the fair value estimate, in management’sopinion, the existing models do not necessarily provide a reliable single measure of the fair value of its employ-ee stock options.
For purposes of pro forma disclosures, the estimated fair value of the options is amortized to expense over theoptions’ vesting period.The Company’s pro forma information follows.
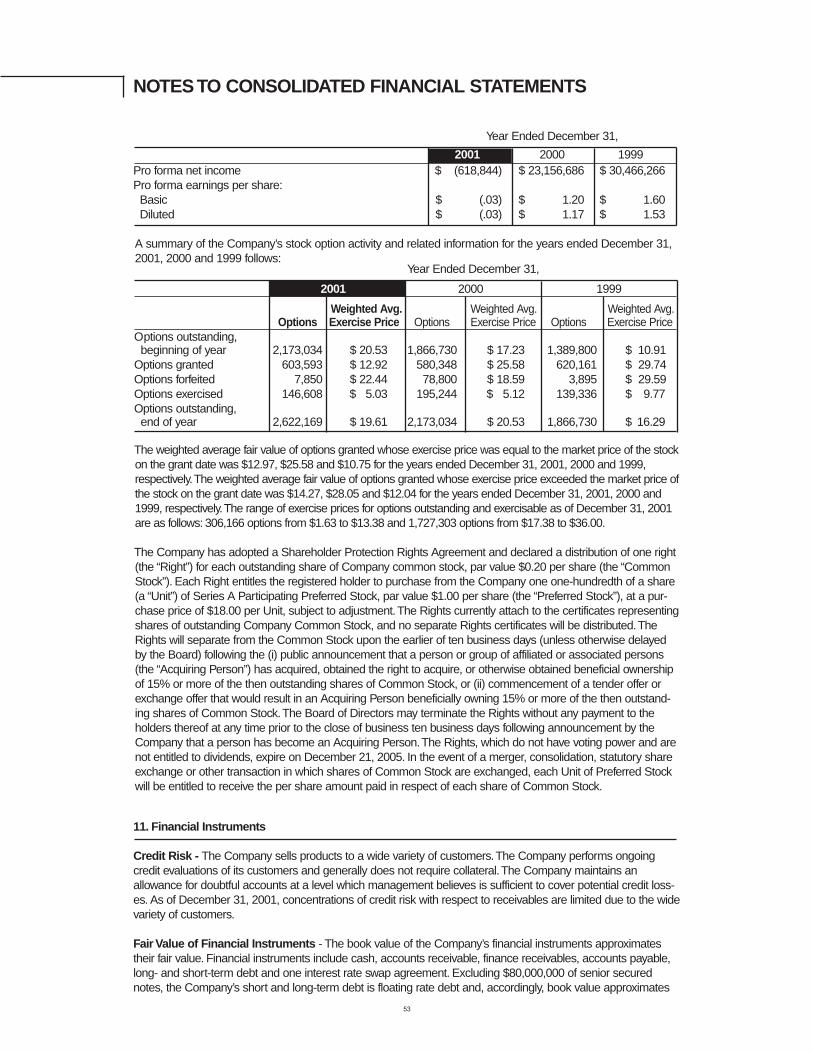
53
NOTES TO CONSOLIDATED FINANCIAL STATEMENTS
Year Ended December 31,
2001 2000 1999Pro forma net income $ (618,844) $ 23,156,686 $ 30,466,266Pro forma earnings per share:Basic $ (.03) $ 1.20 $ 1.60Diluted $ (.03) $ 1.17 $ 1.53
A summary of the Company’s stock option activity and related information for the years ended December 31,2001, 2000 and 1999 follows:
Year Ended December 31,
2001 2000 1999
Weighted Avg. Weighted Avg. Weighted Avg.Options Exercise Price Options Exercise Price Options Exercise Price
Options outstanding, beginning of year 2,173,034 $ 20.53 1,866,730 $ 17.23 1,389,800 $ 10.91
Options granted 603,593 $ 12.92 580,348 $ 25.58 620,161 $ 29.74Options forfeited 7,850 $ 22.44 78,800 $ 18.59 3,895 $ 29.59Options exercised 146,608 $ 5.03 195,244 $ 5.12 139,336 $ 9.77Options outstanding, end of year 2,622,169 $ 19.61 2,173,034 $ 20.53 1,866,730 $ 16.29
The weighted average fair value of options granted whose exercise price was equal to the market price of the stockon the grant date was $12.97, $25.58 and $10.75 for the years ended December 31, 2001, 2000 and 1999,respectively.The weighted average fair value of options granted whose exercise price exceeded the market price ofthe stock on the grant date was $14.27, $28.05 and $12.04 for the years ended December 31, 2001, 2000 and1999, respectively.The range of exercise prices for options outstanding and exercisable as of December 31, 2001are as follows: 306,166 options from $1.63 to $13.38 and 1,727,303 options from $17.38 to $36.00.
The Company has adopted a Shareholder Protection Rights Agreement and declared a distribution of one right(the “Right”) for each outstanding share of Company common stock, par value $0.20 per share (the “CommonStock”). Each Right entitles the registered holder to purchase from the Company one one-hundredth of a share(a “Unit”) of Series A Participating Preferred Stock, par value $1.00 per share (the “Preferred Stock”), at a pur-chase price of $18.00 per Unit, subject to adjustment.The Rights currently attach to the certificates representingshares of outstanding Company Common Stock, and no separate Rights certificates will be distributed.TheRights will separate from the Common Stock upon the earlier of ten business days (unless otherwise delayedby the Board) following the (i) public announcement that a person or group of affiliated or associated persons(the “Acquiring Person”) has acquired, obtained the right to acquire, or otherwise obtained beneficial ownershipof 15% or more of the then outstanding shares of Common Stock, or (ii) commencement of a tender offer orexchange offer that would result in an Acquiring Person beneficially owning 15% or more of the then outstand-ing shares of Common Stock.The Board of Directors may terminate the Rights without any payment to theholders thereof at any time prior to the close of business ten business days following announcement by theCompany that a person has become an Acquiring Person.The Rights, which do not have voting power and arenot entitled to dividends, expire on December 21, 2005. In the event of a merger, consolidation, statutory shareexchange or other transaction in which shares of Common Stock are exchanged, each Unit of Preferred Stockwill be entitled to receive the per share amount paid in respect of each share of Common Stock.
11. Financial Instruments
Credit Risk - The Company sells products to a wide variety of customers.The Company performs ongoingcredit evaluations of its customers and generally does not require collateral.The Company maintains anallowance for doubtful accounts at a level which management believes is sufficient to cover potential credit loss-es. As of December 31, 2001, concentrations of credit risk with respect to receivables are limited due to the widevariety of customers.
Fair Value of Financial Instruments - The book value of the Company’s financial instruments approximatestheir fair value. Financial instruments include cash, accounts receivable, finance receivables, accounts payable,long- and short-term debt and one interest rate swap agreement. Excluding $80,000,000 of senior securednotes, the Company’s short and long-term debt is floating rate debt and, accordingly, book value approximates

54
Derivative Financial Instruments - The Company only uses derivatives for hedging purposes. During 2000and 2001, the Company entered into interest-rate swap agreements that effectively convert a portion of itsfloating-rate debt to a fixed rate bases, thus reducing the impact of interest rate charges on future income. OnApril 6, 2000, the Company’s captive finance subsidiary, Astec Financial Services, Inc., entered into a swapagreement with a notional amount of $7,500,000 that is effective for five years. On January 2, 2001, theCompany entered into a swap agreement in the notional amount of $40,000,000.This agreement expired onDecember 31, 2001. At December 31, 2001 the fair value of the $7,500,000 interest rate swap was$(713,070).
12. Operations by Industry Segment and Geographic Area
The Company has four reportable operating segments.These segments are combinations of business unitsthat offer different products and services.The business units are each managed separately because they man-ufacture and distribute distinct products that require different marketing strategies. A brief description of eachsegment is as follows:
Asphalt Group - This segment consists of three operating units that design, manufacture and market a com-plete line of portable, stationary and relocatable hot-mix asphalt plants and related components and a varietyof heaters, heat transfer processing equipment and thermal fluid storage tanks.The principal purchasers ofthese products are asphalt producers, highway and heavy equipment contractors and foreign and domesticgovernmental agencies.
Aggregate and Mining Group - This segment consists of eight operating units that design, manufacture andmarket a complete line of rock crushers, feeders, conveyors, screens and washing equipment.The principalpurchasers of these products are open mine and quarry operators.
Mobile Asphalt Paving Group - This segment consists of two operating units that design, manufacture andmarket asphalt pavers, asphalt material transfer vehicles, milling machines and paver screeds.The principalpurchasers of these products are highway and heavy equipment contractors and foreign and domestic govern-mental agencies.
Underground Group - This segment consists of two operating units that design, manufacture and marketauger boring machines, directional drills, fluid/mud systems, chain and wheel trenching equipment, rock saws,road miners and material processing equipment.The principal purchasers of these products are pipeline andutility contractors.
All Others - This category consists of the Company’s other business units, including the parent company,Astec Industries, Inc., that do not meet the requirements for separate disclosure as an operating segment.Revenues in this category are derived primarily from operating leases owned by the Company’s finance sub-sidiary.
The Company evaluates performance and allocates resources based on profit or loss from operations beforefederal income taxes and corporate overhead.The accounting policies of the reportable segments are thesame as those described in the summary of significant accounting policies.
Intersegment sales and transfers are valued at prices comparable to those for unrelated parties. For manage-ment purposes, the Company does not allocate federal income taxes or corporate overhead (including interestexpense) to its business units.
NOTES TO CONSOLIDATED FINANCIAL STATEMENTS
its fair value.The fair value of amounts outstanding under the senior secured note agreement are estimatedusing discounted cash flow analyses, based on the Company’s current incremental borrowing rates for similartypes of borrowing arrangements and were $78,996,000 at December 31, 2001.

55
Segment information for 2001
Aggregate Mobile AsphaltAsphalt and Mining Paving Underground AllGroup Group Group Group Others Total
Revenues from external
customers $142,673,987 $182,868,140 $ 78,487,989 $ 48,655,104 $ 3,153,944 $455,839,164
Intersegment revenues 18,021,023 12,722,446 3,092,286 59,179 3,174,416 37,069,350
Interest expense 463,397 314,616 255,264 8,333,777 9,367,054
Depreciation and
amortization 4,986,576 5,492,486 2,174,634 2,228,693 2,163,183 17,045,572
Segment profit (loss) 5,021,537 7,460,549 9,020,534 (4,837,408) (14,080,215) 2,584,997
Segment assets 157,947,201 200,699,113 66,712,447 57,501,404 245,183,271 728,043,436
Capital expenditures 3,103,740 3,025,609 1,106,839 453,438 367,796 8,057,422
Segment information for 2000
Aggregate Mobile AsphaltAsphalt and Mining Paving Underground AllGroup Group Group Group Others Total
Revenues from external
customers $187,823,335 $190,931,429 $ 63,268,136 $ 75,748,060 $ 2,916,891 $520,687,851
Intersegment revenues 13,427,266 21,024,808 120,618 504,963 3,051,983 38,129,638
Interest expense 4,742 769,003 175,634 340,583 7,362,377 8,652,339
Depreciation and
amortization 4,774,154 5,078,301 1,629,792 2,082,141 1,815.315 15,379,703
Segment profit (loss) 17,996,985 18,367,234 8,343,809 6,835,885 (25,515,926) 26,027,987
Segment assets 167,042,229 202,701,018 58,826,228 59,934,607 262,897,237 751,401,319
Capital expenditures 8,562,340 6,819,029 1,602,651 3,336,470 470,534 20,791,024
Segment information for 1999
Aggregate Mobile AsphaltAsphalt and Mining Paving Underground AllGroup Group Group Group Others Total
Revenues from external
customers $192,525,695 $155,199,535 $ 67,374,684 $ 31,510,153 $ 3,017,390 $449,627,457
Intersegment revenues 8,947,300 10,636,735 936,882 2,643,437 23,164,354
Interest expense 57,447 683,404 93,875 289,569 3,128,924 4,253,219
Depreciation and
amortization 4,153,143 3,049,886 1,274,471 995,609 2,222,753 11,695,862
Segment profit (loss) 25,449,090 18,198,871 11,200,103 988,904 (25,299,553) 30,537,415
Segment assets 150,032,995 184,015,782 43,619,752 52,280,067 238,563,925 668,512,521
Capital expenditures 8,962,862 10,883,070 3,442,706 2,155,055 5,435,997 30,879,690
NOTES TO CONSOLIDATED FINANCIAL STATEMENTS
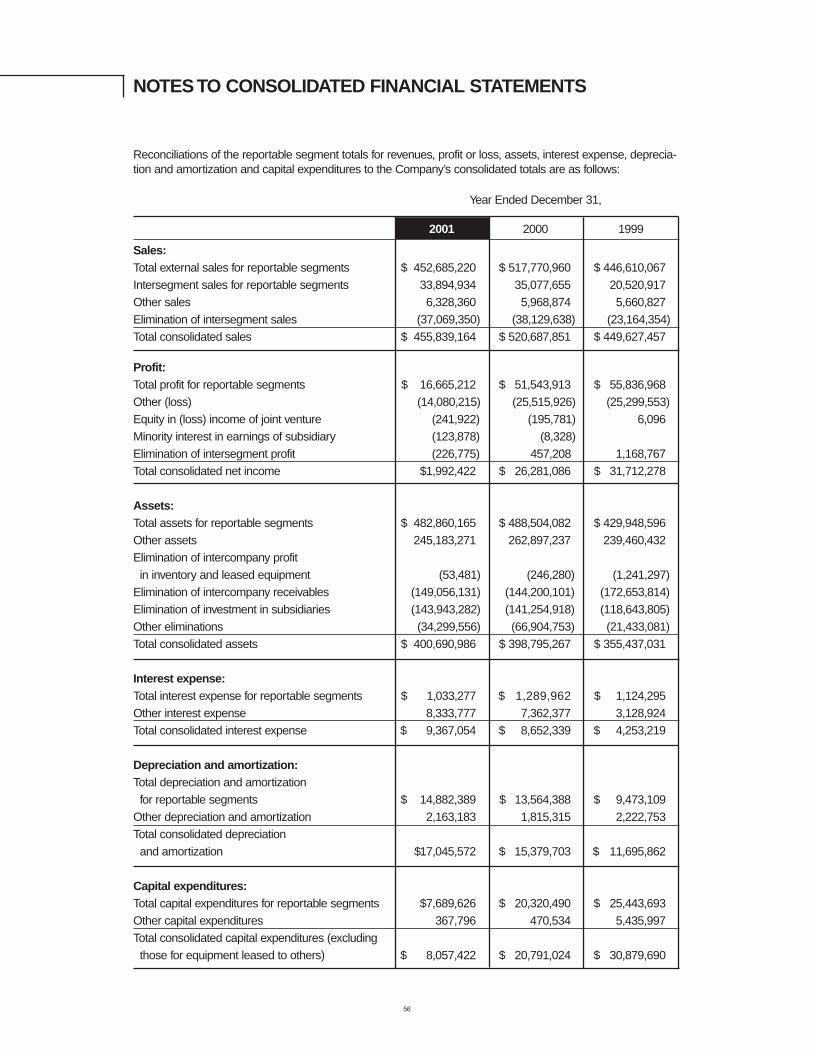
Reconciliations of the reportable segment totals for revenues, profit or loss, assets, interest expense, deprecia-tion and amortization and capital expenditures to the Company’s consolidated totals are as follows:
Year Ended December 31,
2001 2000 1999
Sales:Total external sales for reportable segments $ 452,685,220 $ 517,770,960 $ 446,610,067Intersegment sales for reportable segments 33,894,934 35,077,655 20,520,917Other sales 6,328,360 5,968,874 5,660,827Elimination of intersegment sales (37,069,350) (38,129,638) (23,164,354)Total consolidated sales $ 455,839,164 $ 520,687,851 $ 449,627,457
Profit:Total profit for reportable segments $ 16,665,212 $ 51,543,913 $ 55,836,968Other (loss) (14,080,215) (25,515,926) (25,299,553)Equity in (loss) income of joint venture (241,922) (195,781) 6,096Minority interest in earnings of subsidiary (123,878) (8,328)Elimination of intersegment profit (226,775) 457,208 1,168,767Total consolidated net income $1,992,422 $ 26,281,086 $ 31,712,278
Assets:Total assets for reportable segments $ 482,860,165 $ 488,504,082 $ 429,948,596Other assets 245,183,271 262,897,237 239,460,432Elimination of intercompany profit in inventory and leased equipment (53,481) (246,280) (1,241,297)
Elimination of intercompany receivables (149,056,131) (144,200,101) (172,653,814)Elimination of investment in subsidiaries (143,943,282) (141,254,918) (118,643,805)Other eliminations (34,299,556) (66,904,753) (21,433,081)Total consolidated assets $ 400,690,986 $ 398,795,267 $ 355,437,031
Interest expense:Total interest expense for reportable segments $ 1,033,277 $ 1,289,962 $ 1,124,295Other interest expense 8,333,777 7,362,377 3,128,924Total consolidated interest expense $ 9,367,054 $ 8,652,339 $ 4,253,219
Depreciation and amortization:Total depreciation and amortization for reportable segments $ 14,882,389 $ 13,564,388 $ 9,473,109
Other depreciation and amortization 2,163,183 1,815,315 2,222,753Total consolidated depreciation and amortization $17,045,572 $ 15,379,703 $ 11,695,862
Capital expenditures:Total capital expenditures for reportable segments $7,689,626 $ 20,320,490 $ 25,443,693Other capital expenditures 367,796 470,534 5,435,997Total consolidated capital expenditures (excludingthose for equipment leased to others) $ 8,057,422 $ 20,791,024 $ 30,879,690
56
NOTES TO CONSOLIDATED FINANCIAL STATEMENTS

International sales by domestic subsidiaries by major geographic region were as follows:
Year Ended December 31,
2001 2000 1999
Asia $ 2,020,836 $ 1,589,937 $ 2,814,288Southeast Asia 6,462,062 2,824,572 808,771Europe 12,951,596 7,137,599 7,148,982South America 6,536,419 2,984,187 4,280,998Canada 13,356,316 14,950,621 12,694,606Australia 1,642,519 6,598,660 962,743Africa 23,855,351 8,044,463 1,434,304Central America 20,602,844 15,557,104 9,995,037Middle East 666,312 205,300 1,080,697West Indies 2,398,950 3,018,152 4,365,563Other 917,346 588,325 209,208Total $91,410,551 $63,498,920 $45,795,197
13. Finance Receivables
Finance receivables are receivables of Astec Financial Services, Inc. Contractual maturities of outstandingreceivables at December 31, 2001 were:
FinancingAmounts Due In Leases Notes Total2002 $ 6,992,478 $ 6,800,196 $13,792,6742003 844,531 7,667,836 8,512,3672004 302,264 1,405,512 1,707,7762005 171,342 968,943 1,140,2852006 182,024 809,583 991,607Thereafter 2,198,555 2,198,555Total $ 8,492,639 $19,850,625 $28,343,264
Receivables may be paid prior to contractual maturity generally by payment of a prepayment penalty. AtDecember 31, 2001, there were no impaired loans or leases. Recognition of income on finance receivables issuspended when management determines that collection of future income is not probable. Accrual is resumedif the receivable becomes contractually current and collection doubts are removed. Previously suspendedincome is recognized at that time.
57
NOTES TO CONSOLIDATED FINANCIAL STATEMENTS

58
REPORT OF INDEPENDENT AUDITORS
The Board of Directors and ShareholdersAstec Industries, Inc.
We have audited the accompanying consolidated balance sheets of Astec Industries, Inc. and subsidiaries asof December 31, 2001 and 2000 and the related consolidated statements of income, shareholders' equity andcash flows for each of the three years in the period ended December 31, 2001.These financial statements arethe responsibility of the Company’s management. Our responsibility is to express an opinion on these financialstatements based on our audits.
We conducted our audits in accordance with auditing standards generally accepted in the United States.Thosestandards require that we plan and perform the audit to obtain reasonable assurance about whether the finan-cial statements are free of material misstatement. An audit includes examining, on a test basis, evidence sup-porting the amounts and disclosures in the financial statements. An audit also includes assessing the account-ing principles used and significant estimates made by management, as well as evaluating the overall financialstatement presentation. We believe that our audits provide a reasonable basis for our opinion.
In our opinion, the consolidated financial statements referred to above present fairly, in all material respects, theconsolidated financial position of Astec Industries, Inc. and subsidiaries at December 31, 2001 and 2000 andthe consolidated results of their operations and their cash flows for each of the three years in the period endedDecember 31, 2001, in conformity with accounting principles generally accepted in the United States.
Chattanooga, TennesseeFebruary 14, 2002

ASTEC INDUSTRIES, INC.4101 Jerome Avenue Chattanooga, TN 37407 Phone: (423) 867-4210 www.astecindustries.com
AMERICAN AUGERS, INC.135 U.S. Rt. 42 West Salem, OH 44287 Phone: (419) 869-7107www.americanaugers.com
ASTEC, INC.4101 Jerome Avenue Chattanooga, TN 37407 Phone: (423) 867-4210www.astecinc.com
ASTEC FINANCIAL SERVICES, INC.1725 Shepherd Road Chattanooga, TN 37421 Phone: (423) 899-5898 www.astecfinancial.com
ASTEC SYSTEMS, INC.4101 Jerome Avenue Chattanooga, TN 37407 Phone: (423) 867-4210
BREAKER TECHNOLOGY LTD.35 Elgin Street Thornbury, Ontario, Canada N0H 2P0 Phone: (519) 599-2015 www.rockbreaker.ca
BREAKER TECHNOLOGY, INC.30625 Solon Industrial Parkway Solon, OH 44139 Phone: (440) 248-7168
3464 Durahart StreetRiverside, CA 92507Phone: (909) 369-0878
www.rockbreaker.com
CARLSON PAVING PRODUCTS, INC.18425 50th Avenue East Tacoma, WA 98446 Phone: (253) 875-8000 www.carlsonpavingproducts.com
CEI ENTERPRISES, INC.245 Woodward Road, SE Albuquerque, NM 87102 Phone: (505) 842-5556 www.ceienterprises.com
HEATEC, INC.5200 Wilson Road Chattanooga, TN 37410 Phone: (423) 821-5200 www.heatec.com
JOHNSON CRUSHERSINTERNATIONAL, INC.86470 Franklin Blvd. Eugene, OR 97405 Phone: (541) 736-1400 www.jcieug.com
KOLBERG-PIONEER, INC.700 W. 21st Street Yankton, SD 57078 Phone: (605) 665-9311 www.kolbergpioneer.com
OSBORN ENGINEERED PRODUCTSSA (PTY) LTD.57 Jansen Road Elandsfontein 1406 South Africa Phone: 011-27-11-820-7600 www.osborn.co.za
Company Nam
es & AddressesPAVEMENT TECHNOLOGY11157 City Pond Road Covington, GA 30014 Phone: (770) 388-0909 www.pavementtechnology.com
PRODUCTION ENGINEEREDPRODUCTS, INC.2704 West LeFevre Road Sterling, IL 61081 Phone: (815) 626-6374 www.pepscreen.com
ROADTEC, INC.800 Manufacturers Road Chattanooga, TN 37405 Phone: (423) 265-0600 www.roadtec.com
SUPERIOR INDUSTRIES OFMORRIS, INC.Highway 28 East, Bldg. #1 Morris, MN 56267 Phone: (320) 589-2406 www.superior-ind.com
TELSMITH, INC.10910 N. Industrial Drive Mequon, WI 53092 Phone: (262) 242-6600 www.telsmith.com
TRENCOR, INC.1400 East Highway 26 Grapevine, TX 76051 Phone: (817) 424-1968 www.trencor.com

J. DON BROCK, Ph.DChairman of the BoardPresident & CEOAstec Industries, Inc.Member of Executive Committeeand Technical Committee
ROBERT DRESSLER, Ph.DManaging Director of Corporate Finance, Raymond James & Associates, Inc.Member of Compensation Committee,Technical Committee and Nominating Committee
RONALD W. DUNMIREFormer President, Cedarapids, Inc.Member of Audit Committee,Compensation Committee and Technical Committee
DANIEL K. FRIERSONChairman & CEO, Dixie Group, Inc.Member of Executive Committeeand Nominating Committee
ALBERT E. GUTHPresident, Astec Financial Services, Inc.Member of Executive Committee
WILLIAM D. GEHLChairman & CEO, Gehl CompanyMember of Audit Committee andCompensation Committee
WILLIAM B. SANSOMChairman & CEO,The H.T. Hackney CompanyMember of Audit Committee andNominating Committee
W. NORMAN SMITHPresident, Astec Inc.Group Vice President, AsphaltMember of Executive Committeeand Technical Committee
ROBERT G. STAFFORDGroup Vice President, Aggregate & MiningMember of Technical Committee
ROBERT H. WESTFormer Chairman and President of Butler Manufacturing CompanyMember of Audit Committee
Left to right: Front row seated: Robert H. West, J. Don Brock,William B. Sansom, Robert Dressler
Back row: W. Norman Smith, Albert E. Guth, Robert G. Stafford (seated),Ronald W. Dunmire, Daniel K. Frierson, William D. Gehl (seated)
Boar
d of
Dir
ecto
rs
Board of Directors

Executive O
fficersExecutive Officers
J. DON BROCK Ph.DChairman of the BoardPresident & CEO
RICHARD W. BETHEAExecutive Vice President & Secretary
F. McKAMY HALLVice President, Chief Financial Officer & Treasurer
E. STEPHEN JETTGeneral Counsel & Assistant Secretary
THOMAS R. CAMPBELLGroup Vice President,Mobile Asphalt Paving and Underground
W. NORMAN SMITHGroup Vice President, Asphalt
ROBERT G. STAFFORDGroup Vice President,Aggregate & Mining
Left to right: Front row-seated: J. Don Brock, Robert G. StaffordMiddle row-seated: F. McKamy Hall, Richard W. Bethea
Back row: W. Norman Smith, Thomas R. Campbell, E. Stephen Jett

Co
rpor
ate
Info
rmat
ion Corporate Executive Officers
J. Don Brock, Ph.D., Chairman of the Board, President and CEORichard W. Bethea, Executive Vice President and SecretaryF. McKamy Hall, Vice President, Chief Financial Officer and TreasurerE. Stephen Jett, General Counsel and Assistant SecretaryThomas R. Campbell, Group Vice President - Mobile Asphalt Paving & Underground and President, Roadtec, Inc., Carlson Paving Products, Inc, American Augers, Inc. and Trencor, Inc.W. Norman Smith, Group Vice President - Asphalt and President, Astec, Inc.Robert G. Stafford, Group Vice President - Aggregate & Mining
Subsidiary Executive Officers
Scott D. Smalley, General Manager, American Augers, Inc.Albert E. Guth, President, Astec Financial Services, Inc.Frank D. Cargould, President, Breaker Technology Ltd. and Breaker Technology, Inc.David L. Winters, General Manager, Carlson Paving Products, Inc.Benjamin G. Brock, General Manager, CEI Enterprises, Inc.James G. May, President, Heatec, Inc. and CEI Enterprises, Inc.Jeffrey J. Elliott, President, Johnson Crushers International, Inc.Joeseph P. Vig, President, Kolberg-Pioneer, Inc.Alan Forsyth, Managing Director, Osborn Engineered Products SA (Pty) Ltd.Timothy D. Gonigam, President, Production Engineered Products, Inc.Jeffrey L. Richmond, General Manager, Roadtec, Inc.Neil E. Schmidgall, President, Superior Industries of Morris, Inc.Richard Patek, President, Telsmith, Inc.George A. Bender, General Manager, Trencor, Inc.
Other Information
Tranfer Agent Mellon Investor Services LLC. P.O. Box 3315 South Hackensack, NJ 07606-1915 www.mellon-investor.com Stock Exchange Nasdaq, National Market - ASTEAuditors Ernst & Young LLP, Chattanooga, TNGeneral Counsel and Litigation Chambliss, Bahner & Stophel P.C., Chattanooga, TNSecurities Counsel Alston & Bird, LLP, Atlanta, GACorporate Office Astec Industries, Inc., 4101 Jerome Avenue, P.O. Box 72787 Chattanooga, TN 37407, Phone (423) 867-4210 Fax (423) 827-4127, www.astecindustries.com
The Form 10-K, as filed with the Securities and Exchange Commission, may be obtained at no cost by any shareholder upon written request to Astec Industries, Inc., attention Shareholder Relations.
The Annual meeting will be held at 10 a.m. on April 25, 2002, in the Training Center at the Corporate Office located at 4101 Jerome Avenue, Chattanooga, Tennessee.

