letter incorporating evolutionary adaptation in species ... · pdf fileletter incorporating...
TRANSCRIPT

LETTER Incorporating evolutionary adaptation in species distribution
modelling reduces projected vulnerability to climate change
Alex Bush,1* Karel Mokany,1
Renee Catullo,1,2,3 Ary Hoffmann,4
Vanessa Kellermann,5 Carla Sgr�o,5
Shane McEvey6 and Simon
Ferrier1
1CSIRO Land and Water Canberra,
Australia 2Biological Sciences
Macquarie University Sydney,
Australia 3School of Science and
Health Western Sydney University
Australia, 4Melbourne University
Melbourne, Australia 5Monash
University Melbourne, Australia6Australian Museum Sydney,
Australia
*Correspondence: E-mail:
Abstract
Based on the sensitivity of species to ongoing climate change, and numerous challenges theyface tracking suitable conditions, there is growing interest in species’ capacity to adapt to cli-matic stress. Here, we develop and apply a new generic modelling approach (AdaptR) thatincorporates adaptive capacity through physiological limits, phenotypic plasticity, evolutionaryadaptation and dispersal into a species distribution modelling framework. Using AdaptR to pre-dict change in the distribution of 17 species of Australian fruit flies (Drosophilidae), we showthat accounting for adaptive capacity reduces projected range losses by up to 33% by 2105. Weidentify where local adaptation is likely to occur and apply sensitivity analyses to identify thecritical factors of interest when parameters are uncertain. Our study suggests some species couldbe less vulnerable than previously thought, and indicates that spatiotemporal adaptive modelscould help improve management interventions that support increased species’ resilience to cli-mate change.
Keywords
Drosophila, niche model, phenotypic plasticity, physiological tolerances, thermal tolerance.
Ecology Letters (2016)
INTRODUCTION
Evidence that biodiversity is reacting to ongoing climatechange has driven a sustained surge in the demand for ecolo-gists to improve predictions of future outcomes (Thomas et al.2004; IPBES 2016). A key component in understanding spe-cies’ vulnerability is their capacity to adapt to future climatesthrough evolutionary and plastic responses. While the rate ofprojected change is expected to exceed the capacity of manyspecies to adapt (Etterson & Shaw 2001; Quintero & Wiens2013), rapid evolutionary responses have already beenobserved in many taxa (Franks et al. 2007; Skelly et al. 2007;Sinclair et al. 2012; Krehenwinkel et al. 2015). However, thecorrelative biodiversity models upon which so many predic-tions rely are conceptually disconnected from the theory ofniche evolution (Peterson et al. 1999; Soberon & Peterson2005), and assume species’ distributions are at equilibriumwith their environment and niches are conserved over time;assumptions widely acknowledged as flawed (Wiens et al.2009; Ara�ujo & Peterson 2012).Lack of consideration of evolutionary adaptation in species
distribution models (SDM) is due in part to the absence ofrelevant information on fitness traits and their heritability,which is needed to estimate species responses to selection fromclimate change (Huey et al. 2012). However, new genomicand experimental data offer the opportunity to characterisespecies’ responses in greater detail (Hoffmann & Sgr�o 2011).As more information on adaptive capacity becomes available,including through phylogenetics, genomics and functionalapproaches, new methods are required to incorporate thisknowledge in predicting where and when adaptive capacitycould affect species persistence under climate change(Lavergne et al. 2010; Catullo et al. 2015; Wade et al. 2016).
To identify the potential for species to adapt under climatechange, a variety of new approaches have emerged based onevolutionary theory (Thuiller et al. 2013). Many studies haveexamined the precise dynamics involved in evolutionarychanges, and the importance of factors such as genetic vari-ance, plasticity, admixture, dispersal and range margins(Dytham et al. 2014; DeLong & Gibert 2016; Rees & Ellner2016). However, the detailed evolutionary processes consid-ered by these models typically restrict their application to sim-ple scenarios of hypothetical or simulated environments(Bocedi et al. 2014; Schiffers & Travis 2014). Other studieshave modified environmental tolerances of species withinapplied models (Lozier & Mills 2011; Hill et al. 2014), buthave based estimates on observed range expansions, ratherthan emerging from an evolutionary process. To date, onlyKearney et al. (2009) have integrated evolution, dispersal andabiotic constraints into a spatially explicit SDM, however thisapplication involved a detailed physiological model cus-tomised to a focal species (the Aedes aegypti mosquito).Given the urgent need to assess vulnerability of many taxa
to climate change (Huey et al. 2012), methods that incorpo-rate evolutionary adaptation will only be tractable if theyremain flexible to data availability (Thuiller et al. 2013). Tohelp environmental managers understand when and whereactions could improve species’ resilience to climate change,models must also be spatiotemporally explicit (Sgr�o et al.2011; Hoffmann et al. 2015). Building upon a framework forassessing species’ adaptive capacity using direct and indirectsources of genetic, physiological and ecological information(Catullo et al. 2015), we demonstrate a new generic approachthat considers the effects of evolutionary adaptation on spe-cies’ distributions, called AdaptR. The approach couples anSDM with information on physiological tolerances, dispersal
© 2016 John Wiley & Sons Ltd/CNRS
Ecology Letters, (2016) doi: 10.1111/ele.12696
and genetic variation to predict range shifts that allow foradaptation under environmental change. Code to run AdaptRis available as an R package through the GitHub repository(https://github.com/KarelMokany/AdaptR). We assess theextent to which explicit consideration of evolutionary adapta-tion alters our understanding of vulnerability to climatechange by applying this new modelling approach to 17 speciesof Drosophilidae in Australia.
METHODS
AdaptR
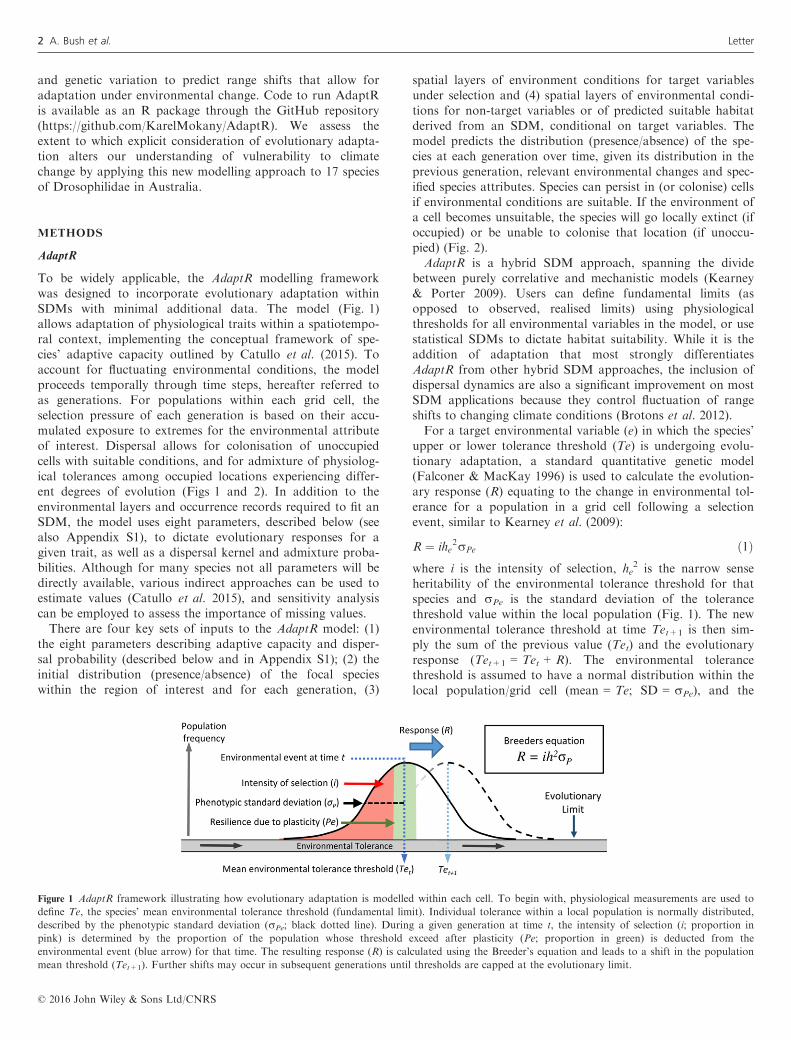
To be widely applicable, the AdaptR modelling frameworkwas designed to incorporate evolutionary adaptation withinSDMs with minimal additional data. The model (Fig. 1)allows adaptation of physiological traits within a spatiotempo-ral context, implementing the conceptual framework of spe-cies’ adaptive capacity outlined by Catullo et al. (2015). Toaccount for fluctuating environmental conditions, the modelproceeds temporally through time steps, hereafter referred toas generations. For populations within each grid cell, theselection pressure of each generation is based on their accu-mulated exposure to extremes for the environmental attributeof interest. Dispersal allows for colonisation of unoccupiedcells with suitable conditions, and for admixture of physiolog-ical tolerances among occupied locations experiencing differ-ent degrees of evolution (Figs 1 and 2). In addition to theenvironmental layers and occurrence records required to fit anSDM, the model uses eight parameters, described below (seealso Appendix S1), to dictate evolutionary responses for agiven trait, as well as a dispersal kernel and admixture proba-bilities. Although for many species not all parameters will bedirectly available, various indirect approaches can be used toestimate values (Catullo et al. 2015), and sensitivity analysiscan be employed to assess the importance of missing values.There are four key sets of inputs to the AdaptR model: (1)
the eight parameters describing adaptive capacity and disper-sal probability (described below and in Appendix S1); (2) theinitial distribution (presence/absence) of the focal specieswithin the region of interest and for each generation, (3)
spatial layers of environment conditions for target variablesunder selection and (4) spatial layers of environmental condi-tions for non-target variables or of predicted suitable habitatderived from an SDM, conditional on target variables. Themodel predicts the distribution (presence/absence) of the spe-cies at each generation over time, given its distribution in theprevious generation, relevant environmental changes and spec-ified species attributes. Species can persist in (or colonise) cellsif environmental conditions are suitable. If the environment ofa cell becomes unsuitable, the species will go locally extinct (ifoccupied) or be unable to colonise that location (if unoccu-pied) (Fig. 2).AdaptR is a hybrid SDM approach, spanning the divide
between purely correlative and mechanistic models (Kearney& Porter 2009). Users can define fundamental limits (asopposed to observed, realised limits) using physiologicalthresholds for all environmental variables in the model, or usestatistical SDMs to dictate habitat suitability. While it is theaddition of adaptation that most strongly differentiatesAdaptR from other hybrid SDM approaches, the inclusion ofdispersal dynamics are also a significant improvement on mostSDM applications because they control fluctuation of rangeshifts to changing climate conditions (Brotons et al. 2012).For a target environmental variable (e) in which the species’
upper or lower tolerance threshold (Te) is undergoing evolu-tionary adaptation, a standard quantitative genetic model(Falconer & MacKay 1996) is used to calculate the evolution-ary response (R) equating to the change in environmental tol-erance for a population in a grid cell following a selectionevent, similar to Kearney et al. (2009):
R ¼ ihe2rPe ð1Þ
where i is the intensity of selection, he2 is the narrow sense
heritability of the environmental tolerance threshold for thatspecies and rPe is the standard deviation of the tolerancethreshold value within the local population (Fig. 1). The newenvironmental tolerance threshold at time Tet+1 is then sim-ply the sum of the previous value (Tet) and the evolutionaryresponse (Tet+1 = Tet + R). The environmental tolerancethreshold is assumed to have a normal distribution within thelocal population/grid cell (mean = Te; SD = rPe), and the
Figure 1 AdaptR framework illustrating how evolutionary adaptation is modelled within each cell. To begin with, physiological measurements are used to
define Te, the species’ mean environmental tolerance threshold (fundamental limit). Individual tolerance within a local population is normally distributed,
described by the phenotypic standard deviation (rPe; black dotted line). During a given generation at time t, the intensity of selection (i; proportion in
pink) is determined by the proportion of the population whose threshold exceed after plasticity (Pe; proportion in green) is deducted from the
environmental event (blue arrow) for that time. The resulting response (R) is calculated using the Breeder’s equation and leads to a shift in the population
mean threshold (Tet+1). Further shifts may occur in subsequent generations until thresholds are capped at the evolutionary limit.
© 2016 John Wiley & Sons Ltd/CNRS
2 A. Bush et al. Letter
intensity of a selection event is approximated as in Kearneyet al. (2009), using a polynomial function based on the pro-portion of the population with tolerance traits exceeding theenvironmental event, and hence surviving this event (S) (Fal-coner & MacKay 1996):
i ¼ aþ bSþ cS2 þ dS3 ð2Þ
where a = 2.2014, b = �0.0488, c = 0.00058 and d = �0.0000029.We have included the influence of plasticity on S by allow-
ing the survival of additional individuals not geneticallyadapted to the environmental conditions, using a specifiedvalue of environmental plasticity (Pe). This value wasassumed fixed and independent of the value of the environ-ment (Kellett et al. 2005). The environmental exposure iseffectively reduced when plasticity is present, increasing theproportion of the population in the grid cell that survives (S)and hence decreasing selection intensity (i) (Fig. 1). Followinghigh-intensity selection events, populations are at high risk oflocal extinction due to demographic stochasticity and are alsolikely to suffer losses of genetic diversity (Willi et al. 2006).Therefore, local extinction occurs only if S is < 5%. Similarly,very weak selection is unlikely to drive substantial evolution,hence a response (R) is generated only if S is < 95%.Under continued selection pressure, over multiple genera-
tions, an environmental threshold trait can continue to shiftuntil values in the population reach the specified evolutionarylimit (Catullo et al. 2015). Further shifts in the environmentalthreshold trait would result in a proportion of the populationunder a normal distribution falling beyond this limit; thatproportion is assigned to the evolutionary limit, reducing rPe.Both theory and empirical evidence suggest that fitness costs
are often incurred when a population undergoes evolutionary
adaptation, especially when adaptation is rapid (Falconer &MacKay 1996; Jansen et al. 2015). We account for costs byincreasing the strength of stabilising selection as the currentthreshold trait value (Tetx) deviates from the original thresh-old trait value (Tet0). In this case, we apply eqn 1 using thesame heritability (he
2) and phenotypic standard deviation(rPtx) of the trait in the grid cell population at the currentgeneration (time = x). Intensity of (stabilising) selection (i)increases linearly with the squared deviation of Tetx from theoriginal value in that population (Tet0), with a specified con-stant slope parameter [m; i.e. i = m(Tet0 � Tetx)
2] (see Fal-coner & MacKay 1996) (Fig. 2).Dispersal in AdaptR occurs at each time step (generation)
through a user-specified set of probabilities of successful disper-sal (Pij) to each grid cell (j) in a specified radius around an occu-pied grid cell (i), allowing complete flexibility in incorporatingdispersal. The probability (Pj) of an unoccupied cell (j) withsuitable environmental conditions being colonised through dis-persal from one or more occupied cells (n =k) is therefore:
Pj ¼ 1�Yk
i¼1
1� Pij
� � ð3Þ
with a colonisation event based on a random draw of proba-bility Pj. In the case of an unoccupied cell becoming occupied,the value of any environmental threshold traits undergoing evo-lutionary adaptation for the newly occupied grid cell (Tej) aredetermined by taking the average of the environmental thresh-old traits of all k occupied grid cells (Tei) within the dispersalradius, weighted by the dispersal probability from those cells:
Tej ¼Pk
i¼1 Tei:Pij
� �Pk
i¼1 Pij
ð4Þ
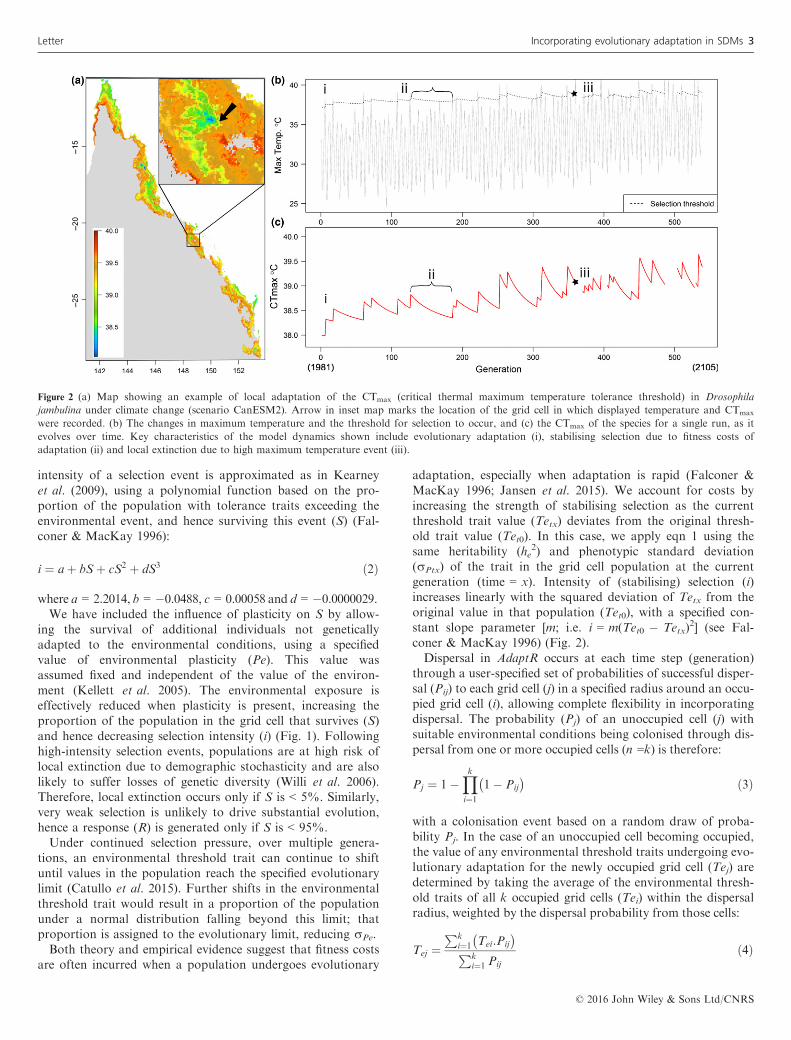
Figure 2 (a) Map showing an example of local adaptation of the CTmax (critical thermal maximum temperature tolerance threshold) in Drosophila
jambulina under climate change (scenario CanESM2). Arrow in inset map marks the location of the grid cell in which displayed temperature and CTmax
were recorded. (b) The changes in maximum temperature and the threshold for selection to occur, and (c) the CTmax of the species for a single run, as it
evolves over time. Key characteristics of the model dynamics shown include evolutionary adaptation (i), stabilising selection due to fitness costs of
adaptation (ii) and local extinction due to high maximum temperature event (iii).
© 2016 John Wiley & Sons Ltd/CNRS
Letter Incorporating evolutionary adaptation in SDMs 3
Likewise, the phenotypic standard deviation of a newlycolonised grid cell (rPj) is determined from the average of koccupied cells, weighted by dispersal probability. The sameprocess is also used to account for change in the environmen-tal threshold traits (Tei) and the phenotypic standard devia-tion (rPi) of occupied cells due to admixture fromsurrounding populations. In the case of admixture, however,we add a weighting parameter (w) ≥ 1 to the focal grid cell (i)to account for the likely larger size of a local population rela-tive to gene flow from other locations.
Case study: Australian drosophilids
We used AdaptR to project the distributions of 17 Australiandrosophilids with significant variation in their genetic diversityrelated to climate tolerance (Hoffmann et al. 2003). We consid-ered evolutionary adaptation only for a species’ critical thermalmaximum (CTmax), with responses to other environmental vari-ables fixed at their current realised limits. Methods aredescribed here in brief, but details are provided in Appendix S1.Genetic variances for heat resistance were estimated in 10 spe-cies through a full-sib–half-sib study design, and inferred fromclosely related species for the remaining seven (Kellermannet al. 2012). Values for CTmax were taken from previous studies(Kellermann et al. 2012; Blackburn et al. 2014).
Climate dataEnvironmental conditions are naturally highly variable, andthe interyear variation in temperature globally has been asgreat as the rise in mean temperature over 30 years (Hunting-ford et al. 2013). The frequency, magnitude and spatial extentof these events all play a role in defining species range bound-aries, as well as determining the intensity of exposure to whichtaxa must adapt. The interval over which extremes are definedin our approach is based on generation time, which variesamong drosophilids between 6 and 9 weeks, but for simplicitywas set to 2 months. The distributions of Australian droso-philids correspond strongly to climatic extremes, in particularof temperature (Kellermann et al. 2009, 2012; Overgaard et al.2014). We assembled six climate variables at approximately~ 1 km (0.01°) resolution across the Australian continentbetween 1981 and 2010 (Hutchinson et al. 2014). Daily valueswere then aggregated to extremes within each generation (seeAppendix S1). Future climate scenarios were drawn fromAWAP projections (Jones et al. 2009) and the forecasts oftwo GCMs (Teng et al. 2012), GFDL-ESM2M andCanESM2, which predict moderate (2–3 °C) and high (4 °C)increases in maximum temperature, respectively, in easternAustralia. These projections were overlaid on the historic cli-mate record to forecast conditions from 2016 to 2105(90 years, 540 generations), from which 100 alternative timeli-nes were generated, randomly varying the order in whichextreme events occurred.
Species distribution modelsIf enough physiological data are available, AdaptR can oper-ate as a purely mechanistic model by limiting species distribu-tions using specified upper and lower environmentaltolerances (Kearney & Porter 2009). However, for many
species, a more tractable approach will be to predict habitatsuitability as a static function of multiple environmental vari-ables using a correlative SDM. To demonstrate AdaptR, thisstudy used the popular correlative SDM approach Maxent(Phillips et al. 2006), but could have used any SDM method.Given that short-term environmental extremes are not compa-rable to long-term averages, model fitting and threshold selec-tion were calibrated across historical generations (30 years,180 generations) (Maiorano et al. 2013). Options for furthermodel validation are discussed in Appendix S1. Finally, asAdaptR identifies the exposure of a population to maximumtemperature separately to other variables, the layers of suit-able habitat were made conditional on the effect of maximumtemperature by projecting suitability using optimum values oftemperature (i.e. temperature that maximises the responsefunction while all other variables are held fixed).
DispersalTo identify the probabilities of dispersal (Pij) for drosophilids,we used stochastic simulations based on observed movementdistances for Drosophila (Dobzhansky & Wright 1943; Spen-cer-Johnston & Heed 1976; Taylor 1978), with the resultingdispersal probabilities approximated by a two-dimensionalnegative square power-law model (Mokany et al. 2014) withmedian dispersal distance (k) = 1 and scaling factor (K) = 1.This kernel has a ‘fat tail’, making it suitable for representingrare long-distance passive dispersal events. We assumed a max-imum possible dispersal distance of 5 km from the focal cell ina single generation. Dispersal between two occupied cells alsoprovides the opportunity for genetic admixture, the effect ofwhich is parameterised as the number of resident individualsper immigrant (w), applied as 1 per 1000 (i.e. w = 1000).
Fitness costs of adaptationHeatwaves in Australia’s recent past could have driven evolu-tion of CTmax to higher limits than currently observed. With-out considering the cost of adaptation to these events, CTmax
can evolve unchecked and remain high. Furthermore, admix-ture then gradually transfers the elevated CTmax from rangemargins to the core. To select the cost slope parameter (m),we ran AdaptR for 1500 years under historical conditions,and chose the lowest value that kept the species CTmax towithin 0.1 °C of its starting CTmax value in > 90% of runs.Based on the consistency of results across species, a singlevalue of 0.05 was used for m in all species.
Analysis
The inclusion of dispersal dynamics meant that little benefitwould be gained from a direct comparison between AdaptRand a standard SDM application. Therefore, to identifywhether physiological tolerances and adaptation have a signif-icant effect on a species’ predicted range size under future cli-mate scenarios, we used three types of projections: (1) the‘Basic Hybrid SDM’ added dispersal dynamics to the originalSDM predictions; (2) the ‘Fixed Threshold’ model addedphysiological data on known CTmax, but did not vary spa-tially or allow for adaptation (plasticity, phenotypic varianceand heritability reduced to zero) and (3) the ‘Adaptation’
© 2016 John Wiley & Sons Ltd/CNRS
4 A. Bush et al. Letter

model allowed genetic adaptation of CTmax. In each case, themodel was run 100 times using differing time series of envi-ronmental conditions as described above, replicated under ano climate change scenario and climate change scenariosbased on forecasts by GFDL-ESM2M and CanESM2. To testthe overall model results, a mixed-effects linear model was fit-ted using the lme4 R package (Bates et al. 2012), treating per-centage change in a species’ starting range as a function ofthe modelling approach used and climate scenario, with thespecies and environmental time series included as randomeffects.
RESULTS
In general, range size was projected to decline as a result ofclimate change, although outcomes varied widely among spe-cies and simulation runs. In response to the rapid climatechange under the CanESM2 scenario, Drosophila simulanswent extinct in 70% of runs, irrespective of adaptation ofCTmax, because other environmental factors were more influ-ential (Appendix Table S1.4). One of the more striking out-comes of the AdaptR projections were the spatial patterns oflocal adaptation for CTmax, evident in widespread speciesunder current climatic conditions and in all species after selec-tion pressure from climate change was introduced(Appendix S2). In Drosophila jambulina, for example, CTmax
in 2085 (averaged across 100 runs) was highest at the rangeedges, and closer to its original value near the coast and athigh elevations (Fig. 2a). Model output from a single grid cellin a single simulation run highlights the key processes occur-ring as maximum temperature fluctuates within and betweenyears, but gradually rises under climate change (Fig. 2b). Inthis particular run there are multiple temperature extremesearly on, and rapid adaptation in response (Fig. 2c i), butduring long intervals between such events, CTmax begins todecrease due to stabilising selection (Fig. 2c ii). As the climatewarms further, heatwaves exceed the 95th percentile of thepopulation’s CTmax and drive the population locally extinct(Fig. 2c iii). The site is subsequently recolonised either fromrefugia in which the CTmax had remained low or from otheradapted parts of the range. Variation in other environmentalvariables could also cause more frequent local extinction butwas not an issue at this particular site.The ‘Adaptation’ models offset many declines in range size
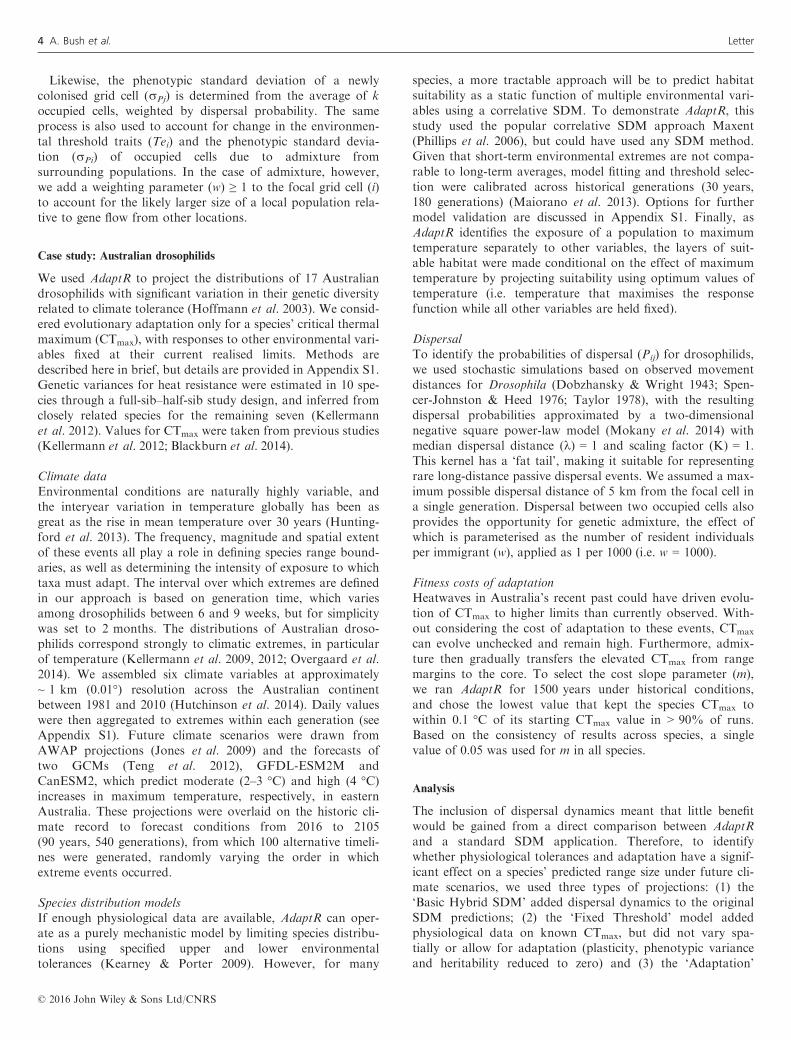
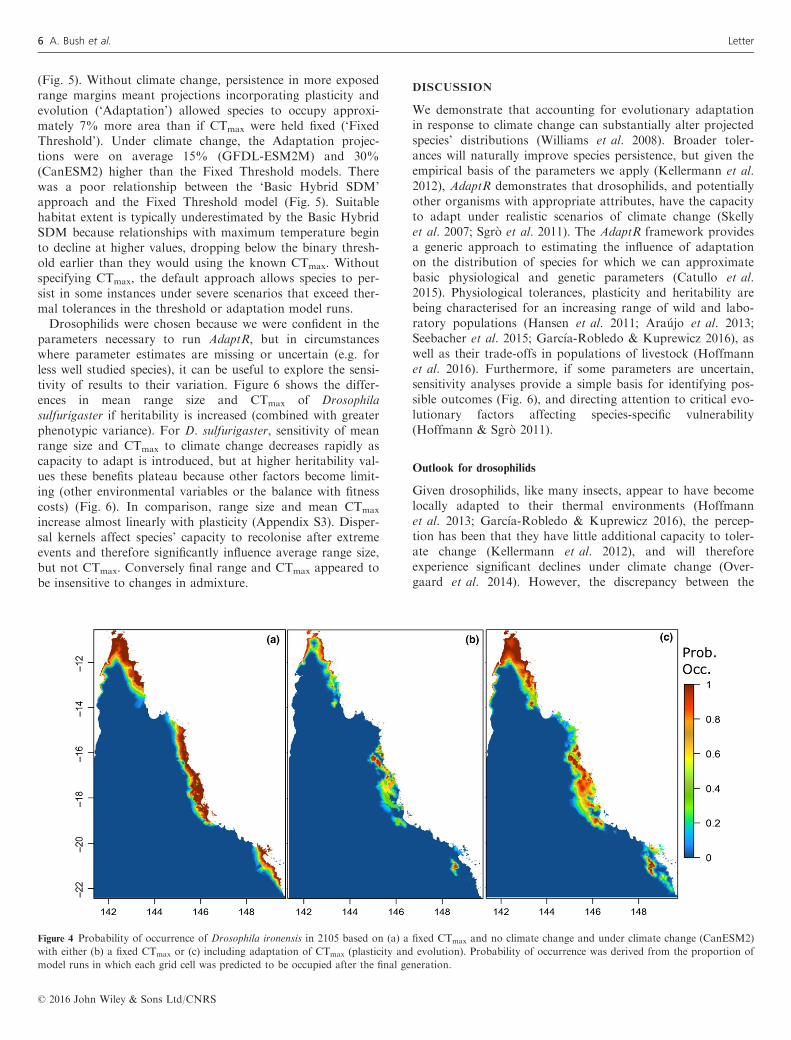
that occurred if thermal tolerance was fixed, regardless of aspecies’ current distribution (Fig. 3). Although only smallincreases in the average CTmax were necessary to reduce rangelosses (Fig. 3d), this often conceals the high spatial variationin adaptation, which increased the probability of persistenceat range margins (Fig. 2 and Appendix S2). For example,under climate change, the distribution of Drosophila ironensiscontracts to high altitude and coastal refugia, but with adap-tation of CTmax range losses were reduced as the species hada much greater likelihood of persisting in each of the threeregional populations, including lowland environments (Fig. 4).Final range size was highly variable depending on the
sequence of environmental extremes and time for recoverythat preceded 2105 (Fig. 3), but after accounting for variationamong species and runs there were clear effects of adaptation
Figure 3 Timeline of changes in range size of (a) Drosophila melanogaster
(continental distribution), (b) D. simulans (east coast) and (c) D. rubida
(Wet Tropics) under the CanESM2 climate change projections. Each plot
shows timelines for projections in which CTmax is held fixed (blue), and
when plasticity and genetic adaptation are included (red) (mean � 1 SD
of 100 runs). For runs with adaptation, panel (d) shows each species
mean CTmax (� 1 SD) (°C); a–c, respectively, over time.
© 2016 John Wiley & Sons Ltd/CNRS
Letter Incorporating evolutionary adaptation in SDMs 5
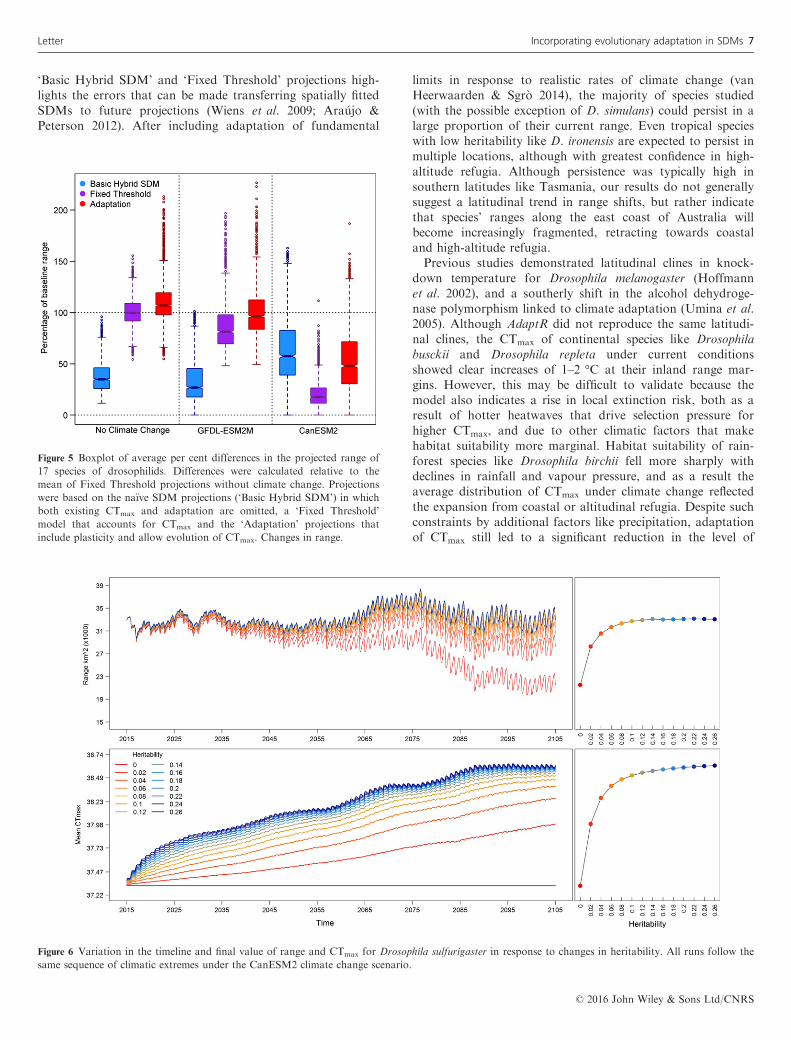
(Fig. 5). Without climate change, persistence in more exposedrange margins meant projections incorporating plasticity andevolution (‘Adaptation’) allowed species to occupy approxi-mately 7% more area than if CTmax were held fixed (‘FixedThreshold’). Under climate change, the Adaptation projec-tions were on average 15% (GFDL-ESM2M) and 30%(CanESM2) higher than the Fixed Threshold models. Therewas a poor relationship between the ‘Basic Hybrid SDM’approach and the Fixed Threshold model (Fig. 5). Suitablehabitat extent is typically underestimated by the Basic HybridSDM because relationships with maximum temperature beginto decline at higher values, dropping below the binary thresh-old earlier than they would using the known CTmax. Withoutspecifying CTmax, the default approach allows species to per-sist in some instances under severe scenarios that exceed ther-mal tolerances in the threshold or adaptation model runs.Drosophilids were chosen because we were confident in the
parameters necessary to run AdaptR, but in circumstanceswhere parameter estimates are missing or uncertain (e.g. forless well studied species), it can be useful to explore the sensi-tivity of results to their variation. Figure 6 shows the differ-ences in mean range size and CTmax of Drosophilasulfurigaster if heritability is increased (combined with greaterphenotypic variance). For D. sulfurigaster, sensitivity of meanrange size and CTmax to climate change decreases rapidly ascapacity to adapt is introduced, but at higher heritability val-ues these benefits plateau because other factors become limit-ing (other environmental variables or the balance with fitnesscosts) (Fig. 6). In comparison, range size and mean CTmax
increase almost linearly with plasticity (Appendix S3). Disper-sal kernels affect species’ capacity to recolonise after extremeevents and therefore significantly influence average range size,but not CTmax. Conversely final range and CTmax appeared tobe insensitive to changes in admixture.
DISCUSSION
We demonstrate that accounting for evolutionary adaptationin response to climate change can substantially alter projectedspecies’ distributions (Williams et al. 2008). Broader toler-ances will naturally improve species persistence, but given theempirical basis of the parameters we apply (Kellermann et al.2012), AdaptR demonstrates that drosophilids, and potentiallyother organisms with appropriate attributes, have the capacityto adapt under realistic scenarios of climate change (Skellyet al. 2007; Sgr�o et al. 2011). The AdaptR framework providesa generic approach to estimating the influence of adaptationon the distribution of species for which we can approximatebasic physiological and genetic parameters (Catullo et al.2015). Physiological tolerances, plasticity and heritability arebeing characterised for an increasing range of wild and labo-ratory populations (Hansen et al. 2011; Ara�ujo et al. 2013;Seebacher et al. 2015; Garc�ıa-Robledo & Kuprewicz 2016), aswell as their trade-offs in populations of livestock (Hoffmannet al. 2016). Furthermore, if some parameters are uncertain,sensitivity analyses provide a simple basis for identifying pos-sible outcomes (Fig. 6), and directing attention to critical evo-lutionary factors affecting species-specific vulnerability(Hoffmann & Sgr�o 2011).
Outlook for drosophilids
Given drosophilids, like many insects, appear to have becomelocally adapted to their thermal environments (Hoffmannet al. 2013; Garc�ıa-Robledo & Kuprewicz 2016), the percep-tion has been that they have little additional capacity to toler-ate change (Kellermann et al. 2012), and will thereforeexperience significant declines under climate change (Over-gaard et al. 2014). However, the discrepancy between the
Figure 4 Probability of occurrence of Drosophila ironensis in 2105 based on (a) a fixed CTmax and no climate change and under climate change (CanESM2)
with either (b) a fixed CTmax or (c) including adaptation of CTmax (plasticity and evolution). Probability of occurrence was derived from the proportion of
model runs in which each grid cell was predicted to be occupied after the final generation.
© 2016 John Wiley & Sons Ltd/CNRS
6 A. Bush et al. Letter
‘Basic Hybrid SDM’ and ‘Fixed Threshold’ projections high-lights the errors that can be made transferring spatially fittedSDMs to future projections (Wiens et al. 2009; Ara�ujo &Peterson 2012). After including adaptation of fundamental
limits in response to realistic rates of climate change (vanHeerwaarden & Sgr�o 2014), the majority of species studied(with the possible exception of D. simulans) could persist in alarge proportion of their current range. Even tropical specieswith low heritability like D. ironensis are expected to persist inmultiple locations, although with greatest confidence in high-altitude refugia. Although persistence was typically high insouthern latitudes like Tasmania, our results do not generallysuggest a latitudinal trend in range shifts, but rather indicatethat species’ ranges along the east coast of Australia willbecome increasingly fragmented, retracting towards coastaland high-altitude refugia.Previous studies demonstrated latitudinal clines in knock-
down temperature for Drosophila melanogaster (Hoffmannet al. 2002), and a southerly shift in the alcohol dehydroge-nase polymorphism linked to climate adaptation (Umina et al.2005). Although AdaptR did not reproduce the same latitudi-nal clines, the CTmax of continental species like Drosophilabusckii and Drosophila repleta under current conditionsshowed clear increases of 1–2 °C at their inland range mar-gins. However, this may be difficult to validate because themodel also indicates a rise in local extinction risk, both as aresult of hotter heatwaves that drive selection pressure forhigher CTmax, and due to other climatic factors that makehabitat suitability more marginal. Habitat suitability of rain-forest species like Drosophila birchii fell more sharply withdeclines in rainfall and vapour pressure, and as a result theaverage distribution of CTmax under climate change reflectedthe expansion from coastal or altitudinal refugia. Despite suchconstraints by additional factors like precipitation, adaptationof CTmax still led to a significant reduction in the level of
Figure 5 Boxplot of average per cent differences in the projected range of
17 species of drosophilids. Differences were calculated relative to the
mean of Fixed Threshold projections without climate change. Projections
were based on the na€ıve SDM projections (‘Basic Hybrid SDM’) in which
both existing CTmax and adaptation are omitted, a ‘Fixed Threshold’
model that accounts for CTmax and the ‘Adaptation’ projections that
include plasticity and allow evolution of CTmax. Changes in range.
Figure 6 Variation in the timeline and final value of range and CTmax for Drosophila sulfurigaster in response to changes in heritability. All runs follow the
same sequence of climatic extremes under the CanESM2 climate change scenario.
© 2016 John Wiley & Sons Ltd/CNRS
Letter Incorporating evolutionary adaptation in SDMs 7

range contraction expected for all species under climatechange, although the sensitivity analyses demonstrated thediminishing returns adaptation of CTmax can make to reduc-ing vulnerability (Fig. 6). While generation length naturallymoderates the necessary heritability for trait evolution (Daviset al. 2005), our study suggests adaptation could still beimportant to species thought to have low adaptive capacity,and therefore strategic management of existing adaptivegenetic variation could play a significant role in their resilienceto climate change (Sgr�o et al. 2011).
Challenges and assumptions
Including all current understanding of eco-evolutionarydynamics in a comprehensive modelling framework wouldbring few practical benefits, as assumptions and uncertaintieswould quickly escalate and reduce the number of species towhich it could be applied (Thuiller et al. 2013). To managethis trade-off, we use a basic framework that includes impor-tant features such as phenotypic limits and variance, plasticityand admixture, with the option to include more advancedprocesses if data become available (Catullo et al. 2015). As aresult, the requirements for running AdaptR are modest incomparison to mechanistic SDMs or individual-based evolu-tionary models (Kearney et al. 2009; Bocedi et al. 2014; Schif-fers & Travis 2014), with potential application to any specieswith occurrence data to support SDM, and data that directlyor indirectly inform estimation of adaptive capacity (Catulloet al. 2015). Nonetheless, where AdaptR is applied in associa-tion with correlative SDMs, it is important that users applythe same quality control, checks for biases, and understandingof modelling assumptions as they would when fitting andvalidating a standard SDM (Wiens et al. 2009; Ara�ujo &Peterson 2012).Notwithstanding the paucity of genetic information, biodi-
versity models are frequently limited to predicting occurrencerather than local abundance (VanDerWal et al. 2009). Thisinherently limits the form of evolutionary response that canbe considered (Hoffmann & Sgr�o 2011), and requires a num-ber of assumptions regarding population size, demographyand dispersal probability. Gomulkiewicz & Holt (1995) con-cluded that even populations with the genetic wherewithal topersist in a novel environment may often fail to do so due todemographic stochasticity. Nonetheless, if appropriate datawere available, the AdaptR model could easily be modified toaccount for more complex dynamics (e.g. Fordham et al.2013). For example, modelling of selection on a trait likeCTmax could be expanded to consider optima on thermal per-formance curves or tolerance landscapes (Rezende et al.2014); phenotypic variance could respond more realistically toselection, mutation and drift (DeLong & Gibert 2016); andthe model could consider potential trade-offs with other fit-ness traits or selection pressures (Mellard et al. 2015), particu-larly outside laboratory conditions (Sinclair et al. 2012).Although no trade-offs were found between heat toleranceand other traits in D. melanogaster (Williams et al. 2012),antagonistic relationships can severely constrain adaptiveresponses (Etterson & Shaw 2001). AdaptR should thereforebe considered a starting point for understanding climate
change adaptation. After the evolutionary outcomes of themodel have been validated [e.g. by comparing current patternsof local adaptation or niche shifts during expansion by inva-sive species (Appendix S1)], further refinements and morecomplex analyses of a species’ adaptive capacity could beincorporated (Thuiller et al. 2013).In addition to gaps in information on evolutionary pro-
cesses, there are also some technical challenges in generatingenvironmental layers that match relevant physiological traitsof organisms. To map the exposure, and hence intensity ofselection experienced by an organism requires the variation inmicroclimate outside meteorological stations be considered(Kaspari et al. 2015). Consequently, the capacity for organ-isms to adapt their behaviour and improve thermoregulationor to avoid hostile conditions in different life-cycle stages maybe important (Kingsolver et al. 2011; Huey et al. 2012). Theseissues are particularly important when considering whichphysiological parameters to use and how they are measured(Mitchell & Hoffmann 2010; Andersen et al. 2015). Mappingmicro-climate has been one of the main challenges to applyingmechanistic SDMs in the past (Kearney & Porter 2009). How-ever, additional data collection during fieldwork could definethe statistical relationships for downscaling coarse environ-mental layers (Storlie et al. 2013). Furthermore, new tools arenow available to scale thermal conditions in a variety ofmicrohabitats (Kearney et al. 2014).
CONCLUSIONS
The interest in species’ evolutionary potential under climatechange is not just critical to conservation of biodiversity;genetic adaptation could also prove vital to carbon sequestra-tion (Padfield et al. 2016), agriculture (Lobell et al. 2015),biosecurity risk analysis (Shearer et al. 2016), fisheries (Mu~nozet al. 2014) and human welfare (Kearney et al. 2009). Manyspecies, particularly those that have short generations, couldhave substantial capacity to adapt under climate change andtherefore previous estimates of sensitivity may have been over-estimated. Here, we have applied a new, and relatively simple,framework to characterise niche limits and adaptive capacity(Catullo et al. 2015), which can be informed either directly byempirical studies (Hangartner et al. 2015) or indirectly usingthe wide variety of trait and phylogenetic data sources nowavailable for many species (Jaro�s�ık et al. 2011; Kellermannet al. 2012). In coming years, genomics will increase our abilityto identify distinct lineages, detect gene flow, characterise pat-terns of adaptation across landscapes and quantify levels ofgenetic variation relevant to adaptive capacity under climatechange (Sgr�o et al. 2011; Hoffmann et al. 2015). To build onthis foundation, spatiotemporal models like AdaptR are neededto identify whether there is capacity to adapt to climate change,and where management intervention should occur. AdaptRcould also inform where to source genetically diverse and pre-adapted communities for restoration (Prober et al. 2015),increase the efficiency of translocation, identify refugia thatallow for migration and/or increase genetic connectivity andpopulation sizes (Sgr�o et al. 2011). Finally the flexible basicstructure of AdaptR will hopefully encourage further researchinto how we model evolutionary processes realistically.
© 2016 John Wiley & Sons Ltd/CNRS
8 A. Bush et al. Letter

ACKNOWLEDGEMENTS
This work was supported as part of the Genomic Basis forAdaptation to Climate Change by the Australian Science andIndustry Endowment Fund. We thank Bradley Evans,Michael Hutchinson and Craig Heady for help with accessingclimate data.
AUTHOR CONTRIBUTIONS
AB, KM, RC, AH and SF designed the study and modellingframework; AH, VK, SM and CS collected and contributeddrosophilid data; KM and AB developed the model; allauthors contributed to revisions of the manuscript (AB wrotefirst draft).
REFERENCES
Andersen, J.L., Manenti, T., Sørensen, J.G., MacMillan, H.A.,
Loeschcke, V. & Overgaard, J. (2015). How to assess Drosophila cold
tolerance: chill coma temperature and lower lethal temperature are the
best predictors of cold distribution limits. Funct. Ecol., 29, 55–65.Ara�ujo, M.B. & Peterson, A.T. (2012). Uses and misuses of bioclimatic
envelope modeling. Ecology, 93, 1527–1539.Ara�ujo, M.B., Ferri-Y�a~nez, F., Bozinovic, F., Marquet, P.A., Valladares,
F. & Chown, S.L. (2013). Heat freezes niche evolution. Ecol. Lett., 16,
1206–1219.Bates, D., Maechler, M. & Bolker, B. (2015). Fitting Linear Mixed-
Effects Models Using lme4. Journal of statistical software, 67, 1–48.Blackburn, S., van Heerwaarden, B., Kellermann, V. & Sgr�o, C.M.
(2014). Evolutionary capacity of upper thermal limits: beyond single
trait assessments. J. Exp. Biol., 217, 1918–1924.Bocedi, G., Palmer, S.C.F., Pe’er, G., Heikkinen, R.K., Matsinos, Y.G.,
Watts, K. et al. (2014). RangeShifter: a platform for modelling spatial
eco-evolutionary dynamics and species’ responses to environmental
changes. Methods Ecol. Evol., 5, 388–396.Brotons, L., C�aceres, M., Fall, A. & Fortin, M.J. (2012). Modeling bird
species distribution change in fire prone Mediterranean landscapes:
incorporating species dispersal and landscape dynamics. Ecography, 35,
458–467.Catullo, R.A., Ferrier, S. & Hoffmann, A.A. (2015). Extending spatial
modelling of climate change responses beyond the realized niche:
estimating, and accommodating, physiological limits and adaptive
evolution. Glob. Ecol. Biogeogr., 24, 1192–1202.Davis, M.B., Shaw, R.G. & Etterson, J.R. (2005). Evolutionary responses
to climate change. Ecology, 86, 1704–1714.DeLong, J.P. & Gibert, J.P. (2016). Gillespie eco-evolutionary models
(GEMs) reveal the role of heritable trait variation in eco-evolutionary
dynamics. Ecol. Evol., 6, 935–945.Dobzhansky, T.H. & Wright, S. (1943). Genetics of natural populations.
Dispersal rates in Drosophila pseudoobscura. Genetics, 28, 304–340.Dytham, C., Travis, J.M.J., Mustin, K. & Benton, T.G. (2014). Changes
in species’ distributions during and after environmental change: which
eco-evolutionary processes matter more? Ecography, 37, 1210–1217.Etterson, J.R. & Shaw, R.G. (2001). Constraint to adaptive evolution in
response to global warming. Science, 294, 151–154.Falconer, D.S. & MacKay, T.F.C. (1996). Introduction to Quantitative
Genetics, 4th edn. Pearson Education Limited, Harlow, UK.
Fordham, D.A., Mellin, C., Russell, B.D., Akc�akaya, R.H., Bradshaw,
C.J.A., Lammens, M.E. et al. (2013). Population dynamics can be more
important than physiological limits for determining range shifts under
climate change. Glob. Change Biol., 19, 3224–3237.Franks, S.J., Sim, S. & Weis, A.E. (2007). Rapid evolution of flowering
time by an annual plant in response to a climate fluctuation. Proc. Natl
Acad. Sci., 104, 1278–1282.
Garc�ıa-Robledo, C. & Kuprewicz, E.K. (2016). Limited tolerance by
insects to high temperatures across tropical elevational gradients and
the implications of global warming for extinction. Proc. Natl Acad.
Sci., 113, 680–685.Gomulkiewicz, R. & Holt, R.D. (1995). When does evolution by natural
selection prevent extinction? Evolution, 49, 201.
Hangartner, S.B., Hoffmann, A.A., Smith, A. & Griffin, P.C. (2015). A
collection of Australian Drosophila datasets on climate adaptation and
species distributions. Sci. Data, 2, 1–8.Hansen, T.F., P�elabon, C. & Houle, D. (2011). Heritability is not
evolvability. Evol. Biol., 38, 258–277.van Heerwaarden, B. & Sgr�o, C.M. (2014). Is adaptation to climate change
really constrained in niche specialists? Proc. Biol. Sci., 281, 20140396.
Hill, M.P., Axford, J.K. & Hoffmann, A.A. (2014). Predicting the spread
of Aedes albopictus in Australia under current and future climates:
multiple approaches and datasets to incorporate potential evolutionary
divergence. Austral Ecol., 39, 469–478.Hoffmann, A.A. & Sgr�o, C.M. (2011). Climate change and evolutionary
adaptation. Nature, 470, 479–485.Hoffmann, A.A., Anderson, A. & Hallas, R. (2002). Opposing clines for
high and low temperature resistance in Drosophila melanogaster. Ecol.
Lett., 5, 614–618.Hoffmann, A.A., Hallas, R.J., Dean, J.A. & Schiffer, M. (2003). Low
potential for climatic stress adaptation in a rainforest Drosophila
species. Science, 301, 100–102.Hoffmann, A.A., Chown, S.L. & Clusella-Trullas, S. (2013). Upper
thermal limits in terrestrial ectotherms: how constrained are they?
Funct. Ecol., 27, 934–949.Hoffmann, A., Griffin, P. & Dillon, S. (2015). A framework for
incorporating evolutionary genomics into biodiversity conservation and
management. Clim. Change Responses, 2, 1–23.Hoffmann, A.A., Meril€a, J. & Kristensen, T.N. (2016). Heritability and
evolvability of fitness and nonfitness traits: lessons from livestock.
Evolution, 70, 1770–1779.Huey, R.B., Kearney, M.R., Krockenberger, A., Holtum, J.A.M., Jess,
M. & Williams, S.E. (2012). Predicting organismal vulnerability to
climate warming: roles of behaviour, physiology and adaptation. Philos.
Trans. R. Soc. Lond. B Biol. Sci., 367, 1665–1679.Huntingford, C., Jones, P.D., Livina, V.N., Lenton, T.M. & Cox, P.M.
(2013). No increase in global temperature variability despite changing
regional patterns. Nature, 500, 327–330.Hutchinson, M., Kesteven, J. & Xu, T. (2014). ANUClimate 1.0, 0.01
degree, Australian Coverage, 1970-2012. Australian National
University, Canberra, Australia. Obtained from http://dap.nci.org.au,
made available by the Ecosystem Modelling and Scaling Infrastructure
(eMAST, http://www.emast.org.au) of the Terrestrial Ecosystem
Research Network (TERN, http://www.tern.org.au). Last accessed 8
December 2014.
IPBES (2016). Summary for policymakers of the methodological
assessment of scenarios and models of biodiversity and ecosystem
services by the Intergovernmental Science-Policy Platform on
Biodiversity and Ecosystem Services (eds. Ferrier, S., Ninan, K.N.,
Leadley, P., Alkemade, R., Acosta-Michlik, L., Akcakaya, H.R. Brotons,
L., Cheung, L., Christensen, V., Harhash, K.H., Kabubo-Mariara, J.,
Lundquist, C., Obersteiner, M., Pereira, H., Peterson, G., Pichs-Madruga,
R., Ravindranath, N., Rondinini, C., Wintle, B.), pp. 1–32. Secretariat of
the Intergovernmental Science-Policy Platform on Biodiversity and
Ecosystem Services, Bonn, Germany.
Jansen, M., Coors, A., Vanoverbeke, J., Schepens, M., De Voogt, P., De
Schamphelaere, K.A.C. et al. (2015). Experimental evolution reveals
high insecticide tolerance in Daphnia inhabiting farmland ponds. Evol.
Appl., 8, 442–453.Jaro�s�ık, V., Hon�ek, A., Magarey, R.D. & Skuhrovec, J. (2011). Developmental
database for phenology models: related insect and mite species have similar
thermal requirements. J. Econ. Entomol., 104, 1870–1876.Jones, D.A., Wang, W. & Fawcett, R. (2009). High-quality spatial climate
data-sets for Australia. Aust. Meteorol. Oceanogr. J., 58, 233–248.
© 2016 John Wiley & Sons Ltd/CNRS
Letter Incorporating evolutionary adaptation in SDMs 9

Kaspari, M., Clay, N.A., Lucas, J., Yanoviak, S.P. & Kay, A. (2015).
Thermal adaptation generates a diversity of thermal limits in a
rainforest ant community. Glob. Change Biol., 21, 1092–1102.Kearney, M. & Porter, W. (2009). Mechanistic niche modelling:
combining physiological and spatial data to predict species’ ranges.
Ecol. Lett., 12, 334–350.Kearney, M., Porter, W.P., Williams, C., Ritchie, S. & Hoffmann, A.A.
(2009). Integrating biophysical models and evolutionary theory to
predict climatic impacts on species’ ranges: the dengue mosquito Aedes
aegypti in Australia. Funct. Ecol., 23, 528–538.Kearney, M.R., Shamakhy, A., Tingley, R., Karoly, D.J., Hoffmann,
A.A., Briggs, P.R. et al. (2014). Microclimate modelling at macro scales:
a test of a general microclimate model integrated with gridded
continental scale soil and weather data. Methods Ecol. Evol., 5, 273–286.Kellermann, V., van Heerwaarden, B., Sgr�o, C.M. & Hoffmann, A.A.
(2009). Fundamental evolutionary limits in ecological traits drive
Drosophila species distributions. Science, 325, 1244–1246.Kellermann, V., Overgaard, J., Hoffmann, A.A., Flojgaard, C., Svenning,
J.C. & Loeschcke, V. (2012). Upper thermal limits of Drosophila are
linked to species distributions and strongly constrained
phylogenetically. Proc. Natl Acad. Sci., 109, 16228–16233.Kellett, M., Hoffmann, A.A. & McKechnie, S.W. (2005). Hardening
capacity in the Drosophila melanogaster species group is constrained by
basal thermotolerance. Funct. Ecol., 19, 853–858.Kingsolver, J.G., Woods, A.H., Buckley, L.B., Potter, K.A., MacLean,
H.J. & Higgins, J.K. (2011). Complex life cycles and the responses of
insects to climate change. Integr. Comp. Biol., 51, 719–732.Krehenwinkel, H., R€odder, D. & Tautz, D. (2015). Eco-genomic analysis
of the poleward range expansion of the wasp spider Argiope bruennichi
shows rapid adaptation and genomic admixture. Glob. Change Biol., 21,
4320–4332.Lavergne, S., Mouquet, N., Thuiller, W. & Ronce, O. (2010). Biodiversity
and climate change: integrating evolutionary and ecological responses
of species and communities. Annu. Rev. Ecol. Evol. Syst., 41, 321–350.Lobell, D.B., Hammer, G.L., Chenu, K., Zheng, B., McLean, G. &
Chapman, S.C. (2015). The shifting influence of drought and heat stress
for crops in northeast Australia. Glob. Change Biol., 21, 4115–4127.Lozier, J.D. & Mills, N.J. (2011). Predicting the potential invasive range of
light brown apple moth (Epiphyas postvittana) using biologically informed
and correlative species distribution models. Biol. Invasions, 13, 2409–2421.Maiorano, L., Cheddadi, R., Zimmermann, N.E., Pellissier, L.,
Petitpierre, B., Pottier, J. et al. (2013). Building the niche through time:
using 13,000 years of data to predict the effects of climate change on
three tree species in Europe. Glob. Ecol. Biogeogr., 22, 302–317.Mellard, J.P., de Mazancourt, C. & Loreau, M. (2015). Evolutionary
responses to environmental change: trophic interactions affect
adaptation and persistence. Proc. Biol. Sci., 282, 20141351.
Mitchell, K.A. & Hoffmann, A.A. (2010). Thermal ramping rate
influences evolutionary potential and species differences for upper
thermal limits in Drosophila. Funct. Ecol., 24, 694–700.Mokany, K., Prasad, S. & Westcott, D.A. (2014). Loss of frugivore seed
dispersal services under climate change. Nat. Commun., 5, 1–7.Mu~noz, N.J., Farrell, A.P., Heath, J.W. & Neff, B.D. (2014). Adaptive
potential of a Pacific salmon challenged by climate change. Nat. Clim.
Chang., 5, 163–166.Overgaard, J., Kearney, M.R. & Hoffmann, A.A. (2014). Sensitivity to
thermal extremes in Australian Drosophila implies similar impacts of
climate change on the distribution of widespread and tropical species.
Glob. Change Biol., 20, 1738–1750.Padfield, D., Yvon-Durocher, G., Buckling, A., Jennings, S. & Yvon-
Durocher, G. (2016). Rapid evolution of metabolic traits explains
thermal adaptation in phytoplankton. Ecol. Lett., 19, 133–142.Peterson, A.T., Sober�on, J. & S�anchez-Cordero, V. (1999). Conservatism
of ecological niches in evolutionary time. Science, 285, 1265–1267.Phillips, S.J., Anderson, R.P. & Schapire, R.E. (2006). Maximum entropy
modeling of species geographic distributions. Ecol. Model., 190, 231–259.
Prober, S.M., Byrne, M., McLean, E.H., Steane, D.A., Potts, B.M.,
Vaillancourt, R.E. et al. (2015). Climate-adjusted provenancing: a strategy
for climate-resilient ecological restoration. Front. Ecol. Evol., 3, 1–5.Quintero, I. & Wiens, J.J. (2013). Rates of projected climate change
dramatically exceed past rates of climatic niche evolution among
vertebrate species. Ecol. Lett., 16, 1095–1103.Rees, M. & Ellner, S.P. (2016). Evolving integral projection models:
evolutionary demography meets eco evolutionary dynamics. Methods
Ecol. Evol., 7, 157–170.Rezende, E.L., Casta~neda, L.E. & Santos, M. (2014). Tolerance
landscapes in thermal ecology. Funct. Ecol., 28, 799–809.Schiffers, K.H. & Travis, J.M.J. (2014). ALADYN – a spatially explicit,
allelic model for simulating adaptive dynamics. Ecography, 37, 1288–1291.Seebacher, F., White, C.R. & Franklin, C.E. (2015). Physiological
plasticity increases resilience of ectothermic animals to climate change.
Nat. Clim. Chang., 5, 61–66.Sgr�o, C.M., Lowe, A.J. & Hoffmann, A.A. (2011). Building evolutionary
resilience for conserving biodiversity under climate change. Evol. Appl.,
4, 326–337.Shearer, P.W., West, J.D., Walton, V.M., Brown, P.H., Svetec, N. &
Chiu, J.C. (2016). Seasonal cues induce phenotypic plasticity
of Drosophila suzukii to enhance winter survival. BMC Ecol., 16, 1–18.Sinclair, B.J., Williams, C.M. & Terblanche, J.S. (2012). Variation in
thermal performance among insect populations. Physiol. Biochem.
Zool., 85, 594–606.Skelly, D.K., Joseph, L.N. & Possingham, H.P. (2007). Evolutionary
responses to climate change. Conserv. Biol., 21, 1353–1355.Soberon, J. & Peterson, A. (2005). Interpretation of models of
fundamental ecological niches and species’ distributional areas.
Biodivers. Inf., 2, 1–10.Spencer-Johnston, W. & Heed, W.B. (1976). Dispersal of desert-adapted
Drosophila: the saguaro-breedingD. nigrospiracula.Am.Nat., 110, 629–651.Storlie, C.J., Phillips, B.L., VanDerWal, J.J. & Williams, S.E. (2013).
Improved spatial estimates of climate predict patchier species
distributions. Divers. Distrib., 19, 1106–1113.Taylor, R.A.J. (1978). The relationship between density and distance of
dispersing insects. Ecol. Entomol., 3, 63–70.Teng, J., Vaze, J., Chiew, F.H., Wang, B. & Perraud, J.M. (2012).
Estimating the relative uncertainties sourced from GCMs and
hydrological models in modeling climate change impact on runoff. J.
Hydrometeorol., 13, 122–139.Thomas, C.D., Cameron, A., Green, R.E., Bakkenes, M., Beaumont, L.J.,
Collingham, Y.C. et al. (2004). Extinction risk from climate change.
Nature, 427, 145–148.Thuiller, W., M€unkem€uller, T., Lavergne, S., Mouillot, D., Mouquet, N.,
Schiffers, K. et al. (2013). A road map for integrating eco-evolutionary
processes into biodiversity models. Ecol. Lett., 16, 94–105.Umina, P.A., Weeks, A.R., Kearney, M.R., McKechnie, S.W. & Hoffmann,
A.A. (2005). A rapid shift in a classic clinal pattern inDrosophila reflecting
climate change. Science (NewYork, N.Y.), 308, 691–693.VanDerWal, J., Shoo, L.P., Johnson, C.N. & Williams, S.E. (2009).
Abundance and the environmental niche: environmental suitability
estimated from niche models predicts the upper limit of local
abundance. Am. Nat., 174, 282–291.Wade, A.A., Hand, B.K., Kovach, R.P., Luikart, G., Whited, D.C. &
Muhlfeld, C.C. (2016). Accounting for adaptive capacity and
uncertainty in assessments of species’ climate-change vulnerability.
Conserv. Biol., (early view)
Wiens, J.A., Stralberg, D., Jongsomjit, D., Howell, C.A. & Snyder, M.A.
(2009). Niches, models, and climate change: assessing the assumptions
and uncertainties. Proc. Natl Acad. Sci., 106, 19729–19736.Willi, Y., Buskirk, V.J. & Hoffmann, A.A. (2006). Limits to the adaptive
potential of small populations. Annu. Rev. Ecol., 37, 433–458.Williams, S.E., Shoo, L.P., Isaac, J.L., Hoffmann, A.A. & Langham, G.
(2008). Towards an integrated framework for assessing the vulnerability
of species to climate change. PLoS Biol., 6, 2621–2626.
© 2016 John Wiley & Sons Ltd/CNRS
10 A. Bush et al. Letter

Williams, B.R., Heerwaarden, V.B., Dowling, D.K. & Sgr�o, C.M. (2012).
A multivariate test of evolutionary constraints for thermal tolerance in
Drosophila melanogaster. J. Evol. Biol., 25, 1415–1426.
SUPPORTING INFORMATION
Additional Supporting Information may be found online inthe supporting information tab for this article.
Editor, Tim CoulsonManuscript received 27 July 2016First decision made 1 September 2016Manuscript accepted 5 October 2016
© 2016 John Wiley & Sons Ltd/CNRS
Letter Incorporating evolutionary adaptation in SDMs 11