lethal turbidity niwa - auckland council · rowe, d.k., et. al. (2002). lethal turbidity levels for...
TRANSCRIPT

Lethal Turbidity Levels for Common Fish and Invertebrates in Auckland Streams June 2002 TP337
Auckland Regional Council
Technical Publication No. 337, 2002
ISSN 1175-205X"
ISBN -13 : 978-1-877416-78-1
ISBN -10 : 1877416-78-9
Printed on recycled paper

Lethal turbidity levels for common freshwater fish and invertebrates in Auckland streams
D. K. Rowe
A. M. Suren
M. Martin
J. P. Smith
B. Smith
E. Williams
Prepared for
Auckland Regional Council
Information contained within this report should not
be used without the prior consent of the client
NIWA Client Report: ARC02283
June 2002
National Institute of Water & Atmospheric Research Ltd
Gate 10, Silverdale Road, Hamilton
P O Box 11115, Hamilton, New Zealand
Phone +64-7-856 7026, Fax +64-7-856 0151 www.niwa.co.nz

Acknowledgements We would like to thank John Maxted (and his staff) for supplying the clay used for
testing, as well as for his guidance on invertebrate selection and important aspects of
the study’s design.
Recommended Citation:
Rowe, D.K., et. al. (2002). Lethal turbidity levels for common freshwater fish and
invertebrates in Auckland streams. Auckland Regional Council Technical
Publication Number 337. 37 p.

CONTENTS
1.1.1.1. Executive SummaryExecutive SummaryExecutive SummaryExecutive Summary 1111
2.2.2.2. IntroductionIntroductionIntroductionIntroduction 2222
3.3.3.3. Sediment CharacterisationSediment CharacterisationSediment CharacterisationSediment Characterisation 4444
4.4.4.4. Effects Of Turbidity On FishEffects Of Turbidity On FishEffects Of Turbidity On FishEffects Of Turbidity On Fish 6666
4.1 Fish selection, collection and acclimation 6
4.2 Experimental methods 6
4.3 Data analysis 9
4.4 Results 10
4.5 Discussion 19
5.5.5.5. Effects of Turbidity on InvEffects of Turbidity on InvEffects of Turbidity on InvEffects of Turbidity on Invertebratesertebratesertebratesertebrates 22222222
5.1 Choice of invertebrate species 22
5.2 Experimental methods 23
5.3 Results 26
5.4 Discussion 28
6666 ConclusionsConclusionsConclusionsConclusions 31313131
7777 RecommendationsRecommendationsRecommendationsRecommendations 32323232
8888 ReferencesReferencesReferencesReferences 33333333
Reviewed by: Approved for release by:
Mike Scarsbrook Jody Richardson

TP 337 - Lethal Turbidity Levels For Common Freshwater Fish and Invertebrates in Auckland Streams 2

TP 337 - Lethal Turbidity Levels For Common Freshwater Fish and Invertebrates in Auckland Streams 1
1. Executive Summary � We examined the effects of acute (24 h) exposure to high turbidity levels on the
survival of 6 species of aquatic invertebrate and 4 species of fish commonly
encountered in Auckland region streams. These species were likely to be more
sensitive to increases in turbidity than others. The invertebrates tested included the
larvae of 2 caddisflies, 1 damselfly, 2 mayflies, and adult freshwater crayfish (koura).
The fish tested were smelt, inanga, redfinned bully and banded kokopu.
� Individuals were placed in experimental cages and exposed to turbid waters ranging
from 500 NTU up to 20,000 NTU. Turbid waters were all created from Auckland
clays. The percent survival of animals was determined at each turbidity level and
compared with that of control animals held in clear, conditioned tap water.
� There was no significant difference between the percentage survival of any of the
aquatic insect larvae, crayfish, banded kokopu and redfinned bullies and their
respective control groups at turbidities up to c. 20,000 NTU.
� As both inanga and smelt were affected by turbidities of less than 20,000 NTU, the
median lethal turbidity level (LC50) over 24 hours was determined for both these
species. For inanga it was 20,235 NTU, but for smelt it was 3,050 NTU.
� The time (in hours) for 50% survival (LT50) was also determined for both these
species for a range of turbidity levels around the LC50. The ‘best fit’ curve to these
data was produced and predicts the time in hours for 50% survival at any turbidity
level between 15,000-30,000 NTU for inanga, and 2,000-6,000 NTU for smelt.
� We also exposed the common mayfly (Deleatidium) and smelt to 4 h of 1000 NTU
every 2-3 days over a period of 2-3 weeks. These animals were kept in clear tap
water between exposures to turbid water, and were allowed to feed between
exposures. Survival was compared with that of control groups maintained in clear
water. There was no significant difference in the percentage survival of the
mayflies, or of the smelt between the control and turbidity exposed groups.
� The supposedly ‘sensitive’ invertebrate and fish taxa (excluding smelt) are tolerant
of very high levels of turbidity (over 24 hours), and even repeated exposures to
1000 NTU had no adverse effects on their survival. Their absence from urbanised
catchments and their relative scarcity in turbid rivers and streams is not caused by
turbidity per se, but most likely reflects a combination of other environmental
changes associated with high loadings of suspended solids. These will need to be
determined in order to develop effective controls for sediment loadings in streams.
� In the meantime, the common smelt is clearly the most sensitive taxa to high
turbidity levels in Auckland streams and the results from these tests provide
guidelines for both its protection, as well as for predicting the effects of high
turbidity events on its survival.
TP 337 - Lethal Turbidity Levels For Common Freshwater Fish and Invertebrates in Auckland Streams 2
2. Introduction Urban development generally involves land use changes that remove topsoils and increase
the exposure of underlying clays to erosion by rainfall and runoff. Where control methods
such as protective overlays, channelisation of surface water into settling ponds, or filtering
measures are lacking, or are inadequate, large amounts of suspended solids can enter
receiving waters. As a consequence, streams below some urban developments can, at
times, experience very high levels of suspended solids for 1 –2 days following high rainfall
events (pers. comm., J. Maxted).
Suspended solids produce two main ecological effects in streams that can affect fish and
invertebrate communities; (a) increased turbidity of the stream water, and (b) increased
siltation of stream beds. Knowledge of the main effects of suspended solids on the biota is
needed to manage sediment concentrations in streams. Consequently a number of studies
have recently addressed the effects of sublethal turbidity levels on native fish in New Zealand
streams to identify the levels affecting them (Boubee et al. 1997; Rowe and Dean 1998;
Rowe et al. 2000; Richardson et al. 2001; Rowe et al. 2002). In general, most species were
little affected by sublethal turbidities. However migrant banded kokopu showed adverse
responses to turbidities over 25 NTU (Nephelometric Turbidity Units). Their feeding was
reduced, their avoidance reaction increased, and upstream migration rates in a small natural
stream were all reduced. Field studies in New Zealand rivers indicated that turbidities over
this level for more than 10% of the time during the whitebait migration season (August-
December) could be expected to reduce the upstream migration of banded kokopu, resulting
in reduced recruitment and a decline in adult populations. These studies have produced a
better understanding of the effects of sublethal turbidities on native fish, but lethal turbidity
levels were not determined.
High turbidity levels (i.e., > 100,000 NTU) will kill fish (Newcombe and MacDonald 1991), but
such high levels rarely occur in nature or, where they do, rarely last long enough to pose a
threat. However, there is wide variation in the lethal level among fish species (loc cit.), and
the turbidity levels recorded in some Auckland streams after heavy rain can be relatively high
(>10,000 NTU). Under such conditions, native fish could be killed. Accordingly, the ARC
requested NIWA to determine the lethal turbidity levels that affect the common native fish in
Auckland streams.
Even less is known about the tolerance of New Zealand freshwater invertebrates to high
turbidity levels. There have, however, been a number of review studies documenting the
effects of increased turbidity in streams on invertebrates (e.g., Lloyd et al. 1987; Newcombe
and MacDonald 1991; Ryan 1991; Waters 1995; Wood and Armitage 1997; Death 2000). In
general, these reviews concluded that high turbidity can reduce invertebrate abundance and
diversity by: 1) smothering and abrading; 2) reducing their periphyton food supply or quality;
and 3) reducing available interstitial habitat. Moreover, high turbidity also often results in
sediment deposition, altering substrate composition and changing substrate suitability for
TP 337 - Lethal Turbidity Levels For Common Freshwater Fish and Invertebrates in Auckland Streams 3
some taxa (Wood and Armitage 1997). Sediment deposition creates conditions that are
generally unsuitable for most New Zealand aquatic insects (Jowett et al. 1991; Death 2000;
Harding et al. 2000), although burrowing taxa such as Icthybotus hudsoni and early instars of
other taxa may be associated with fine substrates in depositional areas. Many of the streams
in Auckland are relatively steep, and short, so the effects of sediment deposition may be
secondary to any adverse acute effects of high turbidity events that can occur in these
streams. However, as little is known about the effects of high turbidity on common
invertebrates, little guidance can be given as to what an acceptable upper level of turbidity is
to minimise loss of sensitive taxa.
We therefore investigated the short-term (<24 hour) effects of different turbidities on a range
of different fish and invertebrate species to see whether they could be adversely affected.
The absolute maximum turbidity level that was expected in ARC streams was less than
20,000 NTU, so this represented the highest level examined.
Our specific aims were to firstly determine which of the more common species of fish and
invertebrate were affected by turbidity levels of 20,000 NTU, secondly to determine the LC50
or turbidity level resulting in 50% survival over 24 hours for these species, and thirdly to
determine the exposure times resulting in 50% survival (LT50) for a range of turbidity levels.
These data are needed by the ARC to estimate or predict the mortalities of the selected
species given both the level and duration of a high turbidity event in an Auckland stream.
The survival rates of fish and invertebrates can be expected to vary with the frequency of
exposure to relatively high turbidity, so we also determined whether repeated exposures
(every 2-3 days) to a turbidity level of 1000 NTU for 4 hours per day would have any effect on
the survival rates of the most sensitive fish and invertebrate. A 2-3 day periodicity is typical
for rainfall events in the Auckland region, and the 4-hour duration was used to emulate the
natural rise and fall of turbidity levels in streams following heavy rainfall events.
In this report, we present the results of the experiments to determine the effects of high
turbidity levels on the common native fish and invertebrate species found in Auckland
streams.
TP 337 - Lethal Turbidity Levels For Common Freshwater Fish and Invertebrates in Auckland Streams 4
3. Sediment Characterisation The ARC measures turbidity in streams in terms of NTU (Nephelometric Turbidity Units). NTU
is a machine-specific measure, and depends on the type of light scattering sensor used. As a
consequence, measures made by one machine can vary from those made by another. NTU
levels are correlated with the amount of suspended sediment present but this can vary
depending on variations in the characteristics of the sediment particles present (Lloyd et al.
1987). The mass concentration of suspended solids present in water (i.e., g m-3) provides a
more objective measure of the sediment present, but it is more difficult and time consuming
to measure. Consequently, NTU is the generally preferred measure of suspended sediment
levels, especially as data loggers are available that can monitor NTU levels continuously.
Moreover, the biases involved in such turbidity measurements with different machines will
be insignificant in terms of the levels resulting in fish or invertebrate mortalities. Therefore, in
order to provide data relevant to the monitoring of turbidity in streams by the ARC, we
measured turbidity levels in the experiments with a HACH 2100P portable turbidimeter. This
was calibrated before use with formazin standards.
Sediment of a type typically found in many Auckland streams was obtained by the ARC from
a sediment retention pond adjacent to the Oteha Stream (NZMS 260, Map R10, Grid Ref. 642
950). It was sent to NIWA Hamilton, where it was mixed with natural tap water and aerated
for 3 days to allow coarse particles to settle. Further sediment was added until the
supernatant had a turbidity of approximately 20,000 NTU.
The type of particles creating turbid conditions in water can vary greatly in size, shape and
density and such factors may be important in determining the effects of the turbidity on the
biota. Therefore, a subsample of the suspended sediment solution was analysed by a Galai
CIS-100 particle analyser to determine the physical characteristics of the suspended particles.
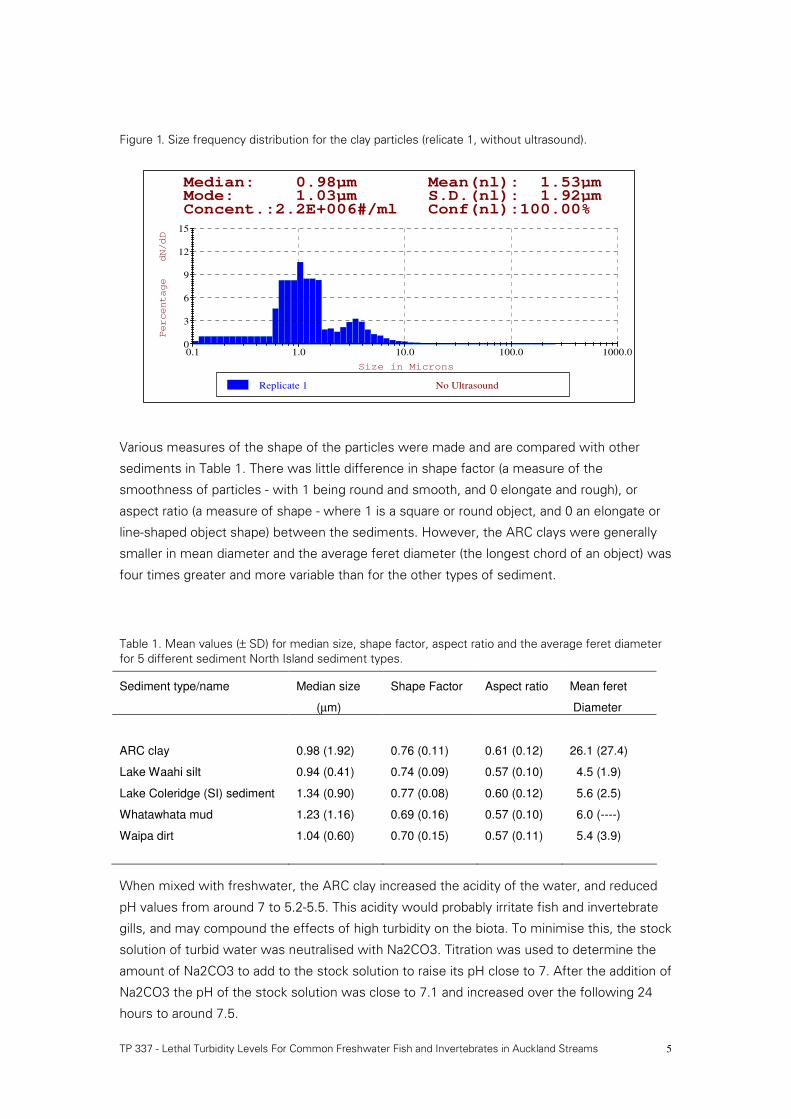
Two modes were apparent in the particle size distribution; one at 1 micron and a second at
3.5 microns (Fig. 1). Ultrasound treatment failed to influence this size structure indicating that
the larger particles were not aggregations of the smaller ones. This bimodal distribution of
diameters is characteristic of clays that comprise mainly plate–shaped particles with two
main axes.
TP 337 - Lethal Turbidity Levels For Common Freshwater Fish and Invertebrates in Auckland Streams 5
Figure 1. Size frequency distribution for the clay particles (relicate 1, without ultrasound).
Various measures of the shape of the particles were made and are compared with other
sediments in Table 1. There was little difference in shape factor (a measure of the
smoothness of particles - with 1 being round and smooth, and 0 elongate and rough), or
aspect ratio (a measure of shape - where 1 is a square or round object, and 0 an elongate or
line-shaped object shape) between the sediments. However, the ARC clays were generally
smaller in mean diameter and the average feret diameter (the longest chord of an object) was
four times greater and more variable than for the other types of sediment.
Table 1. Mean values (± SD) for median size, shape factor, aspect ratio and the average feret diameter
for 5 different sediment North Island sediment types.
Sediment type/name Median size
(µm)
Shape Factor Aspect ratio Mean feret
Diameter
ARC clay 0.98 (1.92) 0.76 (0.11) 0.61 (0.12) 26.1 (27.4)
Lake Waahi silt 0.94 (0.41) 0.74 (0.09) 0.57 (0.10) 4.5 (1.9)
Lake Coleridge (SI) sediment 1.34 (0.90) 0.77 (0.08) 0.60 (0.12) 5.6 (2.5)
Whatawhata mud 1.23 (1.16) 0.69 (0.16) 0.57 (0.10) 6.0 (----)
Waipa dirt 1.04 (0.60) 0.70 (0.15) 0.57 (0.11) 5.4 (3.9)
When mixed with freshwater, the ARC clay increased the acidity of the water, and reduced
pH values from around 7 to 5.2-5.5. This acidity would probably irritate fish and invertebrate
gills, and may compound the effects of high turbidity on the biota. To minimise this, the stock
solution of turbid water was neutralised with Na2CO3. Titration was used to determine the
amount of Na2CO3 to add to the stock solution to raise its pH close to 7. After the addition of
Na2CO3 the pH of the stock solution was close to 7.1 and increased over the following 24
hours to around 7.5.
0.1 1.0 10.0 100.0 1000.0
Size in Microns
0
3
6
9
12
15
Percentage dN/dD
Median: 0.98µm Mean(nl): 1.53µmMode: 1.03µm S.D.(nl): 1.92µmConcent.:2.2E+006#/ml Conf(nl):100.00%
Replicate 1 No Ultrasound
TP 337 - Lethal Turbidity Levels For Common Freshwater Fish and Invertebrates in Auckland Streams 6
4. Effects Of Turbidity On Fish
4.1 Fish selection, collection and acclimation
The most common species of fish found in small Auckland streams are listed in Table 2. In
general, the shortfinned eel and common bullies are more prevalent in turbid than in clear
North Island, New Zealand rivers (Rowe et al. 2000) so were expected to be less sensitive to
turbid conditions than other species. In contrast, banded kokopu, redfin bullies, smelt and
inanga were all less common in turbid than in clear rivers so are likely to be more sensitive to
the effects of turbid conditions (Rowe et al. 2000). Accordingly, these more sensitive species
were selected for testing.
Table 2 Common native fish found in Auckland urban streams (occurrence data from Allibone et al.
2001)
Species Common name Site occurrence (%) Rank abundance
Anguilla australis Shortfin eel 73 1
Anguilla dieffenbachii Longfin eel 42 2
Gobiomorphus cotidianus Common bully 25 3
Galaxias maculatus Inanga 23 4=
Galaxias fasciatus Banded kokopu 23 4=
Gobiomorphus huttoni Redfin bully 9 5
Retropinna retropinna Smelt 2 6
All test fish were obtained from the wild. Juvenile banded kokopu were obtained from Hayes
Stream (which drains into the Manukau Harbour), and inanga and smelt from the lower
Waikato River. Redfin bullies are not abundant in Auckland streams and so were sourced
from an east coast stream near Tauranga (NZMS U14 816 849). All fish were transported to
the laboratory and placed in large (100 litre) tanks to which we added 10% salt water to
minimise mortalities from the stress of capture and disease. The fish were acclimated to
laboratory conditions for several days in these tanks at a constant temperature of 16°C, and a
12L:12D photoperiod. They were fed on Daphnia every 1-2 days before the experiments
began.
4.2 Experimental methods
Exposure of fish to high turbidities requires large quantities of silt to be held in suspension for
the duration of the test period (24 hours), and this requires continual mixing of the silt and
water. As turbidity levels of around 20,000 NTU were required, and could not be maintained
TP 337 - Lethal Turbidity Levels For Common Freshwater Fish and Invertebrates in Auckland Streams 7
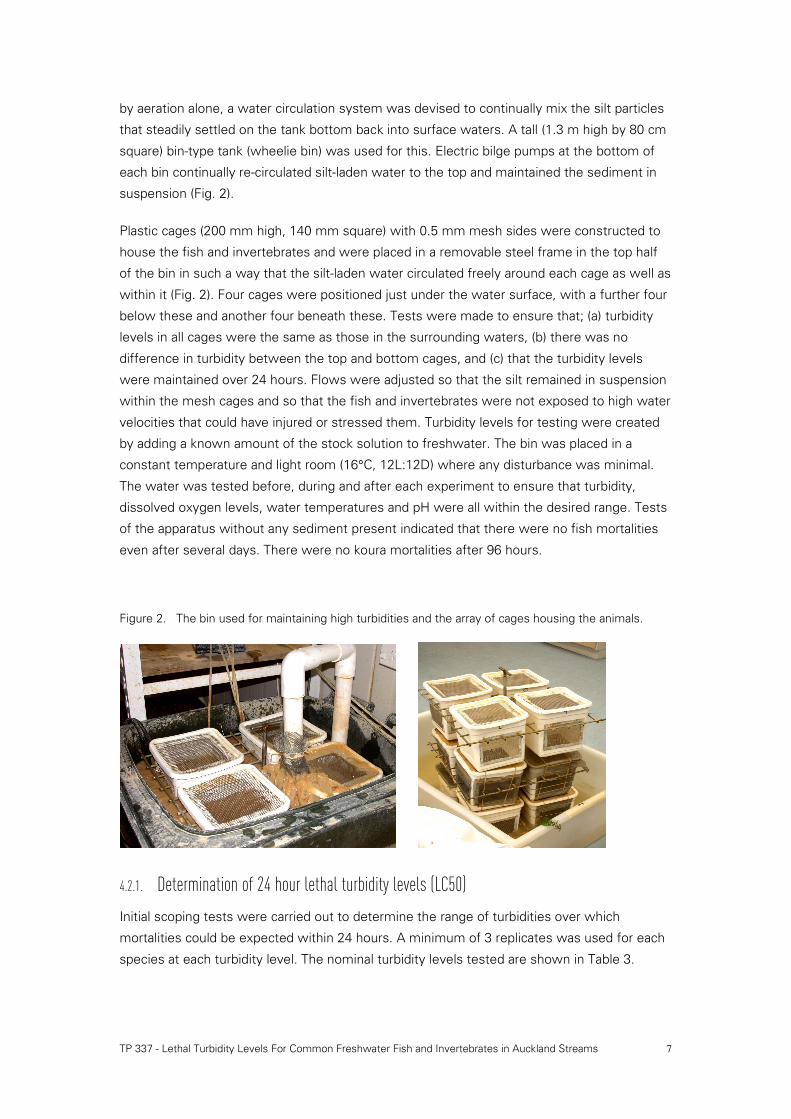
by aeration alone, a water circulation system was devised to continually mix the silt particles
that steadily settled on the tank bottom back into surface waters. A tall (1.3 m high by 80 cm
square) bin-type tank (wheelie bin) was used for this. Electric bilge pumps at the bottom of
each bin continually re-circulated silt-laden water to the top and maintained the sediment in
suspension (Fig. 2).
Plastic cages (200 mm high, 140 mm square) with 0.5 mm mesh sides were constructed to
house the fish and invertebrates and were placed in a removable steel frame in the top half
of the bin in such a way that the silt-laden water circulated freely around each cage as well as
within it (Fig. 2). Four cages were positioned just under the water surface, with a further four
below these and another four beneath these. Tests were made to ensure that; (a) turbidity
levels in all cages were the same as those in the surrounding waters, (b) there was no
difference in turbidity between the top and bottom cages, and (c) that the turbidity levels
were maintained over 24 hours. Flows were adjusted so that the silt remained in suspension
within the mesh cages and so that the fish and invertebrates were not exposed to high water
velocities that could have injured or stressed them. Turbidity levels for testing were created
by adding a known amount of the stock solution to freshwater. The bin was placed in a
constant temperature and light room (16°C, 12L:12D) where any disturbance was minimal.
The water was tested before, during and after each experiment to ensure that turbidity,
dissolved oxygen levels, water temperatures and pH were all within the desired range. Tests
of the apparatus without any sediment present indicated that there were no fish mortalities
even after several days. There were no koura mortalities after 96 hours.
Figure 2. The bin used for maintaining high turbidities and the array of cages housing the animals.
4.2.1. Determination of 24 hour lethal turbidity levels (LC50)
Initial scoping tests were carried out to determine the range of turbidities over which
mortalities could be expected within 24 hours. A minimum of 3 replicates was used for each
species at each turbidity level. The nominal turbidity levels tested are shown in Table 3.

TP 337 - Lethal Turbidity Levels For Common Freshwater Fish and Invertebrates in Auckland Streams 8
As some smelt and bullies died at turbidities over 5,000 and 10,000 NTU respectively, the silt
was removed from a 20,000 NTU suspension by filtration and the elutriate tested to see
whether any dissolved substances from the sediment could be affecting the fish and
compounding the effects of turbidity. Fifty inanga were placed in a tank containing the
filtered elutriate and kept overnight for 24 hours. Their survival rate was compared with that
for a further fifty inanga in a control tank of conditioned tap water. No mortalities occurred in
either tank.
Table 3. Nominal turbidity levels tested to determine the range within which some survival occurred
within 24 hours for each species.
Turbidity (NTU) Smelt Inanga Redfin bully Banded kokopu
500 ∗∗∗∗
1000 ∗∗∗∗
3000 ∗∗∗∗
5000 ∗∗∗∗ ∗∗∗∗ ∗∗∗∗ ∗∗∗∗
7000 ∗∗∗∗ ∗∗∗∗ ∗∗∗∗
10000 ∗∗∗∗ ∗∗∗∗
15000 ∗∗∗∗ ∗∗∗∗ ∗∗∗∗
20000 ∗∗∗∗ ∗∗∗∗ ∗∗∗∗
30000 ∗∗∗∗ ∗∗∗∗ ∗∗∗∗
40000 ∗∗∗∗ ∗∗∗∗
As both smelt and inanga were affected by turbidities less than 20,000 NTU, further
experiments were conducted on both these species to determine their 24 hour median LC50
value (i.e., the turbidity level which results in 50% survival after 24 hours).
In a further series of tests, the survival rate over 24 hours was determined for smelt at
nominal turbidities of 500, 1000, 2000, 3000, 5000, and 10000 NTU. For inanga, the nominal
turbidity levels tested were 4000, 7000, 8000, 10000, 15000, 20000 and 30000 NTU. Sub-
samples of fish for each species were set aside to determine their mean size. Three
replicates of 7 fish were then tested at each turbidity level. The fish were placed in separate
cages that were inserted into the test bins containing the turbid water. Turbidity, pH,
temperature and oxygen level were measured at the start and end of each 24 hour test. Each
tank was inspected at intervals of 1, 3, 12, and 21 hours after the start of each test, and any
dead fish removed and measured. The number of fish remaining alive after 24 hours was
then determined.
4.2.2. Determination of lethal times (LT50) for 50% survival
In addition, we determined the LT50 (i.e., the time at which 50% survival occurs) for a range
of turbidity levels around the LC50 level for both smelt and inanga. This involved determining
TP 337 - Lethal Turbidity Levels For Common Freshwater Fish and Invertebrates in Auckland Streams 9
the cumulative survival rate of fish every 3 hours over a 24 hour period. Three (and
occasionally 4) replicates of 7 fish were used at each turbidity level including the control. Fish
were placed in 42 litre white PVC tanks in the constant temperature and fixed photoperiod
room and acclimated for 24 hours. The turbidity of each tank (apart from the control) was
then increased to produce nominal turbidities, for smelt, of 10 (control), 1000, 2000, 2500,
3000, 4000, 5000 and 6000 and 7000 NTU. Inanga were tested at nominal turbidity levels of
0 (control), 10000, 12000, 14000, 16000 and 18000 NTU. Aeration was used in these tanks to
ensure that the sediment stayed in suspension and that the water was well oxygenated.
Turbidity levels as well as pH, dissolved oxygen and temperature were recorded at the start
and end of each test as well as after 12 and 21 hours. All tanks were inspected every 3 hours
and any dead fish removed and measured.
4.2.3. Effects of repeat exposures to turbidity
A repeat exposure experiment was carried out on smelt, as this species proved to be the
most sensitive to turbidity. Five smelt were placed in each of 6 PVC tanks (50 cm x 40 cm x
30 cm high) and the fish in 3 of these tanks exposed to turbid water (nominal level of 1000
NTU) for 4 hours every 2-3 days for a period of three weeks (10 exposures). Fish in the
remaining 3 tanks served as controls. After each exposure, the water was changed in both
control and experimental tanks and the fish were fed on whiteworms. Turbidity level, oxygen
saturation, water temperature and pH were recorded in all tanks at the start and finish of
each test. Dead fish were recorded in all tanks (control and experimental) after each
exposure to high turbidity, and the following morning. The cumulative survival resulting from
repeated exposure to a turbidity of 1000 NTU was then determined.
Summary of critical limits determined
LC50 Median Lethal Concentration of suspended clay in water (expressed
as NTU turbidity) resulting in 50% survival of fish (smelt or inanga)
within 24 hours
LT50 Lethal Time (h) at which a 50% survival of fish (smelt or inanga)
occurs for a given turbidity level.
CSFE1000 Cumulative Survival rate (%) of smelt from Frequent Exposure (i.e.,
once every 2 days for 4 hours per day over 3 weeks) to a turbidity of
1000 NTU.
4.3 Data analysis
The mean size of fish tested was determined for each of the tests and differences
determined by ANOVA. We also compared the mean sizes of fish that died with that for the
fish that lived to determine whether survival from high turbidity was influenced by fish size.
TP 337 - Lethal Turbidity Levels For Common Freshwater Fish and Invertebrates in Auckland Streams 10
The measured turbidity levels at the start and end of each trial were averaged to produce a
mean NTU level. This was then compared with the nominal level and was used in all further
analyses. We used ANCOVA (on the log x+1 mean survival rates) of fish to determine
whether survival rates varied with turbidity levels. Where a significant relationship occurred,
the median lethal turbidity levels over a period of 24 hours (LC50) was determined using the
ToxCalcTN (version 5.0) analysis package produced by Tidepool Scientific Software (1994).
This uses the USEPA approved statistical methods for analysis of toxicity data. The overall 24
hour survival rates from the LT50 tests on smelt and inanga (see below) were added to this
data set to further strengthen it. As the data were non-normal, hypothesis testing was carried
out using the non-parametric, Bonferroni adjusted t-test, and the median lethal values (LC50)
were calculated using the ‘trimmed’ Spearman-Kaber method.
The 3 hourly cumulative survival rates were plotted for each of the LT50 tests and the time at
which 50% survival occurred was determined for each of the mean turbidity levels from each
test and plotted against mean turbidity level. The LT50 curve was then determined by the
line which produced the ‘best fit’ (i.e., highest R2 value for an exponential curve) to these
data.
The mean survival rates for smelt exposed to 1000 NTU for 4 hours at 2-3 day intervals over
a period of 3 weeks were calculated and compared with that for the control fish using one-
way ANOVA.
4.4 Results
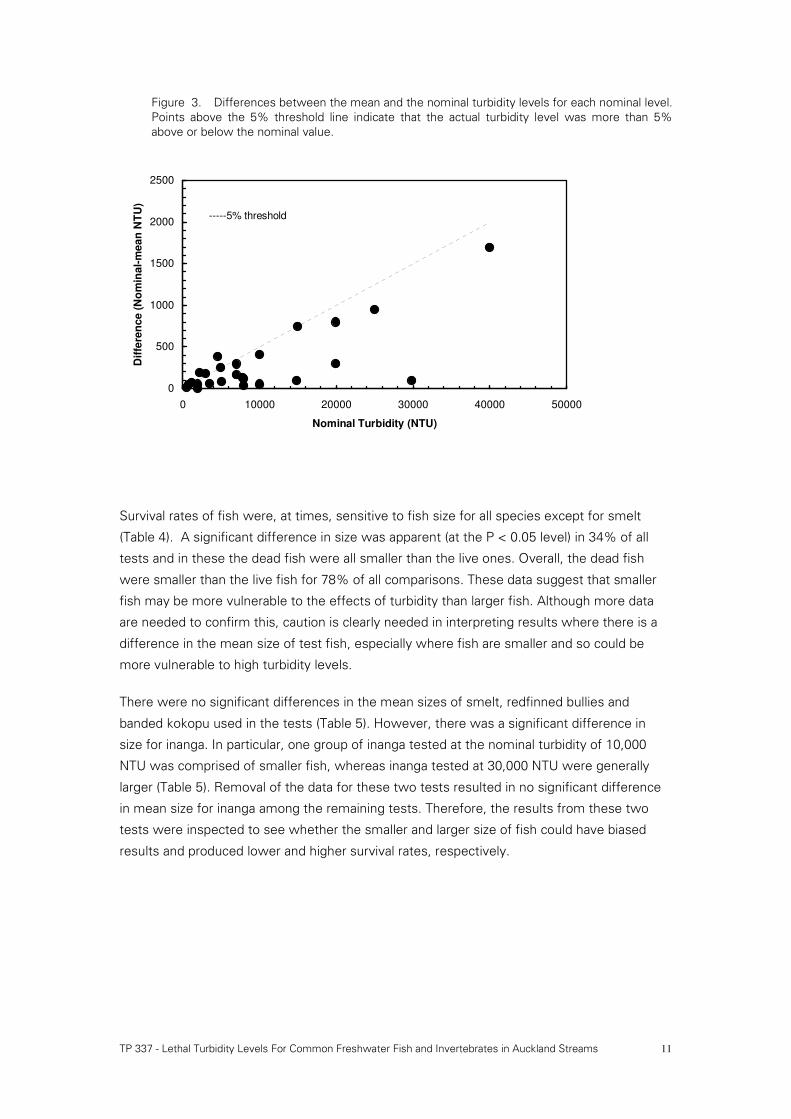
Mean turbidity levels for the tests were generally within 5% of the nominal values
irrespective of the level used (Fig. 3). However, as the mean of the measured values
provides a more accurate measure of the turbid conditions in each tank, this was used in
further data analysis.
TP 337 - Lethal Turbidity Levels For Common Freshwater Fish and Invertebrates in Auckland Streams 11
Figure 3. Differences between the mean and the nominal turbidity levels for each nominal level.
Points above the 5% threshold line indicate that the actual turbidity level was more than 5%
above or below the nominal value.
0
500
1000
1500
2000
2500
0 10000 20000 30000 40000 50000
Nominal Turbidity (NTU)
Dif
fere
nc
e (
No
min
al-
me
an
NT
U)
-----5% threshold
Survival rates of fish were, at times, sensitive to fish size for all species except for smelt
(Table 4). A significant difference in size was apparent (at the P < 0.05 level) in 34% of all
tests and in these the dead fish were all smaller than the live ones. Overall, the dead fish
were smaller than the live fish for 78% of all comparisons. These data suggest that smaller
fish may be more vulnerable to the effects of turbidity than larger fish. Although more data
are needed to confirm this, caution is clearly needed in interpreting results where there is a
difference in the mean size of test fish, especially where fish are smaller and so could be
more vulnerable to high turbidity levels.
There were no significant differences in the mean sizes of smelt, redfinned bullies and
banded kokopu used in the tests (Table 5). However, there was a significant difference in
size for inanga. In particular, one group of inanga tested at the nominal turbidity of 10,000
NTU was comprised of smaller fish, whereas inanga tested at 30,000 NTU were generally
larger (Table 5). Removal of the data for these two tests resulted in no significant difference
in mean size for inanga among the remaining tests. Therefore, the results from these two
tests were inspected to see whether the smaller and larger size of fish could have biased
results and produced lower and higher survival rates, respectively.

TP 337 - Lethal Turbidity Levels For Common Freshwater Fish and Invertebrates in Auckland Streams 12
Table 4. Effects of fish size on mortalities caused by turbid conditions in tanks (* significant at P ≤
0.05, ** significant at P ≤ 0.01)
Species (NTU level) Mean length (mm) ANOVA
N Alive Dead P
Smelt (10) 50 63.1 61.3 0.507
Smelt (500) 7 56.7 61.8 0.214
Inanga (7,000) 21 55.5 48.5 0.010 **
Inanga (7,000) 21 49.3 43.0 0.196
Inanga (8,000) 7 59.7 52.4 0.072
Inanga (30,000) 7 52.0 59.3 0.483
Redfin bully (7,000) 21 42.3 31.3 0.011 **
Redfin bully (30,000) 7 54.2 47.0 0.454
Banded kokopu (15,000) 7 43.2 39.5 0.032 *
4.4.1 Turbidity levels resulting in 50% survival over 24 hours (LC50)
The mean 24 h survival rates for both redfin bully and banded kokopu were generally close to
100% irrespective of turbidity levels up to approximately 40,000 NTU (Fig. 4). An exception
was provided by the low survival of redfin bully at 14,250 NTU (Fig. 4). There was no obvious
reason why survival was low at this level and not at higher turbidities. It is possible that the
fish for this particular test were stressed in some way.
Although mean survival rates for smelt and inanga were 100% at turbidities of less than
1,000 NTU they declined with increasing turbidity and were 0% at turbidities of 15,000 and
30,000 NTU, respectively (Fig. 5). High turbidity levels (up to 40,000 NTU) therefore affected
both smelt and inanga, but not banded kokopu and redfin bullies.
TP 337 - Lethal Turbidity Levels For Common Freshwater Fish and Invertebrates in Auckland Streams 13
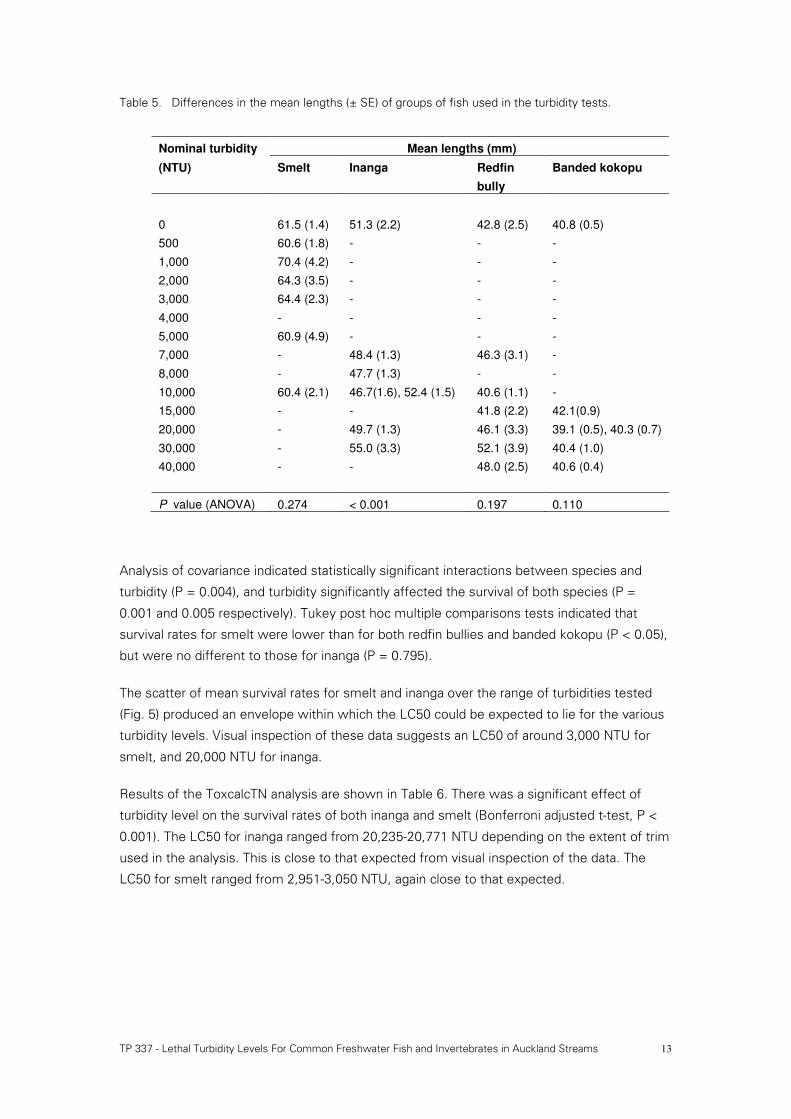
Table 5. Differences in the mean lengths (± SE) of groups of fish used in the turbidity tests.
Nominal turbidity Mean lengths (mm)
(NTU) Smelt Inanga Redfin
bully
Banded kokopu
0 61.5 (1.4) 51.3 (2.2) 42.8 (2.5) 40.8 (0.5)
500 60.6 (1.8) - - -
1,000 70.4 (4.2) - - -
2,000 64.3 (3.5) - - -
3,000 64.4 (2.3) - - -
4,000 - - - -
5,000 60.9 (4.9) - - -
7,000 - 48.4 (1.3) 46.3 (3.1) -
8,000 - 47.7 (1.3) - -
10,000 60.4 (2.1) 46.7(1.6), 52.4 (1.5) 40.6 (1.1) -
15,000 - - 41.8 (2.2) 42.1(0.9)
20,000 - 49.7 (1.3) 46.1 (3.3) 39.1 (0.5), 40.3 (0.7)
30,000 - 55.0 (3.3) 52.1 (3.9) 40.4 (1.0)
40,000 - - 48.0 (2.5) 40.6 (0.4)
P value (ANOVA) 0.274 < 0.001 0.197 0.110
Analysis of covariance indicated statistically significant interactions between species and
turbidity (P = 0.004), and turbidity significantly affected the survival of both species (P =
0.001 and 0.005 respectively). Tukey post hoc multiple comparisons tests indicated that
survival rates for smelt were lower than for both redfin bullies and banded kokopu (P < 0.05),
but were no different to those for inanga (P = 0.795).
The scatter of mean survival rates for smelt and inanga over the range of turbidities tested
(Fig. 5) produced an envelope within which the LC50 could be expected to lie for the various
turbidity levels. Visual inspection of these data suggests an LC50 of around 3,000 NTU for
smelt, and 20,000 NTU for inanga.
Results of the ToxcalcTN analysis are shown in Table 6. There was a significant effect of
turbidity level on the survival rates of both inanga and smelt (Bonferroni adjusted t-test, P <
0.001). The LC50 for inanga ranged from 20,235-20,771 NTU depending on the extent of trim
used in the analysis. This is close to that expected from visual inspection of the data. The
LC50 for smelt ranged from 2,951-3,050 NTU, again close to that expected.
TP 337 - Lethal Turbidity Levels For Common Freshwater Fish and Invertebrates in Auckland Streams 14
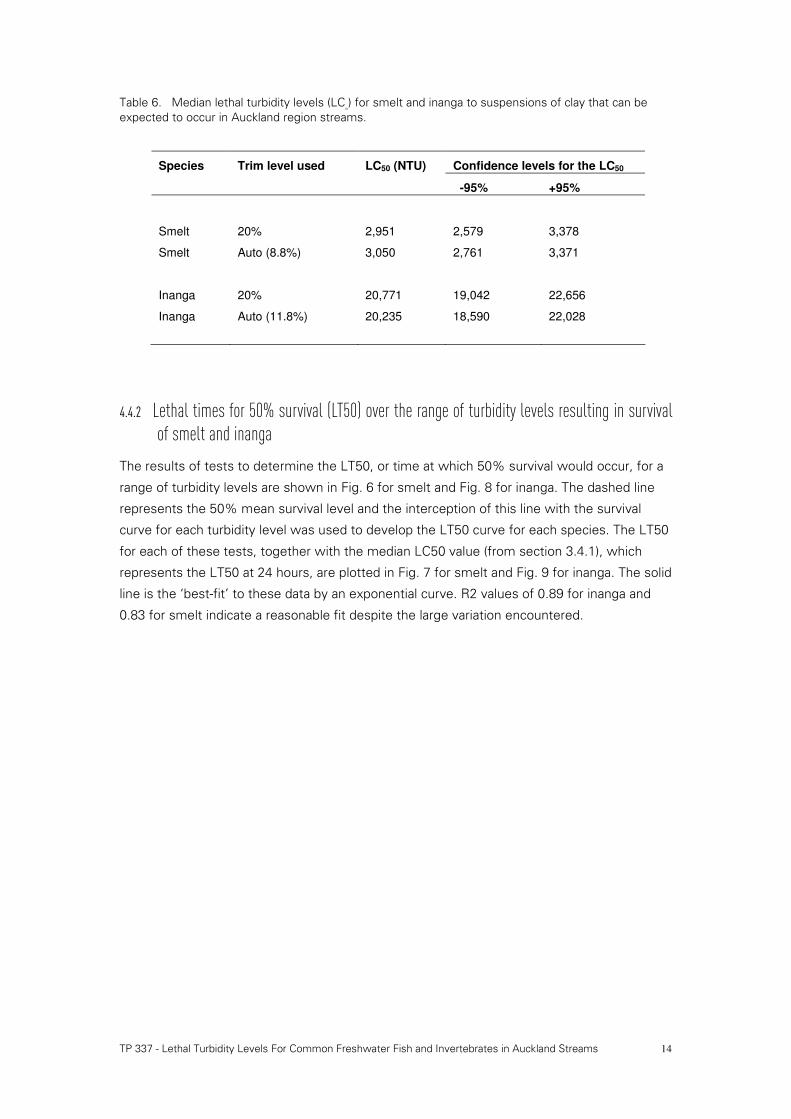
Table 6. Median lethal turbidity levels (LC50
) for smelt and inanga to suspensions of clay that can be
expected to occur in Auckland region streams.
Species Trim level used LC50 (NTU) Confidence levels for the LC50
-95% +95%
Smelt 20% 2,951 2,579 3,378
Smelt Auto (8.8%) 3,050 2,761 3,371
Inanga 20% 20,771 19,042 22,656
Inanga Auto (11.8%) 20,235 18,590 22,028
4.4.2 Lethal times for 50% survival (LT50) over the range of turbidity levels resulting in survival of smelt and inanga
The results of tests to determine the LT50, or time at which 50% survival would occur, for a
range of turbidity levels are shown in Fig. 6 for smelt and Fig. 8 for inanga. The dashed line
represents the 50% mean survival level and the interception of this line with the survival
curve for each turbidity level was used to develop the LT50 curve for each species. The LT50
for each of these tests, together with the median LC50 value (from section 3.4.1), which
represents the LT50 at 24 hours, are plotted in Fig. 7 for smelt and Fig. 9 for inanga. The solid
line is the ‘best-fit’ to these data by an exponential curve. R2 values of 0.89 for inanga and
0.83 for smelt indicate a reasonable fit despite the large variation encountered.

TP 337 - Lethal Turbidity Levels For Common Freshwater Fish and Invertebrates in Auckland Streams 15
Figure 4. Mean survival rates over 24 h for redfin bully and juvenile banded kokopu at turbidity levels
ranging up to c. 40,000 NTU. Error bars indicate one standard error. Means are for 3 replicates, except
for banded kokopu at 20,300 NTU (9 replicates), and for redfin bullies at 6835 and 10410 NTU (6
replicates each).
Redfin bully
0
0.2
0.4
0.6
0.8
1
10
6835
1041
0
1425
0
2030
0
2595
0
3830
0
Turbidity (NTU)
Mean s
urv
ival ra
te
Banded kokopu (juv)
0
0.2
0.4
0.6
0.8
1
10
6475
14250
2030
0
25950
38300
Turbidity (NTU)
Me
an
su
rviv
al ra
te

TP 337 - Lethal Turbidity Levels For Common Freshwater Fish and Invertebrates in Auckland Streams 16
Figure 5. Mean survival rates (± 1 SE) over 24 h for smelt and inanga at turbidity levels ranging up to c.
15,000 and 30,000 NTU, respectively. Data from the LT50
tests were combined with those from the LC50
tests for both species. Solid lines enclose the data points and illustrate the variability among the
different groups of fish within a species, as well as the greater variability for inanga compared with
smelt.
Smelt
0
0.2
0.4
0.6
0.8
1
0 2000 4000 6000 8000 10000 12000 14000 16000
Turbidity (NTU)
Mean
su
rviv
al
rate
Inanga
0
0.2
0.4
0.6
0.8
1
0 4000 8000 12000 16000 20000 24000 28000 32000
Turbidity (NTU)
Me
an
su
rviv
al ra
te

TP 337 - Lethal Turbidity Levels For Common Freshwater Fish and Invertebrates in Auckland Streams 17
Figure 6. Cumulative survival rates with time for smelt at different turbidity levels
Figure 7. LT50
curve for smelt at turbidity levels ranging up to 7,000 NTU. The arrow indicates that the
LT50
at this turbidity level would have exceeded 24 hours. The dotted lines enclosing the data points
(i.e., 100% confidence limits) reflect the variation in LT50
values that could be expected for a given
turbidity level.
0
20
40
60
80
100
0 3 6 9 12 15 18 21 24
Time (h)
Mean
su
rviv
al (%
)
0 NTU
1564 NTU
3519 NTU
2385 NTU
4382 NTU
2009 NTU5290 NTU
3970NTU6185 NTU
SMELT
y = 68.44e-0.0006x
R2 = 0.8368
0.0
5.0
10.0
15.0
20.0
25.0
30.0
0 2000 4000 6000 8000
Turbidity (NTU)
LT
50
(h
)
SMELT
TP 337 - Lethal Turbidity Levels For Common Freshwater Fish and Invertebrates in Auckland Streams 18
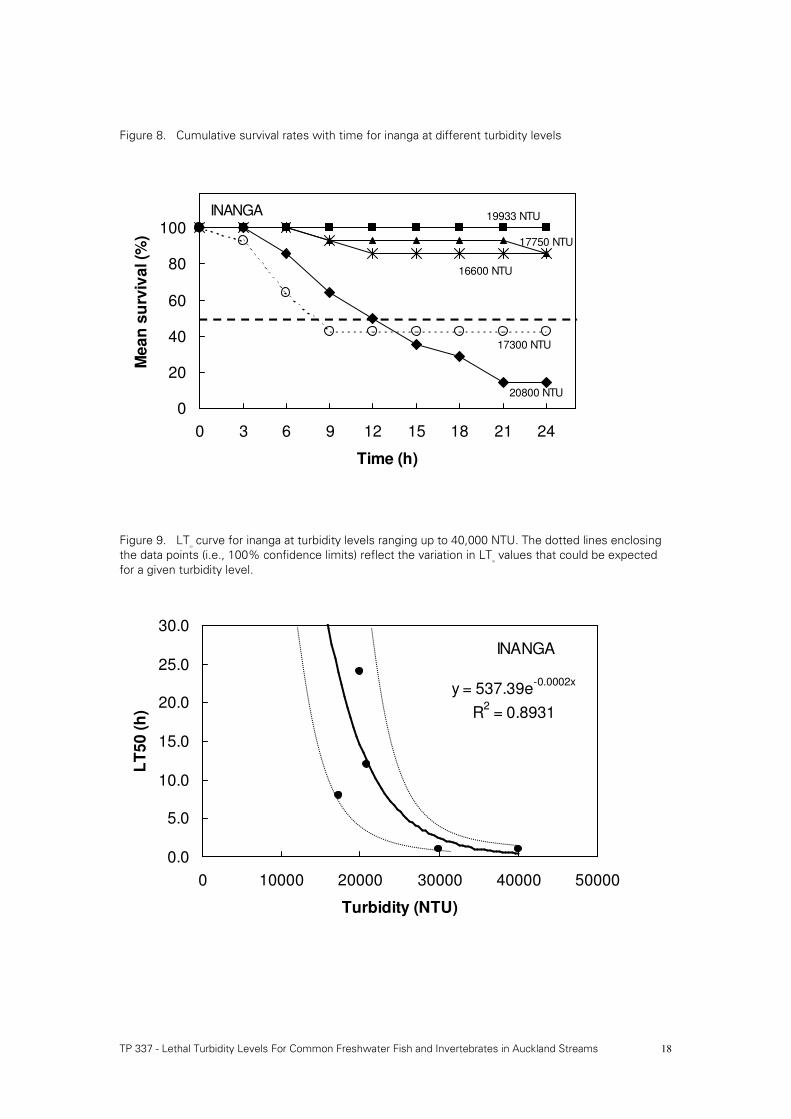
Figure 8. Cumulative survival rates with time for inanga at different turbidity levels
Figure 9. LT50
curve for inanga at turbidity levels ranging up to 40,000 NTU. The dotted lines enclosing
the data points (i.e., 100% confidence limits) reflect the variation in LT50
values that could be expected
for a given turbidity level.
0
20
40
60
80
100
0 3 6 9 12 15 18 21 24
Time (h)
Me
an
su
rviv
al (%
)
20800 NTU
17300 NTU
16600 NTU
19933 NTU
17750 NTU
INANGA
y = 537.39e-0.0002x
R2 = 0.8931
0.0
5.0
10.0
15.0
20.0
25.0
30.0
0 10000 20000 30000 40000 50000
Turbidity (NTU)
LT
50
(h
)
INANGA
TP 337 - Lethal Turbidity Levels For Common Freshwater Fish and Invertebrates in Auckland Streams 19
4.4.3 Results of repeat exposure to 1000 NTU
Smelt were exposed to a 4 hour period in turbid water (nominal value of 1000 NTU) every 2-3
days over a period of 22 days between 24th May and 14th June (i.e., ten separate
exposures). Actual turbidity levels declined over the four hour period from levels of 950-1000
NTU at the start to 850-750 NTU at the end. Dissolved oxygen concentrations remained high
throughout at 91-115% saturation, and pH ranged from 6.3-8.1, except on 6th June when it
was as low as 4.7. This low value was probably caused by a lack of buffer in the tank water
on this occasion. Fortunately it had no observable effect on the smelt.
There were no mortalities of smelt in any of the 3 replicate tanks that were repeatedly
exposed to high turbidity levels or in the control tanks. The smelt were observed feeding
readily on whiteworms after each exposure and appeared healthy and in good condition after
the 22 day period of repeat exposures.
4.5 Discussion
Turbidity levels over 20,000 NTU and as high as 40,000 NTU had no detectable effect on the
survival rates of juvenile banded kokopu or adult redfin bullies. This is despite the fact that
these two species are the least abundant native fish in turbid North Island rivers (Rowe et al.
2000), and that the movement and feeding of banded kokopu was reduced by turbidity levels
over 25 NTU (Boubee et al. 1997; Rowe and Dean 1998, Richardson et al. 2001). It is clear
that the behavioural responses of these fish to sublethal turbidities are not to avoid mortality
but to facilitate some other aspect of their ecology or life history (e.g., feeding or navigation).
It can be concluded that high levels of turbidity (up to 40,000 NTU) do not directly affect the
survival of either redfin bullies or banded kokopu. However, this should not be taken to mean
that they are unaffected by high levels of suspended solids in natural streams. Impacts from
siltation have not been addressed and remain a possibility, especially as Jowett and
Boustead (2001) showed that deposited sediments (produced by a high suspended sediment
load) reduced the abundance of Upland bullies in artificial stream channels.
The survival of both smelt and inanga was reduced at high levels of turbidity, more so for
smelt than for inanga. However, both species exhibited high variability in their survival rates
at a given turbidity level. Mortality caused by high turbidity is likely to be size-dependent for
these fish, but fish size was not responsible for the variation in our tests. Individual fish
differences related to sex, maturation status, parasite loading, or physiological status could all
be responsible.
Turbidity levels exceeding 1000 NTU are rare in Auckland rivers and streams, unless large
slips or blow-outs of sediment ponds occur. As the survival of inanga was only marginally
reduced at turbidities exceeding 5000 NTU, and as its LC50 was 20,235 NTU, it is
exceedingly unlikely that inanga will be adversely affected by high turbidities in these
streams. However, the survival of smelt was significantly reduced at turbidity levels as low as
2000 NTU, so this species could be adversely affected. Indeed, the scarcity of smelt

TP 337 - Lethal Turbidity Levels For Common Freshwater Fish and Invertebrates in Auckland Streams 20
compared with inanga in Auckland urban streams (Table 2) is likely to reflect their greater
sensitivity to high turbidity levels produced during flood flows. However, a number of other
environmental factors, including differences in fish behaviour and recruitment, may also
explain this difference.
Variations in the sensitivity of fish species to high levels of suspended solids in rivers are
believed to be related mainly to differences in feeding behaviour and reproductive
requirements (Berkman and Rabeni 1987). Species whose feeding depends on visual cues
and whose eggs require silt-free substrates are likely to be more affected than species not
dependent on vision and whose eggs are not sensitive to siltation. In this respect, smelt are
mainly visual feeders and scatter eggs over sandy substrates on stream beds where they are
susceptible to smothering by silt. These life history traits indicate that smelt would be
vulnerable to high suspended solids concentrations in streams. In comparison, inanga deposit
their eggs in and on vegetation on the flooded margins of streams where siltation is less of
an issue. Therefore, they will be less vulnerable than smelt.
Smelt have a reputation as a more easily stressed fish than inanga. The physiological basis
for this is unknown, however, high turbidity levels increased the oxygen consumption of
redbreast tilapia because of mechanical damage caused to their gills (du Preeze et al. 1996).
Smelt may experience a similar problem. The mechanism for stress aside, smelt populations
in turbid streams can be expected to be much more vulnerable to the effects of suspended
sediment than inanga because they are more easily stressed and succumb to a lower
turbidity level, and because their eggs are more vulnerable to siltation.
It is apparent that an increase in either the frequency of exposure, or in the duration of
exposure to a given turbidity level can affect fish (Newcombe and McDonald 1991).
However, knowledge of the critical frequencies and exposure periods is only now being
developed. Shaw & Richardson (2001) found that an increase in the duration of sediment
pulses from 1 to 6 hours significantly reduced the growth rate of rainbow trout fingerlings.
However, repeat exposure of smelt to a turbidity of 1000 NTU for 4 hours every 2-3 days had
no discernable effect on their survival. Although the critical frequency of exposure and
duration of turbidity for smelt remains unknown, an exposure of 1000 NTU for 4 hours every
2-3 days is well above the upper limit for natural flood conditions in most Auckland streams
(Wilcock & Stroud 2000). Therefore, typical turbidity conditions experienced in these urban
streams are unlikely to affect the smelt. However, it should be noted that turbid conditions in
the wild may be accompanied by both reduced pH and oxygen levels which, combined with
high turbidity, may result in synergistic effects on fish survival.
These results deal with the direct effects of turbidity on fish and not the indirect effects of
increased siltation on substrates providing habitat for fish or their food supply. It is apparent
that although turbidity can directly affect some native fish species (e.g., banded kokopu and
smelt) through sublethal and lethal effects, respectively, indirect effects of siltation on stream
ecosystem functioning may be more important in the long term and affect other species
such as redfin bullies and inanga.

TP 337 - Lethal Turbidity Levels For Common Freshwater Fish and Invertebrates in Auckland Streams 21

TP 337 - Lethal Turbidity Levels For Common Freshwater Fish and Invertebrates in Auckland Streams 22
5. Effects of Turbidity on Invertebrates
5.1 Choice of invertebrate species
The invertebrate fauna of many urban streams in Auckland City is dominated by relatively few
tolerant taxa such as amphipods, snails, midges and worms (e.g., Sides and Bennett 1998;
Suren et al. 1998; Suren 2000). Very few of the more sensitive invertebrates such as
mayflies or caddisflies are found, and stoneflies are generally absent from urban streams.
This species-poor fauna is typical of Auckland urban streams, and reflects the high degree of
habitat modification and the generally low water quality in many streams. In contrast to
urban streams, non-urban streams in the Auckland Region often support high densities of
more sensitive invertebrates such as mayflies and caddisflies. There are a multitude of
factors associated with catchment development that may lead to a loss of sensitive
invertebrate taxa. Sediment is one of these and when washed into streams it may lead to a
loss of sensitive taxa, with a shift in the fauna to one dominated by more tolerant species.
In this study, invertebrates were selected that are characteristically found in non-urban
catchments, as we wanted to assess the sensitivity of these taxa to suspended sediments.
A high sensitivity of these animals to suspended sediment may explain their absence from
urban streams. Discussions between Mike Scarsbrook (NIWA) and John Maxted (ARC), and a
review of the literature of the effects of landuse changes and turbidity on invertebrates (e.g.,
Quinn et al. 1992; Harding et al. 2000), identified five insect taxa that were either common on
soft substrates in Auckland streams, or taxa known to be adversely affected by high
turbidities. These were two caddisflies (Polyplectropus and Triplectides), the damsel fly
(Xanthocnemis), and two mayflies (Zephlebia and Deleatidium). Zephlebia is relatively
common in non-urbanised, soft bottomed streams in the Auckland Region and Deleatidium,
although less common in Auckland streams, was included because it is ubiquitous and
known to be sensitive to sediment. We also selected a crustacean, the freshwater crayfish
(Paranephrops) for the study as these animals are less mobile than fish, and so may prove
vulnerable to suspended solids.
These animals all have different morphologies. The two mayflies are characterised by thin
gills on each side of their abdomen, while the damselfly has long, flat, tail-like gills on the end
of its body. The caddisfly Triplectides has abdominal gills as well, but these tubular gills are
protected within a case, usually made of plant material such as hollowed out sticks. The
other caddisfly, Polyplectropus, has no gills, but relies on small apertures along its abdomen
for gas exchange. The freshwater crayfish Paranephrops relies on gas exchange through a
series of tufted filamentous gills that arise at the point of attachment of each of the thoracic
legs. These are protected by the carapace. Crayfish also have mechanisms to minimise the
damage to their gills by suspended sediments. As such, we expect that these animals would
TP 337 - Lethal Turbidity Levels For Common Freshwater Fish and Invertebrates in Auckland Streams 23
have different tolerances to suspended sediments, reflecting differences in how the gills
were exposed to fine, potentially abrasive or clogging sediment.
Invertebrates for the experiments were obtained from a number of small streams in the
Hamilton region. Samples of Xanthocnemis were collected from a small stream flowing
through pasture south-west of Hamilton. These animals were collected from dense growths
of macrophytes, usually Ceratophyllum and Elodea, using a kick net. Samples of other
invertebrates were collected from small streams flowing through the Whatawhata Hill
Country Research Station. Polyplectropus were collected using a kick net, sampling the
stream margins amongst riparian vegetation and detrital debris in the channel. Deleatidium
and Zephlebia were collected by electric-fishing small sections of selected streams, and
collecting all animals in a downstream net. Paranephrops were collected from streams in the
Whatawhata Hill Country Research Station by electric-fishing.
All invertebrates were kept in small plastic containers on ice until returned to the NIWA
Hamilton laboratory. Here they were separated into individual plastic containers and kept in a
constant temperature room (16°C, photoperiod 12L:12D) for 1-2 days before the experiments
began.
5.2 Experimental methods
5.2.1 Establishment of a lethal concentration
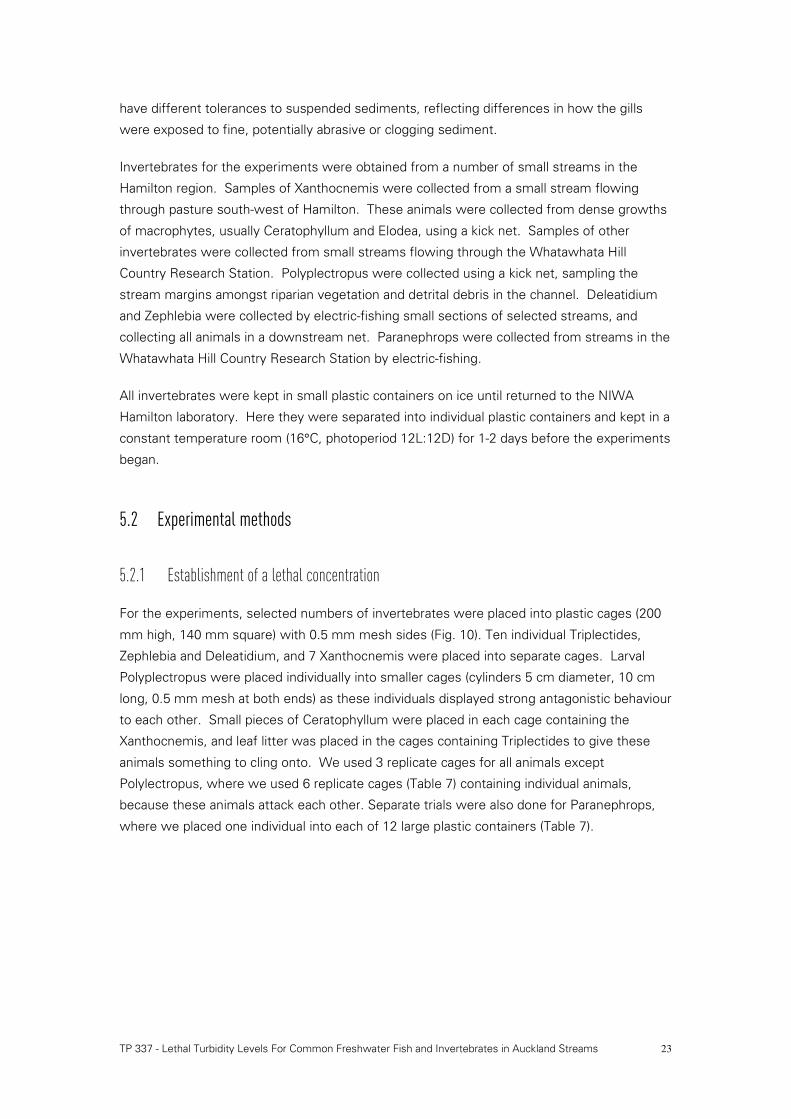
For the experiments, selected numbers of invertebrates were placed into plastic cages (200
mm high, 140 mm square) with 0.5 mm mesh sides (Fig. 10). Ten individual Triplectides,
Zephlebia and Deleatidium, and 7 Xanthocnemis were placed into separate cages. Larval
Polyplectropus were placed individually into smaller cages (cylinders 5 cm diameter, 10 cm
long, 0.5 mm mesh at both ends) as these individuals displayed strong antagonistic behaviour
to each other. Small pieces of Ceratophyllum were placed in each cage containing the
Xanthocnemis, and leaf litter was placed in the cages containing Triplectides to give these
animals something to cling onto. We used 3 replicate cages for all animals except
Polylectropus, where we used 6 replicate cages (Table 7) containing individual animals,
because these animals attack each other. Separate trials were also done for Paranephrops,
where we placed one individual into each of 12 large plastic containers (Table 7).
TP 337 - Lethal Turbidity Levels For Common Freshwater Fish and Invertebrates in Auckland Streams 24
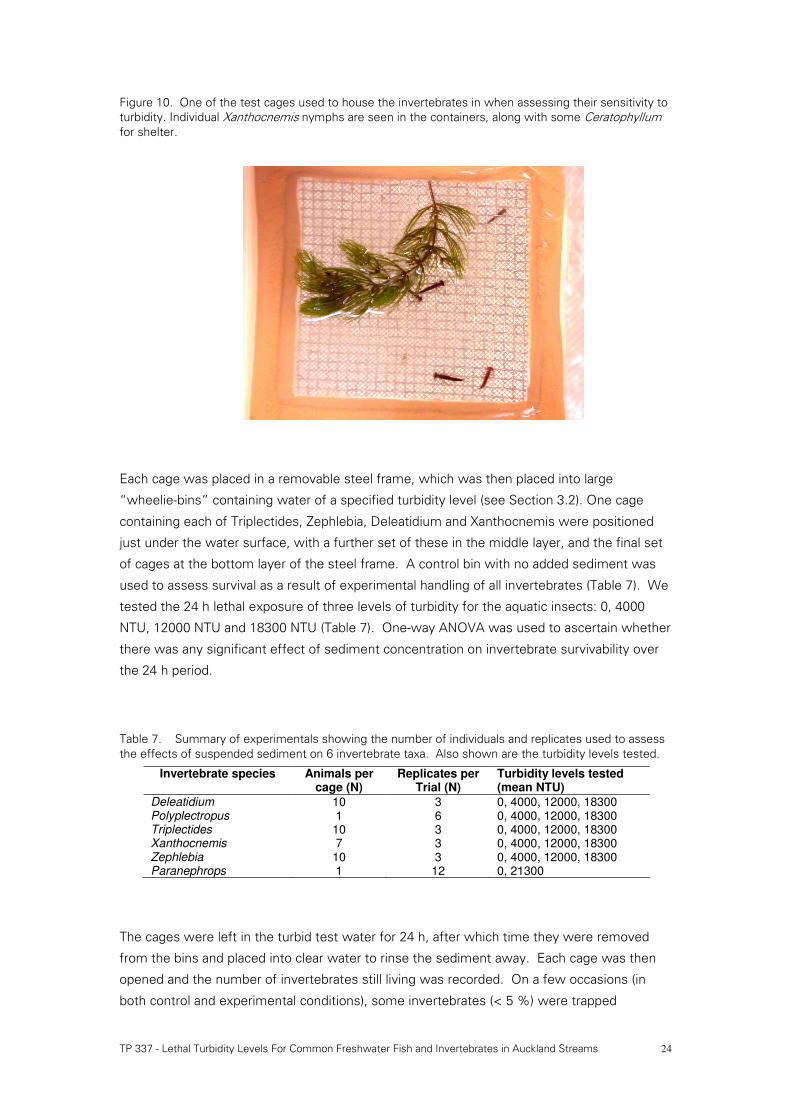
Figure 10. One of the test cages used to house the invertebrates in when assessing their sensitivity to
turbidity. Individual Xanthocnemis nymphs are seen in the containers, along with some Ceratophyllum
for shelter.
Each cage was placed in a removable steel frame, which was then placed into large
“wheelie-bins” containing water of a specified turbidity level (see Section 3.2). One cage
containing each of Triplectides, Zephlebia, Deleatidium and Xanthocnemis were positioned
just under the water surface, with a further set of these in the middle layer, and the final set
of cages at the bottom layer of the steel frame. A control bin with no added sediment was
used to assess survival as a result of experimental handling of all invertebrates (Table 7). We
tested the 24 h lethal exposure of three levels of turbidity for the aquatic insects: 0, 4000
NTU, 12000 NTU and 18300 NTU (Table 7). One-way ANOVA was used to ascertain whether
there was any significant effect of sediment concentration on invertebrate survivability over
the 24 h period.
Table 7. Summary of experimentals showing the number of individuals and replicates used to assess
the effects of suspended sediment on 6 invertebrate taxa. Also shown are the turbidity levels tested.
Invertebrate species Animals per cage (N)
Replicates per Trial (N)
Turbidity levels tested (mean NTU)
Deleatidium 10 3 0, 4000, 12000, 18300 Polyplectropus 1 6 0, 4000, 12000, 18300 Triplectides 10 3 0, 4000, 12000, 18300 Xanthocnemis 7 3 0, 4000, 12000, 18300 Zephlebia 10 3 0, 4000, 12000, 18300 Paranephrops 1 12 0, 21300
The cages were left in the turbid test water for 24 h, after which time they were removed
from the bins and placed into clear water to rinse the sediment away. Each cage was then
opened and the number of invertebrates still living was recorded. On a few occasions (in
both control and experimental conditions), some invertebrates (< 5 %) were trapped

TP 337 - Lethal Turbidity Levels For Common Freshwater Fish and Invertebrates in Auckland Streams 25
between the mesh sides and the plastic containers and had died there. These were not
included in our assessments of survival related to turbidity level. In other cages, not all
invertebrates were present at the end of the trial, as some had managed to ‘escape’ through
small holes in the cages. Again, the number of individuals that escaped was small, so was
not included in our estimates of survival.
5.2.2 Effects of repeat exposure to 1000 NTU
Following the above experiment, we quantified the effect of repeated exposure to a lower
turbidity level, as would more typically occur in Auckland streams. We tested the sensitivity
of Deleatidium to a repeat exposure of 1000 NTU (nominal level). For this experiment, we
collected mayflies from the Whatawhata Hill Country Research Station, and placed 20 into
the same plastic cages described above. These cages were then placed into the large plastic
wheelie bins containing clear tap water. We used six replicate cages that were left in clean
tap water as controls, while another five replicates were used to assess the impact of
repeated exposure to 1000 NTU over a long time period. After the first day in the clear water,
five experimental cages were placed into the turbid solution for four hours, before being
removed, washed and replaced into the clear tap water. The survival of invertebrates was
assessed before replacing the cages back into the clear tap water. Survival in the control
cages was also assessed at this time. This experiment was run for 14 days, during which
time invertebrates were allowed to feed on natural periphyton covering ceramic tiles. These
tiles were removed prior to placing the cages into the sediment solution, to avoid
contamination, and were replaced when the cages were replaced back into the clean tap
water.
Invertebrates in the experimental cages were exposed to the 1000 NTU solution on days 1,
2, 5, 7, 9, and 12, and their survival checked before and after each exposure. Survival was
compared with that of the control. The experiment was concluded after 14 days. The pH,
turbidity, temperature and dissolved oxygen in each tank was measured on each sampling
day to see whether any of these parameters changed over time.
For each trial, we calculated the percentage survival of Deleatidium in both the control and
experimental cages. A repeated measures ANOVA was used to ascertain whether there was
any difference in the survival rates over time between the exposed and control groups.
Linear regression was also used to ascertain whether there was any time dependent effect
on survival.
TP 337 - Lethal Turbidity Levels For Common Freshwater Fish and Invertebrates in Auckland Streams 26
5.3 Results
5.3.1 Establishment of a lethal concentration
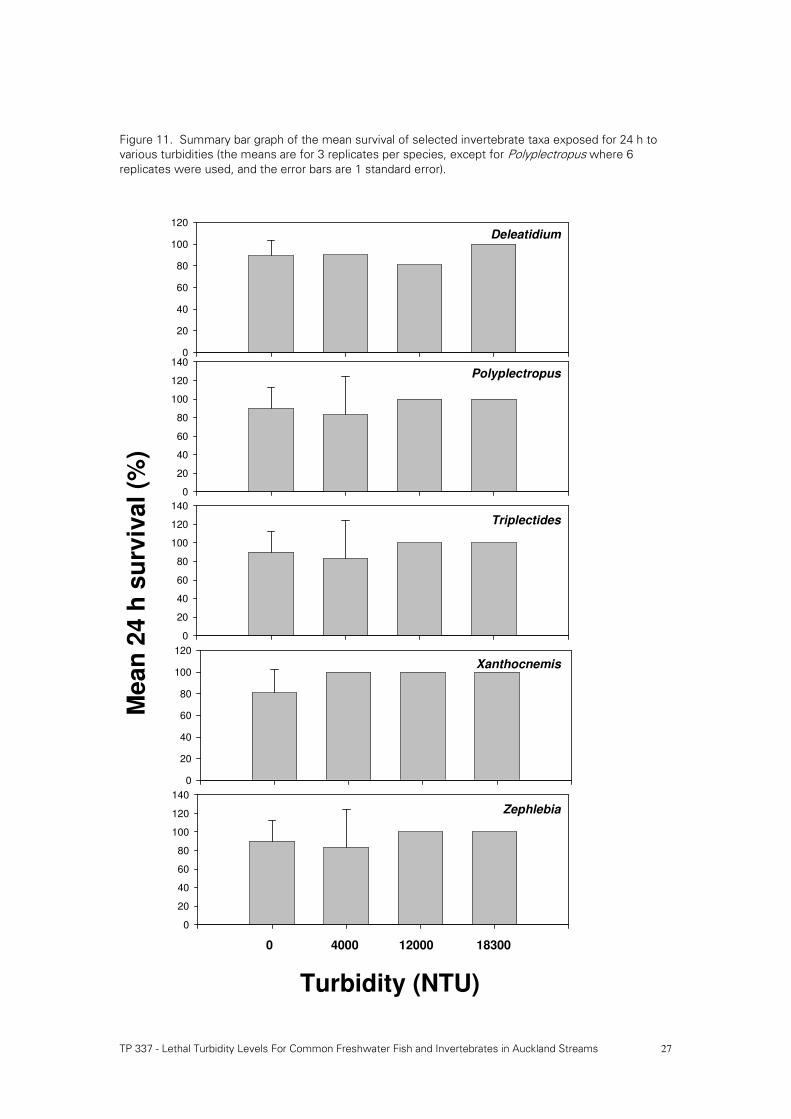
There were no significant differences in the survival of any of the five insect taxa in the
control or turbid water after a 24 h period, even for the most turbid solution (18,300 NTU; Fig.
11). Mean survival rates in all trials ranged from a low of 88 % for Zephlebia to 95 % for
Xanthocnemis. There was little pattern in the survival of the different taxa in each of the
different test solutions. Surprisingly, the 24 h survival of Deleatidium, Polyplectropus, and
Xanthocnemis in the clear-water control solution was always lower than in the most turbid
solution (18,300 NTU) (Fig. 11). This difference was not significant, but the consistency of the
pattern suggests that these invertebrates were less stressed in the highly turbid water than
in clear water.
Paranephrops also displayed no reduction in survival in turbid water (21,300 NTU) over a 24 h
period; indeed we found only a 91% survival in the controls compared to a 100 % survival in
the most turbid test solution.
Based on these results, it is evident that there are little, if any adverse effects of short-term
(24 h) acute exposure to even very high turbidities for the six invertebrate taxa selected for
this study.
5.3.2 Effects of repeat exposure to 1000 NTU
Water quality parameters remained relatively constant between the control and 1000 NTU
solutions over the 14-day period. Turbidity in the control solution was always low (c. 1 NTU),
and the average turbidity of the test solution was 1052 NTU. The pH of the control solution
(pH = 7.49) was slightly lower than that of the test solution (pH = 7.61), but this small
difference was not considered to be physiologically significant.
Overall, survival of Deleatidium nymphs was high for both the control and experimental
groups, with over 80 % of the nymphs surviving repeat exposures to a turbidity of c. 1000
NTU over the 14-day period. There was no significant difference in the survival of mayflies
between either the control or experimental groups after 14-days (P > 0.05), and although
there was a slightly lower survival of individuals in the experimental groups exposed to 1000
NTU from 5 days onward (Fig. 12), the difference was not significant (P > 0.05).
There was, however, a significant decrease in the survival of mayfly nymphs in both the
control and experimental groups over the 14-day period (F = 13.5, P < 0.001, r2 = 0.54). This
difference suggests that holding these animals over the 14-day period had a slightly negative
effect on their survival, but this was unrelated to periodic exposure to turbidity.
TP 337 - Lethal Turbidity Levels For Common Freshwater Fish and Invertebrates in Auckland Streams 27
Figure 11. Summary bar graph of the mean survival of selected invertebrate taxa exposed for 24 h to
various turbidities (the means are for 3 replicates per species, except for Polyplectropus where 6
replicates were used, and the error bars are 1 standard error).
0
20
40
60
80
100
120
Deleatidium
Me
an
24
h s
urv
iva
l (%
)
0
20
40
60
80
100
120
140
Triplectides
0 4000 12000 18300
Turbidity (NTU)
0
20
40
60
80
100
120
140
Zephlebia
0
20
40
60
80
100
120
140Polyplectropus
0
20
40
60
80
100
120
Xanthocnemis

TP 337 - Lethal Turbidity Levels For Common Freshwater Fish and Invertebrates in Auckland Streams 28
Figure 12. Plot of the mean (± 1 SE) survival of 20 Deleatidium nymphs to repeated 4 h exposures of
1000 NTU over a 14-day period (x + 1 sd, n = 6 for control, 5 for experimental cages). Although there
was a decrease in the survival of nymphs after 5 days, there was no significant difference (ns, P <0.05)
between control and turbidity-exposed groups after 6 exposures over 14 days.
Days
0 2 4 6 8 10 12 14 16
Mean
24 h
su
rviv
al (%
)
70
75
80
85
90
95
100
105
ns ns ns nsns
ns
Control
Experimental
5.4 Discussion
The results of this study showed that there was no evidence of a direct lethal effect from a
24 h exposure to high turbidities on selected invertebrate taxa. These taxa were chosen a
priori as being “sensitive” to landuse changes, and are commonly absent from streams
flowing through modified catchments where turbidity is high (Quinn and Cooper 1997; Quinn
et al. 1997; Suren 2000; Harding et al. 2000). The suspended sediment concentrations that
we exposed the test invertebrates to were extremely high (up to over 18,000 NTU), and at
the extreme upper limit of what would be found in even the most turbid conditions for urban
streams. Lack of lethal effects of even such high turbidity implies that infrequent periods of
high turbidity are unlikely to adversely affect the survival of even the most sensitive stream
invertebrates.
We also detected no significant difference in survival of the common mayfly Deleatidium
when repeatedly exposed to a 1000 NTU solution over a 14-day period. These animals were
given adequate uncontaminated food during this period, and they appeared to suffer few
adverse effects from the short term (4 h) exposures to turbidity. Lack of any observable
lethal effect to repeat exposures suggests that the absence of sensitive taxa from urban
TP 337 - Lethal Turbidity Levels For Common Freshwater Fish and Invertebrates in Auckland Streams 29
streams is not due to any direct effect of the animal’s inability to tolerate acute turbid
conditions.
Although we did not detect any direct lethal effects on invertebrates from short-term, or
repeated exposures to solutions with high turbidities, it is highly likely that significant long-
term effects of highly turbid waters on invertebrate communities will occur in natural
streams. High turbidities increase invertebrate drift rates (Suren 1998) and reduce the density
of bottom dwelling invertebrates (Wagener and LaPierre 1985; Ryan 1991; Quinn et al. 1992).
Suspended sediment also settles on the substrate, clogging spaces between stones and
reducing the available habitat for invertebrates (Suren and Jowett 2001). Deposited
sediments also contaminate periphyton layers on stones, reducing their food value and
attractiveness to invertebrates (Ryder 1989; Broekuizen et al. 200l). Invertebrate densities
are reduced in places where suspended sediment has settled, and the fauna is dominated by
taxa tolerant of silted conditions (e.g., Lester et al. 1994; Death 2000; Suren and Jowett
2001). Taxa such as the ones tested in this study will be absent from such areas as some of
them (e.g., mayflies, caddisflies) have shown strong negative responses to both suspended
and deposited sediment in streams.
A number of studies have examined the ecology of urban streams in the Auckland region
(e.g., Williamson et al. 1994; Anon 1995; Macaskill et al. 1995; Wilding 1996; Sides and
Bennett 1998; Allibone et al. 2001). The report by Sides and Bennett (1998) is the largest and
most comprehensive study, whereby a systematic large-scale survey of 61 sites on 44
streams in central and west Auckland, and on the North Shore was conducted. Streams in
non-urban catchments were characterized by at least 4 caddisfly genera, 3 mayfly genera,
and 1 stonefly genera, all of which are regarded as being ‘sensitive’ to catchment
development. In contrast, more tolerant invertebrates such as midges, worms, the snail
Physa, and the damselfly Xanthocnemis generally characterized the urban streams examined
in the Sides and Bennett study. These latter taxa have been identified elsewhere as common
components of urban streams throughout the country (Suren 2000; Suren et al. 1998).
There are many differences in the physical structure of urban and non-urban streams (Suren
2000). For instance, the non-urban streams studied by Sides and Bennett (1998) were
generally longer, had greater catchment areas, were higher and had their samples collected
at a greater distance from the sea than the urban streams. The non-urban streams also had a
relatively high percentage of unmodified catchment, and were surrounded mostly by native
vegetation. They had high dissolved oxygen concentrations, and were often characterized by
riffles flowing over a bouldery substrate. The urban streams, in contrast, often had highly
modified stream channels, consisting of concrete channels or reinforced banks. Overhanging
riparian vegetation was also relatively rare in these streams, and spot water temperatures
quite high. Algae and /or macrophyte biomass was also high in some of the streams.
As a consequence, the absence of sensitive insect taxa from these urban streams may
reflect differences in the physical habitat conditions, and the inability of sensitive taxa to
survive in the highly modified habitats characteristic of urban streams. Thus, the occurrence

TP 337 - Lethal Turbidity Levels For Common Freshwater Fish and Invertebrates in Auckland Streams 30
of highly turbid waters in these streams is only one of many different environmental
pressures faced by the biota. There is, however, a decline in the density of sensitive insect
taxa from streams that are in the process of becoming urbanized, despite the fact that the
overall habitat conditions of these streams is relatively natural (e.g., Suren 1999). Such a
decline may reflect the sedimentation associated with the construction and urbanization
phase of small catchments (Williamson 1993; Snelder and Trueman 1995; Suren 2000). Our
results suggest that this reduction is not a result of direct lethal effects of turbidity, but more
a result of emigration by invertebrates from areas of high turbidity. Once suspended
sediments settle, they create unsuitable instream habitat within the streambed (Suren and
Jowett 2001) and lower the nutritional value of food such as periphyton on cobbles (Ryder
1989; Broekhuizen et al. 2001). It is these more subtle effects on habitat quality that are
thought to reduce invertebrates in urbanized streams.
TP 337 - Lethal Turbidity Levels For Common Freshwater Fish and Invertebrates in Auckland Streams 31
6 Conclusions Exposure of the aquatic larval stage of 2 caddisflies, a damselfly and 2 mayfly species to high
turbidity levels (up to c. 20,000 NTU) had no effect on their 24 hour survival. Similarly, the
freshwater crayfish, adult redfin bullies and juvenile banded kokopu were not affected by
turbidities of c. 20,000 NTU. As the highest turbidity levels recorded in Auckland streams are
well below 20,000 NTU, it can be concluded that these species will not be directly affected
by the high turbidities associated with flood flows. This is not to say that other environmental
effects caused by the presence of high levels of suspended solids in streams will not affect
them. We found that the Auckland clay used for these tests reduced the pH of water to
levels (5.2-5.5) which may stress some biota, and there are the numerous indirect and longer-
term effects of settled clay particles on stream ecosystems to consider. These issues aside,
we concluded that when concentrations of Auckland area clay particles in water produce
turbidities of c. 20,000 NTU or less, the short-term (24 h) survival of these species will not be
affected.
This is in contrast to the results obtained for inanga and smelt. The survival of both these
species was reduced by turbidity levels below 20,000 NTU. The survival of inanga was
reduced by turbidity levels ranging from 7,000 NTU upwards. Its LC50 was close to 20,000
NTU and turbidities over 30,000 NTU resulted in 0% survival over 24 hours. Even so, this
species survival is unlikely to be greatly affected by the turbidity levels occurring naturally in
Auckland streams.
Smelt were an order of magnitude more sensitive than inanga. Their survival was reduced at
turbidity levels ranging from 700 NTU upward. Their LC50 was close to 3,000 NTU and
turbidities over 10,000 NTU resulted in 0% survival over 24 hours. Despite the limitations of
the LT50 curve for this species, it provides a guide to the time for 50% survival to occur at a
given NTU level. However, turbidities of 2,000 NTU would need to persist for more than
several days to reduce smelt survival by 50%. These data indicate that smelt survival could
well be affected in streams when sediment holding ponds are breached and unusually high
turbidities occur for relatively short periods. As other factors, such as low pH and low oxygen
levels, can be expected to occur on such occasions, actual smelt mortalities may be much
higher.
Repeat exposure of smelt to turbidities of 1000 NTU for 4 hours every 2-3 days over a period
of 20 days did not affect their survival. These data establish a ‘safe’ baseline for repeat
exposures. However, the effects of 2000 NTU for 4 hours every 2-3 days, or of an increase in
the duration of exposure from 4 to 8 hours remain unknown.
With the exception of smelt, this study has largely eliminated water column turbidity as a
major stressor of fish and invertebrates in Auckland streams. This means that impacts of
suspended solids on the biota are mediated primarily through changes in benthic habitats and
/or stream production.
TP 337 - Lethal Turbidity Levels For Common Freshwater Fish and Invertebrates in Auckland Streams 32
7 Recommendations � Use of the LT50 curve for smelt is constrained by the high variability in survival rates
encountered for this species and the resultant wide spread of data points. Further
testing could be be carried out over the critical range of turbidity levels for this
species to strengthen the LT50-turbidity level relationship.
� Tests were undertaken using an Auckland based clay collected from a restricted
locality to avoid any variability in the results from different types of clay. It would
now be useful to undertake some testing on smelt with a clay from a different part
of the city to ensure similar results occur. This will enable a more general
application of the results.
� Preliminary data indicated an effect of fish size on susceptibility to high levels of
turbidity. Smaller fish were more vulnerable to turbidity than larger fish. This is
unlikely to be an issue for species other than smelt. However, juvenile smelt were
not tested and may prove to be more vulnerable than the adults used in this study.
� The repeat exposure at 1000 NTU established a useful baseline for smelt and the
mayfly Deleatidium. However, some smelt mortalities occurred at 2000 NTU. If
turbidities of this magnitude occur in some Auckland streams, repeat exposures to
this level should be tested. The 4 hour exposure may also be low relative to the
duration of turbid conditions in some Auckland streams.
� The remaining fish and invertebrate species were not sensitive to high levels of
turbidity per se, but are likely to be affected by other environmental changes
associated with high suspended solids loadings in streams. Such environmental
effects will need to be identified in order to develop controls on solids loadings. As
they could include water quality changes (reduced pH and oxygen levels), effects of
siltation on invertebrate and fish habitats, and changes in invertebrate and fish food
supplies, an initial scoping study is required to identify which of these processes is
likely to be more critical and therefore worth investigating further.

TP 337 - Lethal Turbidity Levels For Common Freshwater Fish and Invertebrates in Auckland Streams 33
8 References Allibone, R.J.; Horrocks, J.; Parkyn, S.M. (2001). Stream classification and instream
objectives for Auckland’s urban streams. NIWA Client report ARC00257.
Anon (1995). Meola / Motions Creek Residual Flow alteration: assessment of
environmental effects. Auckland Regional Council. 27 p.
Boubee, J.A.T.; Dean, T.L.; West, D.W.; Barrier, R.F.G. (1997). Avoidance of suspended
sediment by the juvenile migratory stage of six New Zealand native fish
species. New Zealand Journal of Marine and Freshwater Research 31: 61-69.
Berkman, H. E.; Rabeni, C. F. (1987). Effect of siltation on stream fish communities.
Environmental Biology of Fishes 18: 285-294.
Broekhuizen, N.; Parkyn, S. M.; Miller, D. (2001). Fine sediment effects on feeding and
growth in the invertebrate grazers Potamopyrgus antipodarum (Gastropoda,
Hydrobiidae) and Deleatidium sp. (Ephemeroptera, Leptophlebiidae).
Hydrobiologia 457: 125-132.
Death, R.G. (2000). Invertebrate-substratum relationships. In: Collier, K. J.; Winterbourn,
M. J. (eds). New Zealand stream invertebrates: ecology and implications for
management. pp 157-178. New Zealand Limnological Society, Christchurch.
du Preeze, H. H.; Buermann, Y.; Steyn, G. J.; Smit, L. (1996). The influence of
suspended silt on oxygen consumption by the redbreast tilapia, Tilapia
rendalli (Boulenger, 1986). Hydrobiologia 325: 31-38.
Harding, J. S.; Quinn, J. M.; Hickey, C. W. (2000). Effects of mining and production
forestry. In: Collier, K. J., Winterbourn, M.J. (ed) New Zealand stream
invertebrates: ecology and implications for management. pp 230-259. New
Zealand Limnological Society, Christchurch.
Jowett, I. G.; Richardson, J.; Biggs, B.J.F.; Hickey, C. W.; Quinn, J. M. (1991).
Microhabitat preferences of benthic invertebrates and the development of
generalised Deleatidium spp. habitat suitability curves, applied to four New
Zealand rivers. New Zealand Journal of Marine and Freshwater Research 25:
187-199.
Jowett, I. G.; Boustead, N. C. (2001). Effects of substrate and sedimentation on the
abundance of upland bullies (Gobiomorphus breviceps). New Zealand Journal
of Marine and Freshwater Research 35: 605-613.
Lester, P. J.; Mitchell, S. F.; Scott, D. (1994). Willow leaf and periphyton chemical
composition and the feeding preferences of Olinga feredayi (Trichoptera:

TP 337 - Lethal Turbidity Levels For Common Freshwater Fish and Invertebrates in Auckland Streams 34
Conoesucidae). New Zealand Journal of Marine and Freshwater Research 28:
13-18.
Lloyd, D. S.; Koenings, J. P.; LaPerriere, J. D. (1987). Effects of turbidity in fresh waters
of Alaska. North American Journal of Fisheries Management 7: 18-33.
Macaskill, J. B.; Collier, K. J.; Williamson, R. B. (1995). Water quality of Meola Creek.
NIWA Consultancy Report No DCA001. 18 p.
Newcombe, C. P.; MacDonald, D. D. (1991). Effects of suspended sediments on
aquatic ecosystems. North American Journal of Fisheries Management 11:
72-82.
Quinn, J. M.; Cooper, A. B. (1997). Land-water interactions at Whatawhata, New
Zealand: introduction and synthesis. New Zealand Journal of Marine and
Freshwater Research 31: 569-577.
Quinn, J. M.; Cooper, A. B.; Davis-Colley, R. J.; Rutherford, J. C.; Williamson, R. B.
(1997). Land use effects on habitat, water quality, periphyton, and benthic
invertebrates in Waikato, New Zealand, hill-country streams. New Zealand
Journal of Marine and Freshwater Research 31: 579-597.
Quinn, J. M.; Davies-Colley, R. J.; Hickey, C. W.; Vickers, M. L.; Ryan, P. A. (1992).
Effects of clay discharges on streams. 2. Benthic invertebrates.
Hydrobiologia 248: 235-247.
Richardson, J.; Rowe, D.K.; Smith, J. (2001). Effects of turbidity on the upstream
movement of migratory banded kokopu (Galaxias fasciatus) in a stream. New
Zealand Journal of Marine and Freshwater Research 35: 191-196.
Rowe, D. K.; Dean, T. (1998). Effects of turbidity on the feeding ability of the juvenile
migrant stage of six New Zealand freshwater fish species. New Zealand
Journal of Marine and Freshwater Research 32: 21-29.
Rowe, D. K.; Hicks, M.; Richardson, J. (2000). Reduced abundance of banded kokopu
(Galaxias fasciatus) and other native fish in turbid rivers of the North Island of
New Zealand. New Zealand Journal of Marine and Freshwater Research
34:547-558.
Rowe, D. K.; Smith, J.; Williams, E. (2002). Effects of turbidity on the feeding ability of
adult, riverine smelt (Retropinna retropinna) and inanga (Galaxias maculatus).
New Zealand Journal of Marine and Freshwater Research 36: 143-150.
Ryan, P. A. (1991). Environmental effects of sediment on New Zealand streams: a
review. New Zealand Journal of Marine and Freshwater Research 25: 207-
221.

TP 337 - Lethal Turbidity Levels For Common Freshwater Fish and Invertebrates in Auckland Streams 35
Ryder, G. I. (1989). Experimental studies on the effects of fine sediment on lotic
invertebrates. PhD Dissertation. University of Otago, Dunedin, New Zealand.
216 p.
Sides, E. S.; Bennett, K. V. (1998). Mid-Waitemata Harbour catchment freshwater
ecological survey. Technical Publication No. 99. 28 p. (+ Appendices).
Shaw, E. A.; Richardson, J. S. (2001). Direct and indirect effects of sediment pulse
duration on stream invertebrate assemblages and rainbow trout
(Oncorhynchus mykiss) growth and survival. Canadian Journal of Fisheries
and Aquatic Sciences 58: 2213-2221.
Snelder, T.; Trueman, S. (1995). The environmental impacts of urban stormwater runoff.
Suren, A. M. (1998). Impact of slip sediment on the biota in a New Zealand Alpine
River. Transfund New Zealand Research Report No. 97. 50p.
Suren, A. M. (1999) Puhinui Stream Assessment. NIWA Client Report No. CHC99/33 20
p.
Suren, A.M. (2000). Effects of urbanization. In: Collier, K. J.; Winterbourn, M. J. (eds).
New Zealand stream invertebrates: ecology and implications for
management. pp 260-288. New Zealand Limnological Society, Christchurch.
Suren, A.M.; Jowett, I.G. (2001). Effects of deposited sediment on invertebrate drift: an
experimental study. New Zealand Journal of Marine and Freshwater
Research 35: 725-737.
Suren, A.M.; Scarsbrook, M.R.; Snelder, T.H. (1998). Urban stream habitat assessment
method (USHA). NIWA Client Report CHC98/60: 143 p.
Wagener, S.M.; LaPerriere, J.D. (1985). Effects of placer mining on the invertebrate
communities of interior Alaska streams. Freshwater Invertebrate Biology 4:
208-214.
Waters, T.F. (1995). Sediment in streams. Sources, biological effects, and control.
American Fisheries Society Monograph 7: 1-251.
Wilcock,R. J.; Stroud, M.J. (2000). Baseline water quality survey of the Auckland
Region. Annual Report April 1999-March 2000. NIWA Client Report No
ARC00259/2.
Wilding, T.K. (1996). Effects of urban development on the small stream ecosystems of
Auckland and the influence of riparian vegetation. Master of Science. The
University of Auckland. 116 p.
TP 337 - Lethal Turbidity Levels For Common Freshwater Fish and Invertebrates in Auckland Streams 36
Williamson, R.B. (1993). Urban Runoff Data Book. Water Quality Centre Publication 20.
51 p.
Williamson, R.B.; Suren, A.M.; Macaskill, J.B. (1994). Survey of urban streams in the
Auckland isthmus. Resources and restoration potential. NIWA Consultancy
Report ACC002/1: 26 p.
Wood, P. J.; Armitage, P. D. (1997). Biological effects of fine sediment in the lotic
environment. Environmental Management 21: 203-217.