lessons learnt from utt implementation
TRANSCRIPT

LESSONS LEARNT FROM UTT IMPLEMENTATION
AWACC 2017
Date : 08 SEPTEMBER 2017
Venue: MAHARANI HOTEL
Presenter: LINDA DLAMINI

Presentation Outline
1. Introduction 2. Aims of implementing UTT3. KZN v/s International Context 4. Background Pre UTT5. Current status 6. Specific populations interventions 7. What the future holds8. Conclusion

Introduction
1990 Chris Hani projects that HIV will damage and course suffering worse than apartheid by the end of the century
1991 AIDS, don't let it happen Campaign 1992 Soul City HIV Campaign1993 Constitutional Act, regualtion 200 is passed
1995 Red Ribbon Campaign1996 Establishment of the national HAS Directorate
1997 Dr N C Dlamini-Zuma establishes the Interdepartmental Committee
1998 TAC is launched1999 Dr Manto Tshabalala-Msimang introduces food as medicine
2000 President Thabo Mbheki advocates for psychosocial and economic interventions to curb AIDS
2001 The first ANC HIV and Syphilis sero-prevalence survey
2002 PMTCT2003 Zackie Achmat starts treatment2004 ART Rollout
The journey travelled by SA
www.sahistory.org.za

Aims of UTTThe Primary Aim is to decrease HIV associated morbidity and mortality.
Legislative Prescripts
1. The National development Plan (NDP) 2030
2. The UN Sustainable development Goals
3. UNAIDS 2020 - 90 90 90 DIP
4. NHI White Paper
1 587 359
1 181 691
686 562 611 041
1 811 209
1 630 088 1 467 079 1 467 079
1 320 371
-
500 000
1 000 000
1 500 000
2 000 000
PLHIV PLHIV who knowtheir status
Total On ART Viral loads done ViralogicallySuppressed
HIV Care and Treatment Cascade (FY 2016/2017 - KZN )
Actuals 90-90-90 Target (Test and Offer)
67% 87% 54% 90%

KZN v/s International Context
Which country within the BRICS countries has the highest HIV prevalence?
1. Brazil2. Russia3. India4. China5. South Africa
KZN v/s International Context
What is the % difference of HIV prevalence between the countries that have a highest HIV prevalence in the BRICS countries?
1. 0% - 4%2. 5% - 9%3. 10% - 15%4. 15% - 20%

KZN v/s International Context
Which country within the BRICS countries has the highest life expectancy?
1. Brazil2. Russia3. India4. China5. South Africa
KZN v/s International Context
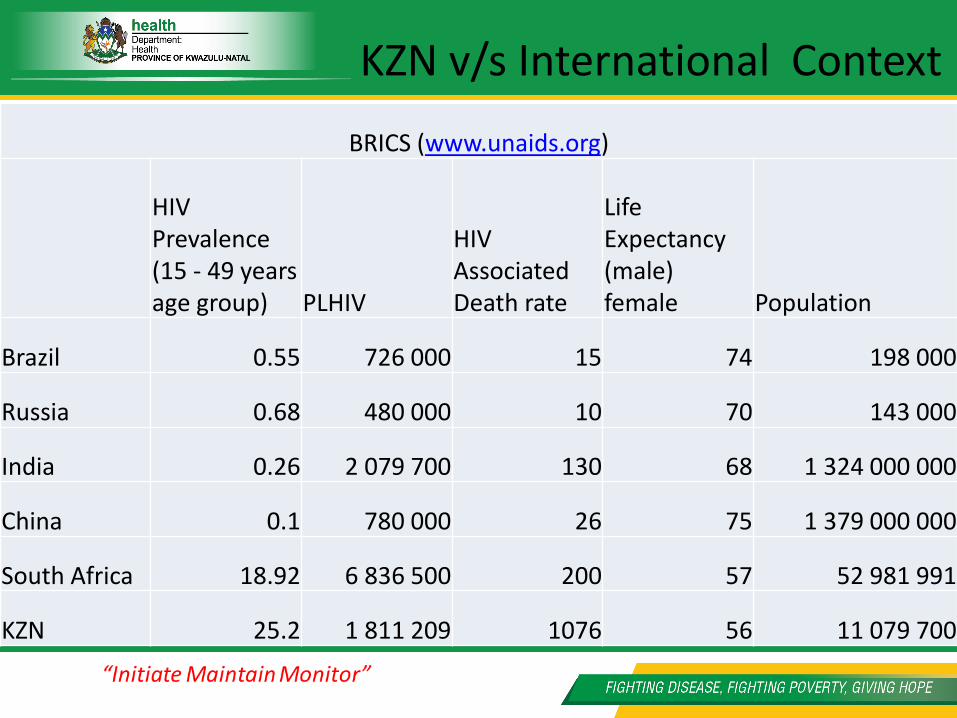
BRICS (www.unaids.org)
HIV Prevalence (15 - 49 years age group) PLHIV
HIV Associated Death rate
Life Expectancy (male) female Population
Brazil 0.55 726 000 15 74 198 000
Russia 0.68 480 000 10 70 143 000
India 0.26 2 079 700 130 68 1 324 000 000
China 0.1 780 000 26 75 1 379 000 000
South Africa 18.92 6 836 500 200 57 52 981 991
KZN 25.2 1 811 209 1076 56 11 079 700
KZN v/s International Context

KZN v/s International Context
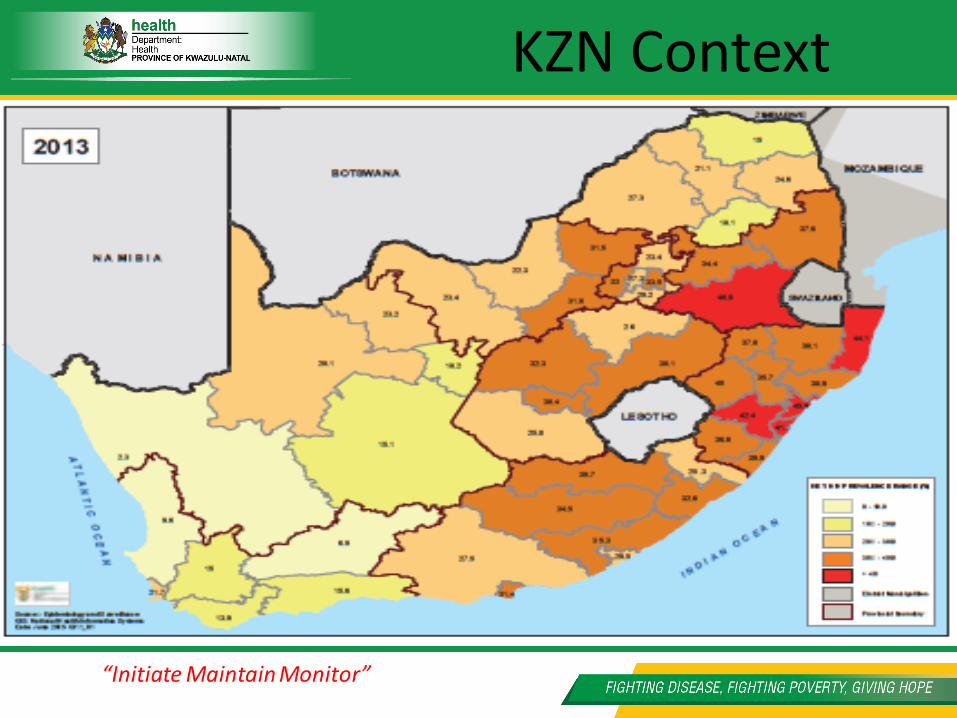
KZN Context

KZN Context
Socio economic status of kznLife expectancyBRICS KZN population against Prevalence Disease burden


Current status
Current status
Gaps in linkage to care

Current status
0.0
5.0
10.0
15.0
20.0
25.0
30.0
35.0
40.0
45.0
50.0
55.0
60.0
65.0
70.0
75.0
80.0
85.0
90.0
95.0
100.0
2016 Q1 2016 Q2 2016 Q4 2016 Q3 Grand Total
Pe
rce
nta
ge
KZN Adult ART Patient Outcomes
Adult CD4 100 to 199 cls/µl at ART start rate
Adult CD4 below 100 cls/µl at ART start rate
Adult percentage died after 12 months ART
Adult percentage died after 6 months ART
Adult percentage lost to follow up after 12 monthsART
Adult percentage lost to follow up after 6 monthsART
Adult percentage on ART after 12 months
Adult percentage on ART after 6 months
Adult with Viral load completion rate at 6 months
Adult with Viral load suppressed rate at 6 months
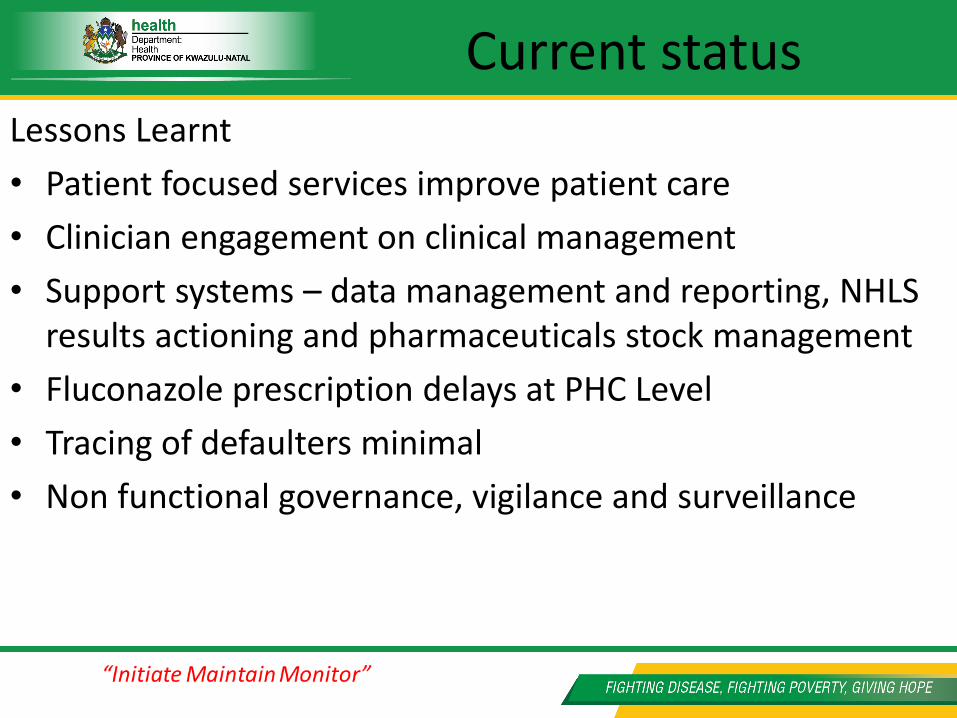
Current statusLessons Learnt
• Patient focused services improve patient care
• Clinician engagement on clinical management
• Support systems – data management and reporting, NHLS results actioning and pharmaceuticals stock management
• Fluconazole prescription delays at PHC Level
• Tracing of defaulters minimal
• Non functional governance, vigilance and surveillance

Specific populations
To be able to reverse the incidence of HIV which population groups should be targeted with antiretroviral treatment interventions?
1. Pregnant women2. Patients aged between 25 and 40 years3. Young and adolescent girls and women

Who: Cycle of HIV transmissionSchematic of sexual networks from clusters with heterosexual transmission
Most men & women
25-40 years acquire
HIV from similarly
aged partners (Mean
age difference = 1.1
years)
Men 25-40 years (N=79)
Knew HIV status: 21.5%
VL > 50,000 : 37.1%
Young women <25 years (N=43)
Knew HIV status: 23.3%
62% of male partners are 25-40 years
Women 25-40 years (N=56)
Knew HIV status: 42.6%
63% of male partners are 25-40 years
Most young women
<25 years acquire HIV
from older men (Mean
age difference =
8.7 years)
When young women reach >25
years they continue the cycle
39% of the men
linked to a woman <
25 are simultaneously
also linked to a
woman 25-40 years
Community HIV prevalence: 22.3% Community HIV prevalence: 59.8%
Community HIV prevalence: 40.3%
De Oliviera T, Kharsany A, et al. IAS 2016 19

What the future holds• The best we have for now is antiretroviral therapy
• Injectable, Subdermal implants, long acting ARVs.
• Prevention
• Early Treatment Success Case studies
• Vaccines
• Cure

ConclusionHeal the worldMake it a better placeFor you and for meAnd the entire human raceThere are people dyingIf you care enough for the livingMake it a better placeFor you and for me
How will you contribute?