lessons learned from the world's largest digester gas fuel cell
TRANSCRIPT

LESSONS LEARNED FROM THE WORLD'S LARGEST DIGESTER GAS FUEL CELL
Eleanor Allen*, Jaimie Hennessy CH2M HILL
1100 112th Ave NE, Suite 400 Bellevue, WA 98004-4504
Greg Bush, Carol Nelson
King County Department of Natural Resources & Parks, Wastewater Treatment Division 201 South Jackson Street, KSC-NR-0508
Seattle, Washington 98104-3855
Dave Hennessy FuelCell Energy
3 Great Pasture Rd Danbury, CT 06813
ABSTRACT
Increasing energy costs, more stringent air emission regulations, and an interest in exploring emerging energy technologies prompted King County in Washington state to search for new and innovative ways to provide electricity for its wastewater treatment plants. In cooperation with the U.S. Environmental Protection Agency (EPA), FuelCell Energy, Inc. (FCE), CH2M HILL, and Brown and Caldwell, King County (County) is operating the world’s largest molten carbonate fuel cell (MCFC) at its South Treatment Plant in Renton, Washington. The 1-megawatt (MW) fuel cell can operate on either natural gas or digester gas. Operation started in April of 2004 as part of a 2-year demonstration project. If successful, the fuel cell will continue to operate and produce energy for the South Treatment Plant after the 2-year demonstration project is completed. The data from this demonstration will provide other municipal wastewater treatment plants with information on fuel cell power systems applicable to their interests and needs.
Fuel cells produce electrical power directly through an electrochemical reaction using hydrogen and oxygen. The hydrogen can be produced from fuels such as natural gas, landfill gas, or anaerobic digester gas, while air provides the oxygen. The fuel cell has an anode and a cathode. When the fuel gas is combined with water, the fuel gas is eventually reformed to hydrogen, which is then fed to the fuel cell anode. Air is fed to the cathode. The reaction of the hydrogen moving from the anode to the cathode through an electrolyte creates electricity. By avoiding the two-step process of conventional combustion technology in which fuel is first burned and then the subsequent heat used to produce power, fuel cells are energy efficient, better for the environment, quieter, and ultimately more cost effective. Unlike combustion technologies, fuel cells have very low emissions of carbon monoxide, sulfur oxides, nitrogen oxides, and non-methane organic carbon. The main product of the fuel cell reaction is water, which discharges in the exhaust gas. Molten carbonate fuel cells are one of the most efficient fuel cell technologies and operate between 40 and 50 percent electrical efficiency. With additional heat recovery, the overall efficiency is typically between 60 and 70 percent.
Presentation for WEFTEC conference, Nov. 2, 2005Session #79 - Residuals and Biosolids Management: Biogas Utilization/C0-digestion
Page 1 of 20

The King County project has two objectives:
(1) Demonstrate that molten carbonate fuel cell technology can be adapted to use anaerobic digester gas as a fuel source.
(2) Generate a nominal plant power output of 1 MW (net AC) using both digester gas and natural gas.
To date, these two objectives have been successfully met. Provided that gas supply is consistent, the fuel cell can operate reliably. In the summer of 2005, halfway through the 2-year demonstration period, the efficiency of the power plant while operating on natural gas measured between 40 to 45 percent, and 40 to 47 percent while operating on digester gas. These measurements include the plant parasitic loads (e.g., anode gas oxidizer blower, inversion from DC to AC, water cleanup, etc.). During the first year in operation, power has been generated 65 percent of the time on either natural gas (41 percent) or digester gas (24 percent) for a total of 4.28 million kWhrs, or 49 percent of the total potential generation capacity if the unit was run at 100 percent power, 100 percent of the time. With the gas supply issues taken into consideration, the availability of the fuel cell for operation has been greater than 90 percent after the first two quarters of operation. Challenges experienced during the first year of operation with the gas supply and heat recovery unit operation have been resolved. The second year of operation should demonstrate more power generation.
In the summer of 2004, the fuel cell stack was sampled for emissions while the fuel cell was running on natural gas. The emissions test was performed in accordance with the California Air Resources Board (CARB) protocol for distributed generation. The emissions were below the CARB limits for distributed generation facilities that will operate beginning in the year 2007 (CARB 07 limits).
KEYWORDS
Fuel cell, molten carbonate, anaerobic digester gas, King County, distributed generation
INTRODUCTION
King County’s (County) Wastewater Treatment Division (WTD) operates three wastewater treatment plants that range in capacity from less than one to more than 130 million gallons per day (mgd). The County is in the process of designing two new treatment plants. Seventeen local sewer districts in the Seattle area discharge into the County’s conveyance system that, by the end of the decade, will include approximately 70 pump and regulator stations and almost 400 miles of 24-inch to 144-inch sewers. The County is continuously evaluating innovative ways to make their operations more efficient and sustainable. Increasing energy costs, more stringent air emission regulations, and an interest in exploring emerging energy technologies prompted King County to search for new and innovative ways to provide electricity for its wastewater treatment plants. For this reason, the County began this two-year demonstration project of a 1-MW molten carbonate fuel cell (MCFC) power plant fueled by anaerobic digester gas. The plant used in this project, being carried out with the support and cooperation of the U.S. Environmental Protection
Presentation for WEFTEC conference, Nov. 2, 2005Session #79 - Residuals and Biosolids Management: Biogas Utilization/C0-digestion
Page 2 of 20

Agency (EPA), MCFC manufacturer FuelCell Energy, Inc. (FCE), CH2M HILL, and Brown and Caldwell is the largest in the world.
The King County Fuel Cell Demonstration Project began in 1998 with the long-term objective of siting a MCFC power plant at the County’s South Treatment Plant in Renton, Washington. Constructed in 1965, the South Treatment Plant has experienced numerous upgrades and expansions. The average capacity of the treatment plant is 115 million gallons per day (mgd). Currently, the plant treats an average wet weather flow of approximately 70 mgd to full secondary treatment using activated sludge. The secondary effluent is discharged through a deep ocean outfall. The solids are co-thickened and stabilized using mesophilic anaerobic digestion. The dewatered Class B biosolids are applied to land for agricultural use in Eastern Washington and in silviculture applications in Western Washington, and a portion are composted.
Anaerobic digester gas (ADG) for the fuel cell stacks is produced in five anaerobic digesters located approximately 1,000 feet from the fuel cell power plant. The digesters feed gas through large pipes to a header, which feeds into a gas scrubbing system nearly adjacent to the digesters. The gas is scrubbed to remove carbon dioxide and hydrogen sulfide and then sold to Puget Sound Energy (PSE) as pipeline quality natural gas. A portion of this biogas is now diverted before reaching the PSE scrubbers and sent to the fuel cell power plant and a boiler. A turbine cogeneration facility is currently under construction at the South Treatment Plant which, when operating, will consume the remaining 3 MW of scrubbed digester gas and up to 5 MW of purchased natural gas.
The objectives of the demonstration project are to show that:
(1) Molten carbonate fuel cell technology can be adapted to use anaerobic digester gas as a fuel gas; and
(2) A nominal plant power output target of 1 MW (net AC) can be achieved using both digester gas and natural gas.
The wastewater treatment plant consumes all the power generated; no power is exported to the grid. The MCFC is installed in a combined heat and power configuration whereby heat from the fuel cell exhaust gas is recovered in a heat recovery unit and used in the plant heat loop for digester heating.
MOLTEN CARBONATE FUEL CELL TECHNOLOGY
Fuel cells electrochemically combine hydrogen with oxygen to produce electricity, heat, and water. The direct electrochemical conversion of hydrogen to direct current (DC) power is much more efficient than if the hydrogen were combusted. All fuel cells have three key component parts: an anode, a cathode, and an electrolyte. There are several types of fuel cells, each characterized by the composition of the electrolyte, supporting structure, and electrochemical process involved.
Carbonate salts serve as the electrolyte in a MCFC, which is among the most energy-efficient fuel cell technologies. Operating at a temperature of 1,200°F, the salts melt and conduct
Presentation for WEFTEC conference, Nov. 2, 2005Session #79 - Residuals and Biosolids Management: Biogas Utilization/C0-digestion
Page 3 of 20

carbonate ions (CO32-) from the cathode to the anode. At the anode, hydrogen reacts with the
ions to produce water, carbon dioxide, and electrons. Electrons travel through an external circuit and return to the cathode. At the cathode, oxygen from air and carbon dioxide recycled from the anode react with the electrons to form carbonate ions that replenish the electrolyte and transfer current through the fuel cell (Figure 1).
Figure 1 – Electrochemical reactions within a MCFC
(Source: EPRI 2005)
FUEL CELL DEMONSTRATION PROJECT OVERVIEW
The 1-MW MCFC plant is adapted from FCE’s standard natural-gas-fueled Direct FuelCell (DFC) module. The King County MCFC plant is a DFC module that has been modified by adding supplemental equipment and controls necessary to pre-treat raw digester gas. Power plant components were sized to permit power generation up to 1.5 MW in the event an up-rate becomes available in the future.
Figure 2 provides a process flow diagram of the system.
Presentation for WEFTEC conference, Nov. 2, 2005Session #79 - Residuals and Biosolids Management: Biogas Utilization/C0-digestion
Page 4 of 20

Figure 2 – Fuel Cell Process Flow Diagram
(Source: FuelCell Energy, Inc.)
Illustrated schematically in the block diagram in Figure 3 are the fuel cell system components and the fuel cell plant’s inputs, outputs, and processes, many of which are described in the sections that follow. The fuel cell system components are as follows:
• Fuel cell stack module
• Electrical Balance of Plant (EBOP)
• Gas types and conditioning o Natural gas o Digester gas
• Gas treatment and controls o Anode fuel gas treatment o Anode exhaust gas treatment o Oxidant supply/oxidizer o Cathode exhaust gas treatment
• Ancillary components: o Water treatment system o Nitrogen gas supply system (for purging during shut down)
Presentation for WEFTEC conference, Nov. 2, 2005Session #79 - Residuals and Biosolids Management: Biogas Utilization/C0-digestion
Page 5 of 20

Figure 3 – Fuel Cell Power Plant Block Diagram
(Source: FuelCell Energy, Inc.)
Fuel Cell Stack
The fuel cell stack for this 1-MW unit is comprised of four 250-kW vertical stacks, each with approximately 400 cells, inside one vessel.
Electrical Balance of Plant (EBOP)
The fuel cell power plant is rated at 1 MW, with a net output at 480 V AC. The output is tied to a transformer to step-up the voltage to 13,090 V at the South Plant’s main substation. The output of the fuel cell uses a 3,200 amp breaker as the tie breaker in conjunction with protective relays to provide the system with the interconnection protection required. The protection includes over/under voltage and frequency, over current phase and ground, directional ground fault, and sync-check. The protection package matches PSE interconnection protection requirements.
Gas Types and Conditioning
There are three types of gas at the South Treatment Plant that are used in the fuel cell as anode fuel gas. Sulfur compounds must be removed from all three gases prior to use in the fuel cell power plant as they are harmful to the fuel cells. The gases are:
• Gas 1 – King County Scrubbed Digester Gas
Exhaust
Natural Gas Preparation
Presentation for WEFTEC conference, Nov. 2, 2005Session #79 - Residuals and Biosolids Management: Biogas Utilization/C0-digestion
Page 6 of 20

• Gas 2 – PSE Natural Gas • Gas 3 – King County Raw Digester Gas
Gas 1 – King County Scrubbed Digester Gas
The South Treatment Plant is one of the few plants in the United States that has high-pressure Binax scrubbers that remove carbon dioxide and hydrogen sulfide from the digester gas. The scrubbed gas is sold to PSE as pipeline quality natural gas. Gas 1 is a back-up system to Gas 3 at the fuel cell. Both Gas 1 and Gas 2 are treated through two activated carbon cold gas desulfurizers in series, which remove trace sulfur compounds to concentrations less than 0.1 ppmV (parts per million by volume).
Gas 2 – PSE Natural Gas
The natural gas purchased from PSE is a back-up system to Gas 1. It follows the same pretreatment system as Gas 1. A third cold gas desulfurizer was added later in the project. This third desulfurizer operates upstream and in series with the original cold gas desulfurizers for Gas 1 and Gas 2. The third desulfurizer vessel contains copper and aluminum oxide media that remove carbonyl sulfide from the natural gas, which is a compound that occurs naturally in Gas 2 that is supplied by PSE from off-site.
Gas 3 – King County Raw Digester Gas
The digester gas is low-pressure gas. The line to the fuel cell comes from the digester gas header, which collects the gas from all five digesters prior to scrubbing. The digester gas is pressurized to approximately 26 pounds per square inch gage (psig) when it reaches the fuel cell plant. The pressurized gas then passes through the digester gas pretreatment system (SulfaTreat®), which treats the gas to less than 10 ppmV of hydrogen sulfide followed by two activated carbon adsorbers in series, which treat the gas further to reduce the hydrogen sulfide to less than 0.1 ppmV.
Gas Treatment and Controls
Anode Fuel Gas Treatment
The anode fuel gas is fed into the fuel cell. Before entering the fuel cell, the gas must be treated. The anode fuel gas treatment portion of the fuel gas preparation system performs the following functions:
• Simultaneously humidifies and superheats the fuel gas.
• Treats the preheated fuel gas in fuel deoxidizer to remove oxygen, which is required to protect the preconverter and fuel cell catalysts from oxidation. The gas heats up as it passes through the fuel deoxidizer because the oxygen removal reactions are exothermic.
• Partially reforms the deoxidized fuel gas in the preconverter to eliminate heavy hydrocarbons and generate an initial hydrogen gas concentration. High molecular-weight
Presentation for WEFTEC conference, Nov. 2, 2005Session #79 - Residuals and Biosolids Management: Biogas Utilization/C0-digestion
Page 7 of 20

hydrocarbons are reformed to avoid carbon deposition in the fuel cell stacks. The gas cools as it passes through the preconverter due to the endothermic reforming reactions.
• Heats the fuel gas as it exits the preconverter in the fuel superheater.
• Feeds the resultant anode fuel gas to fuel cell stack module.
Anode Exhaust Gas
Anode exhaust gas from the fuel cell stack module is routed to the oxidizer, where the remaining fuel components in the low-Btu (British thermal unit) anode gas are catalytically oxidized to generate carbon dioxide (CO2), water vapor, and heat.
Oxidizer
The oxidizer consists of a natural gas burner and fuel piping train, a thermal reactor, and a catalytic reactor. The oxidizer mixes compressed air with anode exhaust gas from the fuel cell stack module and catalytically oxidizes the fuel components in the anode exhaust gas, and delivers the hot oxidized gas to the cathode. Recirculating carbon dioxide generated in the fuel cell anodes is fed to the fuel cell cathodes to support the cathode reactions.
Cathode Exhaust Gas Treatment
Cathode exhaust gas from the fuel cell stack module is routed to the "shell" side of the heat recovery unit where it is used as the heat source for the fuel superheater and fuel humidifier.
Figure 4 shows a photo of the fuel cell power plant.
Figure 4 – Fuel Cell Power Plant and Ancillary Equipment
Figures 5 through 7 are photos of the fuel cell demonstration project site.
Fuel Cell
Digester Gas Treatment
Presentation for WEFTEC conference, Nov. 2, 2005Session #79 - Residuals and Biosolids Management: Biogas Utilization/C0-digestion
Page 8 of 20

Figures 5 through 7 are photos of the fuel cell demonstration project site.
Figure 5 – Electrical Balance of Plant (EBOP) and Fuel Cell Stack (right, behind transformer)
(Source: Brown and Caldwell)
Figure 6 – Waste Heat Recovery Unit
Presentation for WEFTEC conference, Nov. 2, 2005Session #79 - Residuals and Biosolids Management: Biogas Utilization/C0-digestion
Page 9 of 20
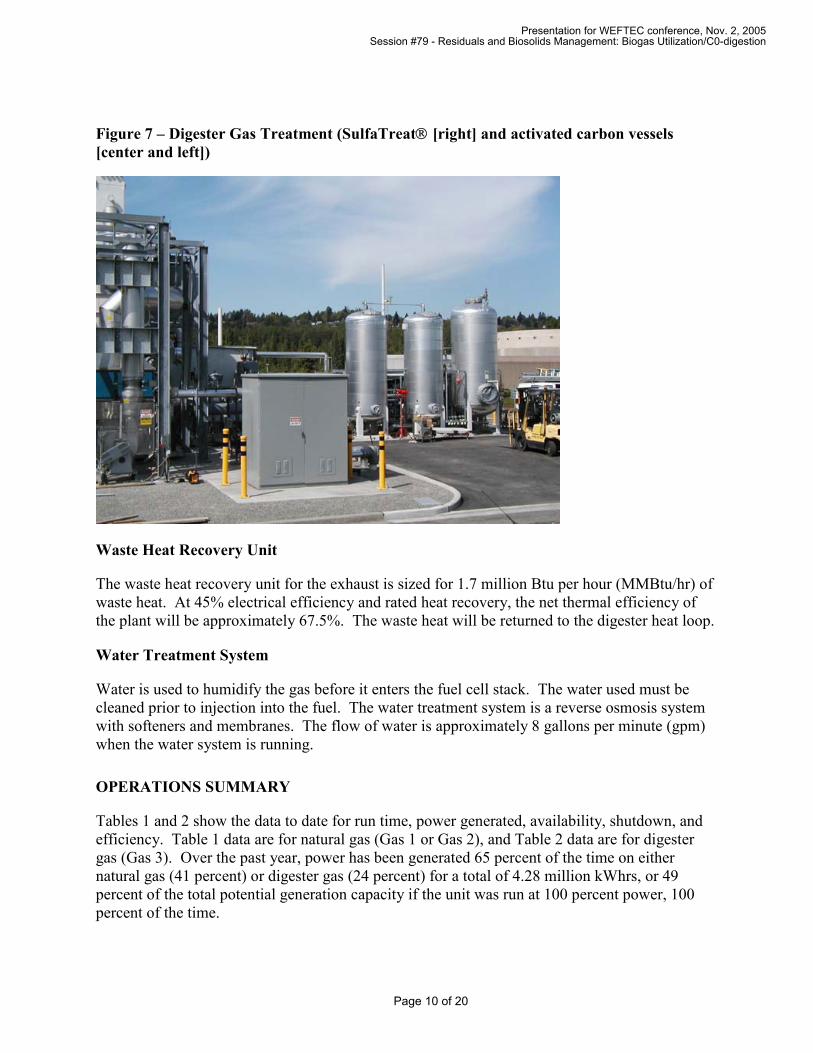
Figure 7 – Digester Gas Treatment (SulfaTreat® [right] and activated carbon vessels [center and left])
Waste Heat Recovery Unit
The waste heat recovery unit for the exhaust is sized for 1.7 million Btu per hour (MMBtu/hr) of waste heat. At 45% electrical efficiency and rated heat recovery, the net thermal efficiency of the plant will be approximately 67.5%. The waste heat will be returned to the digester heat loop.
Water Treatment System
Water is used to humidify the gas before it enters the fuel cell stack. The water used must be cleaned prior to injection into the fuel. The water treatment system is a reverse osmosis system with softeners and membranes. The flow of water is approximately 8 gallons per minute (gpm) when the water system is running.
OPERATIONS SUMMARY
Tables 1 and 2 show the data to date for run time, power generated, availability, shutdown, and efficiency. Table 1 data are for natural gas (Gas 1 or Gas 2), and Table 2 data are for digester gas (Gas 3). Over the past year, power has been generated 65 percent of the time on either natural gas (41 percent) or digester gas (24 percent) for a total of 4.28 million kWhrs, or 49 percent of the total potential generation capacity if the unit was run at 100 percent power, 100 percent of the time.
Presentation for WEFTEC conference, Nov. 2, 2005Session #79 - Residuals and Biosolids Management: Biogas Utilization/C0-digestion
Page 10 of 20
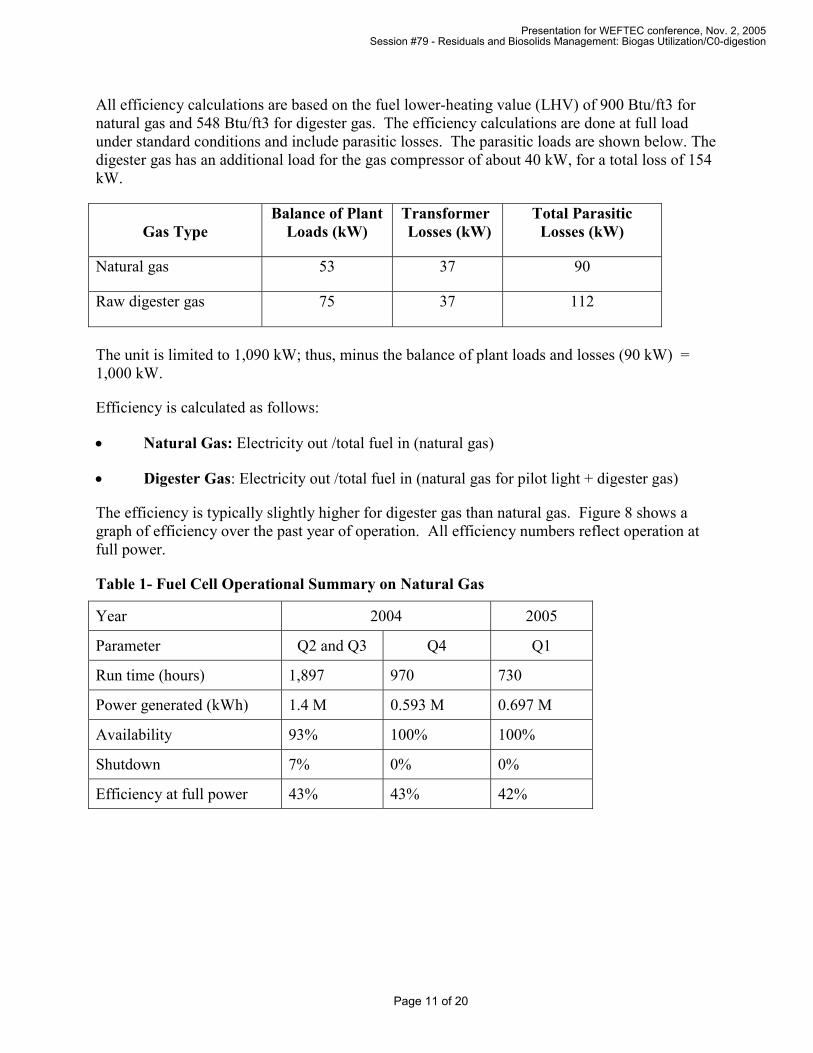
All efficiency calculations are based on the fuel lower-heating value (LHV) of 900 Btu/ft3 for natural gas and 548 Btu/ft3 for digester gas. The efficiency calculations are done at full load under standard conditions and include parasitic losses. The parasitic loads are shown below. The digester gas has an additional load for the gas compressor of about 40 kW, for a total loss of 154 kW.
Gas Type Balance of Plant
Loads (kW) Transformer Losses (kW)
Total Parasitic Losses (kW)
Natural gas 53 37 90
Raw digester gas 75 37 112
The unit is limited to 1,090 kW; thus, minus the balance of plant loads and losses (90 kW) = 1,000 kW.
Efficiency is calculated as follows:
• Natural Gas: Electricity out /total fuel in (natural gas)
• Digester Gas: Electricity out /total fuel in (natural gas for pilot light + digester gas)
The efficiency is typically slightly higher for digester gas than natural gas. Figure 8 shows a graph of efficiency over the past year of operation. All efficiency numbers reflect operation at full power.
Table 1- Fuel Cell Operational Summary on Natural Gas
Year 2004 2005
Parameter Q2 and Q3 Q4 Q1
Run time (hours) 1,897 970 730
Power generated (kWh) 1.4 M 0.593 M 0.697 M
Availability 93% 100% 100%
Shutdown 7% 0% 0%
Efficiency at full power 43% 43% 42%
Presentation for WEFTEC conference, Nov. 2, 2005Session #79 - Residuals and Biosolids Management: Biogas Utilization/C0-digestion
Page 11 of 20

Table 2 - Fuel Cell Operational Summary on Digester Gas
Year 2004 2005
Parameter Q2 and Q3 Q4 Q1
Run time (hours) 313 490 1,270
Power generated (kWh) 78,664 357,000 1.158 M
Availability 64% 94.5% 90%
Shutdown 35% 5.5% 10%
Efficiency at full power 44% 44% 43%
Figure 8 – Fuel Cell Power Production and Efficiency
Power Production and Efficiency
0
500
1000
1500
2000
2500
3000
6/1/04 7/1/04 7/31/04 8/30/04 9/29/04 10/29/04 11/28/04 12/28/04 1/27/05 2/26/05 3/28/05 4/27/05
Date
Pow
er (k
W)
0
10
20
30
40
50
60
70
80
90
100
Net
Effi
cien
cy (%
)
Total Power In Net Power OutNet Efficiency
EMISSIONS
In July 2004, the King County fuel cell went through a series of emissions tests while running on natural gas. The tests followed the California Air Resources Board (CARB) protocol for
Presentation for WEFTEC conference, Nov. 2, 2005Session #79 - Residuals and Biosolids Management: Biogas Utilization/C0-digestion
Page 12 of 20

King County Fuel CellPower-Normalized Emission Rates for CARB Certification
Running on Natural GasJuly 27-28, 2004
0.092169445
0.00166162
0.07
0.1
0.020.017057623
0
0.02
0.04
0.06
0.08
0.1
0.12
NOx CO NMHC
lb/M
W-h
r
Overall ResultCARB 07 Limit
distributed generation. The emissions were below the CARB limits for distributed generation facilities that will operate beginning in the year 2007 (CARB 07 limits). The CARB 07 limits are:
• Nitrogen oxides (NOx) < 0.07 lb/MW-hr
• Carbon monoxide (CO) < 0.1 lb/MW-hr
• Non-methane hydrocarbons (NMHC) < 0.02 lb/MW-hr
Similar emissions tests will be performed in the summer of 2005 using digester gas as the fuel source.
Figure 9 – CARB 07 Emission Limits for Distributed Generation
PROGRAM GOALS
The specific project goals, performance metrics, and results to date are described in Table 3 below.
Presentation for WEFTEC conference, Nov. 2, 2005Session #79 - Residuals and Biosolids Management: Biogas Utilization/C0-digestion
Page 13 of 20

Table 3 – Performance Goals and Metrics
Performance Goal Metric Results
1. Deliver high-quality and -quantity gas to the fuel cell
Acceptable gas supply >95% of the time.
Digester gas Btu content between 550 and 610 Btu/scf LHV @ 4 to 7 in w.c.; 50 to 100°F.
One of 3 sources has been available 100% of the time.
2. Produce energy as designed on natural gas and digester gas
Produce 15,000 MWhrs gross power for 2-year test period. Prorate to last half of test after plant normalized after first 6 to 9 months.
1 MW net. Parasitic electric loads for natural gas and digester gas to be measured during testing.
Full power = 135 scfm natural gas and 230 scfm digester gas.
Approx. 2000 MWhrs gross power generated during Quarter 1 2005, prorated out to 2 years is 16,000 MWhrs.
1 MW net has previously been met on both natural gas and digester gas.
3. Produce minimal noise and equipment interferences
60 dBA at a distance of 100 feet from fuel cell pad (70 dBA at a distance of 10 feet).
Testing scheduled for summer 2005.
4. Produce energy at a minimal cost
0.2 full time equivalents (FTEs) – Operations
0.2 FTEs – Maintenance
0.1 FTEs – Miscellaneous
Cost of energy to produce 1 kWh of power <$0.10 (energy off the grid $0.05, but a premium is paid for green power).
More FTEs used during transition from FCE to County operations and maintenance staff.
5. Produce minimal air emissions – natural gas and digester gas (LSG/ADG)
CO < 10 ppmV
NOx < 2 ppmV
NMHC < 1 ppmV
Testing scheduled for summer 2005. Testing in summer 2004 met these criteria.
6. Produce wastewater/drain water with no adverse impacts to the treatment plant
Water treatment system brine
Cooling water
Condensate
Water tested in May 2005 had acceptable water quality.
7. Operate fuel cell on a continuous basis
Downtime for maintenance and troubleshooting limited to 20 hours/week
Downtime for maintenance has been
Presentation for WEFTEC conference, Nov. 2, 2005Session #79 - Residuals and Biosolids Management: Biogas Utilization/C0-digestion
Page 14 of 20

Table 3 – Performance Goals and Metrics
Performance Goal Metric Results (remain at hot standby condition).
Availability of > 80%
Run 85% of the time at full net power for 2 years
Determine frequency of downtime and length of time out of service.
less than 20 hours/week. Downtime due to trips from digester gas to natural gas more prevalent (7 in Quarter 1, 2005). Average 20 hours downtime for each trip.
8. Operate fuel cell efficiently
45% efficiency on natural gas
45% efficiency on digester gas
Efficiency is less than 45%.
9. Manage system with ease remotely
Monitor and control system through SCADA at the operations building at FCE’s office in Danbury, Connecticut.
Remote monitoring done successfully.
10. Remove hydrogen sulfide effectively from digester gas
Remove hydrogen sulfide to < 10 ppmV on inlet gas.
Polisher exhaust < 10 ppmV
11. Reasonable costs to dispose of solid waste
SulfaTreat® system lasts for 0.6 years before replacement.
Carbon systems (both natural gas and digester gas systems) last for 0.3 years before replacement.
Fuel cell lasts for 3 years before replacement.
Preconverter catalyst lasts for 5 years before replacement.
Oxidizer catalyst lasts for 5 years before replacement.
Exhaust gas polisher lasts for 5 years before replacement.
Deoxidizer catalyst lasts for 5 years before replacement.
Fuel cell not negatively affected by digester gas.
SulfaTreat® catalyst replaced at end of Quarter 1, 2005. Costs were 2 days of labor. Material was reused on site, so there were no disposal costs.
Presentation for WEFTEC conference, Nov. 2, 2005Session #79 - Residuals and Biosolids Management: Biogas Utilization/C0-digestion
Page 15 of 20

Table 3 – Performance Goals and Metrics
Performance Goal Metric Results
Deactivated catalysts (from preconverter, oxidizer, deoxidizer and exhaust gas polisher) (recover precious metals).
12. Recover heat successfully
Recover 1.4M Btu /hr of heat
(13,800 lbs gas/hr)
650°F out of stack
Heat recovery unit not yet used successfully.
13. Achieve output turndown
25% to 100% Demonstrated on a regular basis
14. Achieve output ramp rate
0.5 kW/min (cold start) Achieved in 2004 and demonstrated on a regular basis.
15. Meet design service life
10,000 hours (1.15 years) Not measured yet. As of March 31, 2005, the fuel cell has operated for 7,100 hours with no problems or performance degradation.
16. Able to restart from a trip
Trip recovery to back on load in approximately 10 hours
Achieved in 2004. and demonstrated on a regular basis
17. Able to quickly start Hot start in 10 hours (standby to rated output)
Achieved in 2004.
PROGRAM BUDGET
King County is the plant owner, operator, and provider of the host site. County personnel also managed site construction and installation activities. FCE is under contract to King County to manufacture, deliver, start up the fuel cell power plant as well as the equipment for digester gas treatment. FCE also contributed a significant cost share to help fund the project. In addition, FCE has trained on-site County staff to operate and maintain the fuel cell system. Total plant cost to date is approximately $22.8 million. Of that total, $12.5 million was provided through a grant from the U.S. EPA. FCE’s contract for the project totaled $18.96 million, of which half, or $9.48 million, was cost-shared by FCE. King County is providing fuel in addition to site labor and operators as in-kind support for fuel cell installation and construction, engineering and program assistance, County staff and lab expenses, and sunk costs for the MC Power
Presentation for WEFTEC conference, Nov. 2, 2005Session #79 - Residuals and Biosolids Management: Biogas Utilization/C0-digestion
Page 16 of 20

procurement (before MC Power went out of business). Since King County is interested in pursuing long-term fuel cell operation beyond two years, the County has established a “preferred” customer relationship with FCE for future fuel cell stack replacements.
LESSONS LEARNED
The fuel cell power plant supplied by FuelCell Energy is a first-of-a-kind design. As a result, some problems were encountered which extended the period for completion. Feedback from the construction and commissioning of the power plant are being utilized to improve the design for future units. Operational data to date indicate favorable results on both natural gas and digester gas. The fuel cell power plant and its ancillary components do operate and produce consistent power, with low emissions, provided that a reliable gas supply is available.
Fuel Cell Stack
No problems have been recorded with the fuel cell stack.
Waste Heat Recovery Unit
The heat recovery unit that uses waste heat from the fuel cell to heat the digesters was not in operation during the first year of testing.
Electrical Balance of Plant (EBOP)
No problems have been recorded with the EBOP.
Gas Supply
When the King County digester gas scrubber exhaust gas does not meet the specified PSE Btu content, the scrubbed gas is diverted back to the main ADG header and ultimately to the flares when sufficient pressure has been reached. The divert events cause the methane content of the raw digester gas in the ADG header to increase abruptly. This rapid increase is not easily accommodated by the fuel cell as the change in methane content requires a change in gas flow to supply the same amount of fuel to the fuel cell. FCE has successfully modified their control system to automatically switch to natural gas when a divert event occurs. Once the divert event is over, it takes approximately 6 hours to re-establish the fuel cell to digester gas. When the cogeneration system is in operation in late 2005, King County will no longer sell the scrubbed gas to PSE; therefore, divert events should no longer occur.
In addition to this internal fuel supply challenge, King County and FCE were also concerned about concentrations of carbonyl sulfide (COS) in the natural gas that it receives from PSE (the second back-up gas supply). King County added a second cold gas desulfurizer vessel for the COS treatment.
Presentation for WEFTEC conference, Nov. 2, 2005Session #79 - Residuals and Biosolids Management: Biogas Utilization/C0-digestion
Page 17 of 20

Permitting
Few permits were required for the project. Due to the clean characteristics of the fuel cell emissions, the project was exempted from air permit requirements by the Puget Sound Clean Air Agency. A building permit and a conditional use permit were obtained from the City of Renton.
Interconnection
Resolving interconnection issues with PSE was challenging and lengthy. The design team began discussions with PSE early in the project, which was essential. It is possible that the long negotiation experienced with the interconnect agreement is not unique to fuel cells, but an issue that all distributed generation technology may face with local utilities.
The fuel cell is not isolated from the PSE grid, requiring coordination with the utility for interconnect. The PSE grid provides a voltage and frequency reference point that is required by the fuel cell when operating in parallel to the grid. The local utility and national interconnection standards require generators operating in parallel to take themselves off-line when voltage and frequency deviations in the grid from designed conditions are observed by the generator. The fuel cell electrical balance of plant senses when these variations in voltage and frequency in the grid exceed certain thresholds and stops generating power to comply with the utility’s safety and interconnection rules.
PSE’s interconnect also was required for revenue collection. As various demands are placed upon the PSE grid from end users, PSE must ensure there is enough power for all. When the fuel cell is on-line, the rates are different than when the fuel cell is off-line. This enables PSE to keep up with the power demand. The interconnect agreement is the vehicle to establish different rates through revenue class metering.
In addition to PSE, the local electrical inspector from the City of Renton was unfamiliar with fuel cells. He had knowledge of the National Electrical Code (NEC) that applies specifically to residential fuel cells, not the class of the Direct FuelCell installed. The uniqueness of the project prolonged the inspection process. A third-party electrical inspector was hired to help facilitate inspection requirements between the City of Renton and King County.
Other states, such as California, have instituted standard interconnection standards for on-site generation equipment such as fuel cells, where manufacturers can pre-certify their equipment against these standards and significantly simplify the interconnection process.
King County’s experience points to the larger need for education and training, even among industry professionals. Inexperience and discomfort with unfamiliar technology are a barrier hindering the deployment of a distributed resource and will be confronted project by project, jurisdiction by jurisdiction, until the technology becomes more common. Early and frequent communication with local inspectors and utilities can help smooth the process as the permitting and interconnection agreements may be complex and/or cumbersome.
Presentation for WEFTEC conference, Nov. 2, 2005Session #79 - Residuals and Biosolids Management: Biogas Utilization/C0-digestion
Page 18 of 20
Shift of Operations from FCE to King County
In March 2005, King County assigned a lead operator, or senior-in-charge, to the fuel cell project.
Hands-on training of the King County Operations and Maintenance (O&M) staff by FCE occurred during January and February of 2005. Hands-on training required operators to have completed the weeklong classroom portion of training and then spend 40 hours with an FCE employee in the control room and plant while meeting all requirements of the Operator qualifications card. A total of 7 people completed this training.
Other Challenges
As expected, the lessons learned were not restricted to the fuel cell power plant; issues during installation and constructability of the heat recovery system were also experienced. As stated, these and other issues are typical and expected when installing and starting power generation projects. Other previously noted startup and commissioning issues included addition of a water booster pump that was required to maintain sufficient pressure in the water treatment system and the new COS removal vessel.
Changes to Water for Digester Gas Compressor
Currently, the cooling water for the digester gas compressor is reuse water, or Renton city nonpotable water (C2) if the reuse water system is not in operation. The water flow to the compressor is approximately 30 gpm. To save money, the water source will be changed to disinfected secondary effluent (C3). C3 was used originally to cool the digester gas compressor, but significant biofouling in the compressor required frequent compressor cleaning. Manual strainers were installed to mitigate the biofouling, but the strainers had to be cleaned several times a day. The new C3 water will come from a location that has an automatic strainer. Strained C3 water is used in other compressors on the plant site, so C3 water is not expected to cause a problem. No biofouling agent (e.g., sodium hypochlorite) will be added to the C3 water as sodium hypochlorite is corrosive and the compressor is black steel which is susceptible to corrosion.
PEER REVIEW TEAM
A Peer Review Team was assembled for this project. The team consists of approximately 15 industry experts who meet semi-annually to review data and test results, and advise on any changes to the testing program. The Peer Review Team members are from other wastewater utilities, academia, consulting firms, power companies, and regulatory agencies.
CONCLUSIONS
The project is well on its way to achieve the project objectives and has demonstrated exceptional operational availability, which is exceeding expectations. Power production is constant and power quality high. The fuel cell output did not decrease when operating on digester gas, which is required with some other fuel cell technologies.
Presentation for WEFTEC conference, Nov. 2, 2005Session #79 - Residuals and Biosolids Management: Biogas Utilization/C0-digestion
Page 19 of 20

The most challenging aspect of the project has been the methane content variation in the gas supply. The control enhancement to quickly switch between natural gas and digester gas has been proven valuable to maximize uptime and availability. The waste heat recovery system will be operated more regularly to maximize thermal efficiency. The team will continue to collect data, including electrical power output, waste heat recovery, efficiency, and emissions. Also, media life, replacement, and disposal will be tracked. Finally, the team will develop an good understanding of how well operation of a fuel cell integrates with the normal operation of a wastewater treatment plant.
Fuel cell technology is an excellent choice for installations where low emissions are desired and a fuel source with consistent quality and quantity is available. Fuel cells are evolving rapidly. At the current stage of development of fuel cells in today’s market in the United States, fuel cells may not be competitive on a capital cost basis with standard power generation technologies unless subsidies are available.
REFERENCES
Rastler, Dan. King County Carbonate Fuel Cell Demonstration Project, Electric Power Research Institute (EPRI), February 2005.
Presentation for WEFTEC conference, Nov. 2, 2005Session #79 - Residuals and Biosolids Management: Biogas Utilization/C0-digestion
Page 20 of 20