lessons learned from the navigation guide
TRANSCRIPT

Lessons learned from the Navigation Guide: Risk of bias tools for exposure metrics in epidemiology studies
Photo : Original illustration by Patrick Lynch, Yale University
1
Juleen LamDecember 16, 2015
EPA Advancing Systematic Review for Chemical Risk AssessmentCrystal City, Arlington
BRIDGING CLINICAL & ENVIRONMENTAL HEALTH
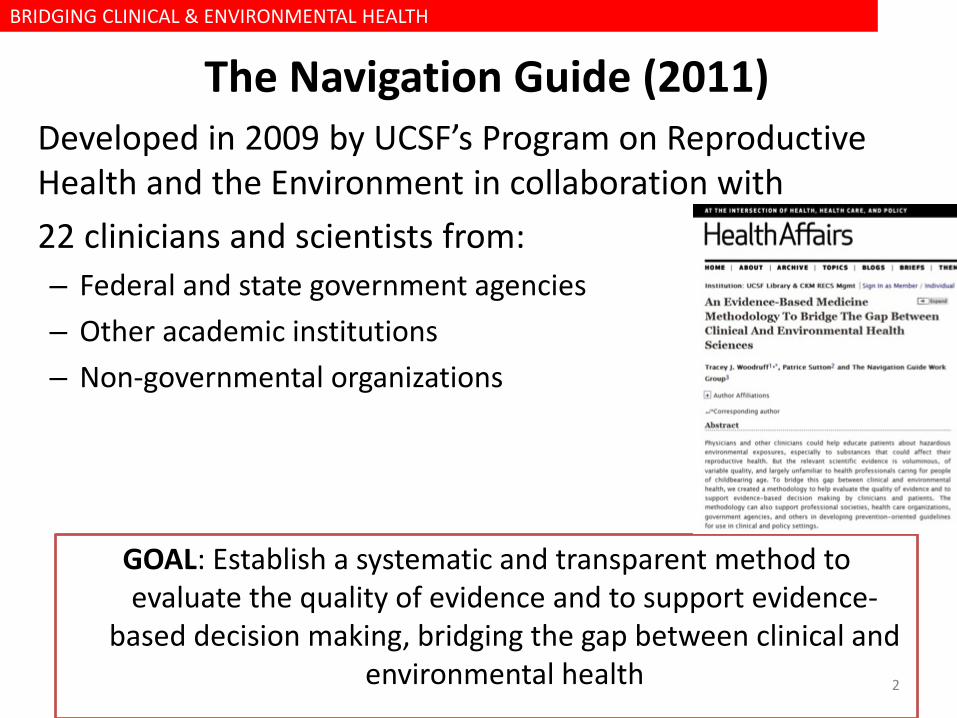
The Navigation Guide (2011)Developed in 2009 by UCSF’s Program on Reproductive Health and the Environment in collaboration with 22 clinicians and scientists from:– Federal and state government agencies– Other academic institutions– Non-governmental organizations
2
GOAL: Establish a systematic and transparent method to evaluate the quality of evidence and to support evidence-
based decision making, bridging the gap between clinical and environmental health

Clinical sciences have faced and addressed these same challenges
Evidence-Based Medicine (EBM)EBM aims to apply the best available evidence gained from the scientific method to clinical decision making
• Developed to prevent harm from treatment decisions being made without strong basis in the evidence
• Transparent and systematic approach to evaluating evidence
3
Models for Navigation Guide

How can we better evaluate and synthesize environmental health science to inform decision-
making by policy makers and clinicians?
4

Overview of the Methodology
5
6 Navigation Guide case studies to date 3 completed case studies 5 publications & 1 manuscript under review 2 publications in draft 1 case study initiated November 2015
Recognition from the National Academy of Sciences (Nav Guide methodology noted in 2 recent reports)
Accelerating trajectory of uptake of systematic review methods in environmental health.
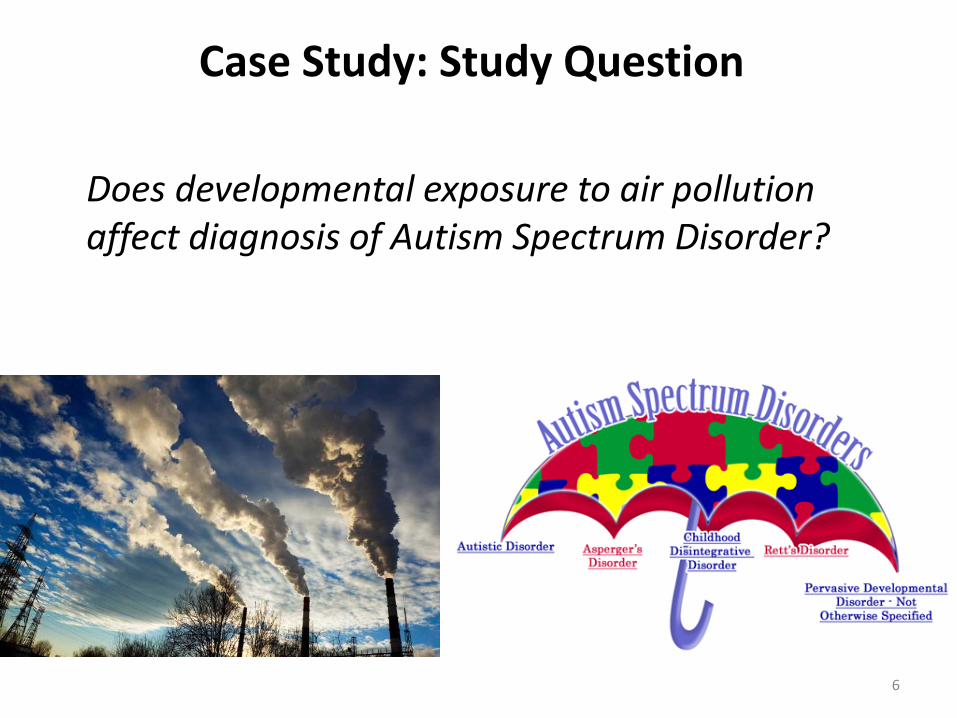
Case Study: Study Question
Does developmental exposure to air pollution affect diagnosis of Autism Spectrum Disorder?
6
Case study: Review team
• Review team varied topic experts– Epidemiology– Air pollution/exposure assessment– Autism– Biostatistics– Systematic review methodology
• All review team members participated and contributed to case study
• EEARN Topic expert advisors– Advice, input along the process 7

Case Study: PECO Statement• Population: Humans
• Exposure: Any developmental exposure to air pollution that occurred prior to the ASD assessment
• Comparator: Humans exposed to lower levels of air pollution than the more highly exposure humans
• Outcome: Any clinical diagnosis or other continuous or dichotomous scale assessment of ASD
8
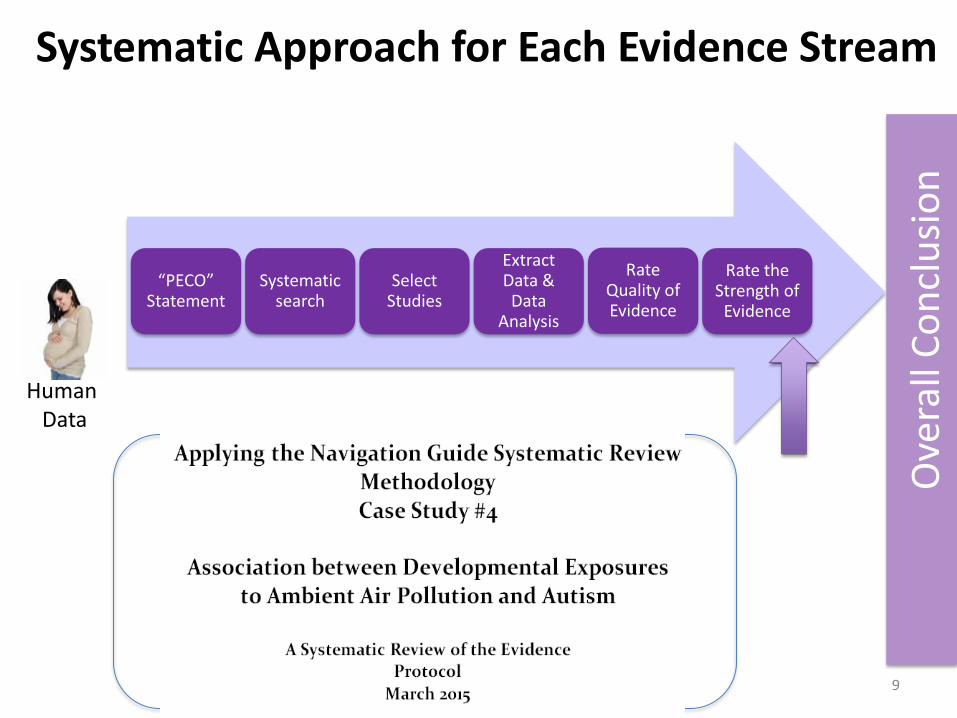
Systematic Approach for Each Evidence Stream
Human Data
“PECO” Statement
Systematic search
Select Studies
Extract Data & Data
Analysis
Rate Quality of Evidence
Rate the Strength of
Evidence
Ove
rall
Conc
lusio
n
9
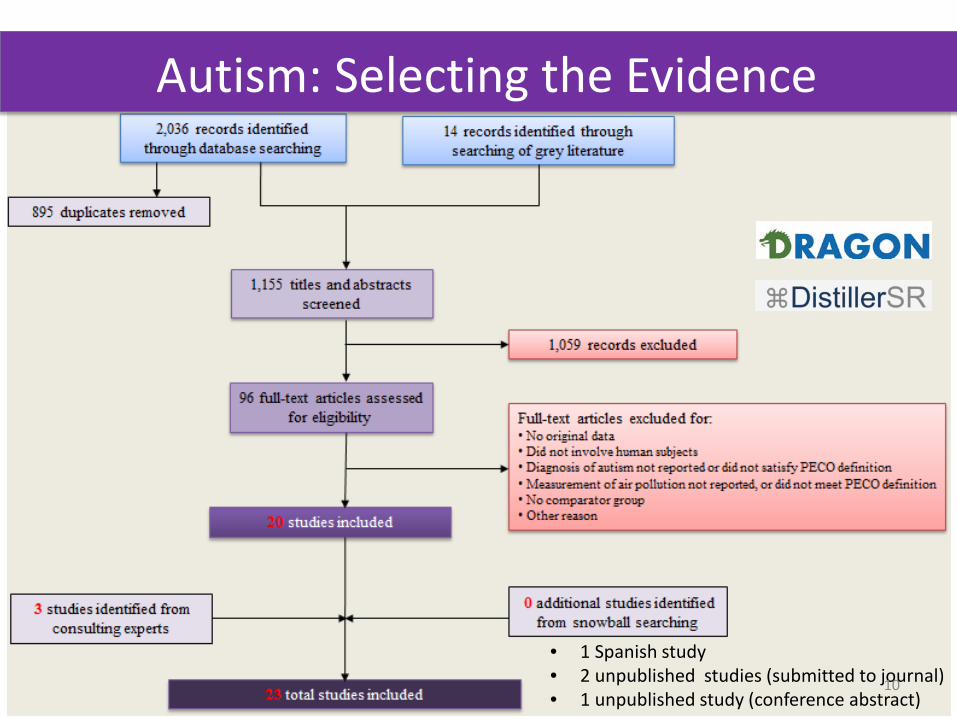
Autism: Selecting the Evidence
• 1 Spanish study• 2 unpublished studies (submitted to journal)• 1 unpublished study (conference abstract)
10

0 0
Risk of Bias (vs Random Error)
1. Bias
True Effect
2. Random Error
True Effect
11
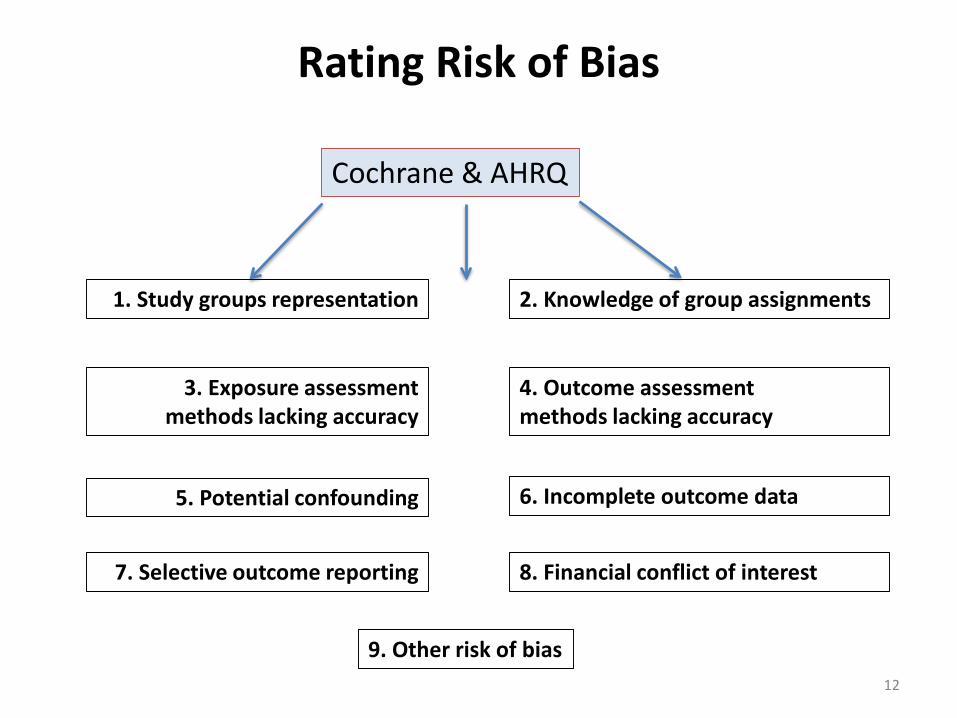
Rating Risk of Bias
Cochrane & AHRQ
1. Study groups representation 2. Knowledge of group assignments
3. Exposure assessment methods lacking accuracy
4. Outcome assessment methods lacking accuracy
5. Potential confounding 6. Incomplete outcome data
7. Selective outcome reporting 8. Financial conflict of interest
9. Other risk of bias12

Rating Risk of Bias
Cochrane & AHRQ
1. Study groups representation 2. Knowledge of group assignments
3. Exposure assessment methods lacking accuracy
4. Outcome assessment methods lacking accuracy
5. Potential confounding 6. Incomplete outcome data
7. Selective outcome reporting 8. Financial conflict of interest
9. Other risk of bias13

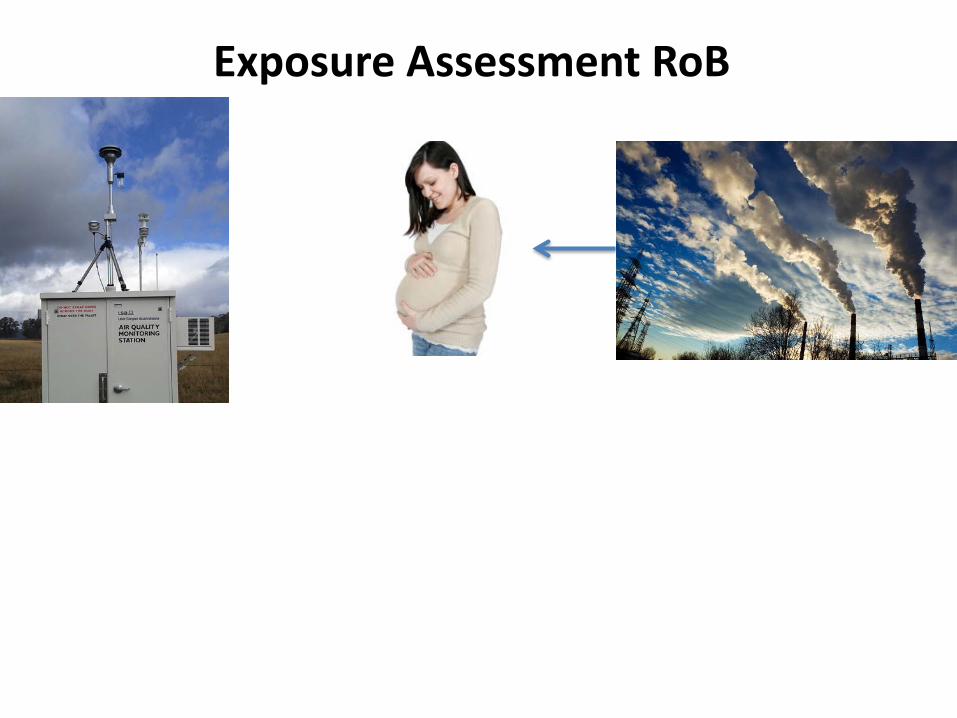
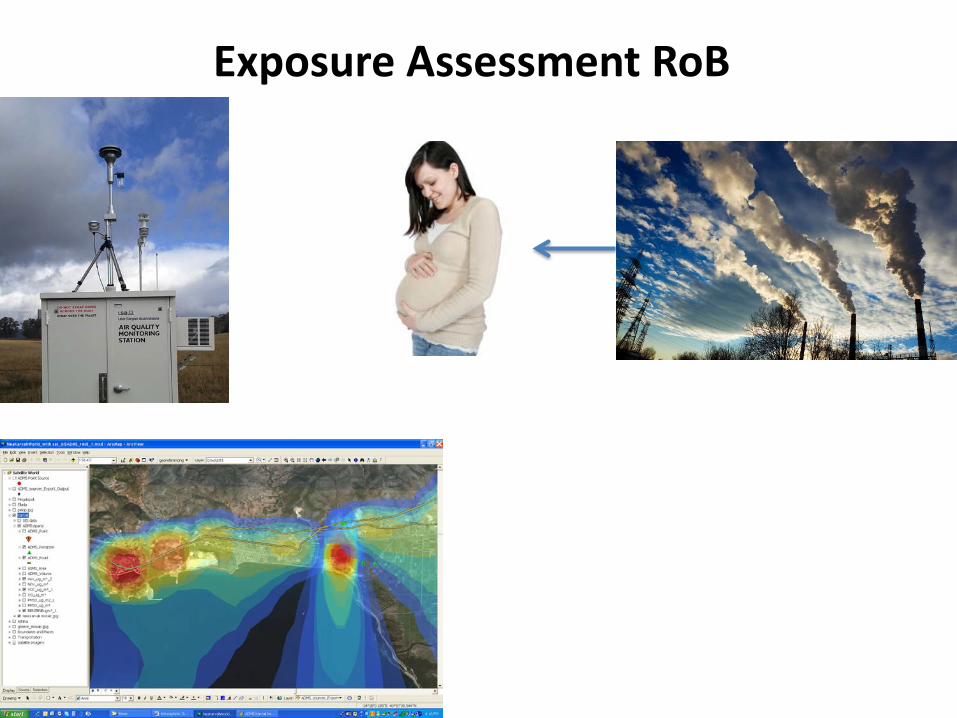
Exposure Assessment Risk of Bias
The reviewers judge that there is low risk of exposure misclassification if: • There is high confidence in the accuracy of the exposure
assessment methods, such as methods that have been tested for validity and reliability in measuring the targeted exposure; or
• Less-established or less direct exposure measurements are validated against well-established or direct methods
14

15
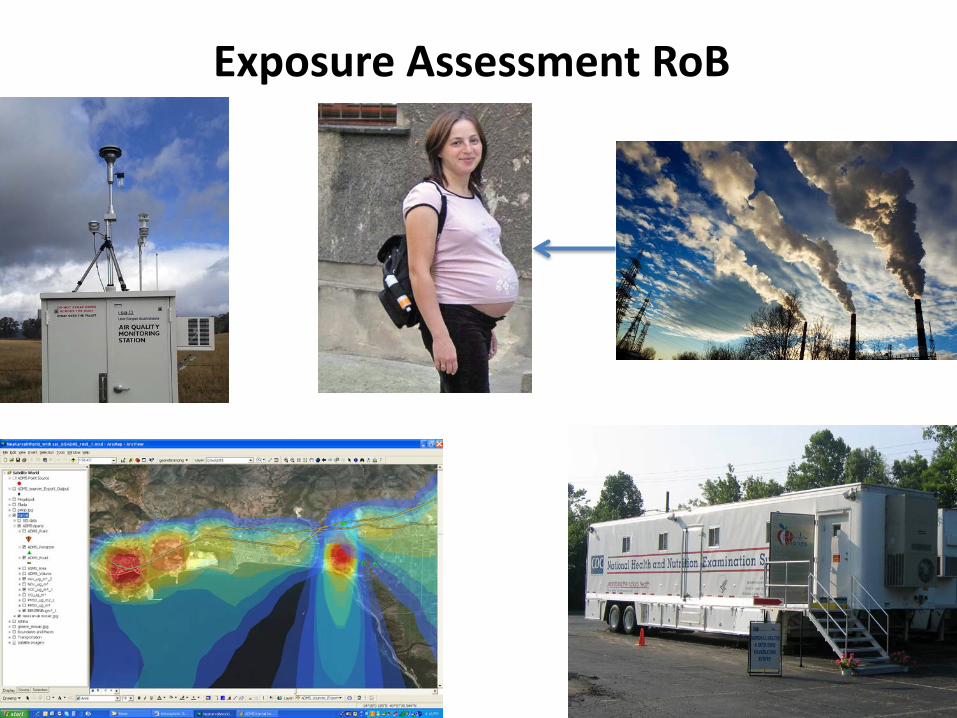
Exposure Assessment RoB
16
Exposure Assessment RoB
17
Exposure Assessment RoB

18
Exposure Assessment RoB
19
Exposure Assessment RoB

Exposure Assessment RoB
20
• Separately evaluated each chemical
• List of considerations by metric, identified by epidemiologists and air pollution experts:• Quality of input data for computer model
Was exposure a surrogate for air pollution (i.e., distance to freeway)?Has metric been validated for scenario of use?Temporal coverage in studyHandling of missing dataAddress completeness (models)
•••••
• NOT a checklist—but used to guide reviewer’s decisions on rating risk of bias for each data set• Justification and comparison among reviewers
Standardized ratings across studies with similar metrics/chemicals subsequent to discussion
•

Exposure Assessment RoB
21
• Developed initial ratings for certain metric/chemicals• US EPA evaluation of confidence in NATA data by chemical based on
ASPEN modeling, Rosenbaum (2011) • Discussion/consensus among review authors to develop initial
ratings (i.e., TRI data, distance to freeway)Study-specific design considerations potentially bumped up ratings
•
Modeling HAPSInitial rules for rating each chemical
Consideration of study-specific characteristics• Year data collected• Data validation performed• Other exposure information incorporated
Modeling HAPSPotential upgrade of rating

RoB Ratings
22

RoB Ratings—Exposure Assessment
23
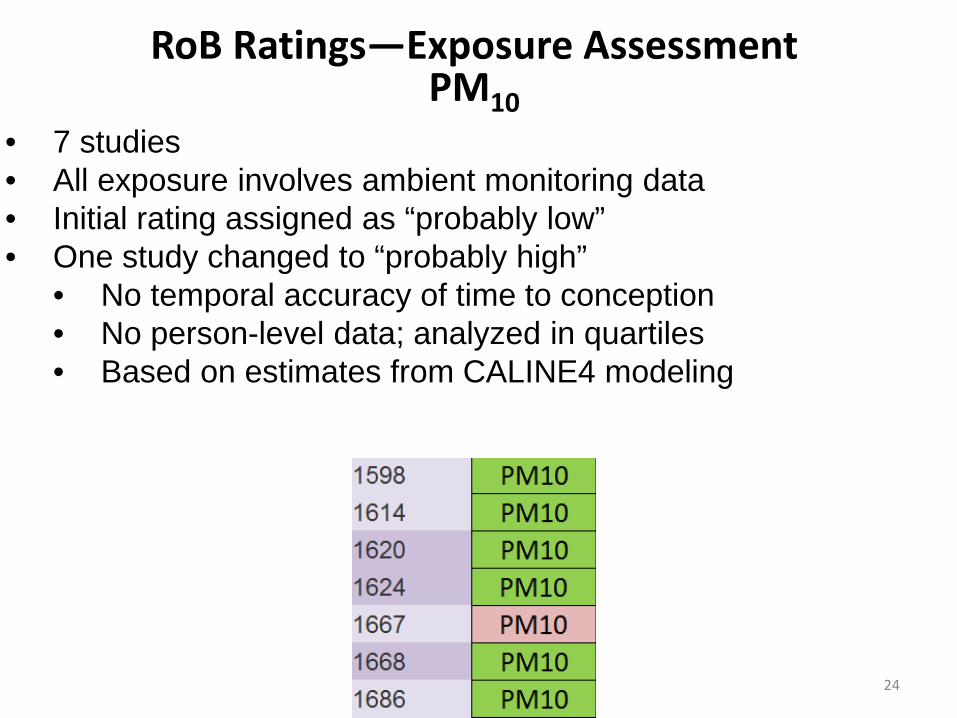
RoB Ratings—Exposure AssessmentPM10
• 7 studies• All exposure involves ambient monitoring data• Initial rating assigned as “probably low”• One study changed to “probably high”
• No temporal accuracy of time to conception• No person-level data; analyzed in quartiles• Based on estimates from CALINE4 modeling
24

RoB Ratings—Exposure AssessmentPM2.5
• 4 studies• Initial rating assigned as “probably low”• Same study changed to “probably high”
25
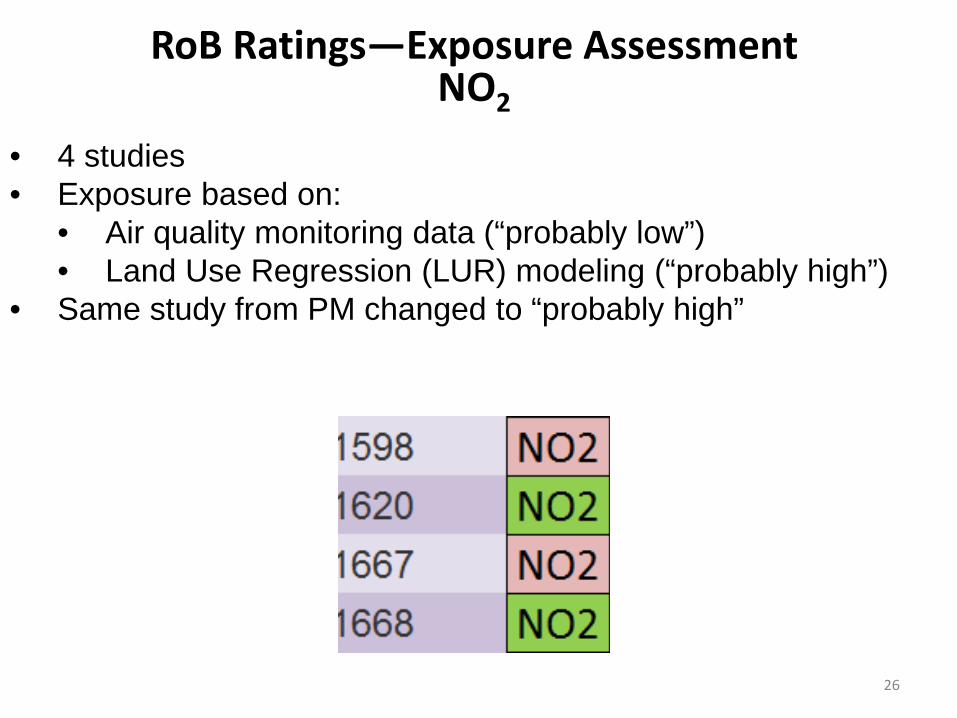
RoB Ratings—Exposure AssessmentNO2
• 4 studies• Exposure based on:
• Air quality monitoring data (“probably low”)• Land Use Regression (LUR) modeling (“probably high”)
• Same study from PM changed to “probably high”
26
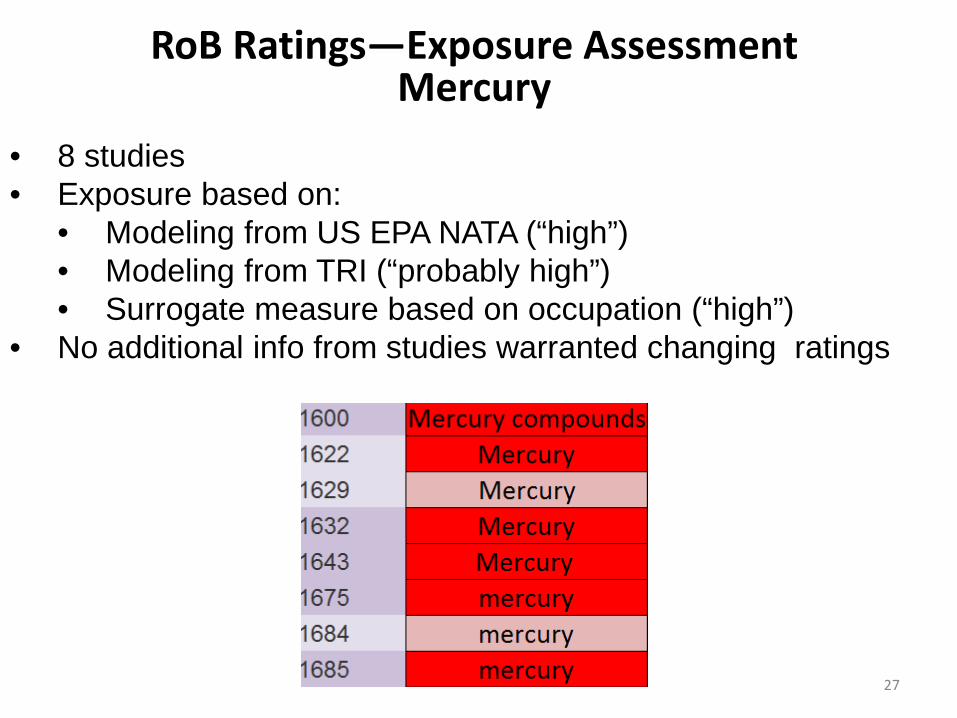
RoB Ratings—Exposure AssessmentMercury
• 8 studies• Exposure based on:
• Modeling from US EPA NATA (“high”)• Modeling from TRI (“probably high”)• Surrogate measure based on occupation (“high”)
• No additional info from studies warranted changing ratings
27
Lessons Learned
• Developed exposure assessment tool sufficient for this case study, but modifications likely needed for broader application
• Standard approaches to measure and report air pollution data• Determining/availability of combinable data challenging• Expert elicitation is time consuming and can be difficult, but is
worth it• Expert opinion a necessity; systematic review process
makes these decisions transparent and documented• Process of training new review authors was very
informative to understand the complexity of assessing the overall body of literature
28
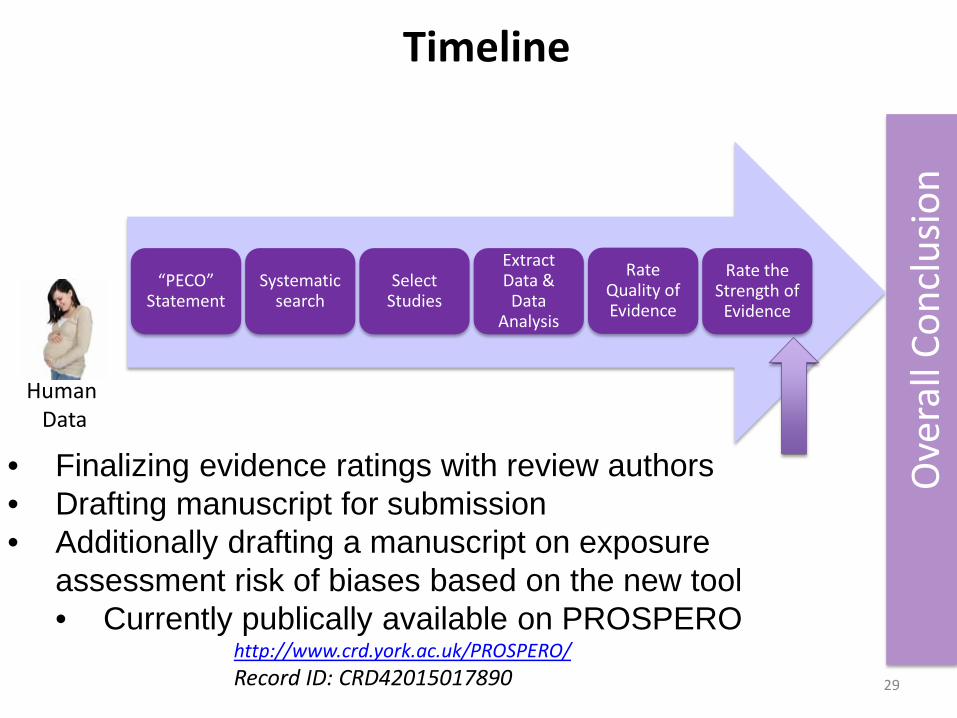
Timeline
Human Data
“PECO” Statement
Systematic search
Select Studies
Extract Data & Data
Analysis
Rate Quality of Evidence
Rate the Strength of
Evidence
Ove
rall
Conc
lusio
n
• Finalizing evidence ratings with review authors• Drafting manuscript for submission• Additionally drafting a manuscript on exposure
assessment risk of biases based on the new tool• Currently publically available on PROSPERO
http://www.crd.york.ac.uk/PROSPERO/Record ID: CRD42015017890 29
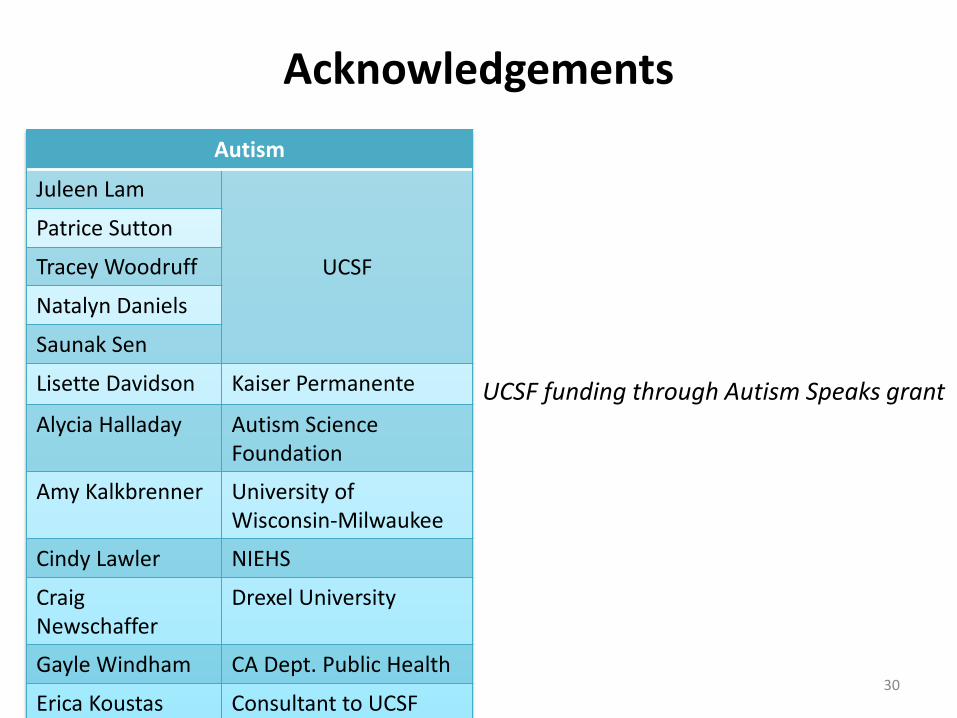
AcknowledgementsAutism
Juleen Lam
Patrice Sutton
Tracey Woodruff UCSF
Natalyn Daniels
Saunak Sen
Lisette Davidson Kaiser Permanente
Alycia Halladay Autism Science Foundation
Amy Kalkbrenner University of Wisconsin-Milwaukee
Cindy Lawler NIEHS
Craig Newschaffer
Drexel University
Gayle Windham CA Dept. Public Health
Erica Koustas Consultant to UCSF
UCSF funding through Autism Speaks grant
30