lessons learned building teamtrak: an urban/outdoor mobile ad hoc
TRANSCRIPT

Lessons Learned Building TeamTrak: An Urban/Outdoor Mobile Ad HocNetwork Testbed
Jeffrey Hemmes, Douglas Thain, Christian Poellabauer,Christopher Moretti, Phil Snowberger, and Brendan McNutt
Technical Report 2007-02Department of Computer Science and Engineering, University of Notre Dame
Abstract
The majority of research in the area of mobile ad hoc networks and wireless sensor networks rely on the use of simulationsfor evaluation purposes. While a number of powerful simulation tools have been developed for this purpose, only recentlyhas the need for physical implementations of mobile systems and applications been widely identified and accepted in theliterature. In recognition of this need, and to further our research objectives in the area of wireless sensor networks andmobile cooperative systems, we have built the TeamTrak mobile test bed, which enables us to gain real-world experiencewith research concepts as we develop them and use results from outdoor field tests to further enhance the test bed itselfusing a feedback-based software development model. The advantages to TeamTrak are the ability to easily add varioussensor devices to the basic platform and conduct small- to intermediate-scale outdoor field tests using portable software oncommodity hardware devices. From our experiences building the testbed, we have gained significant insight towards thesuitability of mobile ad hoc networks to real-world applications such as search and rescue and cartography and identifiedseveral open problems for further research.
1 Introduction
The study of mobile sensor networks and ad hoc networks in general has become very popular over the last severalyears, with an abundance of published work in the area of routing protocols, energy conservation, peer-to-peer searchingalgorithms, and other related areas. The majority of this research relies on the use of modeling and simulation for evaluationtasks. While simulations are quite valuable for demonstrating proof of concept and testing properties such as scalabilitythat would be otherwise infeasible to test in practice using physical hardware, they frequently rely on models that do notadequately account for complex environmental effects such as interference and radio signal propagation. Failing to accountfor the limitations of such models can affect the credibility of simulation results [21]. Even worse, an oversimplified modelcan paint an overly rosy picture of a system under development. A number of testbeds, such as mLab [14], have attempted tobridge the gap between simulations and field tests by including wireless network connectivity in the hardware platform, butthese systems are indoors and rely on simulations to evaluate interactions due to mobility.
It is our experience that while simulations are critical to developing mobile systems, there is no substitute for live fieldtesting under realistic operational conditions. Nobody seriously argues against the use of outdoor field tests; rather, the mostfrequently encountered argument is that such tests are too impractical or cost-prohibitive for most researchers or softwaredevelopers [18]. This is certainly true for large-scale sensor networks; programming and instrumenting the nodes manuallyand deploying the system to some interesting physical environment is not an easy task. However, the notion that suchexperiments are necessarily expensive or logistically challenging can be somewhat overstated. More importantly, testingmobile applications with a system of even modest scale using relatively inexpensive hardware can reap substantial benefitsin understanding the effects of environmental factors and interactions due to mobility that often cannot be fully described insimulations.
1This research is partially supported by DoD Defense University Research Instrumentation (DURIP) Grant Number W911NF-06-1-0120
1
15:10:00
GPS
Wi−Fi
BluetoothWi−Fi
Bluetooth
GPS GPS
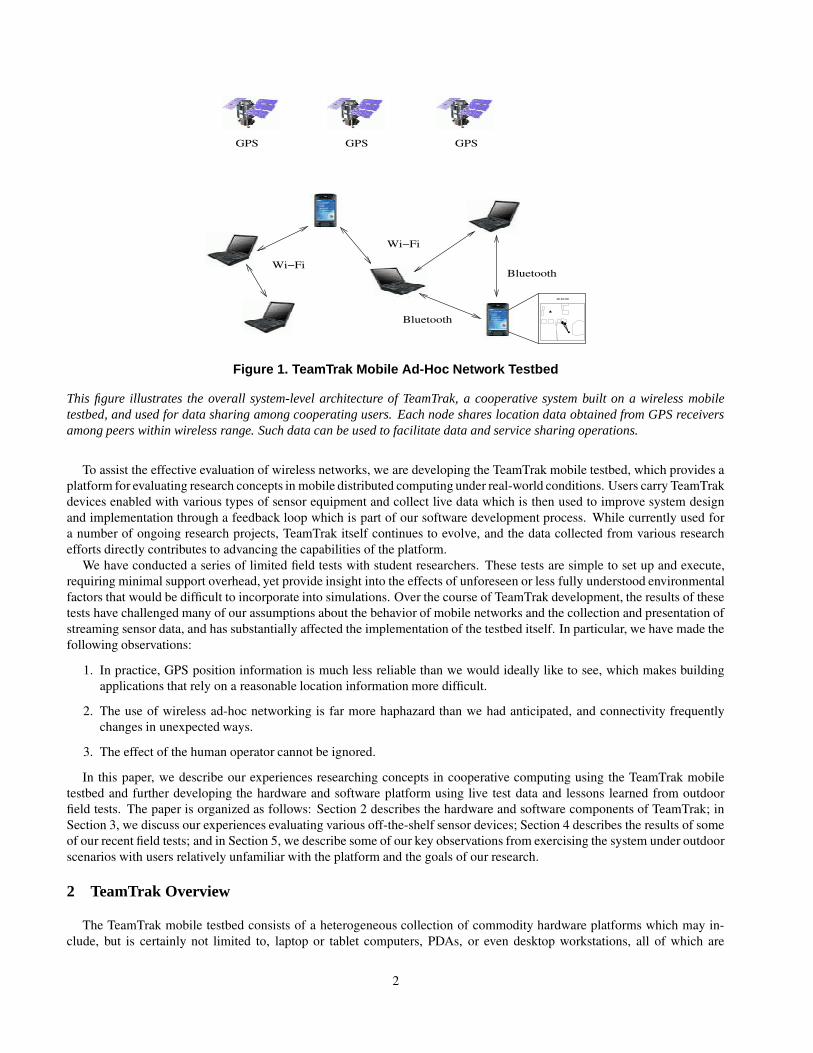
Figure 1. TeamTrak Mobile Ad-Hoc Network Testbed
This figure illustrates the overall system-level architecture of TeamTrak, a cooperative system built on a wireless mobiletestbed, and used for data sharing among cooperating users. Each node shares location data obtained from GPS receiversamong peers within wireless range. Such data can be used to facilitate data and service sharing operations.
To assist the effective evaluation of wireless networks, we are developing the TeamTrak mobile testbed, which provides aplatform for evaluating research concepts in mobile distributed computing under real-world conditions. Users carry TeamTrakdevices enabled with various types of sensor equipment and collect live data which is then used to improve system designand implementation through a feedback loop which is part of our software development process. While currently used fora number of ongoing research projects, TeamTrak itself continues to evolve, and the data collected from various researchefforts directly contributes to advancing the capabilities of the platform.
We have conducted a series of limited field tests with student researchers. These tests are simple to set up and execute,requiring minimal support overhead, yet provide insight into the effects of unforeseen or less fully understood environmentalfactors that would be difficult to incorporate into simulations. Over the course of TeamTrak development, the results of thesetests have challenged many of our assumptions about the behavior of mobile networks and the collection and presentation ofstreaming sensor data, and has substantially affected the implementation of the testbed itself. In particular, we have made thefollowing observations:
1. In practice, GPS position information is much less reliable than we would ideally like to see, which makes buildingapplications that rely on a reasonable location information more difficult.
2. The use of wireless ad-hoc networking is far more haphazard than we had anticipated, and connectivity frequentlychanges in unexpected ways.
3. The effect of the human operator cannot be ignored.
In this paper, we describe our experiences researching concepts in cooperative computing using the TeamTrak mobiletestbed and further developing the hardware and software platform using live test data and lessons learned from outdoorfield tests. The paper is organized as follows: Section 2 describes the hardware and software components of TeamTrak; inSection 3, we discuss our experiences evaluating various off-the-shelf sensor devices; Section 4 describes the results of someof our recent field tests; and in Section 5, we describe some of our key observations from exercising the system under outdoorscenarios with users relatively unfamiliar with the platform and the goals of our research.
2 TeamTrak Overview
The TeamTrak mobile testbed consists of a heterogeneous collection of commodity hardware platforms which may in-clude, but is certainly not limited to, laptop or tablet computers, PDAs, or even desktop workstations, all of which are
2
32 tablets:Lenovo X41
On Helmet:Garmin GPS-18Watchport CameraPNI V2Xe Compass
On Foot:SparkFun v5Accelerometer
8 handhelds:HP iPAQhx2795b
In Pocket:HP BluetoothNav System
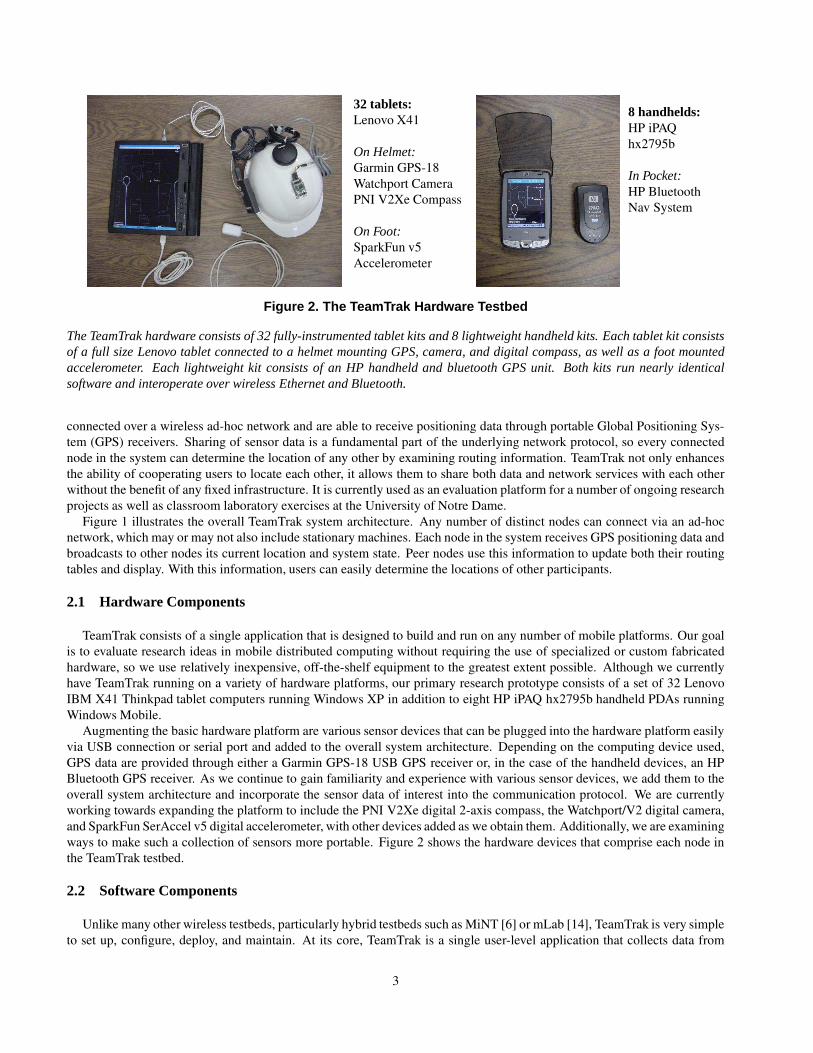
Figure 2. The TeamTrak Hardware Testbed
The TeamTrak hardware consists of 32 fully-instrumented tablet kits and 8 lightweight handheld kits. Each tablet kit consistsof a full size Lenovo tablet connected to a helmet mounting GPS, camera, and digital compass, as well as a foot mountedaccelerometer. Each lightweight kit consists of an HP handheld and bluetooth GPS unit. Both kits run nearly identicalsoftware and interoperate over wireless Ethernet and Bluetooth.
connected over a wireless ad-hoc network and are able to receive positioning data through portable Global Positioning Sys-tem (GPS) receivers. Sharing of sensor data is a fundamental part of the underlying network protocol, so every connectednode in the system can determine the location of any other by examining routing information. TeamTrak not only enhancesthe ability of cooperating users to locate each other, it allows them to share both data and network services with each otherwithout the benefit of any fixed infrastructure. It is currently used as an evaluation platform for a number of ongoing researchprojects as well as classroom laboratory exercises at the University of Notre Dame.
Figure 1 illustrates the overall TeamTrak system architecture. Any number of distinct nodes can connect via an ad-hocnetwork, which may or may not also include stationary machines. Each node in the system receives GPS positioning data andbroadcasts to other nodes its current location and system state. Peer nodes use this information to update both their routingtables and display. With this information, users can easily determine the locations of other participants.
2.1 Hardware Components
TeamTrak consists of a single application that is designed to build and run on any number of mobile platforms. Our goalis to evaluate research ideas in mobile distributed computing without requiring the use of specialized or custom fabricatedhardware, so we use relatively inexpensive, off-the-shelf equipment to the greatest extent possible. Although we currentlyhave TeamTrak running on a variety of hardware platforms, our primary research prototype consists of a set of 32 LenovoIBM X41 Thinkpad tablet computers running Windows XP in addition to eight HP iPAQ hx2795b handheld PDAs runningWindows Mobile.
Augmenting the basic hardware platform are various sensor devices that can be plugged into the hardware platform easilyvia USB connection or serial port and added to the overall system architecture. Depending on the computing device used,GPS data are provided through either a Garmin GPS-18 USB GPS receiver or, in the case of the handheld devices, an HPBluetooth GPS receiver. As we continue to gain familiarity and experience with various sensor devices, we add them to theoverall system architecture and incorporate the sensor data of interest into the communication protocol. We are currentlyworking towards expanding the platform to include the PNI V2Xe digital 2-axis compass, the Watchport/V2 digital camera,and SparkFun SerAccel v5 digital accelerometer, with other devices added as we obtain them. Additionally, we are examiningways to make such a collection of sensors more portable. Figure 2 shows the hardware devices that comprise each node inthe TeamTrak testbed.
2.2 Software Components
Unlike many other wireless testbeds, particularly hybrid testbeds such as MiNT [6] or mLab [14], TeamTrak is very simpleto set up, configure, deploy, and maintain. At its core, TeamTrak is a single user-level application that collects data from
3
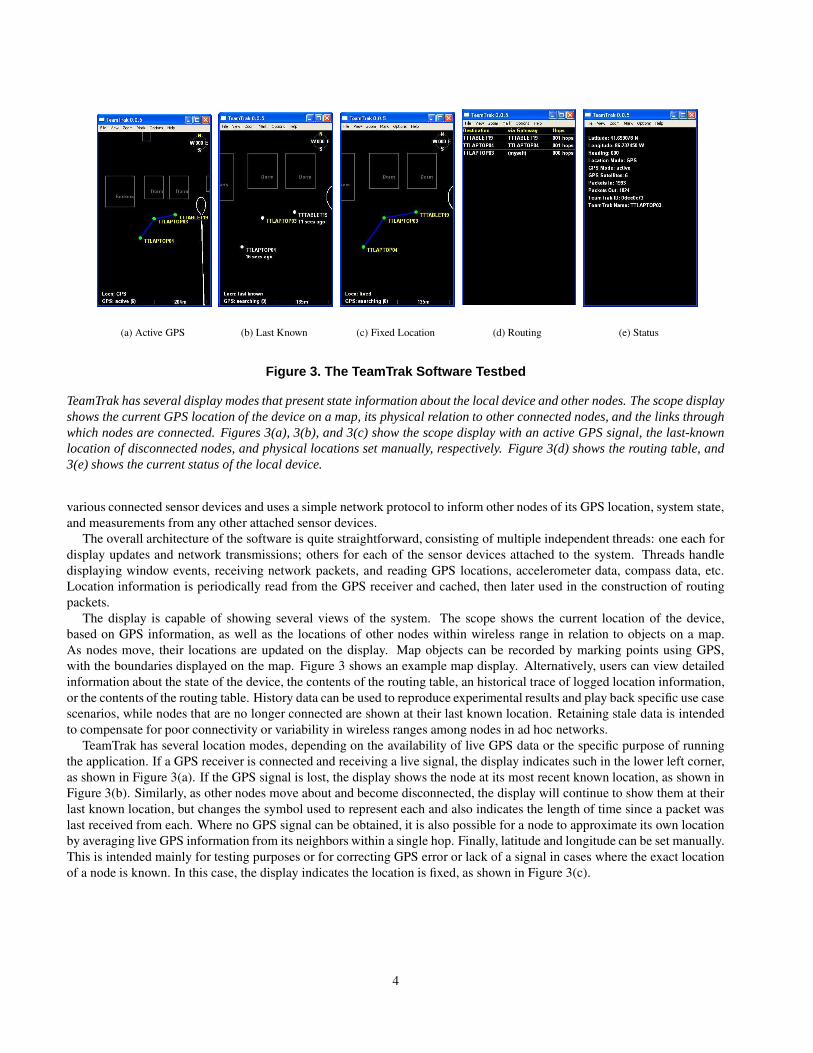
(a) Active GPS (b) Last Known (c) Fixed Location (d) Routing (e) Status
Figure 3. The TeamTrak Software Testbed
TeamTrak has several display modes that present state information about the local device and other nodes. The scope displayshows the current GPS location of the device on a map, its physical relation to other connected nodes, and the links throughwhich nodes are connected. Figures 3(a), 3(b), and 3(c) show the scope display with an active GPS signal, the last-knownlocation of disconnected nodes, and physical locations set manually, respectively. Figure 3(d) shows the routing table, and3(e) shows the current status of the local device.
various connected sensor devices and uses a simple network protocol to inform other nodes of its GPS location, system state,and measurements from any other attached sensor devices.
The overall architecture of the software is quite straightforward, consisting of multiple independent threads: one each fordisplay updates and network transmissions; others for each of the sensor devices attached to the system. Threads handledisplaying window events, receiving network packets, and reading GPS locations, accelerometer data, compass data, etc.Location information is periodically read from the GPS receiver and cached, then later used in the construction of routingpackets.
The display is capable of showing several views of the system. The scope shows the current location of the device,based on GPS information, as well as the locations of other nodes within wireless range in relation to objects on a map.As nodes move, their locations are updated on the display. Map objects can be recorded by marking points using GPS,with the boundaries displayed on the map. Figure 3 shows an example map display. Alternatively, users can view detailedinformation about the state of the device, the contents of the routing table, an historical trace of logged location information,or the contents of the routing table. History data can be used to reproduce experimental results and play back specific use casescenarios, while nodes that are no longer connected are shown at their last known location. Retaining stale data is intendedto compensate for poor connectivity or variability in wireless ranges among nodes in ad hoc networks.
TeamTrak has several location modes, depending on the availability of live GPS data or the specific purpose of runningthe application. If a GPS receiver is connected and receiving a live signal, the display indicates such in the lower left corner,as shown in Figure 3(a). If the GPS signal is lost, the display shows the node at its most recent known location, as shown inFigure 3(b). Similarly, as other nodes move about and become disconnected, the display will continue to show them at theirlast known location, but changes the symbol used to represent each and also indicates the length of time since a packet waslast received from each. Where no GPS signal can be obtained, it is also possible for a node to approximate its own locationby averaging live GPS information from its neighbors within a single hop. Finally, latitude and longitude can be set manually.This is intended mainly for testing purposes or for correcting GPS error or lack of a signal in cases where the exact locationof a node is known. In this case, the display indicates the location is fixed, as shown in Figure 3(c).
4
pointpacket
source
destination
length
protocol
packetheader
destinationdest portsourcesource port
# hops
message
data
(a) Point Packet
loc quality# hopsname
destinationgatewaylocation
routingtableentries
routepacket
source
destination
length
protocol
packetheader
(b) Route Packet
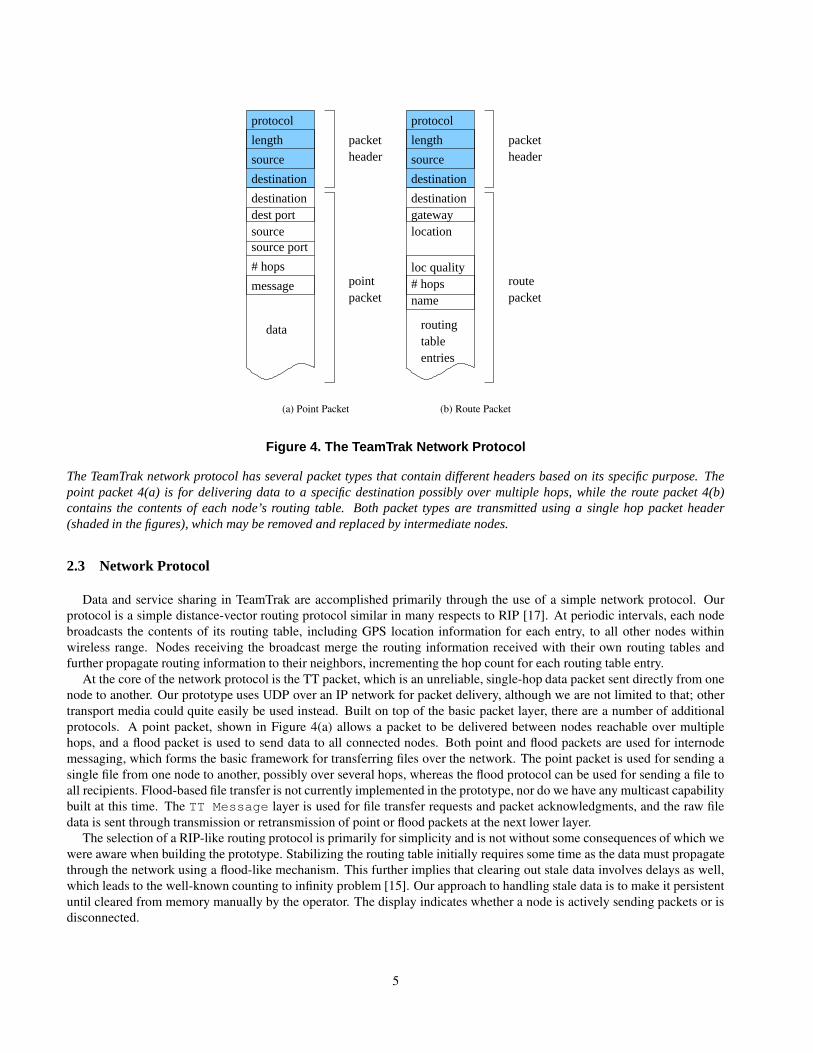
Figure 4. The TeamTrak Network Protocol
The TeamTrak network protocol has several packet types that contain different headers based on its specific purpose. Thepoint packet 4(a) is for delivering data to a specific destination possibly over multiple hops, while the route packet 4(b)contains the contents of each node’s routing table. Both packet types are transmitted using a single hop packet header(shaded in the figures), which may be removed and replaced by intermediate nodes.
2.3 Network Protocol
Data and service sharing in TeamTrak are accomplished primarily through the use of a simple network protocol. Ourprotocol is a simple distance-vector routing protocol similar in many respects to RIP [17]. At periodic intervals, each nodebroadcasts the contents of its routing table, including GPS location information for each entry, to all other nodes withinwireless range. Nodes receiving the broadcast merge the routing information received with their own routing tables andfurther propagate routing information to their neighbors, incrementing the hop count for each routing table entry.
At the core of the network protocol is the TT packet, which is an unreliable, single-hop data packet sent directly from onenode to another. Our prototype uses UDP over an IP network for packet delivery, although we are not limited to that; othertransport media could quite easily be used instead. Built on top of the basic packet layer, there are a number of additionalprotocols. A point packet, shown in Figure 4(a) allows a packet to be delivered between nodes reachable over multiplehops, and a flood packet is used to send data to all connected nodes. Both point and flood packets are used for internodemessaging, which forms the basic framework for transferring files over the network. The point packet is used for sending asingle file from one node to another, possibly over several hops, whereas the flood protocol can be used for sending a file toall recipients. Flood-based file transfer is not currently implemented in the prototype, nor do we have any multicast capabilitybuilt at this time. The TT Message layer is used for file transfer requests and packet acknowledgments, and the raw filedata is sent through transmission or retransmission of point or flood packets at the next lower layer.
The selection of a RIP-like routing protocol is primarily for simplicity and is not without some consequences of which wewere aware when building the prototype. Stabilizing the routing table initially requires some time as the data must propagatethrough the network using a flood-like mechanism. This further implies that clearing out stale data involves delays as well,which leads to the well-known counting to infinity problem [15]. Our approach to handling stale data is to make it persistentuntil cleared from memory manually by the operator. The display indicates whether a node is actively sending packets or isdisconnected.
5
0
10
20
30
40
50
60
70
80
90
100
1 10 100 1000
Cum
ulat
ive
Per
cent
of M
easu
rem
ents
Distance from Average (m)
97
97.5
98
98.5
99
99.5
100
100 150 200 250 300 350 400 450 500
Cum
ulat
ive
Per
cent
of M
easu
rem
ents
Distance from Average (m)
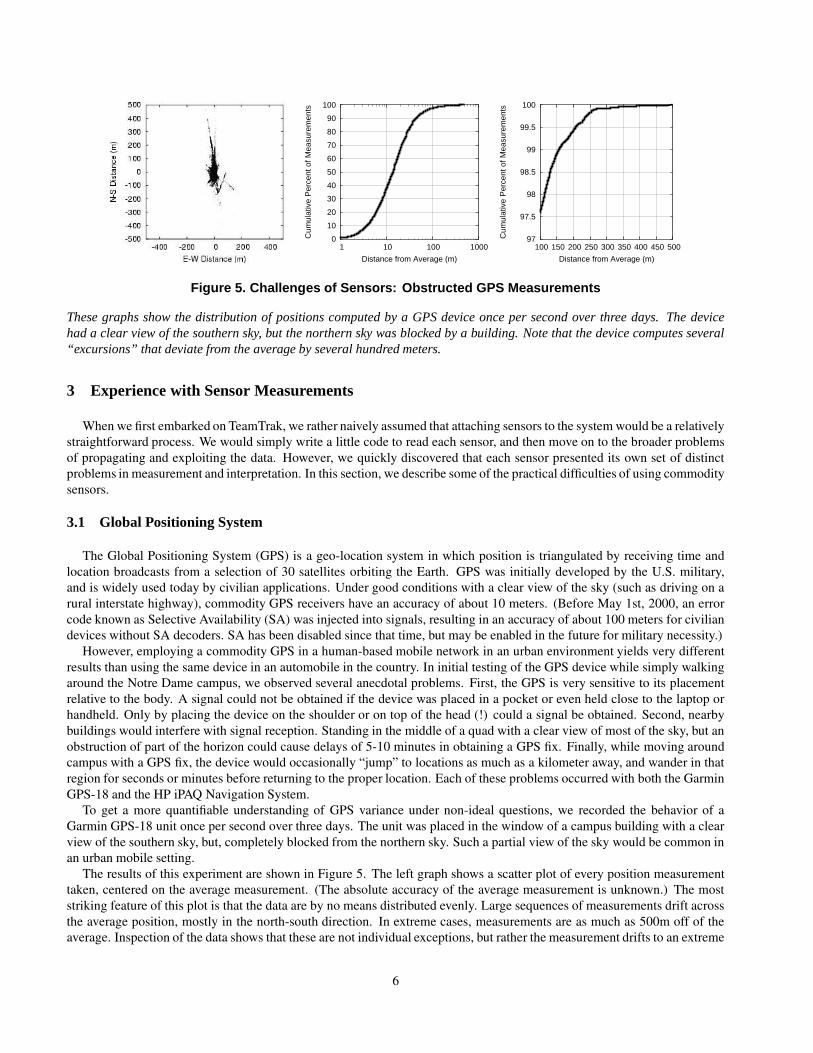
Figure 5. Challenges of Sensors: Obstructed GPS Measurements
These graphs show the distribution of positions computed by a GPS device once per second over three days. The devicehad a clear view of the southern sky, but the northern sky was blocked by a building. Note that the device computes several“excursions” that deviate from the average by several hundred meters.
3 Experience with Sensor Measurements
When we first embarked on TeamTrak, we rather naively assumed that attaching sensors to the system would be a relativelystraightforward process. We would simply write a little code to read each sensor, and then move on to the broader problemsof propagating and exploiting the data. However, we quickly discovered that each sensor presented its own set of distinctproblems in measurement and interpretation. In this section, we describe some of the practical difficulties of using commoditysensors.
3.1 Global Positioning System
The Global Positioning System (GPS) is a geo-location system in which position is triangulated by receiving time andlocation broadcasts from a selection of 30 satellites orbiting the Earth. GPS was initially developed by the U.S. military,and is widely used today by civilian applications. Under good conditions with a clear view of the sky (such as driving on arural interstate highway), commodity GPS receivers have an accuracy of about 10 meters. (Before May 1st, 2000, an errorcode known as Selective Availability (SA) was injected into signals, resulting in an accuracy of about 100 meters for civiliandevices without SA decoders. SA has been disabled since that time, but may be enabled in the future for military necessity.)
However, employing a commodity GPS in a human-based mobile network in an urban environment yields very differentresults than using the same device in an automobile in the country. In initial testing of the GPS device while simply walkingaround the Notre Dame campus, we observed several anecdotal problems. First, the GPS is very sensitive to its placementrelative to the body. A signal could not be obtained if the device was placed in a pocket or even held close to the laptop orhandheld. Only by placing the device on the shoulder or on top of the head (!) could a signal be obtained. Second, nearbybuildings would interfere with signal reception. Standing in the middle of a quad with a clear view of most of the sky, but anobstruction of part of the horizon could cause delays of 5-10 minutes in obtaining a GPS fix. Finally, while moving aroundcampus with a GPS fix, the device would occasionally “jump” to locations as much as a kilometer away, and wander in thatregion for seconds or minutes before returning to the proper location. Each of these problems occurred with both the GarminGPS-18 and the HP iPAQ Navigation System.
To get a more quantifiable understanding of GPS variance under non-ideal questions, we recorded the behavior of aGarmin GPS-18 unit once per second over three days. The unit was placed in the window of a campus building with a clearview of the southern sky, but, completely blocked from the northern sky. Such a partial view of the sky would be common inan urban mobile setting.
The results of this experiment are shown in Figure 5. The left graph shows a scatter plot of every position measurementtaken, centered on the average measurement. (The absolute accuracy of the average measurement is unknown.) The moststriking feature of this plot is that the data are by no means distributed evenly. Large sequences of measurements drift acrossthe average position, mostly in the north-south direction. In extreme cases, measurements are as much as 500m off of theaverage. Inspection of the data shows that these are not individual exceptions, but rather the measurement drifts to an extreme
6
-40
-30
-20
-10
0
10
20
30
40
-40 -30 -20 -10 0 10 20 30 40
Dis
tanc
e (m
)
Distance (m)
-2
-1.5
-1
-0.5
0
0.5
1
1.5
2
6 8 10 12 14
Acc
eler
atio
n (g
)
Time (s)
step step step step
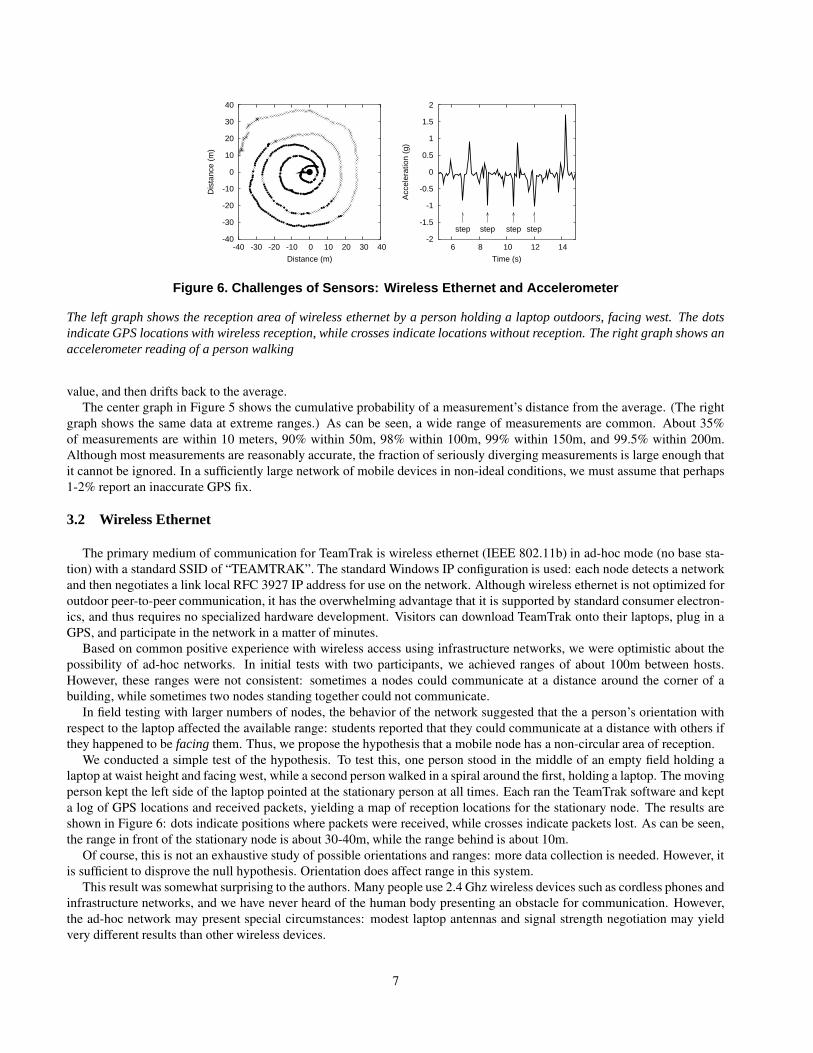
Figure 6. Challenges of Sensors: Wireless Ethernet and Accelerometer
The left graph shows the reception area of wireless ethernet by a person holding a laptop outdoors, facing west. The dotsindicate GPS locations with wireless reception, while crosses indicate locations without reception. The right graph shows anaccelerometer reading of a person walking
value, and then drifts back to the average.The center graph in Figure 5 shows the cumulative probability of a measurement’s distance from the average. (The right
graph shows the same data at extreme ranges.) As can be seen, a wide range of measurements are common. About 35%of measurements are within 10 meters, 90% within 50m, 98% within 100m, 99% within 150m, and 99.5% within 200m.Although most measurements are reasonably accurate, the fraction of seriously diverging measurements is large enough thatit cannot be ignored. In a sufficiently large network of mobile devices in non-ideal conditions, we must assume that perhaps1-2% report an inaccurate GPS fix.
3.2 Wireless Ethernet
The primary medium of communication for TeamTrak is wireless ethernet (IEEE 802.11b) in ad-hoc mode (no base sta-tion) with a standard SSID of “TEAMTRAK”. The standard Windows IP configuration is used: each node detects a networkand then negotiates a link local RFC 3927 IP address for use on the network. Although wireless ethernet is not optimized foroutdoor peer-to-peer communication, it has the overwhelming advantage that it is supported by standard consumer electron-ics, and thus requires no specialized hardware development. Visitors can download TeamTrak onto their laptops, plug in aGPS, and participate in the network in a matter of minutes.
Based on common positive experience with wireless access using infrastructure networks, we were optimistic about thepossibility of ad-hoc networks. In initial tests with two participants, we achieved ranges of about 100m between hosts.However, these ranges were not consistent: sometimes a nodes could communicate at a distance around the corner of abuilding, while sometimes two nodes standing together could not communicate.
In field testing with larger numbers of nodes, the behavior of the network suggested that the a person’s orientation withrespect to the laptop affected the available range: students reported that they could communicate at a distance with others ifthey happened to be facing them. Thus, we propose the hypothesis that a mobile node has a non-circular area of reception.
We conducted a simple test of the hypothesis. To test this, one person stood in the middle of an empty field holding alaptop at waist height and facing west, while a second person walked in a spiral around the first, holding a laptop. The movingperson kept the left side of the laptop pointed at the stationary person at all times. Each ran the TeamTrak software and kepta log of GPS locations and received packets, yielding a map of reception locations for the stationary node. The results areshown in Figure 6: dots indicate positions where packets were received, while crosses indicate packets lost. As can be seen,the range in front of the stationary node is about 30-40m, while the range behind is about 10m.
Of course, this is not an exhaustive study of possible orientations and ranges: more data collection is needed. However, itis sufficient to disprove the null hypothesis. Orientation does affect range in this system.
This result was somewhat surprising to the authors. Many people use 2.4 Ghz wireless devices such as cordless phones andinfrastructure networks, and we have never heard of the human body presenting an obstacle for communication. However,the ad-hoc network may present special circumstances: modest laptop antennas and signal strength negotiation may yieldvery different results than other wireless devices.
7
-100
-50
0
50
100
-90 -60 -30 0 30 60 90
Hea
ding
(de
gree
s)
Compass Roll (degrees)
modeledmeasured
50
60
70
80
90
100
200 400 600 800 1000 1200
Tem
pera
ture
(de
gree
s F
)
Time (s)
3.70 deg
5.00 deg
400 seconds 215 seconds
wentoutside
wentinside
wentoutside
wentinside
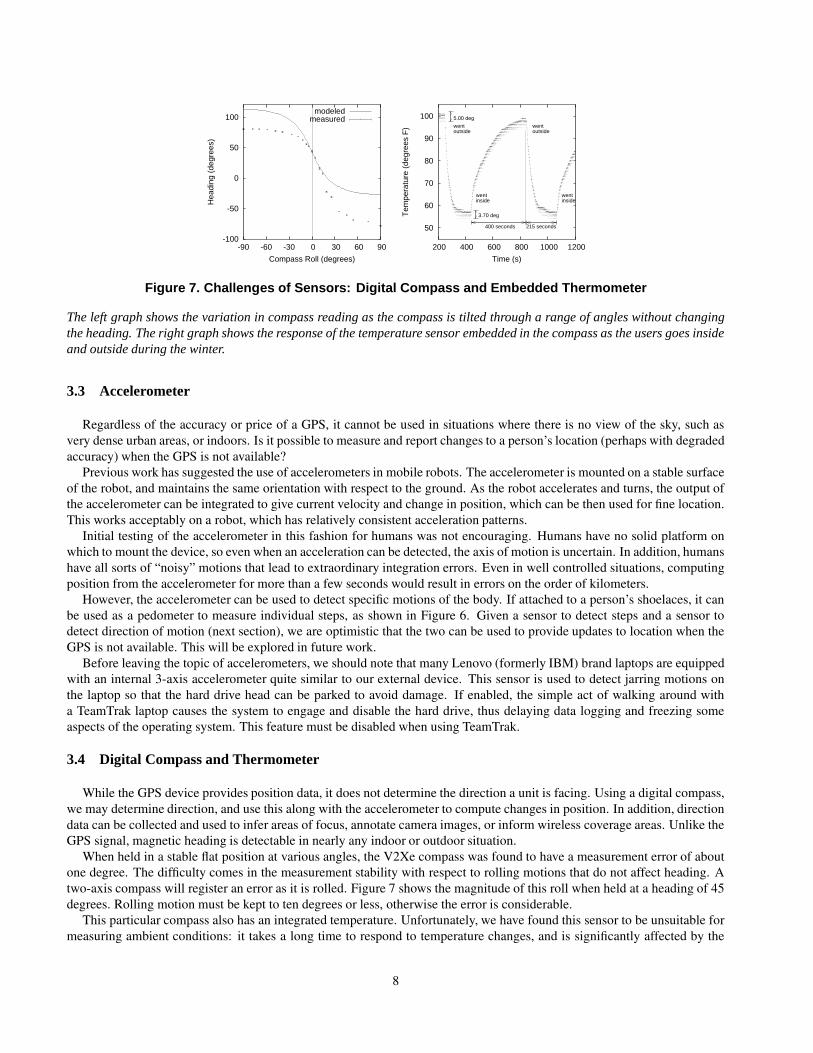
Figure 7. Challenges of Sensors: Digital Compass and Embedded Thermometer
The left graph shows the variation in compass reading as the compass is tilted through a range of angles without changingthe heading. The right graph shows the response of the temperature sensor embedded in the compass as the users goes insideand outside during the winter.
3.3 Accelerometer
Regardless of the accuracy or price of a GPS, it cannot be used in situations where there is no view of the sky, such asvery dense urban areas, or indoors. Is it possible to measure and report changes to a person’s location (perhaps with degradedaccuracy) when the GPS is not available?
Previous work has suggested the use of accelerometers in mobile robots. The accelerometer is mounted on a stable surfaceof the robot, and maintains the same orientation with respect to the ground. As the robot accelerates and turns, the output ofthe accelerometer can be integrated to give current velocity and change in position, which can be then used for fine location.This works acceptably on a robot, which has relatively consistent acceleration patterns.
Initial testing of the accelerometer in this fashion for humans was not encouraging. Humans have no solid platform onwhich to mount the device, so even when an acceleration can be detected, the axis of motion is uncertain. In addition, humanshave all sorts of “noisy” motions that lead to extraordinary integration errors. Even in well controlled situations, computingposition from the accelerometer for more than a few seconds would result in errors on the order of kilometers.
However, the accelerometer can be used to detect specific motions of the body. If attached to a person’s shoelaces, it canbe used as a pedometer to measure individual steps, as shown in Figure 6. Given a sensor to detect steps and a sensor todetect direction of motion (next section), we are optimistic that the two can be used to provide updates to location when theGPS is not available. This will be explored in future work.
Before leaving the topic of accelerometers, we should note that many Lenovo (formerly IBM) brand laptops are equippedwith an internal 3-axis accelerometer quite similar to our external device. This sensor is used to detect jarring motions onthe laptop so that the hard drive head can be parked to avoid damage. If enabled, the simple act of walking around witha TeamTrak laptop causes the system to engage and disable the hard drive, thus delaying data logging and freezing someaspects of the operating system. This feature must be disabled when using TeamTrak.
3.4 Digital Compass and Thermometer
While the GPS device provides position data, it does not determine the direction a unit is facing. Using a digital compass,we may determine direction, and use this along with the accelerometer to compute changes in position. In addition, directiondata can be collected and used to infer areas of focus, annotate camera images, or inform wireless coverage areas. Unlike theGPS signal, magnetic heading is detectable in nearly any indoor or outdoor situation.
When held in a stable flat position at various angles, the V2Xe compass was found to have a measurement error of aboutone degree. The difficulty comes in the measurement stability with respect to rolling motions that do not affect heading. Atwo-axis compass will register an error as it is rolled. Figure 7 shows the magnitude of this roll when held at a heading of 45degrees. Rolling motion must be kept to ten degrees or less, otherwise the error is considerable.
This particular compass also has an integrated temperature. Unfortunately, we have found this sensor to be unsuitable formeasuring ambient conditions: it takes a long time to respond to temperature changes, and is significantly affected by the
8
heat generated by the compass circuitry. As shown in Figure 7, the device was taken from an 80-degree building interiorto a 30-degree outdoor environment. For both transitions, a settle time of several minutes was required, and the resultingmeasurement was off by twenty degrees. This device is perhaps best suited for reporting the temperature of the device itselffor calibration purposes.
The final sensor, a lightweight USB camera, has been attached to the testbed, but has not yet been extensively tested.
4 Experience with Field Tests
After constructing the testbed and performing an initial evaluation of the sensors, we conducted a series of field tests ofthe system. Students in the spring 2007 Distributed Systems class at Notre Dame carried out the field tests for class credit. Ineach test, students were asked to undertake an activity simulating a possible application of a sensor network. Each node kepta log of all sensor readings and packets received, which was then collected at the end of each test. A post mortem analysiscan evaluate all detail obtained at runtime. Note that our goal in these field tests is not to perform a systematic study of anyone component, but rather to gain experience in operating the system, uncover any practical problems in the implementation,and suggest problems for further study.
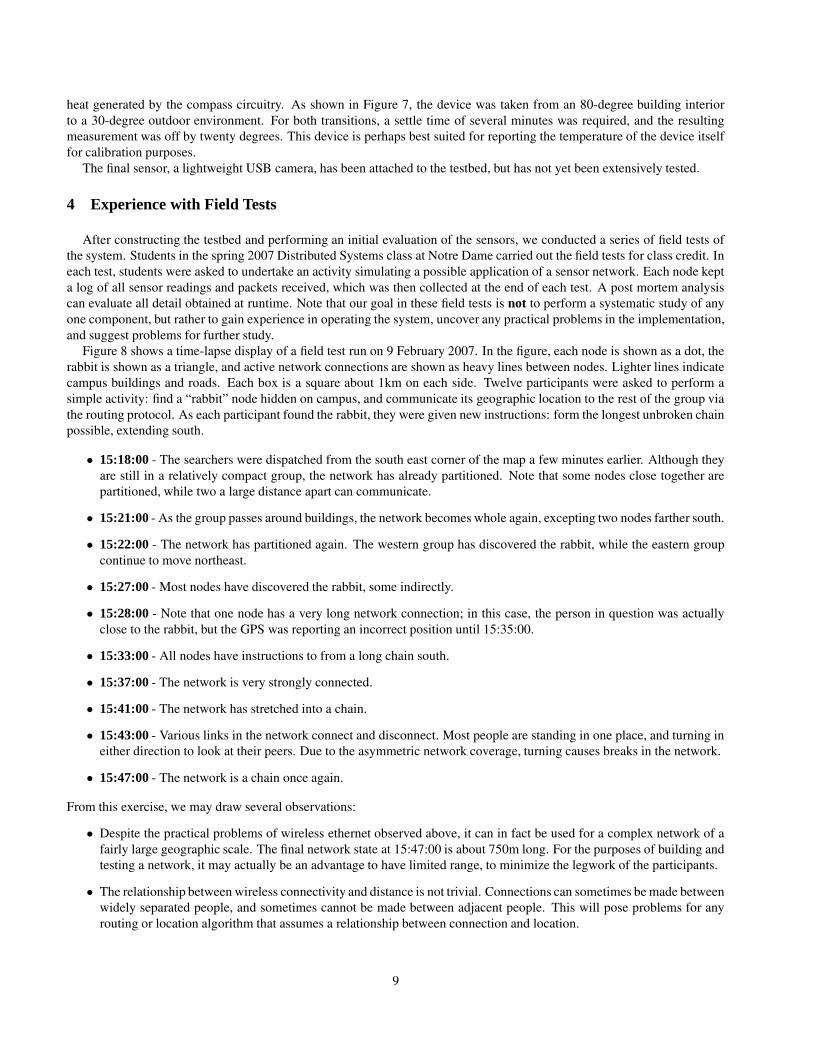
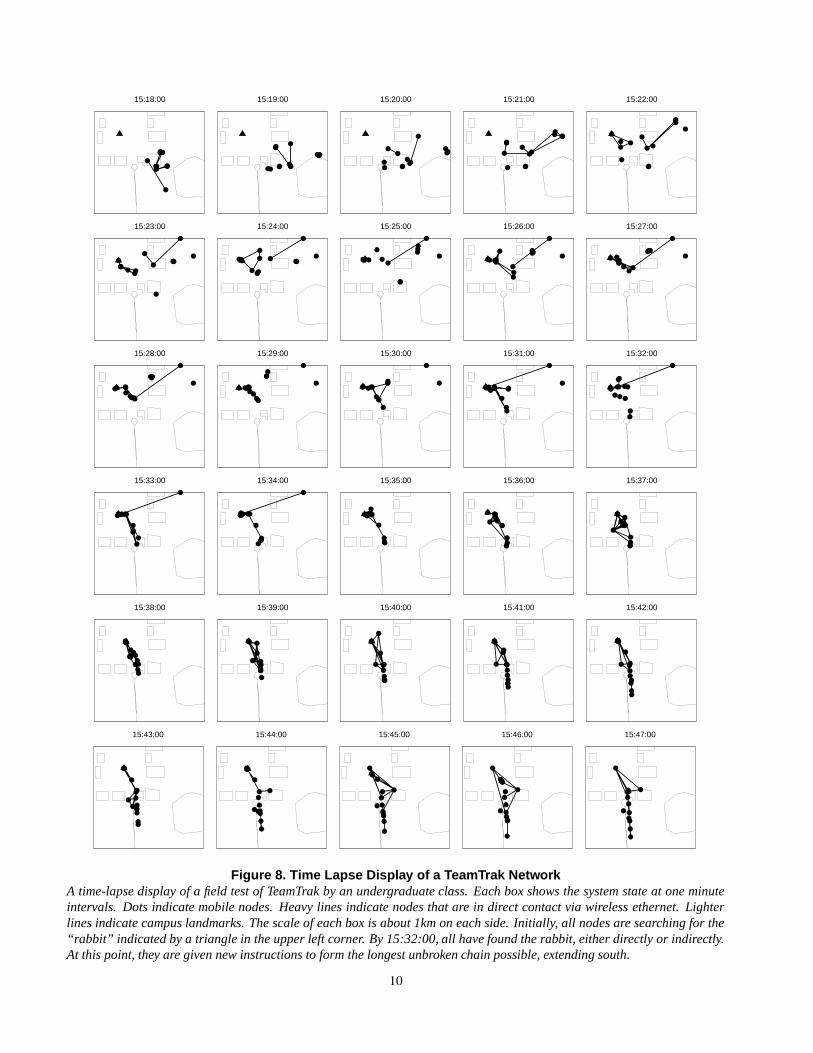
Figure 8 shows a time-lapse display of a field test run on 9 February 2007. In the figure, each node is shown as a dot, therabbit is shown as a triangle, and active network connections are shown as heavy lines between nodes. Lighter lines indicatecampus buildings and roads. Each box is a square about 1km on each side. Twelve participants were asked to perform asimple activity: find a “rabbit” node hidden on campus, and communicate its geographic location to the rest of the group viathe routing protocol. As each participant found the rabbit, they were given new instructions: form the longest unbroken chainpossible, extending south.
• 15:18:00 - The searchers were dispatched from the south east corner of the map a few minutes earlier. Although theyare still in a relatively compact group, the network has already partitioned. Note that some nodes close together arepartitioned, while two a large distance apart can communicate.
• 15:21:00 - As the group passes around buildings, the network becomes whole again, excepting two nodes farther south.
• 15:22:00 - The network has partitioned again. The western group has discovered the rabbit, while the eastern groupcontinue to move northeast.
• 15:27:00 - Most nodes have discovered the rabbit, some indirectly.
• 15:28:00 - Note that one node has a very long network connection; in this case, the person in question was actuallyclose to the rabbit, but the GPS was reporting an incorrect position until 15:35:00.
• 15:33:00 - All nodes have instructions to from a long chain south.
• 15:37:00 - The network is very strongly connected.
• 15:41:00 - The network has stretched into a chain.
• 15:43:00 - Various links in the network connect and disconnect. Most people are standing in one place, and turning ineither direction to look at their peers. Due to the asymmetric network coverage, turning causes breaks in the network.
• 15:47:00 - The network is a chain once again.
From this exercise, we may draw several observations:
• Despite the practical problems of wireless ethernet observed above, it can in fact be used for a complex network of afairly large geographic scale. The final network state at 15:47:00 is about 750m long. For the purposes of building andtesting a network, it may actually be an advantage to have limited range, to minimize the legwork of the participants.
• The relationship between wireless connectivity and distance is not trivial. Connections can sometimes be made betweenwidely separated people, and sometimes cannot be made between adjacent people. This will pose problems for anyrouting or location algorithm that assumes a relationship between connection and location.
9
15:18:00 15:19:00 15:20:00 15:21:00 15:22:00
15:23:00 15:24:00 15:25:00 15:26:00 15:27:00
15:28:00 15:29:00 15:30:00 15:31:00 15:32:00
15:33:00 15:34:00 15:35:00 15:36:00 15:37:00
15:38:00 15:39:00 15:40:00 15:41:00 15:42:00
15:43:00 15:44:00 15:45:00 15:46:00 15:47:00
Figure 8. Time Lapse Display of a TeamTrak NetworkA time-lapse display of a field test of TeamTrak by an undergraduate class. Each box shows the system state at one minuteintervals. Dots indicate mobile nodes. Heavy lines indicate nodes that are in direct contact via wireless ethernet. Lighterlines indicate campus landmarks. The scale of each box is about 1km on each side. Initially, all nodes are searching for the“rabbit” indicated by a triangle in the upper left corner. By 15:32:00, all have found the rabbit, either directly or indirectly.At this point, they are given new instructions to form the longest unbroken chain possible, extending south.
10

• Network partitions are even more common than we expected. Obviously, the network will partition when a group splitsin two to undertake a search. However, even when standing in a line with the explicit goal of staying connected, wecan see that the network partitions and reconnects rapidly in several different ways. Any protocol running on a networkshould be highly responsive to network changes.
In addition, the participants provided valuable practical feedback:
• Many wanted to see more live raw data about the system. In the initial design, we attempted to “hide” many low leveldetails that we thought were irrelevant or distracting to the end users. Examples include the number of GPS satellitesin view, the number of packets sent and received, the strength of network signals, and the age of routing table entries.However, the participants commented that more raw data allowed them to take informed actions. For example, if thesignal strength from a node of interest decreases, then they can move toward it in order to avoid losing a connection.
• Some also suggested applications of highly aggregated data. For example, when searching for the rabbit, it would beuseful to see what areas have been covered, both by the individual and the group at large. Although easily stated, thisis a very challenging distributed synchronization problem to solve. Another example in this spirit would be to retaindata on the network coverage for the given user, thus giving a real time picture of their own wireless range.
• Many complained that the conventional LCD screen was very hard to read in outdoor conditions. To make the displaymore readable, we had to simplify the display, draw items with thick lines and large dots, use high contrast colors,and add an option to invert the display colors as needed. Holding the tablet display vertically and wearing polarizedsunglasses also helps.
5 Lessons Learned and Future Work
Based on our experiences thus far building, deploying, and testing the system, we identify and discuss two areas that willrequire further investigations and the development of novel protocols and techniques that go beyond the state of the art.
5.1 GPS Needs Assistance in Urban Environments at Human Scale
Determining position using information from commodity GPS receivers alone is probably inadequate for most urbanmobile applications, partly due to the limitations of operating in such an environment; partly due to inherent capability ofcommercial receivers. We deployed our system across a university campus on which buildings are spaced much farther apartthan one would find in a dense urban environment, and we found numerous places in which obtaining a GPS fix was difficultto practically impossible. Even though GPS satellites are not geostationary, attempting to obtain GPS fixes in specific areas atdifferent times and days produced similarly poor results. Once our testers obtained an initial GPS fix, we did not experienceany significant difficulty maintaining it, generally only losing signal due to movement around obstructions or other ephemeralfactors for at most a few seconds or minutes at a time. However, the length of time often required to initially acquire a GPSsignal may prove unacceptable for many applications. Additionally, as Figure 5 illustrated, simply obtaining a GPS signal isoften not adequate as there may be a substantial error in the reported position.
To account for the error and unreliability of GPS-based location systems, alternatives or enhancements are needed toprovide robust location and navigation. Possible approaches for this might involve borrowing ideas from Differential GPSand the Wide Area Augmentation System used to correct GPS in mobile receivers, perhaps by using a small wireless basestation to broadcast corrections to the GPS signals to the mobile nodes. Alternatively, nodes could use dead reckoning inaddition to GPS through the use of a compass and accelerometer.
Once the system can correct or account for GPS errors, a platform such as TeamTrak can be used to research the use ofnavigation-aware systems, shown in Figure 9.
Location-awareness is exploited to improve application performance, reliability, or usability [22, 10, 11] in wireless andmobile systems and GPS is a common technique to identify a mobile device’s location. The experiments executed with theTeamTrak testbed indicate that GPS information is both unreliable and inaccurate (see Figures 5 and 6 in Section 3), whichhas been addressed in previous work on robust location and navigation systems [2, 9, 4]. However, we believe that existinglocation-aware devices can benefit from not only knowing the current location but also knowing the direction and speed (ofthemselves and other devices). For example, in military or rescue operations, mobile users will frequently enter critical zones,such as areas of increased risk to humans and/or mobile devices. Here, it may be desirable to offload important information
11

ΟΟ
1%116MB
82%72MB
57%194MB
98%220MB
Source
w2
w1
Potential Sink 1
Potential Sink 2Potential Sink 3
WirelessRange
w3 =
Figure 9. Navigation-Aware Information Offloading.
The figure illustrates a possible approach to preserving data among nodes in a designated region using location awareness.In this approach, data is passed to other nodes through a selection process that weighs system state, predicted motion, and aconservative estimate of its own wireless range to compute a predicted window of opportunity for transferring data.
from a mobile device to (a) protect the information from being captured and (b) prevent the loss of information in case ofdevice failure.
A mobile device/user wishing to offload information in an ad-hoc networking system can select one or more of its neigh-boring devices based on a number of criteria: proximity, connection speed and reliability, storage requirements, and trust.However, proximity, connectivity, and reliability not only depend on the current location of both the offloading host (source)and the receiving host (sink), but also on their directions and speeds. That is, each potential source-sink pair has a windowof opportunity for successful and complete offloading, which can be computed based on information retrieved from GPSdevices, accelerometers, and digital compasses. A source will then consider the size of the window of opportunity as anadditional parameter in sink selection.
5.2 Sensor Data Can Compensate for Poor Network Connectivity
Consistency of ad-hoc network connectivity, on the other hand, proved to be much worse than we had originally antici-pated. Using standard wireless ethernet, the connectivity between nodes could be described at best as haphazard. Despitethe limitations of the network, displaying the last known locations of nodes proved helpful when trying to locate a particularnode. Even a very transient connection in which very few routing packets are exchanged is sufficient for determining otherslocations. Since each node propagates location information for all nodes with which it has connected at some time, usersworking in concert can very quickly converge on a particular location. Of course, it is unclear how long stale data should bemaintained, but users have the option of removing it if the display becomes cluttered.
Interestingly, as mentioned in Section 3.2, we observed that proximity to other nodes did not necessarily suggest higherconnection quality or even a connection at all. In all of our trials to date, we noted that two nodes could be placed withinseveral feet of each other, yet connect to other machines several hundred feet away.
To account for the variations in network connectivity and signal strengths, we need wireless communication and routingprotocols that are aware of the limitations of reduced coverage. Predictors, such as the current position and bearing of usersof mobile devices, can be used to provide coverage maps on-the-fly, which in turn can be used to adapt communications toaccount for the predicted increase or decrease in connectivity.
Coverage-awareness promises to enhance existing location-aware communication approaches and protocols. In existinglocation-aware routing protocols for ad-hoc networks [23, 8, 11] nodes are aware of the topology of the network, includingthe geographical location (e.g., using GPS devices or with the support of location proxies [5]) of every node in the system.Further, every node maintains a neighbor list which includes the physical location of these neighbors. Whenever data is to besent or forwarded, a node selects the neighbor that reduces the geographic distance between data and receiver by the largestamount and passes the data onto this neighbor. However, a significant challenge for such routing protocols is to route arounddead ends.
Figure 10 shows a scenario in which data has traveled into a dead end and the involved nodes have to collaborate to findan alternative route. We believe that coverage-awareness, as opposed to location-awareness, can help reduce such problems.That is, instead of a simple physical location, each node shares a coverage map with its neighbors. Based on this coverage
12

N1
N2
N3N4
N5N6
N7
N8
N9
Sender
Receiver
Dead End
1
2
3
4
5
6
7
8
Figure 10. Dead Ends in Location-Aware Routing.
This figure illustrates a scenario in which a system has routed data to a location in which there is no additional connectednode, i.e., a dead end. Using coverage-aware schemes to identify paths in which nodes have little connectivity can help avoidrouting data into dead ends.
map, a node can predict the connectivity of the neighbor toward itself and other directions (e.g., towards the geographicdestination of data).
The unpredictable network connections and varying GPS capability together affected other parts of the system as well.For example, the initial design included an approximation scheme in which a node without an active GPS signal couldapproximate its own location by averaging the latitude and longitude of those nodes no more than a single hop away. Inthe case where there are numerous devices in the same general area, this is a reasonable idea. However, after we gavestudents the devices and had them walk around campus with them, they commented that they found it disconcerting when,while in the process of obtaining a GPS fix and unaware of the locations of other participants, another device with an activesignal connected to the ad hoc network, causing their position on the display to suddenly jump as much as 100 meters away.Based on this feedback, we decided it best to make the approximation feature optional while we explore other techniques toapproximate location in the absence of active GPS.
5.3 Human Operators Can Play an Important Role
Poor network connectivity can be partially compensate by human operators, depending on the application. In our rabbitchase exercise, users tended to prefer maintaining connectivity with other users, and once connection were lost, they fre-quently would move in the direction of the other nodes to reestablish it. In other types of applications or environments,humans make similar decisions, and models of behavior could be used to predict reactions. Behavior such as this can beexploited in mobile applications to augment network protocols. Behavior-aware systems is an area that we have just begunto explore and much work remains to be done.
6 Related Work
There has been a great deal of work in the area of wireless sensor networks (WSNs) in recent years, most of which aredesigned with specific applications in mind, such as health monitoring [7, 19, 12] or measuring physical motions of the bodyfor a specific activity such as dancing [1]. However, there are a number general-purpose portable sensor networks that havebeen built. For example, Eco [20] is a wearable sensor network that allows for expansion through the addition of sensorequipment, but the device is only 1cm3 and does not allow interaction with the user wearing it.
Although designed for a specific application, one WSN similar in many respects to TeamTrak is ZebraNet [13], a wirelesssensor network that uses GPS locations to facilitate the study of animal behaviors such as migration patterns and inter-speciesinteractions. In ZebraNet, sensor data is shared between connected nodes within wireless range using a flooding mechanismsimilar to that used in the TeamTrak routing protocol, and can facilitate the sharing of sensor data beyond GPS location.Similarly, WSNs exist for observing the behavioral patterns of birds [16] or herding cattle [3].
Similarly, several testbeds have been constructed that involve the use of robots or vehicles as the means to achieve nodemobility. As discussed in Section 3.3, such platforms provide more stability than can be achieved with a handheld device,making the use of many sensors such as accelerometers far more challenging in a system such as ours.
13

7 Conclusions
The TeamTrak mobile testbed is the first step in building cooperative mobile systems and researching the use of varioussensor data in such an environment. During the course of building the system, we have made a number of observationsabout the use of off-the-shelf sensor devices, software, and hardware platforms that both pose significant challenges yetoffer exciting possibilities for future expansion and integration. In many cases, empirical evaluation of various componentshave led to changes in our assumptions about the capabilities of such hardware and the feasibility of capturing and sharingmeaningful sensor data in a mobile environment. Such results have led us to identify a number of open research problems andareas for future direction, and in many cases cause us to periodically revisit earlier design decisions as the system evolves.
8 Acknowledgments
The authors would like to thank Daniel Mack and Matthew Van Antwerp for their efforts building the initial testbedsoftware, and Michael Putney for his assistance collecting experimental data.
References
[1] R. Aylward, S. D. Lovell, and J. Paradiso. A Compact, Wireless, Wearable Sensor Network for Interactive Dance Ensembles. In 2006International Workshop on Wearable and Implantable Body Sensor Networks (BSN 2006), April 2006.
[2] J. Burlet, T. Fraichard, and O. Aycard. Robust navigation using markov models. In Proc. of the IEEE-RSJ Int. Conf. on IntelligentRobots and Systems, August 2005.
[3] Z. Butler, P. Corke, R. Peterson, and D. Rus. Virtual Fences for Controlling Cows. In Proceedings of MobiSys 2004 Workshop onApplications of Mobile Embedded Systems, June 2004.
[4] J. Castro, V. Santos, and M. I. Ribeiro. A Multi-loop Robust Navigation Architecture for Mobile Robots. In Proc. of the IEEEInternational Conference on Robotics and Automation, May 1998.
[5] D. D. Couto and R. Morris. Location Proxies and Intermediate Node Forwarding for Practical Geographic Forwarding, 2001.[6] P. De, A. Raniwala, S. Sharma, and T. Chiueh. MiNT: A Miniaturized Network Testbed for Mobile Wireless Research. In Proceedings
of INFOCOM 2005, pages 2731–2742, March 2005.[7] T. Falck, J. Espina, J.-P. Ebert, and D. Dietterle. BASUMA - The Sixth Sense for Chronically Ill Patients. In 2006 International
Workshop on Wearable and Implantable Body Sensor Networks (BSN 2006), April 2006.[8] Q. Fang, J. Gao, and L. Guibas. Locating and Bypassing Routing Holes in Sensor Networks. In INFOCOM’04, March 2004.[9] C. Gentile and L. Klein-Berndt. Robust Location Using System Dynamics and Motion Constraints. In Proc. of the IEEE International
Conference on Communications, June 2004.[10] A. Haghighat, C. Lopes, T. Givargis, and A. Mandal. Location-Aware Web System. In Proc. of the Workshop on Building Software for
Pervasive Computing at the Object-Oriented Programming, Systems, Languages and Applications (OOPSLA) Conference, October2004.
[11] T. He, J. Stankovic, C. Lu, and T. Abdelzaher. SPEED: A Stateless Protocol for Real-Time Communication in Sensor Networks. InProc. of the International Conference on Distributed Computing Systems (ICDCS), 2003.
[12] T. Hester, R. Hughes, D. Sherrill, B. Knorr, M. Akay, J. Stein, and P. Bonato. Using Wearable Sensors to Measure Motor Abilitiesfollowing Stroke. In 2006 International Workshop on Wearable and Implantable Body Sensor Networks (BSN 2006), April 2006.
[13] P. Juang, H. Oki, Y. Wang, M. Martonosi, S. Peh, and D. Rubenstein. Energy-Efficient Computing for Wildlife Tracking: DesignTradeoffs and Early Experiences with ZebraNet. In Proceedings of the Tenth International Conference on Architectural Support forProgramming Languages and Operating Systems (ASPLOS-X), October 2002.
[14] A. Karygiannis and E. Antonakakis. mLab: A Mobile Ad Hoc Network Test Bed. In 3rd IEEE Consumer Communications andNetworking Conference (CCNC 2006), volume 2, pages 1312–1313, January 2006.
[15] A. Leon-Garcia and I. Widjaja. Communication Networks: Fundamental Concepts and Key Architectures. McGraw-Hill HigherEducation, 2000.
[16] A. Mainwaring, J. Polastre, R. Szewczyk, D. Culler, and J. Anderson. Wireless Sensor Networks for Habitat Monitoring. In Proceed-ings of the First ACM International Workshop on Wireless Sensor Networks and Applications (WSNA), September 2002.
[17] G. Malkin. RIP Version 2. Internet Engineering Task Force RFC 2453, November 1998.
14
[18] J. Maltz, J. Broch, and D. Johnson. Lessons From a Full-Scale, Multi-hop Wireless Ad Hoc Network Test Bed. IEEE PersonalCommunications Magazine, 8(1):8–15, February 2001.
[19] N. Oliver and F. Flores-Mangas. HealthGear: A Real-time Wearable System for Monitoring and Analyzing Physiological Signals. In2006 International Workshop on Wearable and Implantable Body Sensor Networks (BSN 2006), April 2006.
[20] C. Park and C. H. Chou. Eco: Ultra-Wearable and Expandable Wireless Sensor Platform. In International Workshop on Wearableand Implantable Body Sensor Networks, April 2006.
[21] K. Pawlikowski, H.-D. J. Jeong, and J.-S. R. Lee. On Credibility of Simulation Studies of Telecommunication Networks. IEEECommunications Magazine, 40(1):132–139, January 2002.
[22] P. Ramanathan. Location-centric Approach for Collaborative Target Detection, Classification, and Tracking. In Proc. of IEEE CASWorkshop on Wireless Communication and Networking (Invited), September 2002.
[23] Y. Xu, J. Heidemann, and D. Estrin. Geography-Informed Energy Conservation for Ad Hoc Routing. In Proc. of the 7th AnnualACM/IEEE International Conference on Mobile Computing and Networking (MobiCom), July 2001.
15