lessons from the revenue growth of 2k saas companies by patrick campbell, ceo, price intelligently
TRANSCRIPT

Lessons from seeing inside 2k SaaS CompaniesTractionConf 2016
@PriceIntel

Acquisition will diminish as the main source of growth.
@PriceIntel

Who the hell are you?
@PriceIntel

Happy customers big and small
ProfitWellSaaS pricing software
and tech enabled services
Free financial metrics for subscription
businesses

We’ve seen inside more subscription businesses than anyone else on the planet.
@PriceIntel

We’re obsessed with acquisition.Like stalked level obsessed.
@PriceIntel

Looked at 25,679 blog posts.
@PriceIntel

We love talking about acquisition
@PriceIntel
0%
25%
50%
75%
100%
Acquisition Monetization Retention
% o
f to
tal a
rtic
les
Category of growth articles written from 2014 to 2106
N = 25,679 blog posts written between 2014 to 2016

Looked at 8,324 B2B SaaS companies
@PriceIntel

We love building for acquisition
@PriceIntel
0%
25%
50%
75%
100%
Acquisition Monetization Retention
% o
f to
tal c
om
pan
ies
Category of B2B SaaS companies
N = 8,324 companies currently active

These are just the acquisition companies
@PriceIntel

Asked SaaS Founders/Executives
@PriceIntel

What’s most important?
@PriceIntel
0%
25%
50%
75%
100%
More logos Making more money per customer
Keeping customers around longer
% o
f to
tal c
om
pan
ies
C-Level/Founder Growth Preferences
N = 1,432 SaaS companies

What’s most important?
@PriceIntel
N = 1,432 SaaS companies
0%
25%
50%
75%
100%
Acquisition Monetization Retention
% o
f to
tal c
om
pan
ies
C-Level/Founder Spend Their Time

We think acquisition is our oxygen.
@PriceIntel

We think acquisition is our oxygen.In reality…acquisition is our crack.
@PriceIntel

Why is acquisition diminishing as the main source of growth?
@PriceIntel

Our world is more competitive, making switching costs easier.
@PriceIntel

Competition is growing
@PriceIntel
N = 289 SaaS companies
0
2
4
6
8
10
12
5 Years Ago 3 Years Ago 1 Year Ago Today
# o
f Co
mp
etit
ors
How many competitors did you have during the following periods?
The relative value of features is declining, making a race to the bottom for feature based
pricing.
@PriceIntel

“Differentiation” isn’t what is used to be…
@PriceIntel
N = Varies by line, but minimum of 10,000 customer respondents per line
0%
25%
50%
75%
100%
125%
4 Years Ago 3 Years Ago 2 Years Ago 1 Year Ago Today
WT
P as
% o
f WT
P 4
Year
s A
go
Willingness to pay over time relative to WTP 4 years ago
Core Features Single Sign On Integrations Analytics

If we improve each lever by the same amount, which lever causes the most growth?
@PriceIntel
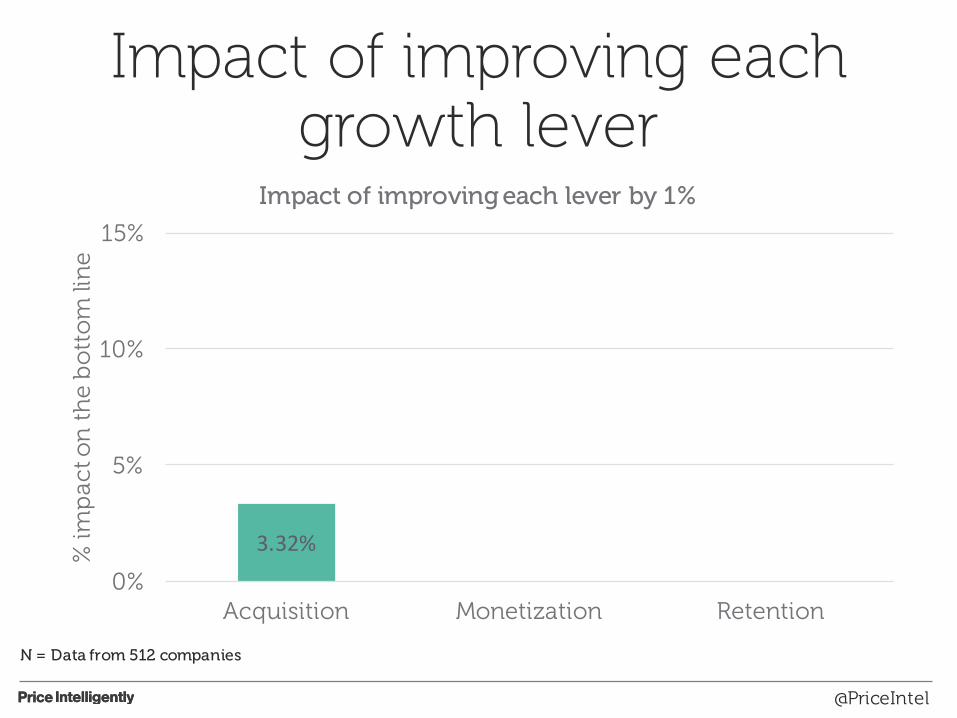
Impact of improving each growth lever
@PriceIntel
3.32%
0%
5%
10%
15%
Acquisition Monetization Retention
% im
pac
t on
th
e b
ott
om
lin
e
Impact of improving each lever by 1%
N = Data from 512 companies
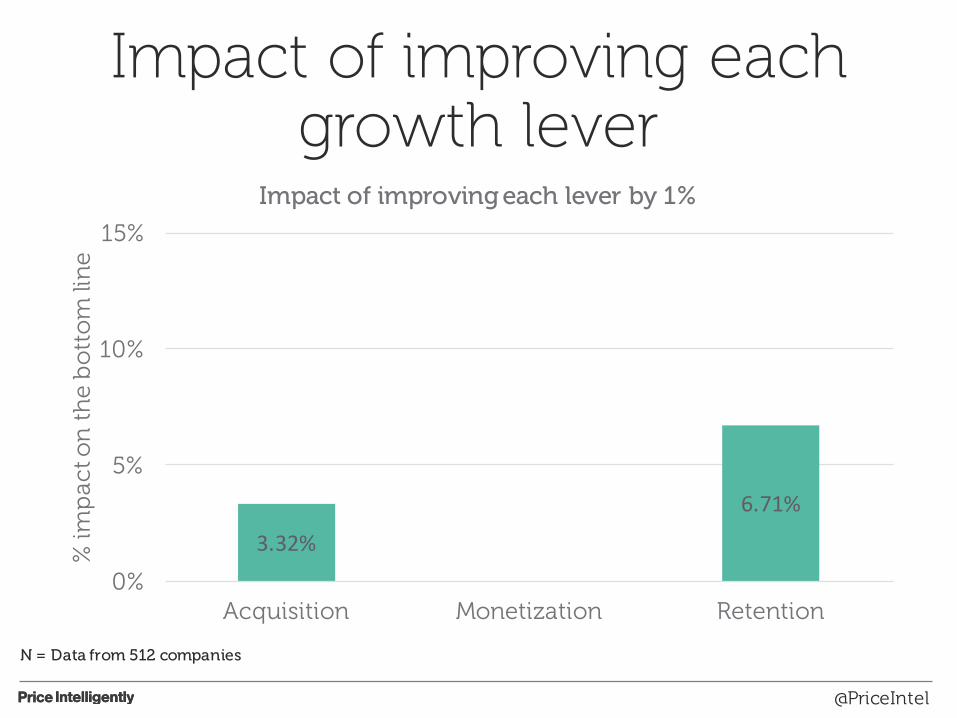
Impact of improving each growth lever
@PriceIntel
3.32%
6.71%
0%
5%
10%
15%
Acquisition Monetization Retention
% im
pac
t on
th
e b
ott
om
lin
e
Impact of improving each lever by 1%
N = Data from 512 companies

Impact of improving each growth lever
@PriceIntel
3.32%
12.70%
6.71%
0%
5%
10%
15%
Acquisition Monetization Retention
% im
pac
t on
th
e b
ott
om
lin
e
Impact of improving each lever by 1%
N = Data from 512 companies
Improving retention and monetization has 2-4x the impact of focusing on acquisition.
@PriceIntel

What we find important
@PriceIntel
0%
25%
50%
75%
100%
More logos Making more money per customer
Keeping customers around longer
% o
f to
tal c
om
pan
ies
C-Level/Founder Growth Preferences
N = 1,432 SaaS companies

What works for growth
@PriceIntel
3.32%
12.70%
6.71%
0%
5%
10%
15%
Acquisition Monetization Retention
% im
pac
t on
th
e b
ott
om
lin
e
Impact of improving each lever by 1%
N = Data from 512 companies

We’re ill equipped for this transition
@PriceIntel

We don’t really know our buyers
@PriceIntel

Buyer Personas
Table Stakes Tony
• Valued features: • SFDC Integration• Chrome extension
• Least valued features• Analytics• API access
• WTP = ~$10/month• CAC = ~$22• LTV: $160
Advanced Arnie
• Valued features: • Analytics• API Access
• Least valued features• Chrome extension• Premium support
• WTP = ~$25/month• CAC = ~$56• LTV: $325
@PriceIntel

We don’t know our buyers that well
@PriceIntel
0%
25%
50%
75%
100%
Thought about them Central document Quantified buyer personas
% o
f R
esp
on
den
ts
Which single category best describes your buyer personas?
N = 1,432 SaaS companies

We don’t do a lot of cust dev conversations
@PriceIntel
0%
25%
50%
75%
100%
Less than 10 11 to 25 26 to 50 51+
% o
f R
esp
on
den
ts
# of cust dev conversations
How many cust dev conversations are you having per month?
N = 1,432 SaaS companies

We don’t send any cust dev surveys
@PriceIntel
0%
25%
50%
75%
100%
0 1 2 3+
% o
f R
esp
on
den
ts
# of cust dev surveys
How many cust dev surveys are you sending each month?
N = 1,432 SaaS companies

We aren’t truly testing that much
@PriceIntel
0%
25%
50%
75%
100%
0 1 to 3 4 to 10 11+
% o
f R
esp
on
den
ts
# of tests/experiments
How many tests or experiments are you running each month?
N = 1,432 SaaS companies

This should be scary.
@PriceIntel

Basic Plus Premium
$49 $149 $299
I only have one cool feature. The same cool feature. Yup, same one.
Oh! You can only get this here. Well…and here.
Huzzah! I’m the plan with absolutely everything.
@PriceIntel

Everything aligns to the customer
Point of Conversion
Drive Customer #1
Justify price #1
Justify price #2
Drive Customer #2Drive Customer #3
Justify price #3
How do we fix this?
@PriceIntel

Path for a recovering acquisition addict
• Quantify you buyer personas
• Implement a customer development process
• Go beyond feature based differentiation

Quantify your buyer personas
@PriceIntel

Persona-Pricing Fit
Table Stakes Tony
• Valued features: • SFDC Integration• Chrome extension
• Least valued features• Analytics• API access
• WTP = ~$10/month• CAC = ~$22• LTV: $160
Advanced Arnie
• Valued features: • Analytics• API Access
• Least valued features• Chrome extension• Premium support
• WTP = ~$25/month• CAC = ~$56• LTV: $325
@PriceIntel

Go to the customer!
@PriceIntel

For the love of God. Talk to your customer.
@PriceIntel

Implement a customer development process
@PriceIntel

Understanding your customer
Customer/Market Research
Communication Plan
Week: 1 2 3 4 5 6 7 8 9
Impact Analysis
Customer Advisory
Panel
ImplementChanges
Step:

Move beyond feature based differentiation
@PriceIntel
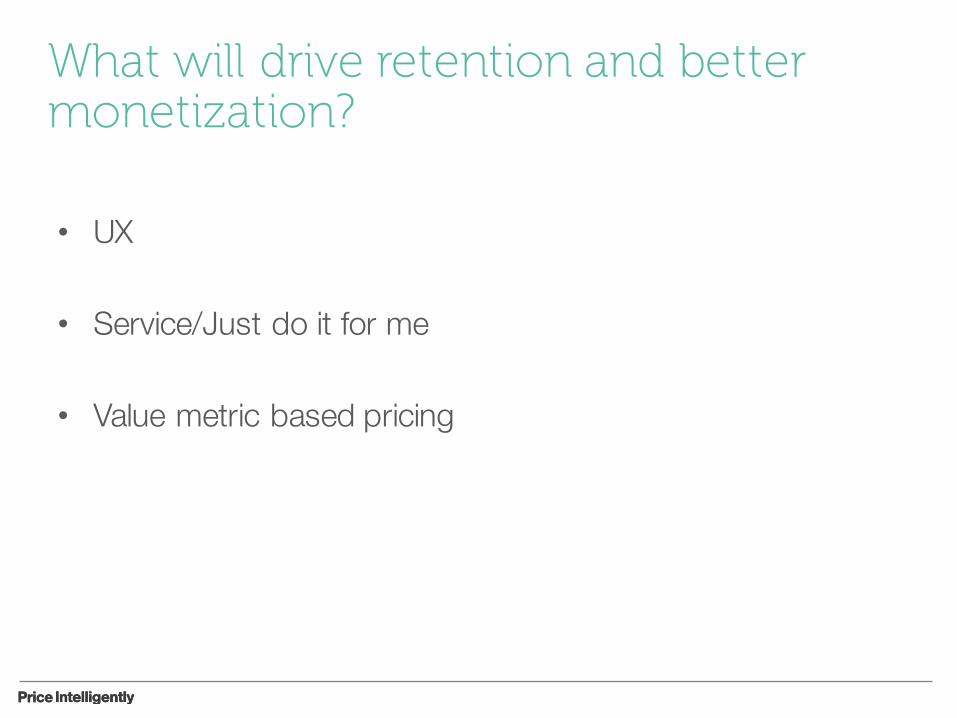
What will drive retention and better monetization?
• UX
• Service/Just do it for me
• Value metric based pricing

You will be left behind if you think you can brute force your growth.
@PriceIntel


Appendix
@PriceIntel

Some benchmarks to guide you.
@PriceIntel

What should gross churn look like?
N = 612 companies
“5%”

What should gross churn look like?
0
2
4
6
8
10
12
Less than 2 2 to 5 Greater than 5
Gro
ss C
hu
rn %
(6
mo
nth
ave
rag
e)
LTV/CAC Ratio Segment
Gross churn by segment
N = 612 companies

What % of total sales is expansion revenue?
N = 612 companies
“10-15%”
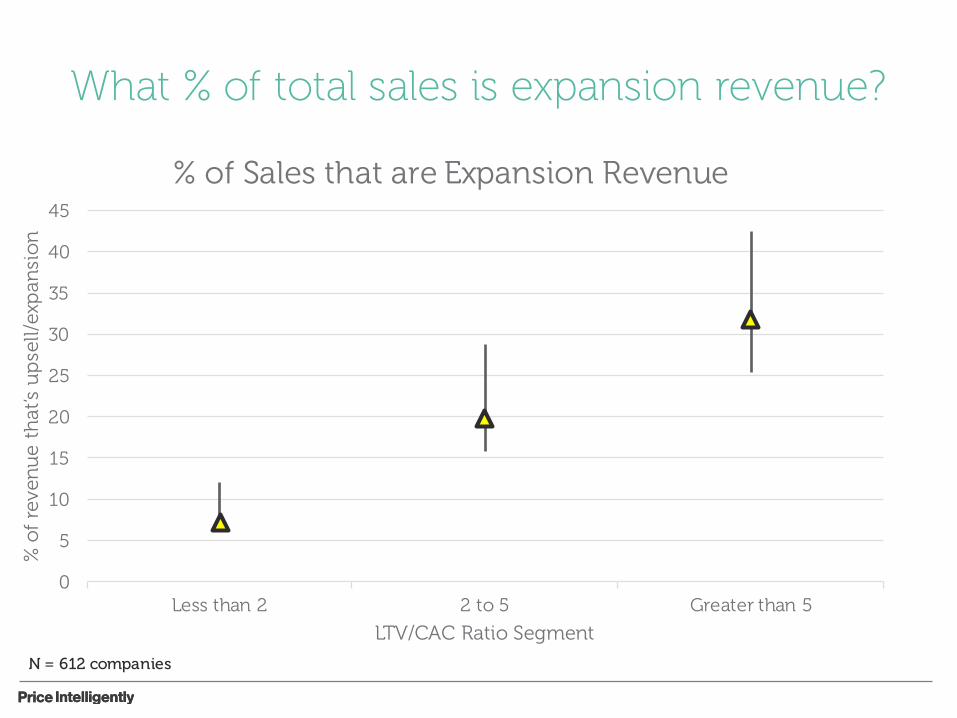
What % of total sales is expansion revenue?
0
5
10
15
20
25
30
35
40
45
Less than 2 2 to 5 Greater than 5
% o
f re
ven
ue
that
’s u
pse
ll/ex
pan
sio
n
LTV/CAC Ratio Segment
% of Sales that are Expansion Revenue
N = 612 companies

How much should you be growing YoY?
N = 612 companies
“As much as possible”

How much should you be growing YoY?
0
20
40
60
80
100
120
140
160
180
200
Less than $100k $101k to $500k $501k to $1M $1M to $5M $5.01M+
% G
row
th R
ate
YoY
Size of Company (ARR)
Growth rate as a function of size
N = 612 companies