lessons from hedge fund registration
TRANSCRIPT
Mandatory Disclosure and Operational Risk: Evidence from Hedge Fund
Registration
, Stephen Brown William, Goetzmann
, Bing Liang Chris topherSchwarz
www.stern.nyu.edu/~sbrown
Overview
The importance of operational ris k
Analys is of Form ADV filings
Important ro le of conflic ts of interes t
A quantitative meas ure of operational ris k
.. ?Do inves tors know or care

Growth of US Hedge Fund Industry
$0
$20,000
$40,000
$60,000
$80,000
$100,000
$120,000
$140,000
Jan-00
Jan-01
Jan-02
Jan-03
Jan-04
Jan-05
Jan-06
$M
illio
n A
ss
ets
un
de
r m
an
ag
em
en
t
Multi-Strategy
Managed Futures
Long/Short Equity Hedge
Global Macro
Fixed Income Arbitrage
Event Driven
Equity Market Neutral
Emerging Markets
Dedicated Short Bias
Convertible Arbitrage
Source: Lipper TASS

Institutional concern about risk
Fiduc iary guide lines imply concern for ris k
Financial ris k
Operational ris k
Ins titutional demand Growing popularity of market neutrals tyles
Explos ive growth of funds of funds

Financial Risk
0 %10 %20 %30 %40 %50 %6 0 %70 %8 0 %90 %
10 0 %
0 10 20 30 40 50 6 0 70 8 0 90 10 0
Size of port folio
Percent
ofrisk
Equit ies
500 S&P ris k
: 1995. Source Elton and Gruber Ris k is meas ured re lative to the s tandard deviation of the average s tock
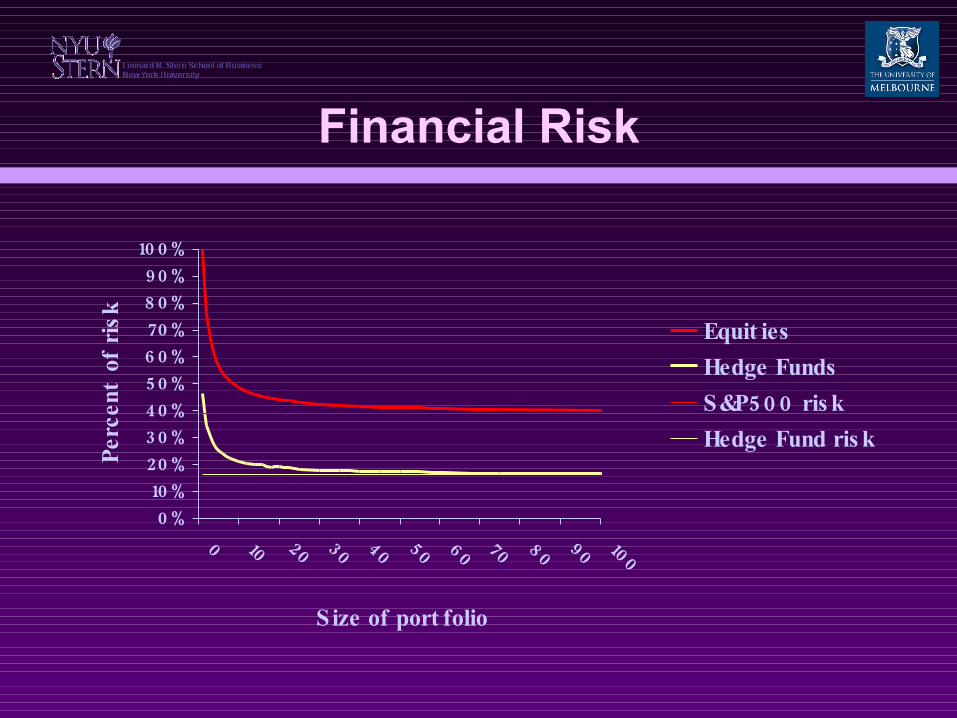
Financial Risk
0 %10 %20 %30 %40 %50 %6 0 %70 %8 0 %90 %
10 0 %
0 10 20 30 40 50 6 0 70 8 0 90 10 0
Size of port folio
Percent
ofrisk Equit ies
Hedge Funds
500 S&P ris k
Hedge Fund ris k
Funds of Hedge Funds
Provides – Divers ification lower value at ris k
Smaller unit s ize of inves tment
Acces s to otherwis e c los ed funds
/ Profes s ional management Due diligence
1H e d g e F u n d 2H e d g e F u n d 3H e d g e F u n d
F u n d o f F u n d s
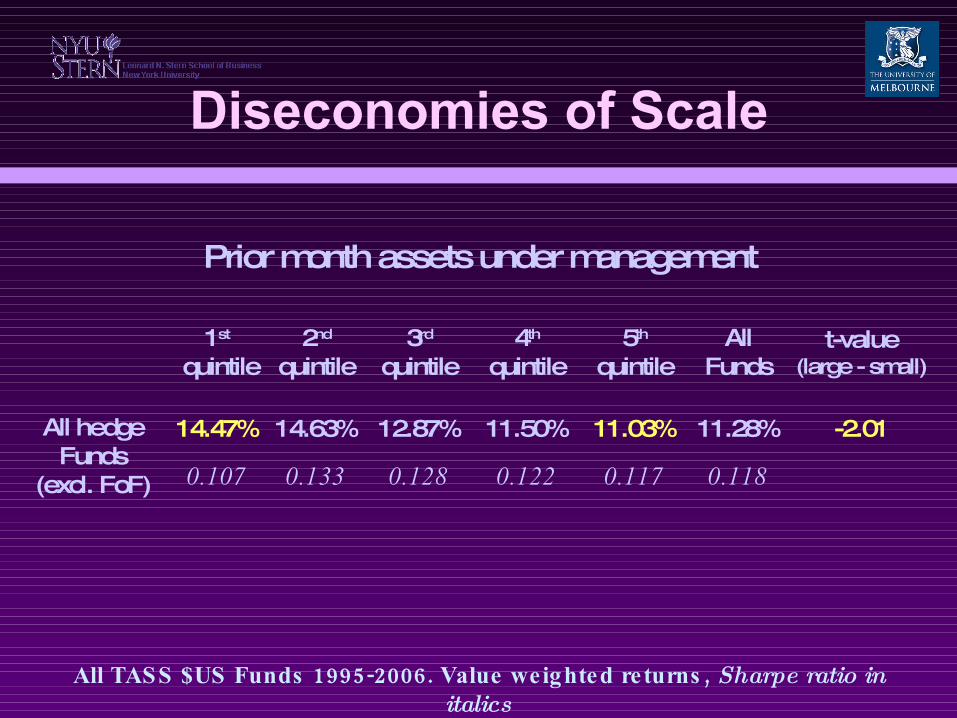
Diseconomies of Scale
Prior month assets under management
1st
quintile2nd
quintile3rd
quintile4th
quintile5th
quintileAll
Fundst-value
(large - small)
All hedgeFunds
(excl. FoF)
14.47% 14.63% 12.87% 11.50% 11.03% 11.28% -2.01
0.107 0.133 0.128 0.122 0.117 0.118
1995-2006. , All TASS $US Funds Value weighted returns Sharpe ratio in italics
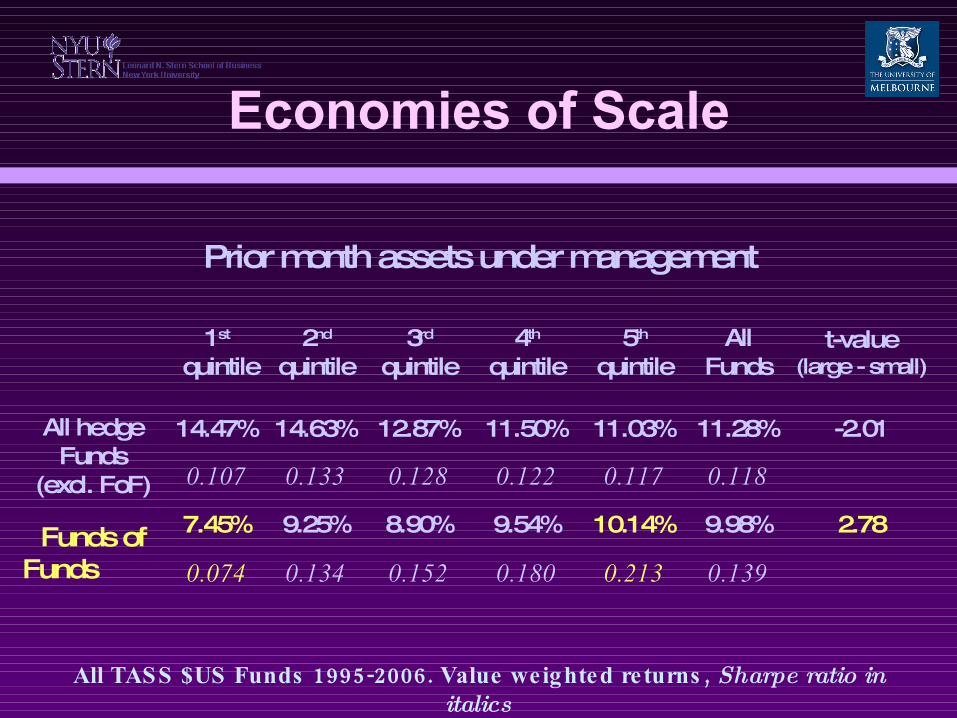
Economies of Scale
Prior month assets under management
1st
quintile2nd
quintile3rd
quintile4th
quintile5th
quintileAll
Fundst-value
(large - small)
All hedgeFunds
(excl. FoF)
14.47% 14.63% 12.87% 11.50% 11.03% 11.28% -2.01
0.107 0.133 0.128 0.122 0.117 0.118
Funds ofFunds
7.45% 9.25% 8.90% 9.54% 10.14% 9.98% 2.78
0.074 0.134 0.152 0.180 0.213 0.139
1995-2006. , All TASS $US Funds Value weighted returns Sharpe ratio in italics
26% of Funds of Funds <$25M !!!

MotivationMotivation
SEC mandated hedge funds file Form 1ADV by February s t, 2006
Controvers ial requirement overturned 23June rd, 2006
:Interes ting res earch ques tions ?What is the purpos e of s uch mandated dis c los ures What is the dis tinc tion between operational and
financ ial ris k Does the dis c los ure provide material information ?To whom

Data
All Form ADV filings in February2006
Hedge fund characteris tic s from TASS
management companies matched with ADV forms by both name and addres s ..from the “Company” TASS file
Brown, Stephen J., Goetzmann, William N., Liang, Bing and Schwarz, Christopher, "Optimal Disclosure and Operational Risk: Evidence from Hedge Fund Registration" (January 7, 2007). Yale ICF Working Paper No. 06-15 Available at SSRN: http://ssrn.com/abstract=918461
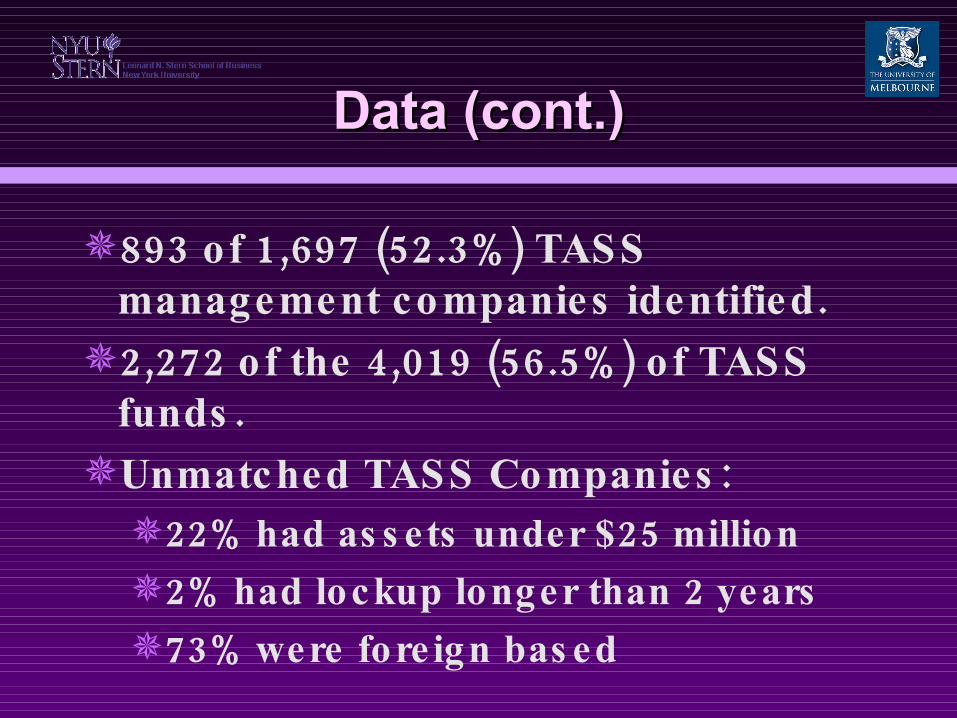
Data (cont.)Data (cont.)
893 1,697 (52.3%) of TASS .management companies identified
2,272 4,019 (56.5%) of the of TASS.funds
:Unmatched TASS Companies22% 25 had as s ets under $ million
2% 2 had lockup longer than years
73% were fore ign bas ed

Form ADVForm ADV
35 .pages long
General information
:Ques tions on potential conflic ts of interes t
[ 11]legal or regulatory is s ues Item
( owners hip s tructure both direct and)indirect
No ques tions about holdings ors trategy

Phil GoldsteinPhil Goldstein
ADV form as ks everything from “your las t small pox vacc ination to every dirty joke you got on Email”
11ItemFelonies
- Inves tment re lated mis demeanors
, - Any SEC CFTC or s e lf regulatoryis s ues
Laws uits

Tests and ResultsTests and Results
= A “Problem” fund a fund whos e management company answered
‘ ’ 11.Yes to ANY ques tion on Item 2,272 358 (15.8%) Of funds are
.defined as “problem ”128 893 (14.3%) of management
.companies
10,295 , Of the total ADV regis trations1,526 (14.8%) .had a “problem ”
17
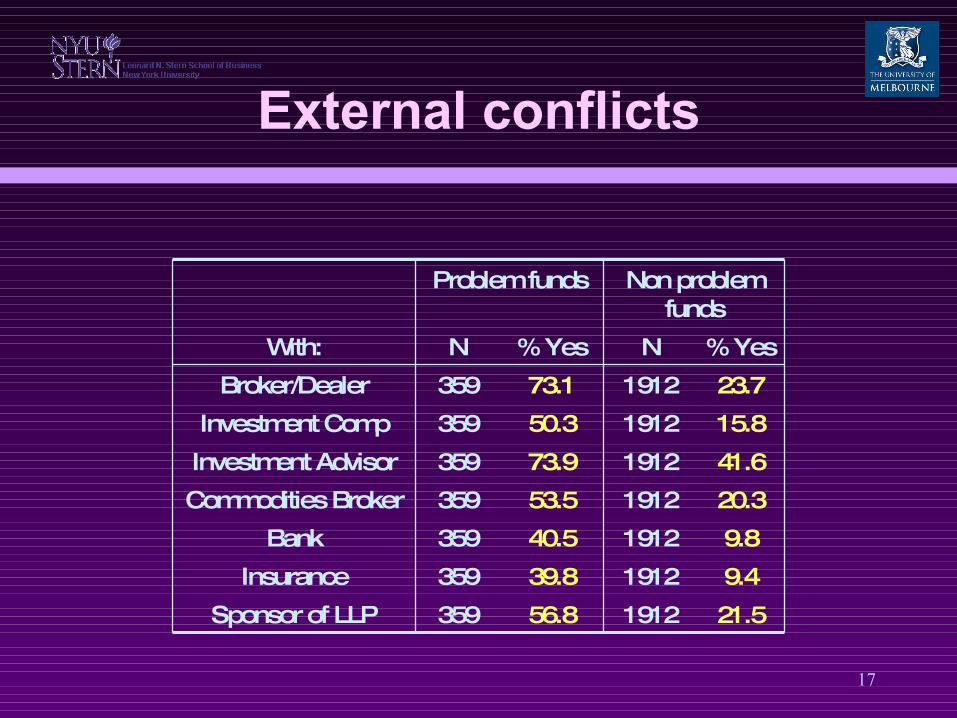
External conflicts
Problem funds Non problemfunds
With: N % Yes N % Yes
Broker/Dealer 359 73.1 1912 23.7
Investment Comp 359 50.3 1912 15.8
Investment Advisor 359 73.9 1912 41.6
Commodities Broker 359 53.5 1912 20.3
Bank 359 40.5 1912 9.8
Insurance 359 39.8 1912 9.4
Sponsor of LLP 359 56.8 1912 21.5

18
Internal conflicts
Problem funds Non problemfunds
With: N % Yes N % Yes
Trade securities with clients 359 30.7 1912 8.3
Allow trading on own account 359 84.8 1912 69.3
Recommend own securities 359 75.5 1912 50.4
In-house broker dealer 359 31.2 1912 2.3
Recommends own underwriting service
359 69.4 1912 46.8
Recommends commission fee items
359 22.6 1912 15.7
Recommends brokers 359 46.7 1912 38.0
Use broker provided external research
359 81.0 1912 70.5
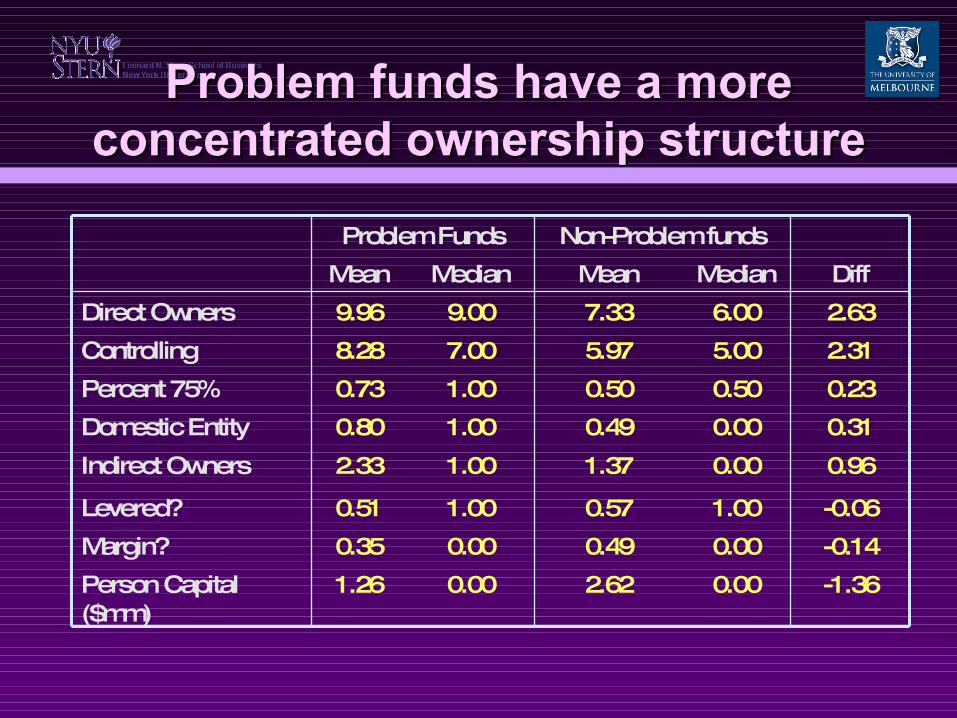
Problem funds have a more Problem funds have a more concentrated ownership structureconcentrated ownership structure
Problem Funds Non-Problem funds
Mean Median Mean Median Diff
Direct Owners 9.96 9.00 7.33 6.00 2.63
Controlling 8.28 7.00 5.97 5.00 2.31
Percent 75% 0.73 1.00 0.50 0.50 0.23
Domestic Entity 0.80 1.00 0.49 0.00 0.31
Indirect Owners 2.33 1.00 1.37 0.00 0.96
Levered? 0.51 1.00 0.57 1.00 -0.06
Margin? 0.35 0.00 0.49 0.00 -0.14
Person Capital ($mm)
1.26 0.00 2.62 0.00 -1.36

Leverage and Problem Funds
( Can lenders te ll the difference prior to2006)?
TASS leverage variables
Average leverage
Maximum leverage
Style controls Lenders already unders tand content of
ADV dis c los ure
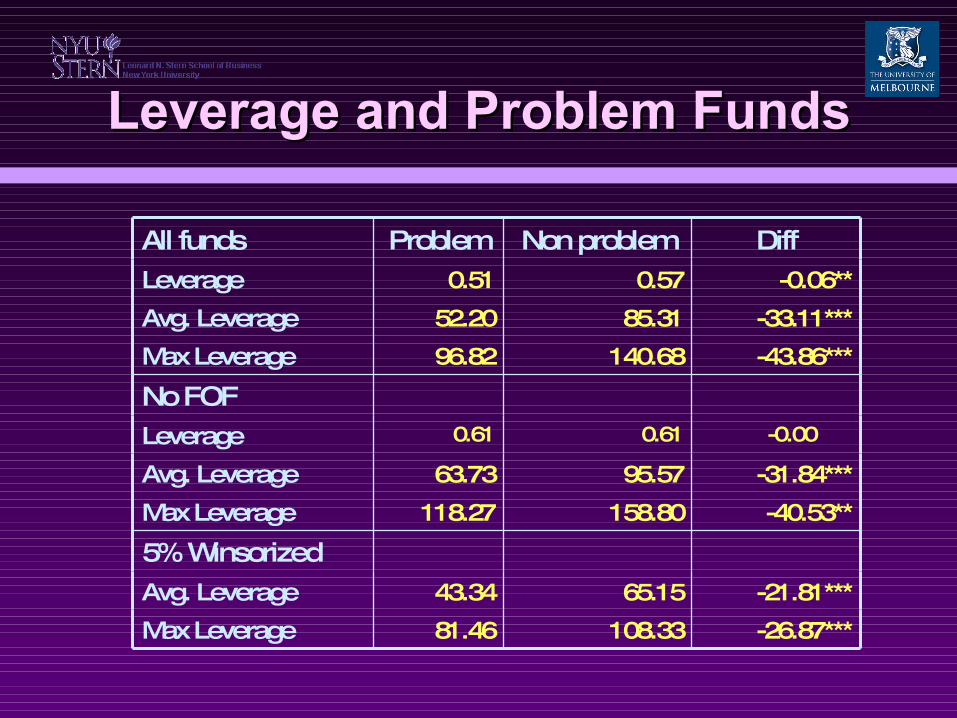
Leverage and Problem FundsLeverage and Problem Funds
All funds Problem Non problem DiffLeverage 0.51 0.57 -0.06**
Avg. Leverage 52.20 85.31 -33.11***
Max Leverage 96.82 140.68 -43.86***
No FOFLeverage 0.61 0.61 -0.00
Avg. Leverage 63.73 95.57 -31.84***
Max Leverage 118.27 158.80 -40.53**
5% WinsorizedAvg. Leverage 43.34 65.15 -21.81***
Max Leverage 81.46 108.33 -26.87***
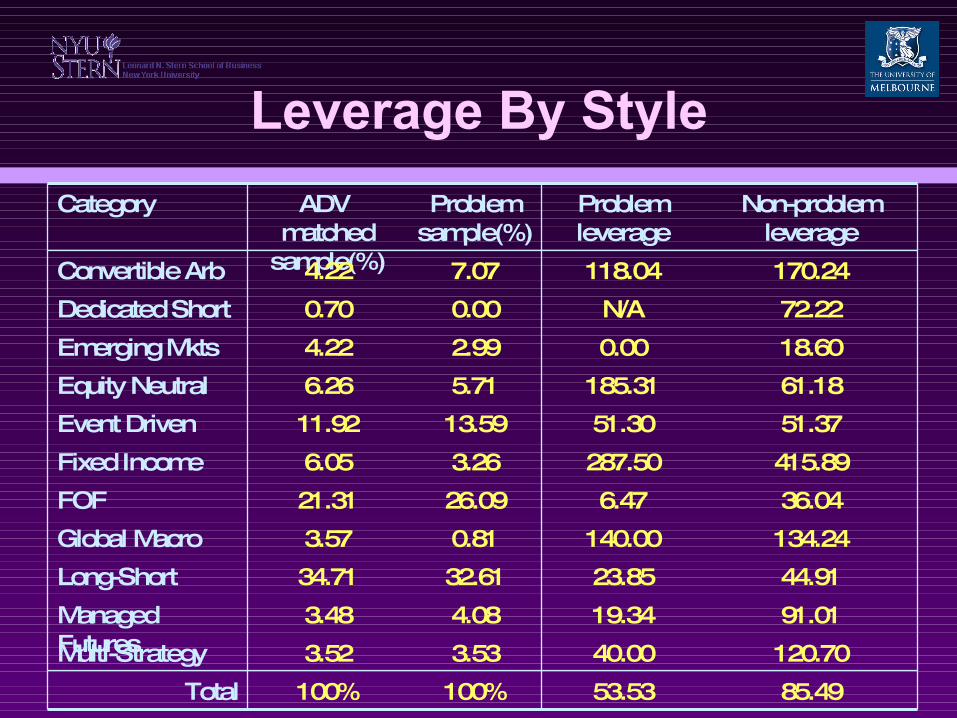
Leverage By Style
Category ADV matched
sample(%)
Problem sample(%)
Problem leverage
Non-problem leverage
Convertible Arb 4.22 7.07 118.04 170.24
Dedicated Short 0.70 0.00 N/A 72.22
Emerging Mkts 4.22 2.99 0.00 18.60
Equity Neutral 6.26 5.71 185.31 61.18
Event Driven 11.92 13.59 51.30 51.37
Fixed Income 6.05 3.26 287.50 415.89
FOF 21.31 26.09 6.47 36.04
Global Macro 3.57 0.81 140.00 134.24
Long-Short 34.71 32.61 23.85 44.91
Managed Futures
3.48 4.08 19.34 91.01
Multi-Strategy 3.52 3.53 40.00 120.70
Total 100% 100% 53.53 85.49
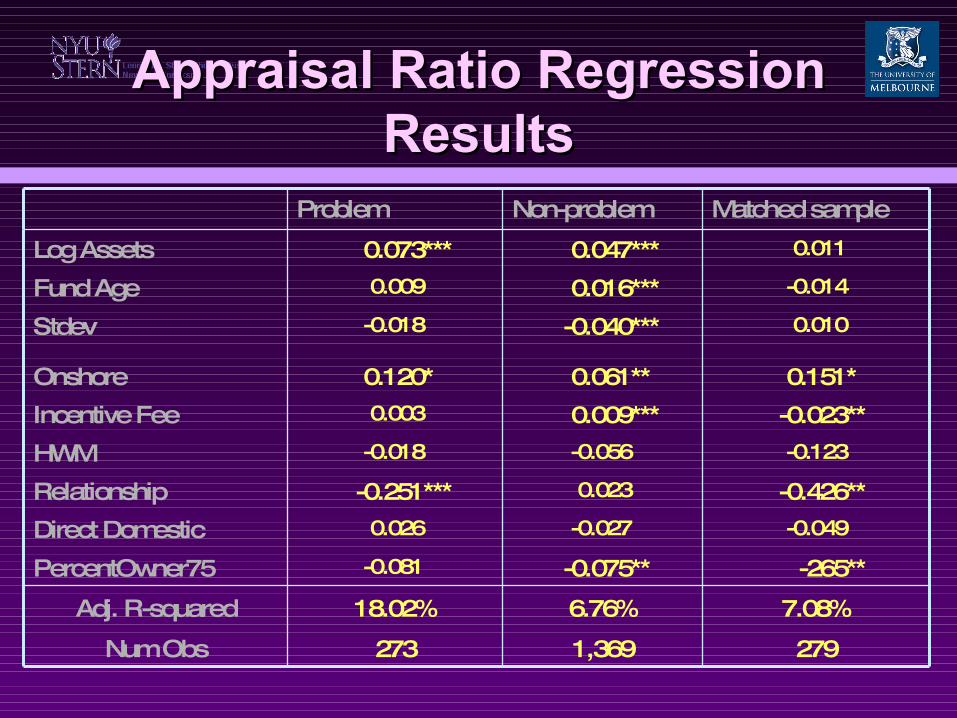
Appraisal Ratio Regression Appraisal Ratio Regression ResultsResults
Problem Non-problem Matched sample
Log Assets 0.073*** 0.047*** 0.011
Fund Age 0.009 0.016*** -0.014
Stdev -0.018 -0.040*** 0.010
Onshore 0.120* 0.061** 0.151*
Incentive Fee 0.003 0.009*** -0.023**
HWM -0.018 -0.056 -0.123
Relationship -0.251*** 0.023 -0.426**
Direct Domestic 0.026 -0.027 -0.049
PercentOwner75 -0.081 -0.075** -265**
Adj. R-squared 18.02% 6.76% 7.08%
Num Obs 273 1,369 279
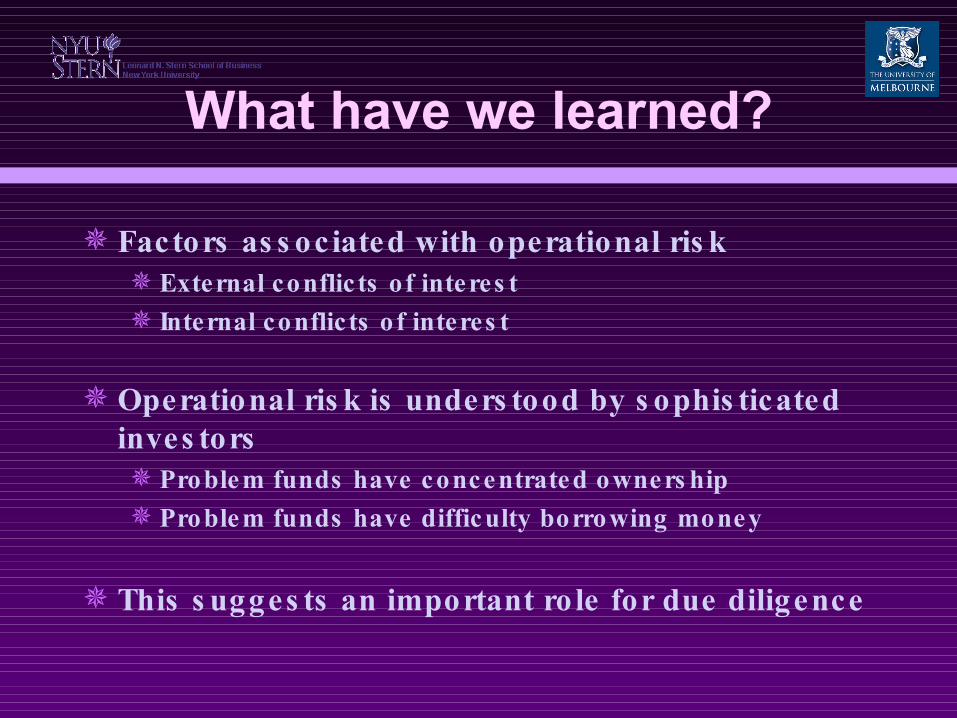
What have we learned?
Factors as s oc iated with operational ris k External conflic ts of interes t
Internal conflic ts of interes t
Operational ris k is unders tood by s ophis ticatedinves tors Problem funds have concentrated owners hip
Problem funds have difficulty borrowing money
This s ugges ts an important ro le for due diligence

A univariate measure of A univariate measure of operational riskoperational risk
TASS ADV
Previous Returns -0.27*** AgencyCrossTrans
0.06**
Previous Std. Dev. -0.35*** RelBrokerDealer 0.28***
Fund Age -0.07*** RelInvestComp 0.24***
Log of Assets 0.13*** RelInvAdvisor 0.24***
Reports Assets 0.12*** RelPartSponser 0.30***
Incentive Fee -0.88*** BuySellYouOwn 0.08**
Margin -0.29*** BuySellYourClient -0.08***
Audited -0.19*** RecSecYouOwn 0.33***
Personal Capital -0.29*** RecUnderwriter 0.26***
Onshor -0.05*** RecSalesInterest 0.28***
OpenToInv 0.08 RecBrokers -0.33***
Accepts Mgd. Accts. -0.13*** PercentOwner75 0.15***
Corr ADV & TASS 0.42*** DirectDomestic 0.31***
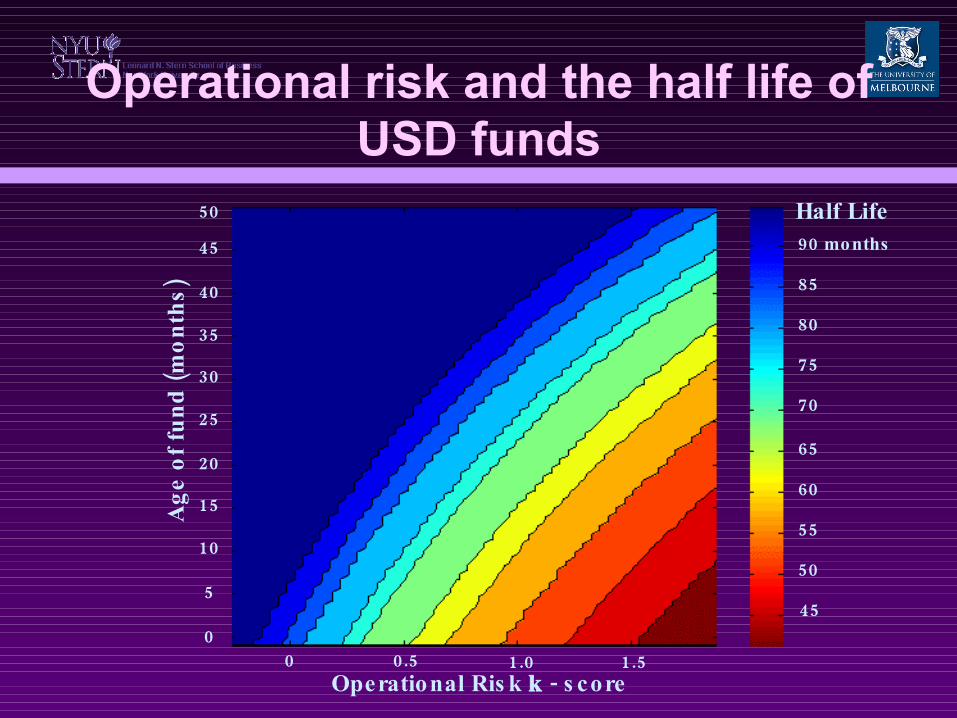
Operational risk and the half life of USD funds
0 0.5 1.0 1.5
5045
40
35
30
25
20
15
10
5
0
90 months
85
80
75
70
65
60
55
50
45
Half Life
()
Ageoffund
months
Operational Ris k k - s core

Does the operational risk measure Does the operational risk measure predict leverage?predict leverage?
TASS Style Dummies B-G Style Dummies
Coeff t-value Coeff t-value
2005 -18.04 -4.04*** -6.39 -6.80***
2004 -28.87 -5.85*** -35.16 -8.25***
2003 -24.76 -4.76*** -33.38 -7.19***
2002 -17.36 -3.28*** -26.96 -5.68***
2001 -21.75 -3.96*** -27.21 -5.30***
Average -22.16 -10.33*** -25.82 -5.04***
Avg. Adj. R-sq. 13.74% 2.61%
Avg. Obs 2279 2279

Does the operational risk measure predict returns?
Year Operational risk coefficient t-value1994 -2.28% -2.2**1995 0.10% 0.121996 -3.27% -4.76***1997 -2.61% -3.71***… … …2002 -1.48% -4.43***2003 -0.41% -1.122004 -0.67% -2.45**2005 -0.11% -1.31Average Value -0.92% -2.66**Avg. Adjusted R² 40.17%
Average Observations
1,027
, Cros s s ectional return regres s ion on prior operational ris k financial ris k and s tyle dummies
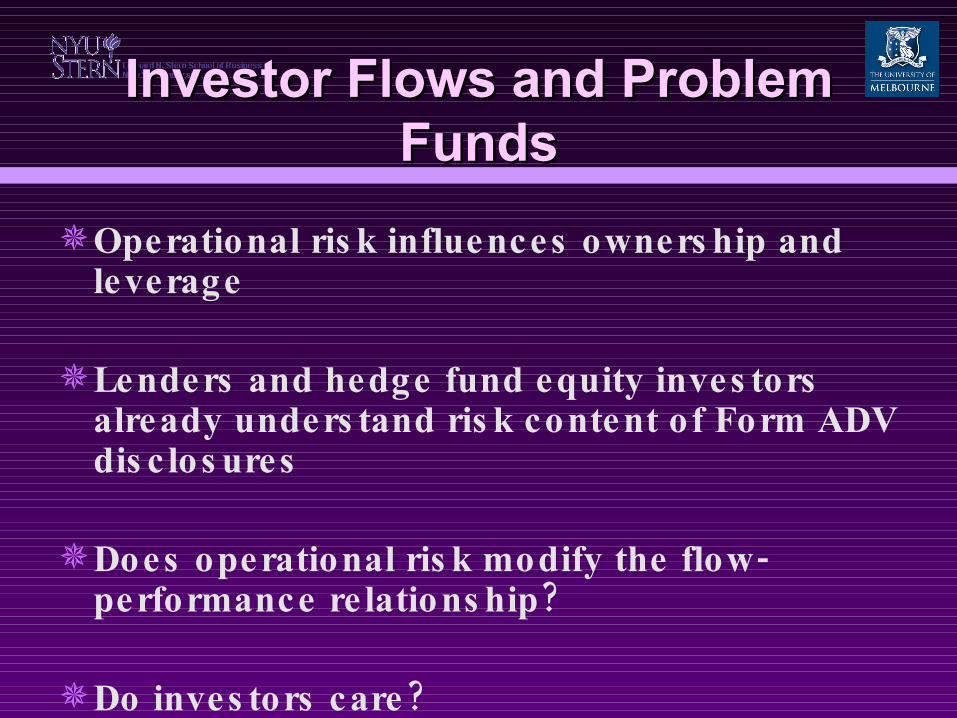
Investor Flows and Problem Investor Flows and Problem FundsFunds
Operational ris k influences owners hip andleverage
Lenders and hedge fund equity inves tors already unders tand ris k content of Form ADV
dis c los ures
-Does operational ris k modify the flow ?performance re lations hip
?Do inves tors care
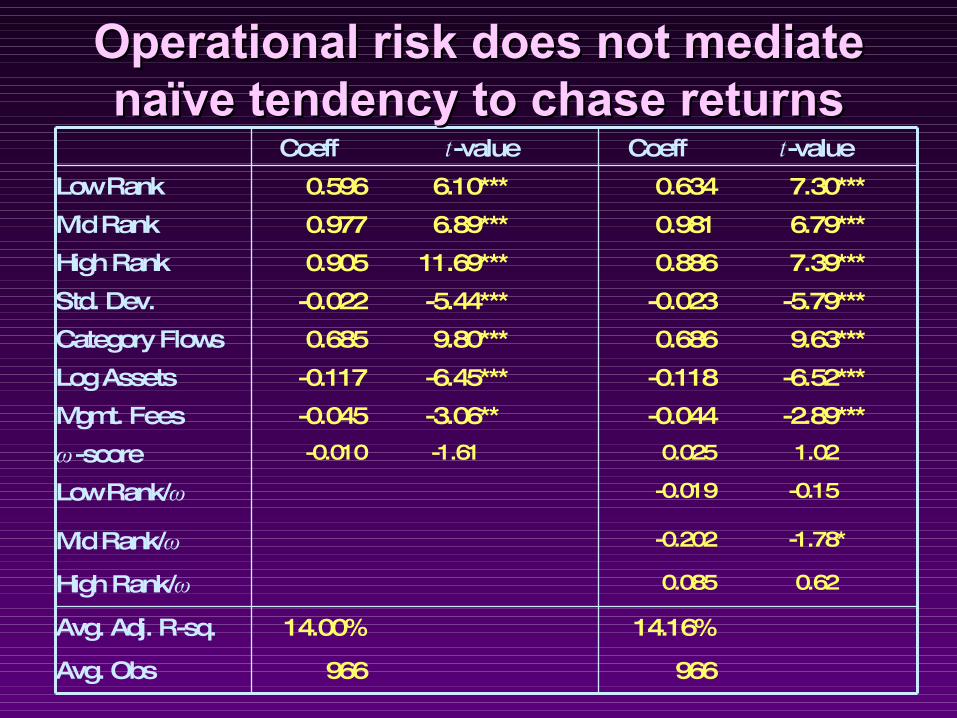
Coeff t-value Coeff t-value
Low Rank 0.596 6.10*** 0.634 7.30***
Mid Rank 0.977 6.89*** 0.981 6.79***
High Rank 0.905 11.69*** 0.886 7.39***
Std. Dev. -0.022 -5.44*** -0.023 -5.79***
Category Flows 0.685 9.80*** 0.686 9.63***
Log Assets -0.117 -6.45*** -0.118 -6.52***
Mgmt. Fees -0.045 -3.06** -0.044 -2.89***
ω-score -0.010 -1.61 0.025 1.02
Low Rank/ω -0.019 -0.15
Mid Rank/ω -0.202 -1.78*
High Rank/ω 0.085 0.62
Avg. Adj. R-sq. 14.00% 14.16%
Avg. Obs 966 966
Operational risk does not mediate Operational risk does not mediate naïve tendency to chase returnsnaïve tendency to chase returns

ConclusionConclusion
Important to quantify operational ris k

ConclusionConclusion
Important to quantify operational ris k
This ris k is as s oc iated with conflic ts ofinteres t

ConclusionConclusion
Important to quantify operational ris k
This ris k is as s oc iated with conflic ts ofinteres t
+ = Operational ris k conflic t low returns

ConclusionConclusion
Important to quantify operational ris k
This ris k is as s oc iated with conflic ts ofinteres t
+ = Operational ris k conflic t low returns
Operational ris k does not mediate the naïve tendency of inves tors to chas e
returns
ConclusionConclusion
Important to quantify operational ris k
This ris k is as s oc iated with conflic ts ofinteres t
+ = Operational ris k conflic t low returns
Operational ris k does not mediate the naïve tendency of inves tors to chas e
returns
Either inves tors do not unders tand operational ris k
Or inves tors know and do not care

Important implication
Hedge funds on average have pos itivealpha
Excluding operational ris k increas es alpha
Due diligence adds value to hedge fundinves tors
Sugges ts a new approach to hedge fundinves ting