lessons from capital market history - hillsdale inv for discussion • a look back at market returns...
TRANSCRIPT

Hillsdale Investment Management
This presentation is not to be redistributed in whole or in part without prior written authorization. The information and material in this presentation are for informational purposes only. They are not intended as investment, financial or other advice. The information in this presentation is not an offer to sell or a solicitation to buy any security nor does it constitute an offer by Hillsdale Investment Management to provide its investment advisory services in any jurisdiction in which, or to any person to whom, would not be permitted under applicable law. Further disclosures can be found at the end of the presentation
Lessons From Capital Market History August 2013
Harry Marmer, CFA, MBA – Executive Vice-President, Institutional Investment Services 416.913.3907/[email protected]

Topics for Discussion
• A Look Back At Market Returns
• Current Market Environment and Its Investment Implications
• The Arithmetic of Expected Bond and Stock Returns
• Investment Options in the Current Environment
2

“…Small Investors Flee Stock Market”7
The Death of Equities Is Still A Popular Idea
3
1 – Rizzo, Patrick.., “Stocks Sell-Off Sparked By Global Recession Worries”. (Sept 2011). The Bottom Line: MSN. Available Online. 2 – Rushe, Dominic. “US Stocks Plunge Amid Widespread Fears of Second Recession” (Sept 2011). The Guardian. Available Online. 3 – Campbell, Ian. “Global Sell Off Could Echo Summer of 2011”. (May 2012). Thomson Reuters. Available Online. 4 – Weinreich, Gil. “TrimTabs: Funds Continue to Flow Out of U.S Stocks” (Mar 2012). AdvisorOne. Available Online. 5 – Yousuf, Hibah. “Investors Dump US Stocks for 13th Straight Week”. (May 2012) CNN Money. Available Online. 6 – CNBC. “Global Stocks Slump on Fears and Uncertainty”, (Jun 2013). Available Online. 7 – Bowley, Graham. “In Striking Shift, Small Investors Flee Stock Market”., (Aug 2010). New York Times. Available Online. 8 – Popper, Nathaniel. “After, Facebook, More Fear of Stock Market”. (May 2012). New York Times. Available Online.

4
Investors Have Been Selling Stocks and Buying Bonds For Some Time Now
Source: BOA Merrill Lynch Global Equity Strategy, EPFR Global
Retail Cumulative Fund Flows Since 2006
Money Invested in Stocks
$767bn
Money Invested in Bonds
-572bn
All Bonds LO Equities
$800
600
400
200
0
-200
-400
-600
2006 2007 2008 2009 2010 2011 2012 2013
($ B
illio
ns)
5
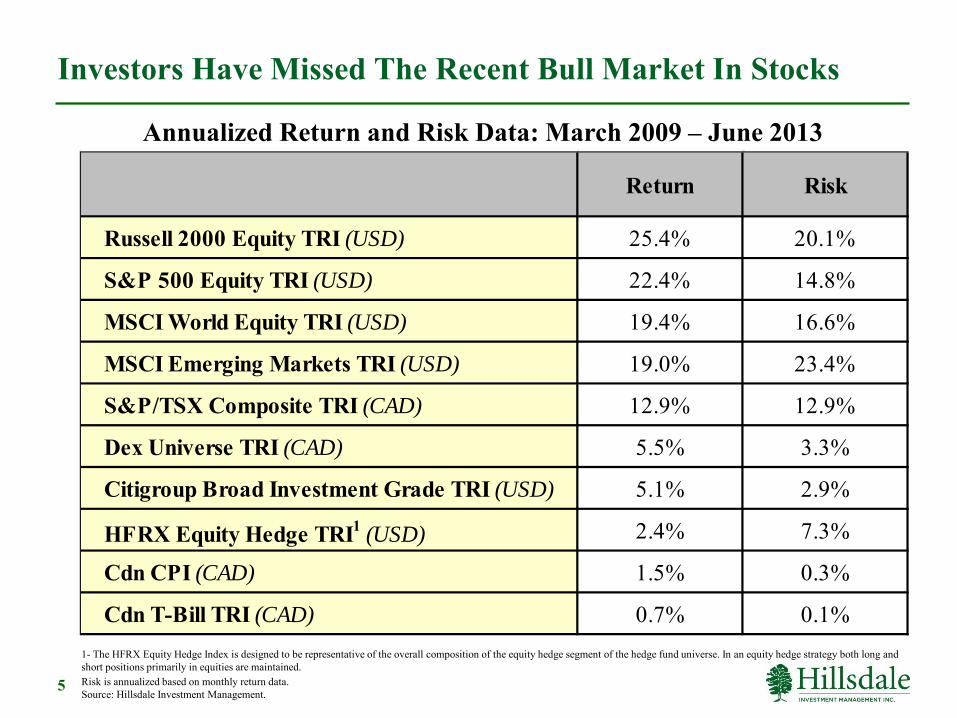
Investors Have Missed The Recent Bull Market In Stocks
Annualized Return and Risk Data: March 2009 – June 2013
Risk is annualized based on monthly return data. Source: Hillsdale Investment Management.
1- The HFRX Equity Hedge Index is designed to be representative of the overall composition of the equity hedge segment of the hedge fund universe. In an equity hedge strategy both long and short positions primarily in equities are maintained.
Return Risk
Russell 2000 Equity TRI (USD) 25.4% 20.1%
S&P 500 Equity TRI (USD) 22.4% 14.8%
MSCI World Equity TRI (USD) 19.4% 16.6%
MSCI Emerging Markets TRI (USD) 19.0% 23.4%
S&P/TSX Composite TRI (CAD) 12.9% 12.9%
Dex Universe TRI (CAD) 5.5% 3.3%
Citigroup Broad Investment Grade TRI (USD) 5.1% 2.9%
HFRX Equity Hedge TRI1 (USD) 2.4% 7.3%
Cdn CPI (CAD) 1.5% 0.3%
Cdn T-Bill TRI (CAD) 0.7% 0.1%

1%
2%
3%
4%
5%
6%
7%
8%
9%
10%
11%
12%
13%
14%
15%
1%
2%
3%
4%
5%
6%
7%
8%
9%
10%
11%
12%
13%
14%
15%
1790 1810 1830 1850 1870 1890 1910 1930 1950 1970 1990 2010
6 Source: See Hillsdale Investment Management . As of June 30, 2013.
Our Perspective Has Been Skewed By The Greatest Bond Bull Market Ever
US Government 30 Year Interest Rate 1790 - 2013
1979-1980 Second Oil Shock/Iranian Hostage Crisis and Recession of the Early 1980’s
1962-1973 Vietnam War
1941-1945 WW II
1929-1933 The Great Depression
1914-1918 WW I
Panic of 1907
1875 Gold Standard re-established
Panic of 1873
Gold Crash of 1869
Panic of 1837 followed by Depression (‘37-’43)
1846-1848 Mexican War followed by Panic of 1857 and ensuing Depression (‘57-’60)
1789 – US Constitution Ratified 1792 – Stocks Trade on Wall Street
2008-2009 Credit Crisis
1860-1865 American Civil War
1997 Asian Financial Crisis and LTCM
1973-1975 Oil Embargo Recession
MEDIAN
1981: 14.1%
June 30, 2013: 3.5%

Current and Foreseeable Capital Market Environment
1. Investor Risk Aversion Remains High
Investors Continue To Avoid “Risky” Assets Selling Stocks and Buying Bonds Contributing to Low and Negative Bond Yields
2. Diversification is Perceived To Be More Difficult
Investors Have Pursued Less Liquid Alternatives (Private Equity, Infrastructure, Real Estate etc…) In An Attempt to Diversify Risk
3. Cash and Bond Yields Are At Extraordinary Low Levels
Central Banks Policies Have Led to Extraordinary Low Yields for Cash & Bonds Distorting Typical Stock, Bond & Cash Relationships and Contributing to Low and Negative Real Bond Yields
4. Dividend Yields Are Higher Than Cash and Bond Yields
7

-1.5%
-1.0%
-0.5%
0.0%
0.5%
1.0%
1.5%
2.0%
2.5%
3.0%
3.5%
2003 2004 2005 2006 2007 2008 2009 2010 2011 2012 2013
Yiel
d
8
Negative & Low Real Treasury Yields Can Be Partially Attributable To Investor Risk Aversion
Source: St Louis Federal Reserve.
10-Year US Treasury Inflation-Indexed Yield, Constant Maturity
Daily, Jan 2003 – Jun 2013
June 30, 2013: 0.53%
Median: 1.7%
9
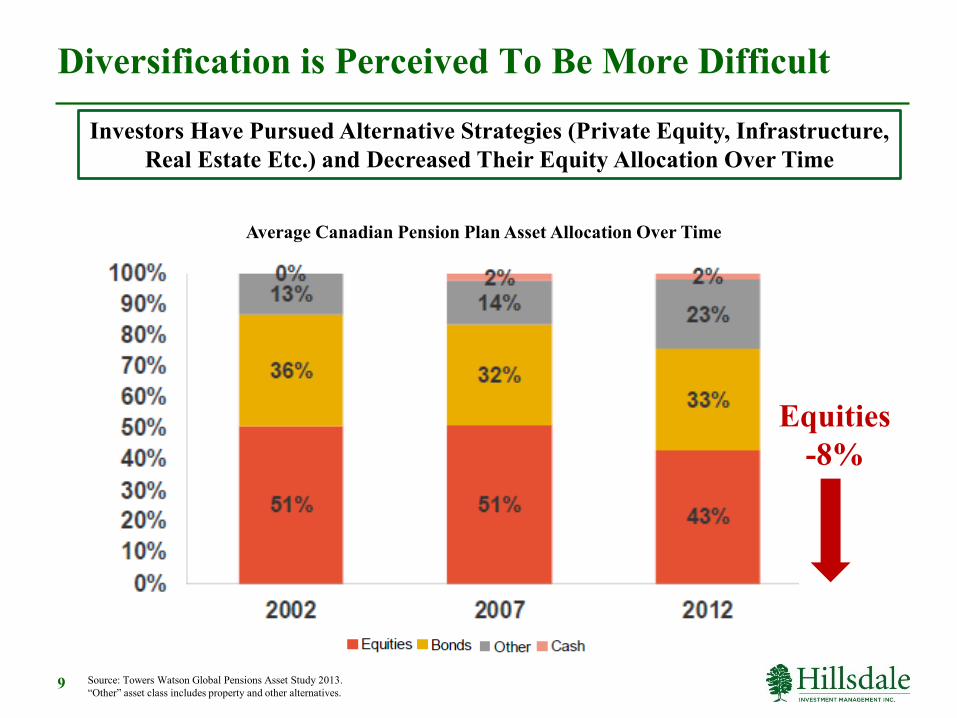
Diversification is Perceived To Be More Difficult
Source: Towers Watson Global Pensions Asset Study 2013. “Other” asset class includes property and other alternatives.
Average Canadian Pension Plan Asset Allocation Over Time
Investors Have Pursued Alternative Strategies (Private Equity, Infrastructure, Real Estate Etc.) and Decreased Their Equity Allocation Over Time
Equities -8%

The Liquidity Risk Premium For Private Equity is High Relative to Publicly Listed Companies
• Replacing Equities With Alternatives Is Substituting Liquid Investments for Illiquid Investments
• For Private Equity, “The Liquidity Risk Premium… Appears To Be An Essential Component To Fully Account For Average Private Equity Returns”1
10 1-“The Unconditional Liquidity Risk Premium Is About 3% Annually…The Inclusion Of This Liquidity Risk Premium Reduces Alpha to Zero”. Source: Franzoni, Francesco, Nowak, Eric, and Ludovic Phalippou. “Private Equity Performance and Liquidity Risk”. (2012). The Journal of Finance. Page 2356.
Liquidity Betas for Listed Stocks
*Fraction is the percentage of total number of betas.

0%
2%
4%
6%
8%
10%
12%
14%
16%
18%
4
5
6
7
8
9
10
1979 1983 1987 1991 1995 1999 2003 2007 2011
10 Y
ear
Gov
't B
ond
Yiel
d
Dur
atio
n of
10
Year
US
Gov
't B
ond
(Con
stan
t M
atur
ity)
Duration US 10 Year Gov't Bond Yield
11 Source: Hillsdale Investment Management
10 Year US Gov’t Bond Yield vs. Duration Monthly, Dec 1979 – Jun 2013
Treasury Bond Interest Rate Sensitivity Has Nearly Doubled As Interest Rates Have Dropped
Duration is a measure of interest rate risk as it approximates a fund’s price change in response to interest rate changes. For example, a fund or individual bond with a 10-year duration can be expected to change in price by approximately 10 percent when interest rates change by 1 percent. Source: Thomas Collimore. “Five Things Every Investor Should Know about Bond Funds”. (2010). CFA Institute.

Expected Returns, Risk and Correlations
• There is a Crucial Distinction Between Realized Returns and Expected Returns.
• Since Returns Vary Over Time, Past Average Returns May Be Poor Predictors of Future Returns – And They Can Even Be Poor Proxies of Past Expected Returns.1
12 1- See Antti Ilmanen (2012). “Expected Returns On Major Asset Classes,” Research Foundation of CFA Institute, John Wiley & Sons, Inc., Vol. 2012, No. 1 (June): 1-166.
“I Skate To Where the Puck is Going To Be, Not Where It Has Been.” - Wayne Gretzky

13
In Just Two Months, The US Treasury Bond Market Has Corrected Some of Its Overvaluation
Nominal Yield* Real Yield* Expected
or Breakeven Inflation
1.70% -0.64% 2.34%
= +
*Real Yield is based on 10-Year US Treasury Inflation-Indexed Security Yield, Constant Maturity as of April 30, 2013 and June 30, 2013. Nominal Yield is current yield on 10 Year US Gov’t Bonds as of April 30, 2013 and June 30, 2013.
2.52% 0.53% 1.99%
April = +
= + June

Investment Options In A Low Return Environment
1. Reduce Return Expectations
2. Consider “Higher Yielding” Strategies
3. Utilize Active Investment Management
4. Evaluate “Smart” Beta Strategies
14
3.4% 3.7%4.5% 4.1%
2.8% 2.2% 2.9% 3.4%
1.5%
6.3%5.9%
8.2%
7.8%
3.4%0.9%
5.6%
0%
2%
4%
6%
8%
10%
12%
14%
1956-1959 1960's 1970's 1980's 1990's 2000's 2010's 1956-2012
Dividends Capital Appreciation
4.8%
10.0%10.4%
12.2%
10.6%
5.6%
9.0%
3.8%
15
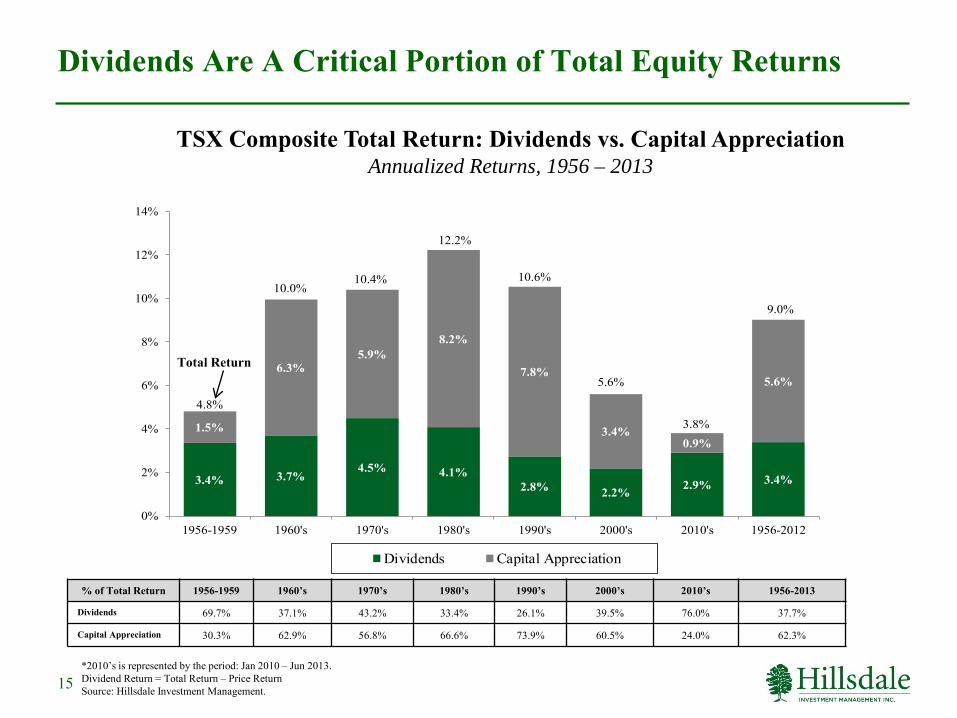
Dividends Are A Critical Portion of Total Equity Returns
TSX Composite Total Return: Dividends vs. Capital Appreciation Annualized Returns, 1956 – 2013
% of Total Return 1956-1959 1960’s 1970’s 1980’s 1990’s 2000’s 2010’s 1956-2013
Dividends 69.7% 37.1% 43.2% 33.4% 26.1% 39.5% 76.0% 37.7%
Capital Appreciation 30.3% 62.9% 56.8% 66.6% 73.9% 60.5% 24.0% 62.3%
Total Return
Source: Hillsdale Investment Management.
*2010’s is represented by the period: Jan 2010 – Jun 2013. Dividend Return = Total Return – Price Return

-5%
0%
5%
10%
15%
20%
25%
-5%
0%
5%
10%
15%
20%
25%
1965 1970 1975 1980 1985 1990 1995 2000 2005 2010
Dividend Return Price Return Total Return
16
Dividends Are The Only Constant in Variable Equity Returns
TSX Composite Rolling 10 Year Annualized Price Returns vs. Dividend Returns Monthly, Jan 1956 – Jun 2013
Price Return
Dividend Return
Total Return
Mean 6.3% 3.5% 9.8%Median 6.3% 3.6% 9.4%Stdev 2.8% 0.9% 3.1%High 14.8% 5.4% 19.5%Low -0.2% 1.9% 2.8%
Statistics
Source: Hillsdale Investment Management. Dividend Return = Total Return – Price Return

Use Active Investment Management If You Have An Edge
Asset Class Breadth Skill Odds of Success
Cdn. Fixed Income Low Low Low
Cdn. Equity Low Avg. Avg.
Cdn. Small Cap Avg. High High
U.S. Equity High Avg. Avg.
U.S. Small Cap High High High
Global Equity High High High
Emerging Markets High High High
17 Source: See introduction to “Perspectives on Institutional Investment Management” By Harry S. Marmer, Rogers Publishing, (2002).

0%
5%
10%
15%
20%
25%
30%
0.00 0.25 0.50 0.75 1.00 1.25
Ret
urn
Beta
S&P/TSX Composite TRI(7.4%, 1)
Cdn Equity Min Risk(12.4%, 0.5)
Leveraged Cdn Equity Min Risk(24.7%, 1)
18
Evaluate “Smart” Beta Strategies
Simulated Annualized Return vs. Beta Monthly, Jan 1990 – Jun 2013
Source: Hillsdale Investment Management

Concluding Thoughts
19
• Capital Market History Has Much To Teach Us
• However, The Future Only Rhymes With The Past
• Expected Returns & Risks Should Always Be Forward Looking
• About Half The Correction in the Bond Market Has Occurred • In A Low Return Environment, Strategies to Increase Total Equity
Returns Include: − Employ Higher Yielding Strategies − Utilize Active Investment Management Where It Makes Sense − Small Cap Offers Significant Alpha − Evaluate “Smart” Beta Strategies
• “In The “Crackberry” Generation, Differentiating Between Signal and Noise Will Continue To Be An Increasing Challenge For All Investors”

20
Harry Marmer
Harry Marmer, BBA, MBA, CFA, Executive Vice President, Institutional Investment Services, Partner. Mr. Marmer joined Hillsdale Investment Management in 2008 and is Executive Vice President, Institutional Investment Services. Prior to joining Hillsdale, Mr. Marmer led the Canadian institutional investment business of Franklin Templeton Investments and before that the institutional business of the Russell Investment Group. He was also a principal and co-head of Mercer's Canadian Investment Consulting Practice. Mr. Marmer is a frequent conference speaker and has authored more than 47 articles. His book, Perspectives in Investment Management, was published in September 2002. He has served on a number of professional and industry boards and was past president of the Toronto CFA Society. Mr. Marmer received the Volunteer of Distinction Award from the Toronto CFA Society and was awarded the Society’s Research Award. He has an MBA and a BBA, finance and investments, York University.

21
Disclosures Performance and other data in this presentation are shown for illustrative purposes only. Past performance is not indicative of future performance. The simulated returns are based on a quantitative simulation where stocks are selected based on a multi-factor ranking system. The simulated returns are shown gross of fees and are calculated in Canadian dollars unless otherwise stated. No representations are being made that the investment process will achieve similar returns on a going forward basis. Investors should not take this example or the data included in the presentation as an indication, assurance, estimate or forecast of future results. The actual performance returns may differ materially from the returns shown for reasons including, but not limited to, investment restrictions and guidelines, fees and other expenses, cash holdings, timing of trade execution and fluctuations in the market.