lessons for tax policy and administration · pdf fileafrica and south korea, on the priority...
TRANSCRIPT
Domestic Resource Mobilisation for PovertyReduction in East Africa:
Lessons for Tax Policy and Administration
II
Copyright © 2011 African Development Bank Group
Angle des l’avenue du Ghana et des Rues
Pierre de Coubertin et Hédi Nouira
BP 323 -1002 TUNIS Belvédère (Tunisia)
Telephone: +216 71 333 511 / 71 103 450
Internet: www.afdb.org
This document may be ordered from:
The Knowledge & Information Center (KVRC)
African Development Bank
BP 323 -1002 TUNIS Belvédère (Tunisia)
Telephone: +216 71103402
Rights and Permissions
All rights reserved.
The text and data in this publication may be reproduced as long as the source is cited. Reproduction for commer-
cial purposes is forbidden.
Legal Disclaimer
The findings, interpretations and conclusions expressed in this report are those of the author/s and are not
necessarily those of the African Development Bank. In the preparation of this document, every effort has been made
to offer the most current, correct and clearly expressed information possible. Nonetheless, inadvertent errors can
occur, and applicable laws, rules and regulations may change. The African Development Bank makes its
documentation available without warranty of any kind and accepts no responsibility for its accuracy or for any
consequences of its use.
Cover design: ADB
Cover photo: ADB
Typesetting and interior design: ZAZA CREATION
Photo credits: ADB


Foreword
Preface
Acknowledgements
List of Abbreviations
Glossary of definitionsof selected terms
Part IComparative Analysis
and Best Practices
Chapter 1 A Policy Note
Part IIInternational experienceand lessons
Chapter 2 South Africa
Chapter 3 South Korea
Part III East Africa experienceand lessons
Chapter 4 Burundi
Chapter 5 Kenya
Chapter 6 Rwanda
Chapter 7 Tanzania
Chapter 8 Uganda
Chapter 9 Proceedingsof the Domestic ResourcMobilization StakeholderWorkshop
Domestic Resource Mobilisation for Poverty Reduction in East Africa: Lessons for Tax Policy and Administration
5
Table of Contents
VI
VIII
X
XII
XV
3
25
78
118
148
198
240
276
317
IV

VI
Foreword
Successful implementation of Poverty Reduction
Strategy Papers (PRSPs) and National Development
Plans (NDPs) depends on effective resource mobilisa-
tion and utilisation. In recent years, development aid
has been crucial in filling the financing gap. However,
on-going global financial uncertainty is likely to lead to
reduced aid and unpredictable private capital flows to
Africa. Continued stability in PRSP or NDP financing
will, thus, depend on a country’s ability to strengthen
their domestic resource mobilisation (DRM) efforts. This
is especially pertinent in a region like East Africa where
countries have historically relied heavily on development
aid to finance their public spending.
This flagship report is the outcome of a study that has
been conducted over the last two years and also
complements the theme of the Bank’s 2010 African
Economic Outlook on ‘Public Resource Mobilisation
and Aid in Africa’. The aim of the study was, through
case studies, to draw lessons for tax policy and
administration in order to enhance DRM in East Africa.
The case studies covered the five East African
Community Partner States (Kenya, Tanzania, Uganda,
Rwanda and Burundi) and two non-members (South
Africa and South Korea). South Africa was chosen as
a success story from within the African continent,
whilst South Korea was selected as it has been able
to mobilise significant domestic resources to support
rapid structural and economic transformation since
the 1960s.
Several Development Partners have already been wor-
king in East Africa to support countries in enhancing DRM
and achieve their PRSP or NDP goals. The African
Development Bank as a founding member of the African
Tax Administration Forum – the focal point for sharing
good practices and setting strategic direction for African
Tax Administration – undertook this study to build on
previous efforts to enhance DRM in East Africa. This
study is also aligned with the Bank’s mandate to support
better coordination in policy formulation and implemen-
tation between Regional Member Countries (RMCs), so
as to foster more integrated regions across Africa.
We expect that the findings of this report will be used in
the East African region, as well as in other countries
across Africa, to guide the appropriate reforms and
enhance a country’s DRM capabilities. This report is
also expected to contribute to harmonisation of tax
regimes and, thus, support the wider regional integra-
tion agenda of East African Partner States.
The Bank looks forward to continued dialogue and
collaboration with various stakeholders, in order to
develop bold and innovative approaches for enhancing
DRM in its RMCs.
Aloysius Uche Ordu
Vice President
Country and Regional Programs and Policy
African Development Bank Group


VIII
Preface
The African Development Bank (AfDB) has partnered
with the African Tax Administration Forum (ATAF) and the
East African Community (EAC) Secretariat on a Domes-
tic Resource Mobilisation (DRM) project for the EAC
partner states. The project is designed to build capacity
for tax administrators and tax policy experts in the
Bank’s Regional Member Countries in the EAC sub-re-
gion, with an emphasis on sharing lessons from within
the sub-region and from South Africa, South Korea and
other international best practice.For this work, DRM is
defined to include only tax policy and administration and
excludes other possible components of DRM, such as
domestic financial markets.
The project’s objective is to make recommendations,
from case studies of the EAC partner states, South
Africa and South Korea, on the priority reforms and
ways to sequence and implement them so that EAC
countries can significantly enhance their DRM efforts.
The case studies seek to respond to the following
question: What key factors have contributed to or
inhibited DRM in the EAC? The achievements and
lessons contained in the case studies will inform the
priority reforms for EAC partner states and how these
reforms should be sequenced and implemented.
The project was funded by the Korea-Africa Fund for
Economic Cooperation (KOAFEC) Trust Fund and
involved three phases: (i) a study tour to Korea for tax
policy and tax administrators from EAC partner states
– completed in December 2009; (ii) preparation of
country case studies for the EAC partner states, South
Africa, and South Korea –completed in October 2010;
and (iii) a stakeholder validation seminar held in
Kampala from 9-10 November 2010. The core principle
of the framework used in the project is to analyse the
interaction between the political economy of tax per-
formance and tax reforms. An explanatory approach is
adopted to match patterns from analysis of the litera-
ture and key informant interviews.
South Africa and South Korea were selected as
benchmarks in this project for several reasons. At 29.1%
of GDP (2007/08), South Africa has one of the highest
emerging market economy tax collection rates. This
success is linked to several factors including the post
apartheid reforms spearheaded by the Katz Commission
of Enquiry and a tax administration model underpinned
by autonomy and unwavering political support.
Korea’s rise from a highly impoverished country in the
1960s to an economic super power, in just one genera-
tion, also offers key lessons for the EAC partner states.
In its early years, the socio-economic conditions were
similar in many respects to those of EAC countries today.
Korea’s achievements are attributed to, among others, a
series of successful tax policies aimed at promoting
capital formation and export industries, and strategies to
progressively reduce dependence on external assis-
tance.
This flagship report is organized as follows: Part I
presents the Policy note; Part II discusses the
international experience in DRM; and Part III elaborates on
the EAC achievements, challenges, drivers, and areas for
reform.
I hope that the findings of this project will motivate
additional research, further the debate on appropriate
policies and reforms to enhance DRM, and, ultimately,
greatly improve the mobilisation of domestic resources in
the EAC region and in other African countries.
Gabriel Negatu
Regional Director
Country and Regional Programming
Eastern Africa Region I


Acknowledgements
This report has been prepared by a core team in the Afri-
can Development Bank’s (AfDB) Regional Department
East ‘A’ (OREA). The team was led by Edward Sennoga
and Richard Walker (Country Economists, OREA). Mrs.
Catherine Baumont-Keita (Lead Economist, OREA) pro-
vided overall guidance to the team. Christian Lim (Private
Sector Specialist) was instrumental in initiating and ma-
naging the project in its early stages. The team also be-
nefitted from the general direction provided by Mr.
Gabriel Negatu, (Director, OREA) and Mrs. Diarietou
Gaye (former Director OREA).
Edward Sennoga and Richard Walker prepared the Po-
licy Note (Chapter 1). Christian Lim and Gil Seong Kang
(formerly with the Economic Development Research De-
partment at the AfDB), with assistance from Richard Wal-
ker, prepared the South Korea country case study
(Chapter 3). Consultants (PricewaterhouseCoopers) as-
sisted in the preparation of the South Africa and East
African country case studies (Chapters 2 and 4-8). Eva-
rist Twimukye and Jeff Alumai (both the Economic Policy
Research Center in Uganda) assisted in documenting
proceedings from the Domestic Resource Mobilisation
stakeholder workshop (Chapter 9).
Mr. Aloysius Ordu (Vice President, Country and Regio-
nal Programmes), Mr. Steve Kayizzi-Mugerwa (Director,
Regional Department East ‘B’), and Ms. Radhika Bharat
(Investment Officer) helped initiate the project and were
involved in its early design.
The production of this report and all study outputs were
made possible by the generous financial support from
the Korea-Africa Fund for Economic Cooperation. The
case studies and policy note benefitted from the pro-
ceedings of a high level workshop on DRM held in Kam-
pala from 9-10 November, 2010. Workshop participants
(see Chapter 9) included the African Tax Administration
Forum, East African Community Secretariat, EAC Minis-
ters of Finance and Revenue Authority Commissioners
General, representatives of regional organisations, tax-
payer representatives, private sector organisations, aca-
demics, think-tanks, and bilateral and multilateral
development partners. We are grateful for the extremely
productive exchanges and valuable insights provided to
us in preparation of the case studies and during the
workshop.
The project also benefitted from valuable feedback pro-
vided by staff in different departments of the AfDB at
headquarters and in field offices (Kenya, Tanzania,
Uganda and Rwanda); in particular Andrey Klevchuk,
Alex Mubiru, Désiré Vencatachellum, Toto Same Achille
Charles, Makonnen Negatu, Joachim Hoettcke, Albert
Mafusire, Shirley Jean, Walter Odero, Nathalie Francken,
Choi Ji Eun, and Mariki Wilberforce. External reviewers
were Tom Richardson, Kalyebbi B. Magoola, Tim La-
mont, Dave Beer, Andrew Okello, Charles Lwanga,
Obald Hakizimana, Natalie Skerritt, Bohela Lunogela,
Mary Ngelela Maganga, Scott Rogers, Jonah Ogaro,
and John Nijiraini.
We are grateful to Fetor Komlan, Aminata Traore, Flo-
rence Wamala, and Robert Kimbugwe for coordinating
the financial and administrative aspects of the project.
Book design, editing and production where coordinated
by Catherine Baumont-Keita, Edward Sennoga, Richard
Walker, and Arshad Mahmud (copy editing consultant).
There is not enough space here to name each person
who contributed immensely to the successful comple-
tion of this report. As a result, we seek the indulgence of
all the contributors in accepting this blanket acknowled-
gement and appreciation of their efforts. We are indeed
very thankful to all of them.
Edward B. Sennoga
Richard Walker
Editors
X


List of abbreviations
XII
AACB Association of African Central Banks
ACBF Africa Capacity Building Foundation
ACS Anti-Corruption and Security
AEO Authorised Economic Operator
AfDB African Development Bank
AfDF African Development Fund
AFRODAD African Forum and Network on Debt and
Development
AIDS Acquired Immunodeficiency Syndrome
AMT Alternative Minimum Tax
ANC African National Congress
APRM African Peer Review Mechanism
ARA Autonomous Revenue Authority
ASYCUDA Automated System for Customs Data
ATAF African Tax Administration Forum
ATR Advance Tax Ruling
AU African Union
BIF Burundi Franc
BLNS Botswana, Lesotho, Namibia and
Swaziland
BMS Block Management System
BNR National Bank of Rwanda
BSC Balanced Score Card
BSP Budget Strategy Paper
CAGR Compounded Annual Growth Rate
CAMIS Cargo Management Information System
CCA Customs Controlled Area
CDF Constituency Development Fund
CED Customs and Excise Department
CET Common External Tariff
CGT Capital Gains Tax
CIT Corporate Income Tax
CITPROD Corporate Income Tax Revenue
Productivity
CMVRS Central Motor Vehicle Registration
System
CNDD National Council for the Defense of
Democracy
COMESA Common Market for East and Southern
Africa
CPAF Common Performance Assessment
Framework
CPI Consumer Price Index
CTL Commercial Transaction Levy
CTS Compliant Trader Scheme
DAD Development Assistance Database
DFID Department for International Development
DPAF Development Performance Assessment
Framework
DRC Democratic Republic of Congo
DRD Domestic Revenue Department
DRM Domestic Resource Mobilization
DTD Domestic Tax Department
EABC East African Business Council
EAC East African Community
EASSy Eastern Africa Submarine Cable System
eFiling Electronic Filing
EIU Economist Intelligence Unit
EPRC Economic Policy Research Centre
EPZ Export Processing Zone
E-registration Electronic registration
ERP Economic Reform Programme
ERS Economic Recovery Strategy for Wealth
and Employment Creation
eTax Integrated Tax Management System
ETR Electronic Tax Register
EU European Union
ExCO Executive Committee
FAQ Frequently Asked Question
FDD Forces for the Defence of Democracy
FDI Foreign Direct Investment
FIAS Financial Investment Advisory Service
FIFA Fédération Internationale de Football
Association
FTSE Financial Time Stock Exchange
GBS General Budget Support
GDP Gross Domestic Product
GEAR Growth Employment and Redistribution
GNP Gross National Product
GoB Government of Burundi

GoK Government of Kenya
GoR Government of Rwanda
GoT Government of the United Republic of
Tanzania
GoU Government of Uganda
GP General Public
HIPC Heavily Indebted Poor Countries
HIV Human Immunodeficiency Virus
ICT Information and Communication
Technology
ID Identification
IDOs International Development Organisations
IDZ Industrial Development Zone
IEA Institute of Economic Affairs
IEP Integrity Enhancement Programme
IMF International Monetary Fund
ISO International Standards Organisation
ITA Institute of Tax Administration
ITMS Integrated Tax Management System
ITU International Telecommunications Union
IVR Interactive Voice Response
KAM Kenya Association of Manufacturers
KANU Kenya African National Union
KIPPRA Kenya Institute of Public Policy Research
and Analysis
KRA Kenyan Revenue Authority
KRATI Kenya Revenue Authority Training
Institute
KWATOS Kilindini Water Front Operating System
LATF Local Authority Transfer Fund
LBC Large Business Centre
LTD Large Taxpayer Department
LTO Large Taxpayers’ Office
M&E Monitoring and Evaluation
MDG Millennium Development Goals
MDRI Multilateral Debt Reduction Initiative
MINECOFIN Ministry of Finance and Economic
Planning
MoFPED Ministry of Finance, Planning and
Economic Development
MP Member of Parliament
MPER Ministerial Public Expenditure Review
MSE Micro and Small Enterprise
MTBPS Medium Term Budget Policy Statement
MTEF Medium Term Expenditure Framework
MUB Manufacturing Under Bond
N/A Not Applicable
NARC National Rainbow Coalition
NDP National Development Plan
NDP National Development Plan
NESP National Economic Survival Programme
NGO Non-Governmental Organisation
NRM National Resistance Movement
NSE Nairobi Stock Exchange
OBR Office Burundais Des Recettes/ Revenue
Authority of Burundi
ODA Official Development Assistance
OECD Organisation for Economic Cooperation
and Development
PAYE Pay As You Earn
PBO Public Benefit Organisation
PEAP Poverty Eradication Action Plan
PER Public Expenditure Review
PIN Personal Identification Number
PIT Presumptive Income Tax
PITPROD Personal Income Tax Revenue
Productivity
PRGF Poverty Reduction Growth Facility
PRSP Poverty Reduction Strategy Paper
PS Permanent Secretary
PSF Private Sector Federation
PTA Preferential Trade Area
PwC PricewaterhouseCoopers
RADDEX Revenue Authority Digital Data Exchange
RARMP Revenue Administration Reform and
Modernisation Programme
RDB Rwanda Development Board
RDP Reconstruction and Development
Programme
RFT Tax on Retirement Funds
RPD Revenue Protection Department
RPF Rwandan Patriotic Front
XIII
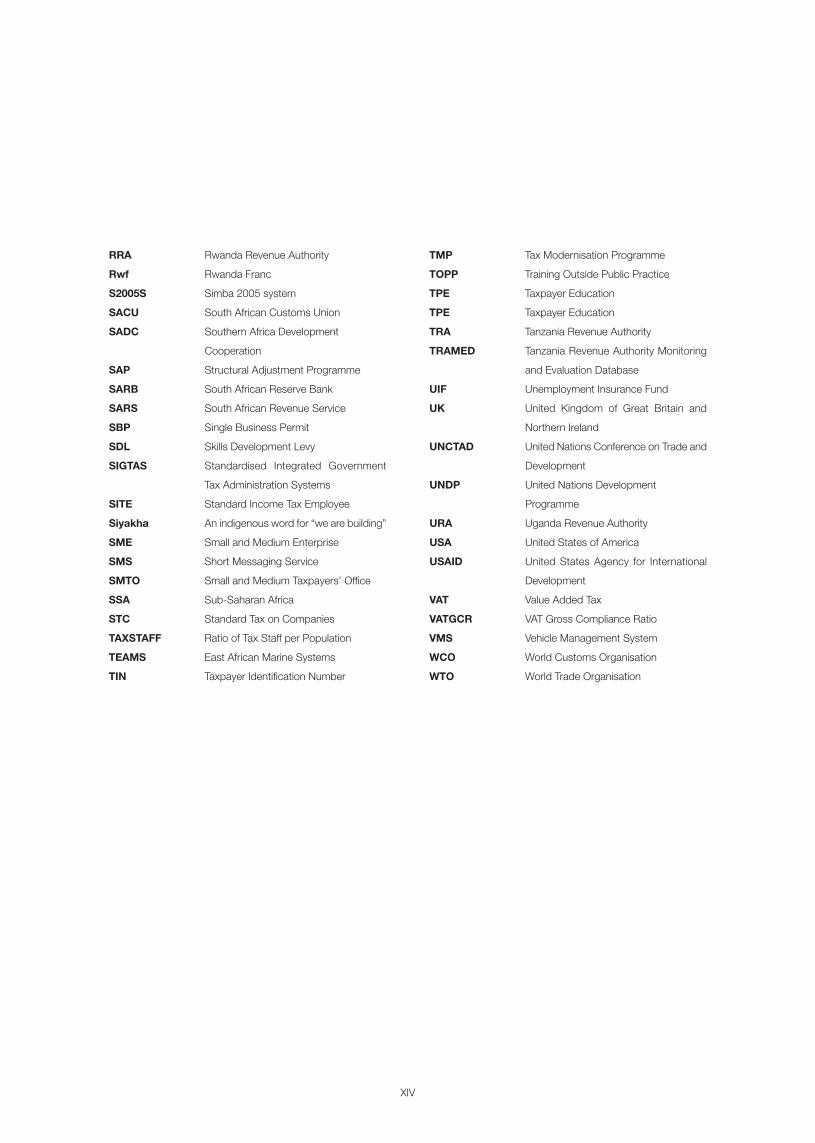
RRA Rwanda Revenue Authority
Rwf Rwanda Franc
S2005S Simba 2005 system
SACU South African Customs Union
SADC Southern Africa Development
Cooperation
SAP Structural Adjustment Programme
SARB South African Reserve Bank
SARS South African Revenue Service
SBP Single Business Permit
SDL Skills Development Levy
SIGTAS Standardised Integrated Government
Tax Administration Systems
SITE Standard Income Tax Employee
Siyakha An indigenous word for “we are building”
SME Small and Medium Enterprise
SMS Short Messaging Service
SMTO Small and Medium Taxpayers’ Office
SSA Sub-Saharan Africa
STC Standard Tax on Companies
TAXSTAFF Ratio of Tax Staff per Population
TEAMS East African Marine Systems
TIN Taxpayer Identification Number
TMP Tax Modernisation Programme
TOPP Training Outside Public Practice
TPE Taxpayer Education
TPE Taxpayer Education
TRA Tanzania Revenue Authority
TRAMED Tanzania Revenue Authority Monitoring
and Evaluation Database
UIF Unemployment Insurance Fund
UK United Kingdom of Great Britain and
Northern Ireland
UNCTAD United Nations Conference on Trade and
Development
UNDP United Nations Development
Programme
URA Uganda Revenue Authority
USA United States of America
USAID United States Agency for International
Development
VAT Value Added Tax
VATGCR VAT Gross Compliance Ratio
VMS Vehicle Management System
WCO World Customs Organisation
WTO World Trade Organisation
XIV

XV
CITPRODIt indicates how well CIT does in terms of producing revenue, given the prevailing tax rate.It is calculated by dividing total corporate income tax revenues by GDP and then dividing thisby the general corporate income tax rate.
PITPRODIt attempts to provide an indication of how well the personal income tax in a country does interms of producing revenue. It is calculated by taking the actual revenue collected as apercentage of GDP, divided by the weighted average PIT rate.
Tax effort Actual tax revenue as a percentage of estimated potential tax revenue
Tax gap The difference between estimated potential tax revenue and actual tax revenue
VATCGRThis is a measure of how well the VAT produces revenue for the government. It is computedby dividing VAT revenues by total private consumption in the economy and then dividing thisby the VAT rate.
Glossary of definitions of selected terms

Part I
Comparative Analysisand Best Practices

Chapter 1
A Policy Note
Domestic Resource Mobilisation for Poverty Reduction in East Africa: Lessons for Tax Policy and Administration
3
Summary of Key Findings
Domestic Resource Mobilisation (DRM) is a corners-
tone of broad-based development. More specifically,
generation of savings and taxes from domestic
resources and their allocation to productive econo-
mic and social sectors is vital for bridging Africa’s
fiscal gap. To be fair, Official Development Assistance
(ODA) can bridge some of this gap, but ultimately it
cannot substitute for well-established mechanisms
that generate domestic revenue. The East African
Community (EAC) partner states have been imple-
menting various tax reforms since the 1990s,
including establishment of autonomous revenue
authorities (ARA), simplifying tax systems, improving
revenue collection efficiency and reducing tax
evasion/avoidance. However, domestic resource
mobilisation through taxation is still below its poten-
tial. Other measures such as revenue productivity and
VAT efficiency are also low, which indicate that
additional scope exists for expanding the tax base
without compromising economic growth.
The African Development Bank (AfDB), in partnership
with the African Tax Administration Forum (ATAF), the
EAC Secretariat and with funding from the Korea-Africa
Fund for Economic Cooperation, has undertaken a
study aimed at sharing lessons learned from DRM
efforts through case studies of the EAC partner states,
South Africa and South Korea. These studies – which
focus exclusively on tax revenues – examine the key
challenges to achieving greater revenue mobilisation in
each EAC country.
This Policy Note summarises the key lessons for impro-
ving tax revenue mobilisation in three broad areas,
including: (i) general enabling environment for tax policy
and administration; (ii) tax policy and legislative frame-
works’ (iii) and tax administration. In general, the enabling
environment for domestic revenue mobilisation is weak
across the EAC region. At the same time, tax policy is not
rigorously linked to a country’s development strategy and
tax legislation is either outdated or not enforced. Although
all revenue authorities have implemented measures to
improve tax administration efficiency, several weaknesses
in compliance management and enforcement continue
to constrain their mobilisation efforts.
The Policy Note concludes by identifying short- and
longer-term priority recommendations for increasing
EAC countries’ tax revenue mobilisation and expanding
their tax bases. The short-term priorities are defined as
those actions which are within the ambit of the Ministry
of Finance or the Revenue Authority. The longer-term
priorities are, however, those which are outside their
purview and lie at a broader and/or more political level.
The short-term measures include:
(i) Reviewing tax incentives and exemptions so as
to eliminate the unproductive ones;
(ii) Providing each tax payer with a unique tax
identification number (TIN) and linking this to the
taxpayer’s personal ID or company registration
number;
(iii) Leveraging third party information from company,
property, and vehicle registries to expand the tax
base; and
(iv) Improving compliance management and
enforcement by improving taxpayer services and
undertaking comprehensive taxpayer risk
profiling.
The longer-term measures comprise:
(v) Aligning tax policies – and using taxes as an
instrument – to achieve broad national develop-
ment objectives;
(vi) Ensuring managerial autonomy of the reve-
nue authorities in accordance with existing
Domestic Resource Mobilisation for Poverty Reduction in East Africa: Lessons for Tax Policy and Administration
4
legislation, and holding them accountable to
an agreed set of performance measures;
and
(vii) Expanding access to financial services for
facilitating tax enforcement and compliance,
while managing the potential trade-off between
savings mobilisation and using financial infor-
mation for tax administration.
Simultaneous implementation of these seven recom-
mendations is likely to have the strongest impact on
enhancing tax revenue mobilisation and broadening
the tax base in EAC countries.
Domestic Resource Mobilisation for Poverty Reduction in East Africa: Lessons for Tax Policy and Administration
5
Introduction
Domestic Resource Mobilisation (DRM) - the generation
of savings and taxes from domestic resources and their
allocation to economically and socially productive
investments – is vital for bridging Africa’s fiscal gap.
Although Official Development Assistance (ODA) can
bridge some of this gap, it ultimately cannot substitute for
well-established mechanisms that generate domestic
revenue. The EAC partner states have been implemen-
ting various tax reforms since the 1990s, including
establishment of autonomous revenue authorities,
simplifying tax systems, improving revenue collection
efficiency and reducing tax evasion/avoidance. These
reforms have mostly been geared towards broadening
tax bases, rationalising taxes to improve investment
climate, enhancing compliance and improving other
aspects of tax revenue administration.
However, DRM through taxation is still below its potential.
For example, during the decade leading to 2006 and
2008, tax-to-GDP ratios in the EAC sub-region ranged
from 12.3% to 22.1%, compared to an average of 35.6%
and 25.4% for the Organisation for Economic Coopera-
tion and Development (OECD) countries and South Africa
respectively. Other measures such as revenue producti-
vity and VAT efficiency are also low, which indicate
additional scope exists for expanding the tax base
without compromising economic growth. Moreover,
following reduction in ODA commitments to developing
countries caused by the recent global financial crisis,
there is renewed urgency for the EAC partner states to
improve mobilisation of public resources.
The African Development Bank (AfDB) ), in partner-
ship with the African Tax Administration Forum
(ATAF), the EAC Secretariat and with funding from
the Korea-Africa Fund for Economic Cooperation,
has undertaken a study aimed at sharing lessons
learned from DRM exercises through case studies
of EAC partner states, South Africa and South
Korea. These studies—which focus exclusively on
tax revenues— examine the key challenges to
achieving greater revenue mobilisation in each
country.
The various case studies reveal at least three key
challenges impeding revenue mobilisation in the EAC.
These include the general absence of voluntary
compliance among taxpayers, weak relationships
between tax policy and national development objec-
tives, and weaknesses in tax administration. This
Policy Note summarises lessons for improving tax
revenue mobilisation in three broad areas: (i) general
enabling environment for tax policy and administra-
tion; (ii) tax policy and legislative frameworks; and (iii)
tax administration.
The rest of this Policy Note is organised as follows.
Section 2 discusses the utility of a robust enabling
environment to DRM, while Sections 3 and 4 present
reform priorities for tax policy and legislation and tax
administration respectively. Section 5 summarises
the key reforms to enhance tax revenue mobilisation
in the EAC partner states.

Domestic Resource Mobilisation for Poverty Reduction in East Africa: Lessons for Tax Policy and Administration
6
It consists of two aspects: (i) political economy
environment; and (ii) national economic and institutional
infrastructure.
Political economy environment
Information and evidence gathered in the country case
studies show that creating an enabling political economy
environment is crucial to achieving and sustaining high
performance in tax revenue mobilisation. To this end,
EAC countries generally need to pay attention to two
important facets of the political economy of taxation.
Forging a fiscal contract andengendering tax morale
A fiscal contract is where governments, acting as agents
of taxpayers, sell services in return for revenue. Under
such a scenario, the more accountable a government is
perceived to be, the more willing (higher level of voluntary
compliance) tax payers will be to pay for the servicesoffe-
red. This improved ‘tax morale’ will limit the case for
coercion and, thereby, reduce collection costs and
facilitate tax administration. The case studies have shown,
however, that a fiscal contract does not exist in the EAC
region and, as a result, tax morale is either non-existent or
very low. This perhaps explains why there is widespread
evasion (e.g., high tax gaps) and relatively low levels of tax
revenue generation in the region. Moreover, even though
four of the EAC countries (Kenya, Rwanda, Tanzania and
Uganda) have introduced comprehensive tax reforms,
their implementation and performance are constrained by
the absence of a fiscal contract and very low tax morale.
Such a contract is missing due, among other things, to
high levels of perceived corruption, uncertainty (and lack
of communication) about the use of tax revenues, and
poor delivery of public services. In order to build a fiscal
contract (and the concomitant tax morale), the top
political leadership must lead the efforts, involving the
main political constituencies, as well as tax payer
representatives. Evidence from South Korea, South
Africa and, more recently, Rwanda, has shown that
explicit and strong support from top political leaders
has helped to enhance a tax-paying culture. For
example, the Rwanda Revenue Authority (RRA) has
been fortunate to have the personal backing of the
President, who plays a major role in the campaign to
change public attitude towards paying taxes1. His
personal involvement was crucial for generating tax
revenues for financing poverty reduction expenditure
and fighting corruption. In fact, there needs to be zero
tolerance for corruption, which will convey an impor-
tant signal to reassure taxpayers that taxes are being
collected and spent in a frugal, fair and accountable
manner. It is also critical that government is transpa-
rent in using taxpayer resources for goods and
services that are considered to be a priority by the
taxpaying citizens. To a degree, this is practiced
within the framework of the public expenditure review
process, particularly in Tanzania and Uganda, which
provides a useful platform amongst different
stakeholders (government, private sector, research
institutions and civil society) to discuss the use of
public resources. Finally, the use of resources needs
to be communicated to the public through effective
platforms, such as education campaigns, promotio-
nal materials and media.
Ensuring full managerial autonomy of revenue authorities
A major reason for the success of revenue authorities in
South Africa and South Korea2 was due to the political
support and protection they were given by top political
leadership. Fortunately, all EAC countries have establi-
shed ARAs to enhance domestic revenue mobilisation
by giving them a free hand to exercise their mandates, as
specified in legislation, and operate without political
interference. The legislation for ARAs in EAC countries
provides for their autonomy to manage budgets on an
1 The ‘National Taxpayers Day’ is one of the two most important national events that the President of Rwanda personally attends.2 In South Korea, the president was personally committed to the success of the tax administration, approving targets himself and closely monitoring
performance.
A robust enabling environment
Domestic Resource Mobilisation for Poverty Reduction in East Africa: Lessons for Tax Policy and Administration
7
annual basis, reorganise operations, recruit and develop
personnel, and set staff compensation levels. In
practice, however, this is not the case and the functio-
ning of some ARAs has been disrupted by political
interference and/or wavering political commitment/sup-
port (see Section on ‘Tax Administration’ for details).
National economic and
institutional infrastructure
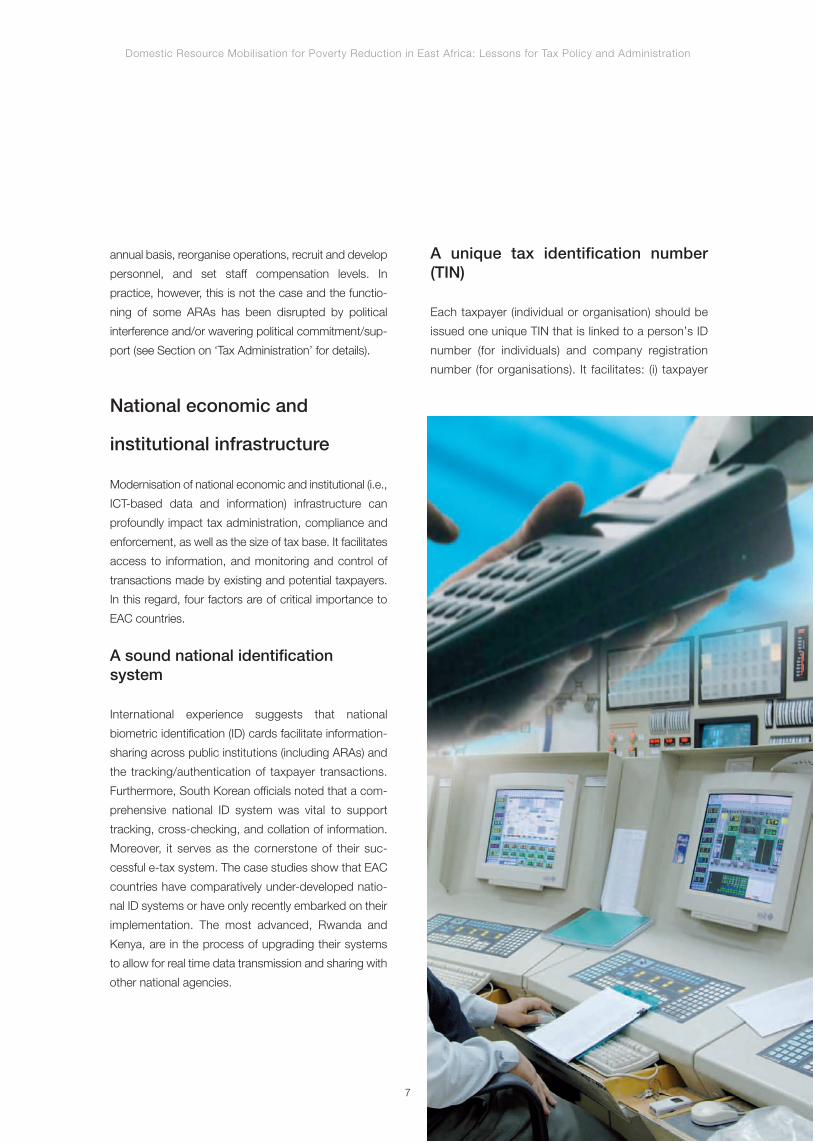
Modernisation of national economic and institutional (i.e.,
ICT-based data and information) infrastructure can
profoundly impact tax administration, compliance and
enforcement, as well as the size of tax base. It facilitates
access to information, and monitoring and control of
transactions made by existing and potential taxpayers.
In this regard, four factors are of critical importance to
EAC countries.
A sound national identificationsystem
International experience suggests that national
biometric identification (ID) cards facilitate information-
sharing across public institutions (including ARAs) and
the tracking/authentication of taxpayer transactions.
Furthermore, South Korean officials noted that a com-
prehensive national ID system was vital to support
tracking, cross-checking, and collation of information.
Moreover, it serves as the cornerstone of their suc-
cessful e-tax system. The case studies show that EAC
countries have comparatively under-developed natio-
nal ID systems or have only recently embarked on their
implementation. The most advanced, Rwanda and
Kenya, are in the process of upgrading their systems
to allow for real time data transmission and sharing with
other national agencies.
A unique tax identification number(TIN)
Each taxpayer (individual or organisation) should be
issued one unique TIN that is linked to a person’s ID
number (for individuals) and company registration
number (for organisations). It facilitates: (i) taxpayer

Domestic Resource Mobilisation for Poverty Reduction in East Africa: Lessons for Tax Policy and Administration
8
registration (the first point of contact in the compliance
management chain); and (ii) more effective manage-
ment of taxpayer information across all tax and duty
types. Most ARAs in the EAC issue TINs to taxpayers
although, in the absence of national biometric ID
cards, these are not unique and usually a separate
identifier is also issued to VAT payers. This compli-
cates compliance management and increases the risk
of tax evasion. EAC partner states need to ensure that
TINs are unique, which may necessitate cleaning up of
taxpayer registers and creation of thorough taxpayer
data bases.
An expanded banked population
Increasing the banked population – and expanding
access to financial services in general – should be a
major priority of government policy and reforms (e.g.,
reducing costs of banking). Significant proportions of
the population in EAC countries are, however, without
access to financial services3 . To the extent that the
majority of the unbanked population will likely fall into
the hard-to-tax informal sector, enhancing access to
financial services will play a key role in expanding the
tax base. At the same time, tax enforcement and
compliance will also be easier, especially since formal
transactions (e.g., credit card, bank transfers) provide
an audit trail. Moreover, having a bank account eases
the burden of paying taxes and facilitates refunds.
Innovations in the EAC, such as mobile and agent
banking, provide affordable options for increasing
access to financial services and should be judiciously
promoted. South Korea has capitalised on mobile
telephony to implement a cash receipts systems (see
Korean case) that allows national tax authorities to
track taxable cash transactions.
There is, however, an important trade-off that needs to
be managed here: people may be discouraged from
using financial services (e.g., saving), if they perceive
it will bring them under the tax net. If this perception
holds in a particular country, then a more astute
approach would be for tax authorities to use bank
accounts only for easing the means to pay taxes (i.e.,
compliance) and provide refunds, and not for tracking
taxable transactions.
Use of third party information
Underdeveloped registries and the absence of enabling
legislation in almost all the EAC partner states, with the
exception of Kenya, have impeded utilisation of third
party information by ARAs. In general, good quality
national databases, including company, property and
vehicle registries, as well as enabling legislation, would
allow ARAs to use third party information for improving
tax compliance and enforcement. For its part, Kenya
uses information from the government’s business and
land registries to validate tax returns and to inform tax
investigations. Third party information is also used by
ARAs in other countries to pre-populate tax returns and,
as a result, reduce taxpayer burden. In South Africa, for
instance, from 2007/08 taxpayers began to receive
pre-populated and restructured personal income tax
forms, resulting in the reduction of errors and increased
client satisfaction.
3 Studies (see cases) have shown that about 90%, 33%, 52%, 52% and 62% of the population in Burundi, Kenya, Rwanda, Tanzania and Uganda ha-ving no access to financial services respectively.
Domestic Resource Mobilisation for Poverty Reduction in East Africa: Lessons for Tax Policy and Administration
9
Tax policy and legislation
Box 1.1: Aligning tax policy with the development strategy – South Korea in the 1960s and 70s
During its take off period, South Korea proactively and strategically utilised its tax policy regime to support rapid economic growthand industrialisation. Tax reforms, as well as other policy tools, were integrated into the five-year Economic Development Plans (EDPs)and designed to achieve its goals. In the 60s, the first five-year EDP focused on export manufacturing. As a consequence, severaltax laws were amended to introduce supporting tax incentives, including drastic reductions in the taxation of capital, tariffs on inputs,and income from “key and strategic industries”, including export industries. A 50% exemption on income tax was granted to allforeign exchange-earning businesses. Machinery and equipment directly employed in foreign exchange-earning activities wereallowed depreciation rates of up to 30% higher than the standard rates. Tax on interest income was close to zero to encouragesavings. In addition, corporate taxes were lower for open listed companies than for closely-held companies aimed at increasinginvestment opportunities through capital markets. These incentives contributed to the national strategy by increasing the financialattractiveness of investments in priority sectors and limiting those in non-priority sectors. When a policy shift to liberalisation wasimplemented in 1980, the focus of tax policy shifted to eliminating exemptions to achieve market-based resource allocation.
Development policy objectives
and tax policy regime nexus
The choice of tax policies can significantly impact the
direction and tempo of national economic development
and as such, a tax policy regime should be guided by a
country’s long-term development strategy. During the
last 30 years, EAC partner states have indeed, made
several attempts to align tax policies with national deve-
lopment strategies. For instance, the major tax policies
implemented in the EAC during the 1980s and 1990s
were largely informed by Structural Adjustment
Programmes (SAPs), which were in vogue at the time.
Since the SAPs advocated for economic liberalisation,
the resultant tax policy changes mostly emphasised on
reducing tax rates to promote savings and investment. It
was done to bolster economic growth and broaden tax
bases through introduction of VAT, improvement of tax
administration, and reduction of fiscal deficits. However,
since the EAC countries were more agriculture oriented,
liberalisation did not lead to the envisaged structural and
economic transformation. In addition, the absence of
clear linkages between tax exemptions and national
development priorities only resulted in producing long
lists of economically unjustifiable tax incentives.
South Korea’s development model, during its take off
period in the 1960s and 1970s, provides a contrast to
the SAP model adopted in the EAC (see Box 1.1).
It is, however, important to note that Korea had put in
place rigorous institutional arrangements to guide tax
incentives and exemption awards. International best
practice (for instance, in Canada and South Africa) also
requires a full cost-benefit analysis for any major piece
of legislation—including tax legislation aimed at attrac-
ting foreign investors—to assess the associated
financial and economic costs, benefits and impact on
various stakeholders, and in particular, on a country’s
long-term tax revenues.
Designing and implementing
effective tax policy
Tax policies in the EAC have been developed over the
years on a piecemeal basis, either in response to emer-
ging economic activities or to combat tax evasion and
avoidance. Some of the current tax laws date back to
colonial times. Tax policy formulation has generally not
benefited from rigorous research or consultations with
stakeholders. This complicates tax compliance and
leads to policy uncertainty. For instance, the average
number of hours per year to comply with major types of

Domestic Resource Mobilisation for Poverty Reduction in East Africa: Lessons for Tax Policy and Administration
10
4 The OECD average from the 2010 World Bank paying taxes survey was about 194 hours.5 However, Section 5(1) of the Act includes worldwide employment income for Kenya tax residents.
Box 1.2: Harmonising, updating and fully implementing current legislative provisions
First, income tax legislation in Burundi and Kenya was enacted more than three decades ago. Burundi hasembarked on the promulgation of a new income tax code while Kenya’s Income Tax Act, which was first enacted in1973, has undergone substantial amendments over the years. Modelling Kenya’s income tax legislation after those inforce in Tanzania and Uganda has the potential to improve simplicity, close tax loopholes, and enhance taxharmonisation. For instance, Section 3(1) of Kenya’s current Income Tax Act limits tax liability to income derived fromKenya (source) as opposed to taxing on a worldwide basis.5 Harmonisation of tax legislation will, as in the case of theEast Africa Income Tax (Management) Act of 1958, improve clarity and simplicity of the tax regime and thus enhanceinvestment opportunities in the region. The achievements under the EAC Customs Management Act of 2004 shouldbe complemented through removal or reduction of the intra-EAC withholding taxes. This can be done by adopting astandardised approach to addressing transfer mis-pricing, aligning the taxation of VATable international services, andpromulgation of an EAC excise duty policy to curb tax evasion and inefficient allocation of resources.
Second, the tax legislative regimes in EAC partner states, with the exception of Rwanda, requiresimplification. In 2005, Rwanda harmonised its income tax, withholding tax, VAT and property tax procedures into asingle legislative code. The process covered such aspects as: registration requirements; book keeping and taxdeclarations; assessment; audit and investigations; dispute resolution; recovery; and interest and fines. These reformshave contributed to a reduction in the number of hours per year required to comply with major tax legislation in Rwandafrom 168 hours in 2005 to 148 hours in 2010.
Third, EAC partner states are not effectively enforcing some of the existing tax laws, for example, on capital gains.Kenya is also the only country in the EAC that does not levy capital gains tax (CGT) following its suspension in 1984.International best practice, as observed in South Africa, suggests, in addition to providing additional revenues, CGTenhances efficiency of the income tax system by discouraging taxpayers from categorising ordinary income intotax-free capital gains. CGT also promotes equity by ensuring taxpayers with the same levels of income bearcomparable tax burdens irrespective of their sources of income.
tax in the EAC is 210 hours and ranges from 140 hours
in Burundi to 417 hours in Kenya4 . The two examples
below point to areas where improvements in tax policy
design can lead to marked gains in terms of tax policy
objectives.
The choice of an appropriate tax mix, in particular,
necessitates a thorough examination of country-speci-
fic circumstances including the neutrality, simplicity, and
progressivity implications of a given tax structure.
Country experiences present diverse tax mix choices.
For instance, the experience from the Andean commu-
nity (Bolivia, Colombia, Ecuador, Peru, Chile, and
Venezuela) seems to favour indirect taxes. The VAT
design and implementation within this community is
seen to have achieved the tenets of neutrality, simplicity,
and progressivity of the tax system.
Evidence from the case studies indicates that excise
taxation is another area where reform, particularly in
terms of tax simplification, can achieve robust results.
The EAC’s progressive tariff rates on imported
vehicles, for example, are usually subject to misrepre-
sentation, under-declaration and corruption. Likewise,
tax treatment of domestic and imported alcohol and
tobacco products in the EAC sub-region has often led
to the creation of domestic monopolies and rent
seeking behaviour, which undermines efficient
production. Lastly, taxation of gasoline, fuels and
lubricants raises several concerns, including the
differentiation between end users, public transporters
and manufacturers.
Thus, the most appropriate balance between direct
and indirect taxes for the EAC partner states, as well as
Domestic Resource Mobilisation for Poverty Reduction in East Africa: Lessons for Tax Policy and Administration
11
6 The Local Authorities Service Charge was abolished in Kenya in 1999; the Regional Service Council (RSC) Levy was repealed in South Africa in 2006;the Development Levy abolished in Tanzania in 2003; while the Graduated Tax was repealed in Uganda in 2005.
other tax policy choices, should be informed by
rigorous country-specific assessments of the implica-
tions for tax policy and national development
objectives. It should also take into account the overar-
ching regional commitments – for instance, the
convergence criteria of the EAC Monetary Union. This
study is a first step in supporting EAC partner states to
improve tax revenue mobilisation through sharing of
both regional and international experience.
Harmonising, updating and fully
implementing the current
legislative provisions
Pending comprehensive reviews and evidence-
based changes to tax policies as recommended
earlier, three priority areas concerning legislative-
oriented measures to enhance tax revenue mobilisa-
tion for EAC countries need to be focused on. They
include: (i) updating outdated key legislation; (ii)
simplifying and harmonising existing tax laws; and (iii)
fully implementing the existing legislation. Box 1.2
sketches the scope and efforts needed to update
current legislation and the imperative to fully
implement this.
Fiscal decentralisation and local
tax revenue mobilisation
Local government tax revenue mobilisation is quite
constrained in the EAC partner states. National govern-
ments have over the past 10 years abolished one or
more major local revenue sources and replaced them
with additional intergovernmental transfers, instead of
more efficient local revenue sources.6 The case studies
identify three major constraints to local government
revenue mobilisation: (i) economic/ fiscal reasons, such
as poorly-defined tax bases, absence of tax handles,
and inadequate local government tax enforcement
mechanisms; (ii) impact of intergovernmental fiscal trans-
fers: for instance, “matching grants” can encourage local
revenue collections, while a discretionary transfer
system negatively affects local tax collection efforts; and
(iii) political economy considerations: for instance, limited
accountability of national and local politicians usually
discourages local tax effort, especially in the absence of
explicit linkages between local taxation and public
service provision. In addition to overcoming these
constraints, the case studies recommend local property
taxes and broad-based local taxes on income and busi-
ness activity as options for enhancing local revenue
mobilisation.
Domestic Resource Mobilisation for Poverty Reduction in East Africa: Lessons for Tax Policy and Administration
12
Tax administration
Box 1.3: The BMS in Tanzania
Tanzania Revenue Authority’s (TRA) Block Management System (BMS) focuses on physical identification and mapping
of taxpayers. The BMS is designed to perform all compliance and monitoring activities for the identified taxpayers
located within a specific manageable area or block. Following a mapping exercise undertaken in Dar es Salaam in
2007/08, TRA was able to register an additional 13,300 new taxpayers. The pilot BMS initiative in Dar es Salaam was
successful in capturing new taxpayers and evaders, and has subsequently been rolled out across the entire country.
Full managerial autonomy
of revenue authorities
and accountability for results
The case studies suggest that political commitment is
critical for establishing and sustaining a professional and
effective revenue administration. The impact on tax
administration efficacy of the strong political and union
support given to the South African Revenue Service
(SARS) and South Korea’s Presidential support to the
National Tax Service are cases in point. All EAC
partner states have established ARAs aimed at enhan-
cing revenue mobilisation efforts by allowing them full
authority to operate without political interference. Some
ARAs receive extensive political support to achieve their
objectives (e.g., Rwanda and Tanzania), whereas opera-
tions of others have been disrupted by political interfe-
rence or wavering support. For instance, due to budget
ceilings imposed by the Ministry of Finance, the Uganda
Revenue Authority (URA) has faced severe staff turnover
in critical skills, such as audit and ICT. In Kenya, the
Treasury has been reported to withhold tax refunds and
resources to implement salary increments. In Rwanda,
on the other hand, the RRA has enjoyed political backing
to unequivocally pursue its mandate of collecting
revenues for national development.
Needless to say, political support and autonomy
should be matched by accountability for results.
Politicians and policymakers should expand the
performance targets for ARAs beyond the annual
revenue targets. They should include measures to
expand the tax base, such as levels of tax compliance,
quality of taxpayer services, and operational efficiency.
Such measures should also include a monitoring
framework to be used in setting service delivery
standards and annual performance assessments, as
is the case for SARS. EAC partner states have made
attempts to assess tax administration performance
with a view to informing reform priorities. For instance,
majority of ARAs in the EAC use medium-term strate-
gic plans to guide their reform paths and have, to
varying degrees, developed balanced scorecard
metrics and performance targets for monitoring and
evaluation purposes. However, the utility of such
measures is yet to be rigorously quantified, since most
ARAs do not collect or analyse data that would permit
specific conclusions to be drawn.
Strengthening compliance
management and enforcement
The case studies reveal that while ARAs have adopted
several tax enforcement measures, none of them has
a comprehensive framework for compliance manage-
ment. A comprehensive compliance management
regime has two prongs. First, using taxpayer risk-pro-
filing to inform deployment of tax enforcement
resources and second, engaging taxpayers on

Domestic Resource Mobilisation for Poverty Reduction in East Africa: Lessons for Tax Policy and Administration
13
initiatives to increase tax compliance. For instance,
Korea’s National Tax Service strengthened its research
capacity to underpin taxpayer risk-profiling and audits.
Reduction of tax compliance costs, for instance,
through e-Filing, tax simplification, and tax education
are among the measures used in Korea to enhance
taxpayer engagement. The rationale of an integrated
compliance management approach is to develop
specific and more appropriate mitigating strategies,
which address the underlying tax system risks and
causes of tax loopholes in a rational way. Such an
approach consequently focuses on high-risk areas,
with minimal or phased intervention in low-risk areas.
Compliance management can be enhanced by: (i) iden-
tifying, assessing and prioritising compliance risks, and
analysing their impact (e.g., through modelling, taxpayer
segmentation, use of indicators); (ii) assessing any
loopholes in legislation as well as developments in
external environment; (iii) strengthening internal capabili-
ties (e.g., using ICT to facilitate compliance); (iv) designing
tax compliance programmes that minimise the cost of
collection ratio; and (v) using both quantitative (such as
revenue targets or compliance levels) and qualitative (for
instance, taxpayer perceptions on service quality or
complexity of tax procedures) measures to evaluate
performance. In addition, publicising the outcome of tax
enforcement measures in the media, a practice that is
often neglected by EAC partner states, has the potential
to promote greater voluntary compliance.
Operational capacity
Implementing successful reforms in tax administration
will necessitate marked improvements in the way of
working, in particular, making more efficient use of
available financial, human, and other supportive
resources, such as ICT. For instance, innovations in ICT
should be utilised to support specialisation in the ARA
by freeing up resources to target high revenue, high risk,
and emerging taxpayer niches. Priority areas for
enhancing operational capacity are discussed below.
Enhanced and efficient utilisation ofavailable organisational capacities
In terms of human capacity, EAC ARA staff-to-
population ratios range from 0.05 for Tanzania to 0.12
for Kenya and are below the corresponding average for
sub-Saharan Africa (0.37). Whereas plans to increase
the ARA human resource capacities are at various
stages of implementation, policymakers need to priori-
tise resource utilisation through risk profiling. Identifying
sectors with the highest risks to revenue collection will
allow ARAs to fill the most critical skills gaps, particularly
in the areas of tax investigations, internal audit and
compliance, operations research, planning, and data
management. ARAs have designed several innovations
to improve operational capacity and efficiency, including
tax payer segmentation in Rwanda and Uganda, and
the Block Management System (BMS) in Tanzania and
Rwanda (see Box 1.3).
Collaboration, especially in sharing of information
between ARA departments and other government
agencies (such as land and company registries and
financial institutions), is minimal or non-existent in the
EAC. For instance, only Kenya uses third party
information, primarily from the property and business
registries, to support its compliance management
interventions. On the other hand, utilisation of this
resource by other EAC members is hampered by the
absence of supporting legislation.
While all ARAs maintain basic taxpayer identification
information, only Kenya and Rwanda have national
identifiers, which are also linked to other public and
private information infrastructure. ARAs also make
limited use of withholding regimes and self-assess-
ment to facilitate tax collection. For example, with the
exception of Kenya, self-assessment is restricted to

Domestic Resource Mobilisation for Poverty Reduction in East Africa: Lessons for Tax Policy and Administration
14
VAT and income tax filing by corporations. In Kenya,
individual taxpayers are required by law to file annual
income tax returns.
Effective utilisation of ICT
Effective ICT applications can enhance performance,
for instance, by reducing processing times and costs;
improving client service and promoting voluntary
compliance; minimising rent-seeking opportunities by
decreasing the level of interaction between taxpayers
and ARA staff; and enhancing evidence-based
decision making by aiding data consolidation and
analysis. To maximise these benefits, EAC countries
have made substantial investments in ICT systems
with an initial focus on internal operation and support
systems, including sharing of customs information
between the EAC partner states and eFiling of tax
returns. However, absence of supporting legislation,
in particular Electronic Transactions legislation, in
some EAC countries has constrained the full imple-
mentation of eFiling.
To maximise returns from ICT investments, ARAs
should ensure that the next generation of ICT reforms
focus on: (i) integrating core tax systems to engender
a single-view of taxpayer; (ii) integrating ARA ICT
systems with third party source data systems, such as
land and company registries; (iii) optimising ICT system
usage by providing incentives to taxpayers to file taxes
in off-peak periods; and (iv) optimising utilisation of data
generated by ICT systems for evidence-based decision
making.
Operational research capacity
Mitigating the tax policy analysis constraints discus-
sed in §3.2 requires developing tax policy and
operational research capacity. Such capacity would
regularly and reliably provide useful indicators of the
efficiency and effectiveness of interventions in such
performance aspects as: taxpayer feedback on ARA
staff attitudes and services (e.g., the ease of use of
ICT systems for eFiling), and voluntary compliance.
Also, operational research would seek to understand
emerging trends in particular sectors and industry
groups, so as to inform the design of more appro-
priate interventions for improving compliance
management and enforcement.
Tanzania Revenue Authority’s comprehensive and
in-depth studies of the construction, petroleum, whole-
sale and retail sectors have apparently yielded important
information on tax potential of these sectors and thus
informed tax enforcement initiatives. EAC partner states
may consider a phased approach to building the requi-
site in-house research competencies, in particular,
out-sourcing research functions to think-tanks and,
thereafter, building a cadre of competent in-house
researchers in the medium-to-long term.

Domestic Resource Mobilisation for Poverty Reduction in East Africa: Lessons for Tax Policy and Administration
15
Key reforms to enhance tax revenue mobilisation
in EAC countries
This section summarises the role of key reforms in
enhancing tax revenue mobilisation in EAC countries by
answering the following two questions:
• How do EAC countries fare in terms of the
reform areas discussed under the three broad
themes of enabling environment, tax policy and
legislation, and tax administration? and
• What reforms should EAC countries prioritise in
order to enhance tax revenue mobilisation?
Annex 1.A depicts an assessment of the five EAC
countries and South Africa within each of the reform
areas. Although Burundi has only recently launched its
revenue authority (Office Burundais Des Recettes) and
is just embarking on transforming its tax system, it is
included to create a baseline going forward. South
Africa is included as a comparator outside the EAC
region. The scoring is a subjective process based on
the best judgment of the authors. It is intended to
uncover strong and weak performers, as well as
similar strengths or deficiencies. A summary of the
results from Annex 1.A is presented in Figure 1.1.
South Africa is in a far superior position, compared to
any of the EAC countries. It has made great strides in
its enabling political environment, has a fairly robust tax
policy and legislative framework, and boasts of a very
efficient and well-supported revenue administration
(SARS). Burundi is obviously in the weakest position,
which is not surprising given that it is only now embar-
king on transforming its tax system. The performance of
the other four EAC countries continues to be weak,
which indicates that they still require major strategic
initiatives and considerable implementation efforts
across the board. There are a few points worth noting
– some good examples, which other countries might
try to emulate, and some specific areas of acute
weakness:
0.0
0.5
5.0
Enablingenvironment
Tax administrationTax policy andlegislation
4.5
4.0
3.5
3.0
2.5
2.0
1.5
1.0
Burundi Kenya Rwanda South AfricaUgandaTanzania
Source: Authors
Figure 1.1: Assessment of EAC countries and South Africa across reform areas (1=very weak to 5=very strong)
Domestic Resource Mobilisation for Poverty Reduction in East Africa: Lessons for Tax Policy and Administration
16
• In general, the enabling environment for domestic
revenue mobilisation is weak across the region.
Kenya shows a reasonable score for ‘economic and
institutional infrastructure’, due to its well-establi-
shed ID system and KRA’s use of property and
business registration systems. However, both
Tanzania and Uganda display significant weak-
nesses. Neither seems to have a fiscal contract, nor
any sort of tax morale. This poses questions
regarding the Government’s delivery of public
services and the perceived use of public resources.
There is also a perception of political meddling in
the Uganda Revenue Authority (URA). Both
countries also fare poorly in the enabling economic
and institutional infrastructure, due to lack of a
national ID system, no unique TIN, large unbanked
population and limited use of third party information
by the revenue authorities.
• The state of tax policy and legislation measures
more closely across the region. All countries
perform poorly when it comes to whether tax
policies are at the core of development strategy.
The important issue here is that there is no clear
policy/process in any of the countries about how
tax incentives and exemptions are awarded,
measured and the related costs/benefits for the
economy. In addition, there are generally weak
scores across the board for policy making, where
changes seem to have been made on a piecemeal
basis. This further reinforces the lack of alignment
between a country’s development strategy and tax
policies. Furthermore, although some countries
have supporting legislation, local revenue mobilisa-
tion is still constrained across the region.
• There is some difference across the region in tax
administration. Rwanda and Tanzania fare reasona-
bly well in terms of the ‘performance measures’ that
are used to gauge the performance of their revenue
authorities (RAs). In addition, they both seem to
provide some managerial autonomy to their RAs,
which is a lesson that Kenya and Uganda could
emulate. Kenya does, however, have a lower tax
gap, whereas the other countries need to signifi-
cantly strengthen their compliance management
and enforcement to reduce their tax gaps. This
would also be supported by reducing tax incentives
and effective enforcement of the legislation that is
already in place. Kenya also shows progress in
enhancing its operational capacity through use of
e-Filing and ETRs. Tanzania, on the other hand, has
been proactive in improving operational research
capacities to support monitoring and enforcement
of tax administration.
Having answered the first question by showing that
EAC countries are generally performing poorly in the
three reform areas, the remainder of this section
examines what these countries should prioritise in order
to enhance tax revenue mobilisation and broaden their
tax bases.
Two dimensions are considered: what can be done
now (i.e., short-term priorities) and what will likely take
longer to achieve. The short-term priorities are
defined as those actions which are within the ambit of
the Ministry of Finance or Revenue Authority to imple-
ment. The longer-term priorities are, however, those
that lie within the purview of a broader and/or more
political level. Four short-term and three longer-term
priority recommendations for enhancing domestic
revenue mobilisation in EAC countries are discussed
below:
1. There needs to be an immediate review, in all
countries, of the tax exemptions and incentives
regime with a view to eliminating the unproductive
ones. While such exemptions a nd incentives could
help promote investment, they tend to dampen tax
effort, complicate tax administration, facilitate
evasion and encourage corruption;
Domestic Resource Mobilisation for Poverty Reduction in East Africa: Lessons for Tax Policy and Administration
17
2. Each taxpayer (individual or organisation) should
be issued with one unique TIN that, if possible, is
linked to a person’s ID number (for individuals) and
company registration number (for organisations). In
order to ensure that TINs are unique, this will
necessitate cleaning up of taxpayer registers and
creation of thorough taxpayer data bases;
3. RAs need to start making full use of third party
information. Good quality national databases, in
cluding company, property and vehicle registries,
as well as enabling legislation, would allow RAs to
use third party information to improve tax compliance
and enforcement. That information can also be used
to pre-populate tax returns and, as a result, reduce
the taxpayer burden and associated filing errors
and,thereby, enhance both client satisfaction and
administrative effectiveness;
4. Linked closely to the preceding two recommen
dations is the need for tax administrations to streng
then their compliance management and
enforcement. As a initial priority, taxpayers need to
be en gaged in initiatives to increase tax compliance.
For instance, e-Filing, strong client service (e.g., call
centers and walk-incenters), tax simplification, and
tax education are among the measures used by
SARS and in Korea to enhance taxpayer
engagement. Fur thermore, comprehensive taxpayer
risk profiling (i.e., through increased research and
audit capacity) needs to inform the deployment of
limited tax enforcement resources. Such an
approach would focus on high-risk/yield areas, with
minimal or phased in tervention in low-risk/yield
areas. In parallel to the preceding short-term
recommendations, there are three recommendations
that are likely to take longer, and involve more players
and actions across a broader spectrum.
5. Most importantly, a process needs to be set in
motion to align tax policies to achieve broad
national development objectives The choice of tax
policies can significantly impact the direction and
tempo of a nation’s economic development and,
as such, a tax policy regime should be guided by a
country’s long-term development strategy.
Following on from this, EAC governments must
make greater efforts to link tax effort to tangible de
velopment outcomes and, thereby, start creating a
fiscal contract and building tax morale;
6. RAs in EAC countries must be given, in accor
dance with existing legislation, managerial
autonomy to exercise their mandates and operate
on a daily basis without political interference, and
under an agreed set of performance measures that
pro vide clear accountability for results; and
7. Finally, governments must continue to
prioritise the roll-out of financial services to
increase, among others, the size of the banked
population. Expanding access to financial
services will play a key role in enlarging the tax
base. Tax enforcement and compliance will also
be easier, especially since formal transactions
(e.g., credit card, bank transfers) provide an audit
trail, and having a bank account facilitates the
means for paying taxes and refunds. The trade-
off, however, of using financial services as a
perceived means to enforce tax administration
needs to be carefully managed.
From the analysis of the case studies, external litera ture
and international experience, simultaneous implementa-
tion of these seven recommendations is likely to have the
strongest impact for enhancing tax revenue mobilisation
and broadening the tax base in EAC countries.

Domestic Resource Mobilisation for Poverty Reduction in East Africa: Lessons for Tax Policy and Administration
19
Annex 1.1
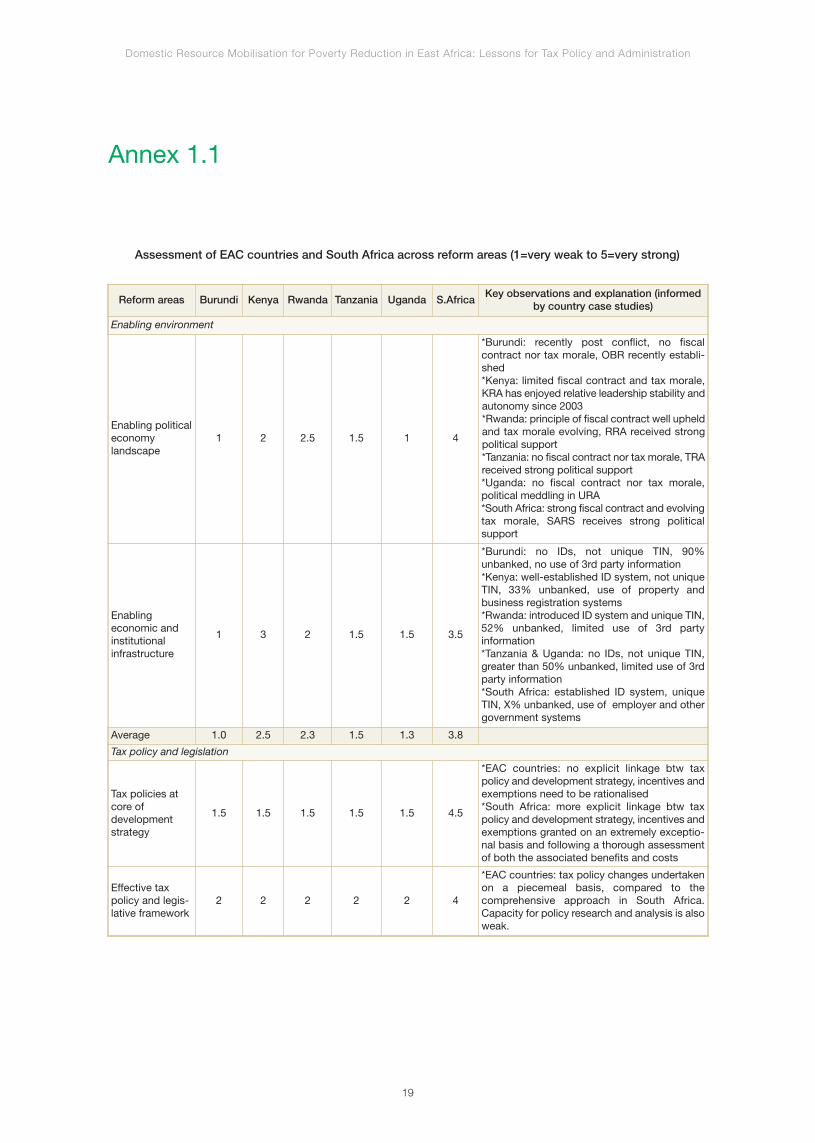
Assessment of EAC countries and South Africa across reform areas (1=very weak to 5=very strong)
Reform areas Burundi Kenya Rwanda Tanzania Uganda S.AfricaKey observations and explanation (informed
by country case studies)
Enabling environment
Enabling politicaleconomylandscape
1 2 2.5 1.5 1 4
*Burundi: recently post conflict, no fiscalcontract nor tax morale, OBR recently establi-shed*Kenya: limited fiscal contract and tax morale,KRA has enjoyed relative leadership stability andautonomy since 2003*Rwanda: principle of fiscal contract well upheldand tax morale evolving, RRA received strongpolitical support*Tanzania: no fiscal contract nor tax morale, TRAreceived strong political support*Uganda: no fiscal contract nor tax morale,political meddling in URA*South Africa: strong fiscal contract and evolvingtax morale, SARS receives strong politicalsupport
Enablingeconomic andinstitutionalinfrastructure
1 3 2 1.5 1.5 3.5
*Burundi: no IDs, not unique TIN, 90%unbanked, no use of 3rd party information*Kenya: well-established ID system, not uniqueTIN, 33% unbanked, use of property andbusiness registration systems*Rwanda: introduced ID system and unique TIN,52% unbanked, limited use of 3rd partyinformation*Tanzania & Uganda: no IDs, not unique TIN,greater than 50% unbanked, limited use of 3rdparty information*South Africa: established ID system, uniqueTIN, X% unbanked, use of employer and othergovernment systems
Average 1.0 2.5 2.3 1.5 1.3 3.8
Tax policy and legislation
Tax policies atcore ofdevelopmentstrategy
1.5 1.5 1.5 1.5 1.5 4.5
*EAC countries: no explicit linkage btw taxpolicy and development strategy, incentives andexemptions need to be rationalised*South Africa: more explicit linkage btw taxpolicy and development strategy, incentives andexemptions granted on an extremely exceptio-nal basis and following a thorough assessmentof both the associated benefits and costs
Effective taxpolicy and legis-lative framework
2 2 2 2 2 4
*EAC countries: tax policy changes undertakenon a piecemeal basis, compared to the comprehensive approach in South Africa. Capacity for policy research and analysis is alsoweak.

Domestic Resource Mobilisation for Poverty Reduction in East Africa: Lessons for Tax Policy and Administration
20
Reform areas Burundi Kenya Rwanda Tanzania Uganda S.AfricaKey observations and explanation (informed
by country case studies)
Harmonising,updating andfully implemen-ting current legislative provi-sions
2.5 2.5 3.5 3 3 4.5
*EAC countries: principal tax laws (i.e. incometax) are outdated in Kenya and Burundi, and notfully implemented elsewhere. No country, otherthan Rwanda, has harmonised tax administra-tion procedures. EAC Customs ManagementAct 2004 is in force, but more needs to be doneto harmonise income taxes, VAT and exciseduty. *South Africa: legislative provisions up-to-dateand fully implemented.
Fiscal decentra-lisation and localtax revenue mobilisation
1 2.5 2.5 2.5 2.5 2.5
*Fiscal decentralisation not underway in Bu-rundi. Supporting legislation in place in Uganda,Tanzania, Rwanda, and South Africa. Newconstitution in Kenya paves the way for fiscaldecentralisation. However, local revenue mobi-lisation is constrained in all study countries.
Average 1.8 2.1 2.4 2.3 2.3 3.9
Tax administration
Managerialautonomy ofARAs and accountabilityfor results
1 2 3 3.5 2 4.5
*Burundi: OBR recently established*Kenya & Uganda: limited performance mea-sures, managerial autonomy curtailed by Minis-try of Finance/Politicians, efforts made totransform KRA/URA organisational culture*Rwanda: limited performance measures, somemanagerial autonomy, efforts made to transformRRA organisational culture*Tanzania: well-tested set of performance mea-sures, some managerial autonomy, efforts madeto transform TRA organisational culture*South Africa: performance measurement sys-tem undergone improvements since 2001/02,managerial autonomy, SARS has taxpayer focu-sed orientation
Strengtheningcompliancemanagementand enforcement
1 3 2 2 2 4
*Burundi: tax evasion is high *Kenya: tax gap is significantly lower than otherEAC countries*Rwanda, Tanzania & Uganda: significant taxgap*South Africa: minimal tax gap
OperationalCapacity
1 3 2 2.5 2 4.5
*Burundi: OBR recently established*Kenya: leads in the roll-out of e-filing and ETRsin EAC*Tanzania: proactive in operational research*All EAC countries: tax officers serve fewer tax-payers than in OECD countries*South Africa: millions of taxpayers use e-filing,undertakes fairly rigorous research & analysis
Average 1.0 2.7 2,3 2.7 2.0 4.3

Domestic Resource Mobilisation for Poverty Reduction in East Africa: Lessons for Tax Policy and Administration
21
Annex 1.2 Bibliography
AfDB (2010a). Domestic Resource Mobilization: Burundi Case Study. AfDB, 2010
AfDB (2010b). Domestic Resource Mobilization: Kenya Case Study. AfDB, 2010
AfDB (2010c). Domestic Resource Mobilization: Rwanda Case Study. AfDB, 2010
AfDB (2010d). Domestic Resource Mobilization: South Africa Case Study. AfDB, 2010
AfDB (2010e). Domestic Resource Mobilization: Tanzania Case Study. AfDB, 2010
AfDB (2010f). Domestic Resource Mobilization: Uganda Case Study. AfDB, 2010
AfDB (2010). Korea’s Tax Policies in the Take Off Period: An African Perspective. AfDB, 2010.
Bahl, R.W. and Bird, R.M. (2008). Tax Policy in Developing Countries: Looking Back and Forward. Rotman Institute
for International Business, May 2008. IIB Paper No. 13.
Bird, R.M. (2004). Managing Tax Reform. Bulletin for International Fiscal Documentation 58(2): 42-55.
Bird, R.M. (2008). Tax Challenges Facing Developing Countries. Rotman Institute for International Business, March
2008. IIB Paper No. 9.
Bird, R.M. and Zolt, E.M. (2003). Introduction to Tax Policy Design and Development. Presented at a World Bank
course on Practical Issues of Tax Policy in Development Washington, 28 April to 1 May 2003.
Bird, R.M. and Zolt, E.M. (2008). Technology and Taxation in Developing Countries: from Hand to Mouse. Paper
presented at Colombia Law School Tax Policy Colloquium New York, USA, 25/09/08.
Boex, J. and Martinez-Vazquez, J. (2006). Local Government Finance Reform in Developing Countries: The Case of
Tanzania. Palgrave Macmillan: New York.
Brautigam, D.A. (2008). Introduction: Taxation and State Building in Developing Countries. In D.A Brautigam, O-H.
Fjeldstad and M. Moore (eds) Taxation and State Building in Developing Countries Cambridge University
Press: Cambridge, pp. 1-33.
Comninos, A., Esselaar, S., Ndiwalana, A., Stork, C. (2008). M-banking the Unbanked. Research ICT Africa. Policy
Paper 4.
Crandall, W. (2010). Revenue Administration: Autonomy in Tax Administration and the Revenue authority Model. IMF,
June 2010.
Edling, H., and Nguyen-Thanh, D. (2006). Taxes and Culture – Tax Reforms for Sustainable Development. GTZ:
Public Finance and Administrative Reform Studies, 2006, Fiscal Studies No. 5.
Fjeldstad, O. and Moore, M. (2008). Revenue Authorities and State Capacity in Anglophone Africa. Chr. Michelsen
Institute, 2008. WP 2008:1.
Fjeldstad, O-H. and Rakner, L. (2003). Taxation and Tax Reforms in Developing Countries: Illustrations from
sub-Saharan Africa. CMI, 2003. R2003:6.
Fuest, C. and Riedel, N. (2009). Tax Evasion, Tax Avoidance and Tax Expenditures in Developing countries: A Review
of the Literature. DFID, 19 June 2010.
HM Treasury (2010). Tax Policy Making: a new approach. HM Treasury, June 2010.
IMF (2010a). Burundi: Third Review Under the Three-Year Arrangement Under the Extended Credit Facility—Staff
Report and Press Release. IMF, 2010. Report no 10/75.
Kendall, J., Mylenko, N., Ponce, A. (2010). Measuring Financial Access around the World. World Bank, 2010. WPS5253.
Kidd, M. and Crandall, W. (2006). Revenue Authorities: Issues and Problems in Evaluating their Success. IMF, 2006.
Working Paper WP06/240.

Domestic Resource Mobilisation for Poverty Reduction in East Africa: Lessons for Tax Policy and Administration
22
Klemm, A. (2009). Causes, Benefits, and Risks of Business Tax Exemptions. IMF, 2009. WP/09/21.
Lyon, D. (2007). National ID Cards: Crime-Control, Citizenship and Social Sorting. Policing 1(1): 111-118.
Manasan, R.G. (2003). Tax Administration Reform: Semi-Autonomous Revenue Authority, Anyone? Philippine
Journal of Development XXX (2): 173-193.
Murphy, K. (2002). ‘Trust Me, I’m the Taxman’: The Role of Trust in Nurturing Compliance. Centre for Tax System
Integrity. December 2002. Working Paper No. 43.
O’Grady, M. (2003). Acceptable Limits of Tax Planning: A Revenue Perspective. Presented at KPMG Tax Conference
Naas, 07 November 2003.
OECD (2008). Monitoring Taxpayers’ Compliance: A Practical Guide Based on Revenue Body Experience. Forum on
Tax Administration, 2008.
PwC (2007). Shifting the balance: The Evolution of Indirect Taxes. Available at:
http://www.pwc.com/za/en/publications/shifting-the-balance.jhtml.
PwC (2009). A Review of the Taxation Challenges in the East African Community, especially in view of the planned
Common Market. Presented by David Tarimo at Regional Public – Private Dialogue on EAC Tax
Harmonisation Arusha, 28-29 May 2009.
SARS (2008). A Report on a Benchmark Study Conducted in Sweden Tax Office, Stockholm. South African Revenue
Service, May 2008.
Sennoga, E., Matovu, J.M., Twimukye, E. (2009). Tax Evasion and Widening the Tax Base in Uganda. EPRC, 2009.
Research Series No.63.
Tanzi, V. and Zee, H. (2001). Tax Policy for Developing Countries. Economic Issues 27.
The World Bank Group/FIAS & DFID (2009). Taxation as State-Building: Reforming Tax Systems for Political
Stability and Sustainable Economic Growth - A Practitioner’s Guide. The World Bank Group/FIAS & DFID.
Timmons, J.F. (2005). The Fiscal Contract: States, Taxes and Public Services. World Politics 15(4): 530-67.
Torgler, B. (2003). Tax Morale in Latin America. Presented at Third International Research Conference Responsive
Regulation: International Perspectives on Taxation, 2003.
Torgler, B. and Schaltegger, C.A. (2006). Tax Morale: A Survey with a Special Focus on Switzerland. Schweizerische
Zeitschrift für Volkswirtschaft und Statistik 142(3): 395-425.
World Bank (2009). Reforming Tax Systems for Political Stability and Sustainable Economic Growth: A Practitioner’s
Guide. The World Bank Group in collaboration with DFID, 2009.
World Bank (2010); Doing Business in the East African Community 2010 World Bank Group: Washington.
Part II
International Experienceand Lessons

Chapter 2
South Africa

Domestic Resource Mobilisation for Poverty Reduction in East Africa: Lessons for Tax Policy and Administration
25
Summary of Key Findings
Political economy and fiscal
legacies
A review of political economy legacies underscores the
fact that politics has pervasively impacted fiscal gover-
nance options in South Africa. Indeed, the highly
lopsided fiscal policies of the apartheid era mostly
favoured the minority Whites vis a vis the majority Blacks.
Interestingly enough, the post-apartheid leaders, instead
of jettisoning all the fiscal and macroeconomic legacies
of the apartheid era, actually embraced some of them
as the rationale for righting the historical wrongs, by using
taxation as a distributional policy instrument. In addition,
the new leaders were apprehensive that their well-known
pre-1994 socialistic orientation might deter international
capital from South Africa. As a result, they quickly
adopted more moderate, pro-investment tax policies
aimed at sending a positive signal to foreign investors.
To further demonstrate their commitment, the new
Government put strong emphasis on administrative
measures by empowering the newly-created South
African Revenue Service (SARS). These measures
yielded certain immediate results in the form of declining
personal income tax rates and, in some cases, elimina-
tion of trade tariffs. All this underscored the imperative to
make South Africa globally competitive as an attractive
investment destination. Although the country has a
strong natural resource base, the bulk of its economy
remains in the manufacturing and services sectors,
which are open to external competition.
Given the constraints under which the post-apartheid
governments have exercised fiscal governance, the
administrative capacity and performance of SARS
remain the key determinant of both fiscal space and
effort. Therefore, political leaders have had to rely on
SARS to augment domestic resources and enable the
expansion of fiscal space despite a decline in tax rates.
As Smith (2003) observes, in post-apartheid South
Africa, the involvement of politicians has positively
impacted on SARS’s effectiveness. She also contends:
“SARS’s experience shows that where the political and
revenue-raising authorities have a common interest in
enhanced collection, their collaboration is an important
source of effectiveness”.
In our view, three main factors will play out in the fiscal
governance of South Africa in the short-to-medium term.
First, sustained pressure from political leaders and trade
union representatives (of low wage workers) on the
government to move rapidly and expand its public
expenditure programmes for employment creation and
poverty reduction. Second, the negative effects of the
global financial crisis in terms of reduced trade volumes,
commodity prices and business profits, and their impact
on domestic revenue. Third, is – what the Economist
(2010) has described as a large and growing problem –
corruption. According to this publication, although in
2009 South Africa fared well in the Transparency
International Corruption Perception Index ranking (55th
out of 180 countries), corruption in the country is on the
rise. The ANC has publically expressed concern about
the scourge.
Tax reforms: Sequencing,
implementation and results
The end of apartheid heralded reforms in the tax
system. Between 1994 and 1999, the Katz Commis-
sion set the stage for reforming policy and institutional
aspects of the tax system. Most of the Commission’s
recommendations in these two areas have been
implemented. The next series of reforms had taken
place following the establishment of SARS. Specifically,
between 1997 and 2000, SARS made changes to
some of its operational processes, which contributed
to the organisation surpassing revenue collection
targets. However, SARS’s management considered
these changes as ‘incremental’ and was of the view
that the organisation was performing significantly
Domestic Resource Mobilisation for Poverty Reduction in East Africa: Lessons for Tax Policy and Administration
26
below its potential. Therefore, the management initia-
ted a diagnostic study of its operations in order to
identify issues and problems and recommend
measures for resolving them. This exercise culminated
in the development of a program, called ‘Siyakha’ (‘we
are building’).
Phase 1 of Siyakha’s implementation commenced in
2001 and ran until 2005/06. It was sequenced by
province. Key initiatives implemented under Siyakha 1
included: development of a taxpayer and business
strategy; process redesign in revenue and customs;
overhauling taxpayer services; implementation of
policies to promote integrity and professionalism
among staff (e.g., by re-advertising all new positions
and through training, standardizing work methods,
creation of work teams, creating a professional mana-
gement cadre); and refurbishment and re-tooling
initiatives to improve the working environment. SARS
reports the following results for Siyakha 1: (i) its
organisation structure is flatter; (ii) processes were
redesigned and standardised; (iii) a dedicated taxpayer
function was established; (iv) enforcement function
was strengthened; and (v) staff were better trained and
more motivated.
In 2007/08, SARS launched Siyakha 2. The thrust
under this second wave of reform centred on the
modernisation of SARS over a five-to-seven-year
period, in particular, “transforming both the tax and
customs administration through automation and other
operational efficiency gains”. Siyakha 2 comprises 10
programmes of modernisation, which are clustered
around implementing a new operating model and
national priorities (i.e., protecting borders and introdu-
cing social security and wage subsidy); and streng-
thening SARS’s operational foundation. At the end of
Siyakha 2, SARS anticipates that it will be able to
better: secure revenue; enhance compliance; protect
and manage its borders; and maximise productivity as
a result of operational effectiveness.
Domestic revenue performance
On the basic parameter of tax revenue to GDP ratio, the
tax system in South Africa has consistently improved
since the onset of the reforms following the end of
apartheid. In 1980, according to the South African
Reserve Bank (SARB), national revenue as a percentage
of GDP was 20.2%. When the new democratically
elected government took office in 1994, national
revenue as a percentage of GDP had risen slightly to
21.9%. By 2007/08, this figure had increased to 27.8%.
It’s worth noting that over 95% of general government
funding from taxes is raised nationally, 3.5% by
municipalities and less than 1% by provincial govern-
ments (Republic of South Africa, 2008). Tax revenue
over the 13 years to 2007/08 grew at an average
annual rate of 13.3%, in spite of the overall reduction
in tax rates at the beginning of the decade. The latest
published tax statistics indicate that in 2007/08, the
four largest sources of domestic revenue in South
Africa, in order of their magnitude of contribution to
total tax revenue, were: Personal Income Tax (29.5%);
Value Added Tax (26.3%); Corporate Income Tax
(24.5%); and the fuel levy (4.1%).
The wide breadth and depth of policy, and institutional and
administrative changes, were informed by the analytical,
policy and strategic development work of the Katz
Commission, which existed in parallel to both the
mainstream government policy organs and tax adminis-
tration systems for a period of five years (1994-1999). One
instructive facet of the Katz Commission was the phasing
of its recommendations, which were delivered in nine
separate packages (reports) over the five-year period.
Challenges and issues
As SARS moves ahead to becoming a world class
services provider, it grapples with a number of
challenges and issues, including:

Domestic Resource Mobilisation for Poverty Reduction in East Africa: Lessons for Tax Policy and Administration
27
• DRM efforts must be stepped up to finance national
development strategies: South Africa needs to
mobilise even more resources to fund programmes
for job creation, expanding education and health,
rural development, and combating crime. SARS is
challenged to raise gross tax revenue as a
percentage of GDP from about 24.5% in 2009/10 to
26.2% by 2012/13;
• A different approach for dealing with taxpayer
segments is needed: SARS management recognises
that it cannot sustain the tax compliance culture it
has cultivated over the years without rationalising the
way in which it utilises its human resources. To this
end, SARS has embarked on a review of segmen-
tation arrangements, because it has realised that it
does not have sufficient capacity to run them all;
• SARS must continue to widen its tax base for the
foreseeable future by: further expanding its outreach
through ‘walkabouts’ to establish unknown econo-
mic activities, which are outside the tax net;
assessing how it can expand its footprint into areas
where it has no branches; and increasing the
number of lifestyle audits;
• SARS’s staff capacity must keep abreast with its
transformation: A leadership management training
initiative needs to be rolled out across the organisa-
tion. Furthermore, SARS is also looking at options for
recruiting and retraining staff in critical areas with
gaps such as enforcement, customs, strategy and
analysis;
• The additional burden of administering non-tax
government programmes: SARS has undertaken
an initiative to support the implementation of
government’s social security and wage subsidy
interventions, and to administer a cash reimburse-
ment system for employers. These developments
place an additional administrative burden on SARS;
• The increased cases of crime and corruption need
to be kept in check: SARS reports an increase in
syndicated crime, particularly in the areas of fraud
and corruption. Also, such crimes have extended
to the banking system, and there are increasing
risks of using bank accounts and cheques to
defraud SARS;
• Challenges around regional trade integration: There
are issues around rules of origin, which lead to a lot
of paperwork. Also some member states of the
South African Customs Union may be unwilling to
reduce common external tariffs and/or admit new
members. South Africa is challenged to lead in
addressing these issues.
Lessons learned
Although there are considerable lessons from South
Africa, only six are highlighted in this case study:
• Strong collaboration between SARS and the Natio-
nal Treasury has been instrumental to successes in
revenue mobilisation: For example, since 2009, the
National Treasury, in partnership with SARS, has
initiated the production of very comprehensive tax
statistics. A close working relationship is also evident
in annual reports and strategic plans produced by
SARS, which invariably contain insightful messages
from the Minister of Finance;
• Solid policy formulation and evaluation capacity are
key to strong revenue performance: The Govern-
ment of South Africa has strong tax policy capacity
within SARS and the National Treasury. The latter
also welcomes SARS’s views on: new tax policy
proposals, and the implications of trade policies and
agreements for customs;
• Compacts with professional and industry groups can
reinforce compliance and facilitate administrative

Domestic Resource Mobilisation for Poverty Reduction in East Africa: Lessons for Tax Policy and Administration
28
efficiency and effectiveness: Compacts such as the
banking accord can definitely be extended to other
industries and professional groups;
• Minimising the level of exemptions ensures tax
policies remain neutral: The government grants tax
exemptions on an extremely exceptional basis. Only
a few public benefit and public sector organisations
are eligible for exemptions, and these are legislated
and not discretionary;
• Modernising through the use of ICT can result in
significant operational efficiencies, but must be
applied judiciously: Particularly relevant lessons
learned from SARS’s extensive use of ICT applica-
tions include: integrating core tax systems is critical
to enabling a ‘single view of the taxpayer’; use of
eFiling throughout the year should be encouraged
by offering incentives; and implementation should
be gradual to cater for complexities in the tax
environment;
• Good client service is critical for promoting voluntary
compliance: SARS has focused its approach and
efforts on three services: call centres, walk-in
centres and eFiling. This also includes a lot of effort
during the filing season to assist taxpayers in
completing their tax returns;
• A policy of zero tolerance for corruption is an
important deterrent: SARS established an Anti-Cor-
ruption and Security (ACAS) Unit in 2007. The Unit’s
work is informed by SARS’s risk engine. It is also
noteworthy that the unit: has developed standards
to safeguard physical and information access;
works closely with the police, banks, and the
intelligence service; and pre-investigates each
reported incident to establish its validity. In addition,
the Unit’s work is informed by extensive research
and analysis.
The rest of the chapter is organised as follows: the first
section discusses the political economy and fiscal
legacies, the second section covers trends in the tax
system, the third section explores domestic revenue
performance, the fourth section highlights the
challenges to increasing DRM, and the fifth section
concludes with lessons learned.
Domestic Resource Mobilisation for Poverty Reduction in East Africa: Lessons for Tax Policy and Administration
29
Context – Political economy and fiscal legacies
1 http://www.reservebank.co.za/ [Accessed 28 February 2010].
The legacy of the apartheid
economy
In 1994, when South Africa’s first post-apartheid demo-
cratic government assumed power, the nation’s
economy was in poor shape. Between 1985 and 1994,
the economy grew by an average rate of 0.8% of GDP,
representing a decline of “-1.3% in per capita terms” (Du
Plessis and Smit, 2007). Thirty-two years of an institu-
tionalised apartheid regime which was vanquished by a
long liberation struggle, and economic sanctions in later
years, had contributed to high interest rates, low levels of
investment, double digit inflation, and, a weak interna-
tional reserve position (Nowak, 2005). Furthermore, by
1993/94, the fiscal deficit had grown to 10.2% and
11.2% of GDP at national and provincial government
levels respectively (IMF, 1998). According to the South
African Reserve Bank, in 1994, total national debt as a
percentage of GDP was 43.5% 1.
In the decade to liberation, the tertiary sector
accounted for 94% of GDP growth (see Annex 2.3:
Table 1). However, between 1984 and 1994, manu-
facturing was a significant contributor to the economy.
Prior to the lifting of economic sanctions, South
Africa’s trade policy was essentially protectionist. Until
the 1970s, the apartheid government facilitated
import substitution industrialisation to promote local
manufacturing, which tended to be capital-intensive.
This policy contributed to the generation of “current
account deficits and …[drained] foreign exchange
reserves”, which could not be covered by the revenue
generated from mineral exports (Lowenberg and
Kaempfer,1998). Furthermore, by the 1970s, import
substitution industrialisation started to have less
impact on economic growth. Government therefore
started to encourage non-gold exports through the
provision of incentives. In tandem, it attempted to
reduce the level of protectionism by curtailing quanti-
tative restrictions on imports.
Another major socio-economic legacy of the apartheid
regime was that the new government inherited “a large
pool of unskilled and unemployed labour, and acute
widespread poverty” coupled with a vast majority of
South Africans having limited or no access to basic
social services, such as education and health (Nowak,
2005). The poverty levels and inequality were also high
by middle-income country standards. Leibbrandt et al
(2001) estimate that the percentage of the population
living on R91 a month (or US$2 a day) in 1996 was
26% (Leibbrandt et al, 2009). There were also huge
disparities in South Africa’s per capita income across
different races.
Post-apartheid economic
and development trends
Given the state of affairs presented above, the newly-
elected democratic government initiated several
measures to ensure macro-economic stabilisation, in-
cluding reducing the fiscal deficit by exercising prudence
over debt management, reforming the tax regime and
revenue administration, and lowering public sector
consumption expenditure (e.g., by limiting increases in
the wage bill, reducing subsidies, rationalising structures
and improving management, particularly at provincial
level) (Ajam and Aron, 2009; Horton, 2005).
Government’s development objectives have remained
consistent since the 1990s. Its priority areas, with
respect to development, continue to evolve around:
promoting economic growth; investing in social and
economic infrastructure; rural development; building
human capacity through provision of basic education
and job creation; improving the health of South
Africans; curbing crime and corruption; community
development; effective resource management; and
improved services delivery. Public expenditure as a
percentage of GDP was 27.2% in 1997/98 and
remained more or less at the same level until 2007/08

Domestic Resource Mobilisation for Poverty Reduction in East Africa: Lessons for Tax Policy and Administration
30
2 Ibid.3 (http://www.treasury.gov.za/documents/national%20budget/default.aspx ) [Accessed 2 February 2010].4 Ibid.
Figure 2.1: Trends in South Africa’s overall development financing mix (1996 to 2008)
100%
Exports of goods & services Portfolio equity flowsDirect investment in reporting Total revenue excl.grants
Gross private savings, current prices
economy (FDI Inward)
80%
60%
40%
0%
-20%
19961998
19992000
20012002
20032004
20052006
20072008
1997
20%
Source: Africa Economic Outlook (AEO) 2010 data
(29%). In 2008/09, public expenditure was budgeted
to rise to 31.3% of GDP2.
In 1994, the Government launched a Reconstruction
and Development Programme (RDP) aimed at mobilising
revenue resources for development to meet the chal-
lenges of poverty and inequality. The programme
“stressed tax simplification, reorientation…in spending,
greater budget transparency, and the development of a
five-year fiscal framework” (Horton, 2005). The RDP
mainly financed social sector investments. Later, it was
effectively replaced by the Growth Employment and
Redistribution (GEAR) Strategy, which set a vision and
framework for growth from 1996 to 2001. Key medium-
term interventions under GEAR included: accelerating
fiscal reforms; strengthening trade and industrial policy
reforms; investing in infrastructure; further relaxing
exchange controls; moderating wages and prices to
enhance public service delivery. Promoting the growth of
small, medium and micro-enterprises was a key area of
focus. Reforms in education, health and welfare, and
housing were also high on the agenda.
All these measures bore fruit. By 2001, they had contri-
buted to reduced inflation and lower interest rates. As
a result, the economy started to grow, and government
was able to mobilise additional domestic resources
through taxes (Faulkner and Loewald, 2008). From
2000/01 to 2005/06, the economy grew at an average
rate of 3% of GDP. Thereafter, in 2006/07 and
2007/08, economic growth rose to about 5%. The
fiscal deficit as a percentage of GDP steadily declined
between 1997/98 (3.8%) and 2002/03 (1.1%), before
it rose again in 2003/04 to 2.3%3. In the fiscal years
2005/06, 2006/07 and 2007/08, there were positive
budget balances4.
Domestic Resource Mobilisation for Poverty Reduction in East Africa: Lessons for Tax Policy and Administration
31
5 http://hbswk.hbs.edu/item/5528.html [Accessed 15 June 2010].6 In 2010, the Government of South Africa guaranteed a loan from the World Bank to its electricity generating public enterprise.
Development financing mix
and challenges
Figure 2.1 presents South Africa’s overall development
financing mix from 1996 to 2008. During the period,
domestic revenue and exports of goods and services
were two top sources of development financing,
representing 24.6% and 28.9% of GDP respectively.
Following the collapse of apartheid and the removal of
sanctions, South Africa played a more active role in the
international trade and finance markets. For example, it
is a signatory to various preferential trade agreements.
In addition, the Government has been proactive in
promoting exports through such measures as the
Export Marketing and Investment Assistance Scheme
and Industrial Development Zones (IDZs) (SARS, 2007b).
Private savings were the third largest source of
development financing. However, between 1996 and
2008, gross private savings declined from 16.8% to
10.3% of GDP. This was due to such factors such as
financial liberalisation, which encouraged “borrowing by
the personal sector to an excessive degree” and high
levels of unemployment (Aron and Muellbauer, 2000).
Foreign direct investment (FDI) in South Africa averaged
at 1.4% of GDP between 1996 and 2008, which is lower
than the benchmark for emerging economies of 2.7%. A
higher proportion (2.8%) of foreign investments was
made through the financial markets by way of portfolio
inflows5. Combined FDI and portfolio inflows constituted
an average of 4.2% of GDP from 1996 to 2008.
South Africa has consistently resisted the influence of
international development organisations in its macroe-
conomic and fiscal affairs. Until 2009, its relationships
with the IMF and World Bank were limited to Article IV
consultations and sharing of knowledge6. Also, it does
not receive any significant assistance from any bilateral
government source.
The recent global financial crisis adversely affected
Government’s ability to mobilise domestic resources
from taxes. Nonetheless, it has undertaken initiatives
to stimulate economic recovery through capital
investments. It has also made a commitment to
sustain the level of financing for social services.
However, one of South Africa’s development financing
challenges is that at liberation, debt levels were signi-
ficant. This high level of debt implied high servicing
costs and squeezing out resources needed for
development. Furthermore, there was concern that in
the absence of a marked reduction, the high level of
debt would be passed onto future generations.
Thankfully, the Government recognised the challenge,
which has been reflected in the Finance Minister’s
budget speech over the years high lighting its
objective to reduce the overall level of debt. It is worth
noting that since 1999/2000, the Government was
able to reduce its overall debt level through restructu-
ring and divestiture of state assets. Moreover, it also
benefited from the reduction in domestic interest
rates, attributed to prudent fiscal and monetary
policies. In its most recent budget proposals
(2009/10), the Government indicated that over the
medium term (to 2015/16) debt will peak at 44% of
GDP. It also appears fairly bullish that investors will
remain confident in its favourable macroeconomic
policies, and as a result South Africa’s sovereign
investment ratings will be maintained at current levels.
Political economy dynamics
underpinning DRM
The synopsis of the political economy legacies that
have impacted DRM, as presented in the following

Domestic Resource Mobilisation for Poverty Reduction in East Africa: Lessons for Tax Policy and Administration
32
7 Brautigam’s framework is adopted because, compared to others that were examined, it is judged to be more comprehensive and elegant. However,given the fact that this framework’s , historical perspective also derives from the emergence of the modern European state, it needs to be carefully in-terpreted when applied to states that are legacies of colonial rule and apartheid.
8 South African Institute of Race Relations (http://www.sairr.org.za/) [Accessed 3 February 2010].9 In a society where “tax morale” is high, there are low levels of tax evasion and avoidance. It is only in a social culture where citizens generally appre-
ciate their responsibility for sustaining state services and where they have a trust in their state institutions and leaders that a “tax morale” evolves.
subsections, is based on Brautigam’s (2008) analytical
framework.7 It consists of five facets: (i) level of econo-
mic development and economic structure; (ii) societal
factors: culture, values, trust and ‘tax morale’; (iii) war
and taxes: bureaucratic modernisation as a response to
threat; (iv) political institutions and tax systems; and (v)
taxation and fiscal contract.
A modern economy but majorstructural imbalances persist
At liberation, the economic structure was modern (see
Annex 2.3: Table 1). Therefore, from one perspective, the
apartheid regime did not wholly bequeath its successors
an economy in a shambles. DRM at a national
government level was comparatively modest (at 22% of
GDP) compared to 38% for industrialised countries
(Ndulu et al, 2007). However, the economy was already
contracting. Yet, in comparison with virtually all other
states on the continent, South Africa is credited to have
the most modern and strongest economy.
The downward trend in economic growth and fiscal
performance in the sunset days of the apartheid regime
were symptomatic of the malaise afflicting the political
economy with regard to DRM. A comparatively small
proportion of privileged White, Coloured and Asian
populations had considerable wealth and property in
the modern economy. Individual taxpayers were also
preponderantly from the same communities. The vast
majority of the population was conscribed to low pay, a
peasant existence, unemployment and poverty.
An earlier section outlined government’s efforts since
1994 to grow and restructure the economy. Until the
global financial crisis whose impact was most felt in
2009, the government had succeeded in restoring
macro-economic and fiscal stability, steadily growing
the domestic product, and expanding the tertiary
sector. In the latter context, the scope for DRM was
significantly enhanced over the period. However, the
imbalances from the apartheid regime persist.
The abhorrent dual system institutionalised under the
apartheid regime, underlies the socio-cultural divide in
South African society. On one hand, the majority
remains engaged either in the primary and informal
sectors or unemployed. Furthermore, the unemploy-
ment situation has much worsened since 1994.
According to the South African Institute of Race
Relations: “The number of unemployed South
Africans, using the strict definition of unemployment,
increased from nearly 2 million to 4.3 million between
1994 and 2007. The unemployment rate increased
from 20% to 25.5% over the same period”8
On the other, there is a comparatively small proportion of
the population that derives its income from modern
economic activities, and therefore contributes most to the
domestic resources. Thus, out of a population of 49
million, only 5 million (or 10% of the population) are regis-
tered as taxpayers, which is low for a country at South
Africa’s stage of development. In this regard, for example,
in 2007, two other upper middle-income economies, Chile
and Latvia, had 45% and 44% of their population registe-
red as taxpayers respectively (OECD, 2009a).
A culture that is more trustingof government and higher taxmorality is evolving9
According to Smith (2003), the apartheid regime cultiva-
ted a culture of compliance among the majority
taxpayers. Still, the author notes that there is a wides-
pread perception among tax specialists that “apartheid-

Domestic Resource Mobilisation for Poverty Reduction in East Africa: Lessons for Tax Policy and Administration
33
10 Fiscal contract has its genesis in agreements between European monarchies and the propertied class and merchants that the latter would contributeto state coffers, especially to fund war in return for specific benefits. In modern times, a fiscal contract would be characterized by government pledgesof specific socio-economic benefits to justify taxation. This is a more realistic proposition in a democratic dispensation.
era tax collection was characterised by high levels of
avoidance”. This latter view appears to be borne out of
data in the growth of registered taxpayers, which has
more than doubled since liberation.
Some of our key informants also suggest that
although the banking and mining industries were key
drivers of the economy before 1994, they did not
necessarily pay taxes. However, compliance levels
from these sectors has since considerably improved.
Furthermore, South Africa has demonstrably vigorous
anti-corruption and enforcement agencies. It can
therefore be surmised that over the past decade or
so, a culture that is more trusting of government and
higher tax morality is evolving.
The insecure apartheid statemodernised its bureaucracyby co-opting a White minority to payhigh tax rates
The increasing global resistance to the apartheid
regime, especially after the Soweto riots of 1976,
which was followed by the progressive introduction of
sanctions by the international community in the
1980s, posed a clear threat to the regime and its
privileged beneficiaries. These developments explain
the high tax rate regime and the legacy of an efficient
Inland Revenue administration.
As the minority White regime in successive decades
promoted its apartheid policies and an anti-commu-
nist stance, it co-opted its followers who also domi-
nated the modern economic sector to pay taxes
(Lieberman, 2003). It is significant that by 1972, the
top personal income tax rate in South Africa was 62%.
By then, resistance to the regime by the non-White
population was gaining momentum.
Post-liberation - there was strongpolitical and union supportto increase DRM through tax reform
A top priority of the African National Congress (ANC), the
dominant party in the post-apartheid coalition govern-
ment of 1994, was to vastly and rapidly enhance its
domestic resources aimed at funding its ambitious
growth and poverty reduction programmes. Therefore,
in 1994, it pushed for the establishment of the Katz
Commission to undertake an extensive review of tax
policies and administration (Manuel, 2002). On the basis
of the Commission’s interim report, the autonomous
South African Revenue Service (SARS) was established
in 1997. It is noteworthy that the first Commissioner of
SARS (Pravin Gordhan) as well as the long-serving
former Minister of Finance (Trevor Manuel) are longstan-
ding ANC stalwarts “who believe that tax collection is key
in the shared political project of economic growth with
redistribution” (Fjeldstad and Moore, 2008). Furthermore,
as long as he remained in charge of SARS (until 2009),
Commissioner Gordhan, did not hesitate to mobilise the
ANC structures to campaign and educate for DRM
among all sections of the population. The strong trade
unions in South Africa have been close allies of the ANC
for decades. According to Lieberman (2003), this alliance
has not only served to support SARS, but also advanced
policies for resource redistribution through taxation. For
these two predominant political institutions, the tax
system is one of the several institutions targeted for
righting past wrongs.
There is an implicit fiscal contractbetween the governmentand its taxpayers10
The relatively high compliance with taxation among
the White population, and near total tax avoidance by
Blacks under the apartheid is readily explainable. In

Domestic Resource Mobilisation for Poverty Reduction in East Africa: Lessons for Tax Policy and Administration
34
the post-apartheid regime, compliance levels have
rapidly risen across the population, as reflected in the
growth of registered taxpayers. The majority of the
Black population still expects that government will
deliver on its pledges to improve access to social
services, and create employment and combat poverty.
In this regard, the majority of the Black elite have a
strong sense of the need to expand the public expen-
diture framework, and therefore the compelling case
for them to pay taxes. The majority of the non-Blacks
as well as the Black elite also support the expansion
of government programmes to develop infrastructure,
and reduce unemployment and thereby crime. There-
fore, at an individual level, there is an implicit fiscal
contract between the Government and its taxpayers,
which in any case is underscored in successive post-
apartheid budget speeches. In this regard, for exam-
ple, Lieberman (2003) asserts that while:
“Upper groups have expressed desires to shift the
tax burden downwards,…the normative order of
post-apartheid…has provided compelling reasons
for the rich to pony up to their tax obligations”
According to Lieberman (2003), the cohesiveness that
existed among businesses in apartheid South Africa on
matters of fiscal policy, has since become stronger. By
2003, there was “remarkably little polarization within the
ranks of businesses and professionals on key policy
positions, particularly with respect to taxation” (Lieber-
man, 2003.
Furthermore, since the National Treasury and SARS
have adopted a participatory approach to policyma-
king, and tax rates have been generally on the decline
since the late 1990s, the business community, on the
whole, appreciates the benefits that they derive from
the government’s services that are funded by their tax
contributions.
Fiscal governance drivers,
results and trajectory
The synopsis on political economy legacies underscores
the fact that politics has pervasively impacted fiscal
governance options in South Africa. The failure of fiscal
governance contributed to the wrought of apartheid
politics, which precipitated its end. In other words, the
increasing inability of the apartheid regime to sustain a
balanced fiscal position and thus a credible macroeco-
nomic environment was an important contributory factor
to its demise. However, the legacy of that fiscal and
macro-economic regime continues to influence the
politics of fiscal governance in the post-apartheid era. The
discrimination in the provision of public services under the
apartheid regime is a key driver for the rapid expansion of
the fiscal framework with a view to addressing historical
disparities. Inherently, there is a continuing and strong
momentum to rapidly grow resources, which can be
made available for public expenditure.
Although the South African economy is relatively
modern, it has remained fragile. Since the days of apar-
theid, the high political risks associated with capital flight
have persuaded the government to maintain stringent
foreign exchange controls. For this reason, South Africa
has kept away from the option of mobilizing resources
from the Bretton Woods institutions, which in all proba-
bility would demand the end of such controls. Yet, at the
same time, by remaining disengaged from these institu-
tions, South Africa significantly constrains itself from
international resource mobilisation. Therefore, it has
remained predominantly reliant on DRM.
Post-apartheid politics espoused the rationale of using
taxation as a distributional policy instrument to right the
historical wrongs. However, the ANC’s initial sensitivity
that its pre-1994 socialistic orientation could deter

Domestic Resource Mobilisation for Poverty Reduction in East Africa: Lessons for Tax Policy and Administration
35
foreign capital not only prompted the new leaders to
considerably moderate tax policies, but also put strong
emphasis on administrative measures – beginning with
the establishment of SARS. This perspective, in part
explains, the gradual decline in income tax rates. The
other important factor underlying the policies to reduce
personal income taxes, and in some cases, eliminate
trade tariffs, is the imperative to remain globally compe-
titive as an attractive investment destination. Although
the South African economy has a strong natural
resource base, it largely relies on manufacturing and
services sectors, which are open to external competi-
tion.
Given the constraints under which the post-apartheid
governments have exercised fiscal governance, the
administrative capacity and performance of SARS
remains the key determinant of both fiscal space and
effort. Therefore, political leaders have had to rely on
SARS to grow domestic resources and enable the
expansion of fiscal space despite a decline in tax
rates. As Smith (2003) observes, in post-apartheid
South Africa, the involvement of politicians has positi-
vely impacted on SARS’s effectiveness. She also
contends that “SARS’s experience shows that, where
the political and revenue-raising authorities have a
common interest in enhanced collection, their
collaboration is an important source of effectiveness”.
This is reflected in the growth of registered taxpayers
(see Annex 2.3: Table 16).
In our view, three main factors will play out in the fiscal
governance of South Africa in the short-to-medium
term. First, sustained pressure from political leaders
and trade union representatives of low wage workers
on the Government, to move rapidly and expand its
public expenditure programmes for employment
creation and poverty reduction. In other words, a strong
socio-political demand for an expanded fiscal space
and enhanced effort will prevail.
Second, the negative effects of the global financial
crisis led to reduced trade volumes, commodity
prices and business profits, as well as domestic
revenue.
Since the option of contracting the public expenditure
framework may not be politically tenable, the need for
alternative sources of additional revenue or raising the
tax rates appears inescapable. With regard to the latter,
for instance, as indeed already indicated by the Minister
of Finance in his latest budget speech (for fiscal year
2010/11), there are distinct prospects that income tax
and VAT rates will be raised in coming years.
Third, what the Economist (2010) has described as a
large and growing problem – is corruption. According
to this publication, although in 2009, South Africa
fared well in the Transparency International Corruption
Perception Index ranking (55th out of 180 countries),
corruption in the country is on the rise. The ANC has
publicallyexpressed concern about the scourge. The
Economist suggests that this trend is entangled with
a culture of Black entitlement to compensation for
past suffering under apartheid, and many South Afri-
cans seem unconcerned about its negative impact. If
this trend is not checked, there is a high risk that it will
exacerbate corruption in the tax administration
system. All this will lead to an increase in tax
avoidance and collection leakages.

Domestic Resource Mobilisation for Poverty Reduction in East Africa: Lessons for Tax Policy and Administration
36
Trends in the tax system
Changes in tax policies over
the years
This section covers three episodes in tax policy
changes in South Africa: (i) those in place during the
apartheid era; (ii) policies formulated following the
dismantling of apartheid; and (iii) tax policies post-1994.
Tax policies in the apartheid era
Before and during the apartheid era, major source of
revenue was income tax. According to Lieberman
(2003), after many failed attempts, income tax was first
introduced in South Africa just before the First World
War, in 1914. This was about the same time it was
introduced in many European countries. In 1962, new
income tax legislation was enacted. It consolidated the
responsibility for collection of major taxes, collected at
a provincial government level, to be transferred to the
central government; and introduced the pay-as–you-
earn (PAYE) system. Over the next two decades, the
Income Tax law was amended to reflect changes in
rates. In addition, the Customs and Excise Act was
promulgated in 1964. Since then, as outlined below,
there were two key periods in tax policy reforms.
Major tax policies formulated
in the early 1990s
The VAT, which replaced the goods and services tax,
came into force in 1991 amid huge protests by unionised
workers (Lieberman, 2003). Still, VAT remained in force
and was levied at a rate of 10% until 1993 when it was
raised to 14% and remains the same today. The VAT rate
in South Africa is lower than the rest of Africa and many
other European countries. There have been calls by inter-
national financial institutions and businesses to raise it.
Tax policies introduced in 1994
After liberation, Government revised tax policies
following recommendations made by the Katz
Commission (1994 to 1999). Since 1994, South
Africa’s tax policy objectives have centred on: curbing
evasion; widening tax base; promoting greater
compliance; facilitating private sector investment by
ensuring that tax rates are competitive; reducing the
compliance burden; and ensuring that the tax regime
is equitable and neutral. Its focus is on policies, which
affect South Africa’s three main sources of revenue:
personal income tax (PIT); corporate income tax (CIT);
and the VAT. Then again, Government has formulated
new policies outside these three main categories, which
are in line with international best practices and/or more
suited to the modern-day South Africa.
The Katz Commission recommended that one way by
which government could widen the tax base with
respect to VAT was to expand it to “include all
fee-based financial services, except for premiums on
life policies, contributions to pension, provident fund,
retirement annuity and medical aid funds” (Manuel,
2002). Also, in 1998, Government, recognising the
pitfalls of VAT as being often susceptible to evasion and
fraud, introduced VAT on all exports and imports from
Botswana, Lesotho, Namibia and Swaziland (BLNS
countries) to minimise “round tripping, which occurs
when goods are exported to the BLNS countries, and
then re-imported and sold in South Africa without the
payment of VAT” (SARS, 1999).
With respect to personal income tax, legislation was
rationalised on the advice of the Katz Commission. It
was done, for instance, to: reduce the number of
income tax brackets; offer greater relief to low income
earners; and adjust tax thresholds. It also progressively
lowered CIT rates (see Annex 2.3: Table 2). From 2000,
in an effort to broaden the tax base, various taxation
Domestic Resource Mobilisation for Poverty Reduction in East Africa: Lessons for Tax Policy and Administration
37
11 See http://www.treasury.gov.za/documents/national%20budget/2001/review/Default.aspx [Accessed 9 March 2010].12 http://www.sars.gov.za/home.asp?pid=2631 [Accessed 1 February 2010].
policies were amended to: disallow certain allowances
given to employees as tax free; provide for individuals
and companies to start paying taxes on a worldwide
rather than resident basis; and remove loopholes in the
income tax law (SARS, 2001). The Government was
able to sell these policy changes to taxpayers largely
because of its promise to reduce taxes over time.
The Commission’s recommendation also helped
Government to introduce a capital gains tax (CGT) in
2001. The rationale for a CGT was to11:
• Make the income tax system more efficient by
discouraging taxpayers from categorising ordinary
income into tax-free capital gains;
• Promote equity by ensuring taxpayers with the same
levels of income bear comparable tax burdens
irrespective of their sources of income;
• Mobilise greater levels of domestic revenue; and
• Align South Africa’s tax regime with international
practices. For example, countries such as Australia,
Brazil, Canada, India, Japan, Nigeria, the UK and
USA levy CGT.
More recently, in 2008, Government introduced new
measures to align South Africa’s corporate tax policies
with international good practices. Specifically, in an
effort to remove the burden placed on companies to pay
a Standard Tax on Companies (STC), which is levied on
profits and then distributed through dividends, a dividend
tax12 plan was announced. Furthermore, the Mineral and
Petroleum Resources Royalty Act, 2008 requires mining
companies to pay royalties on the ground that minerals
belong to the state and are not renewable sources of
energy. The Minister of Finance, however, postponed
implementation of the Act due to intensive debate on the
formula, and the recession in 2008/09. Nonetheless, the
legislation became effective in 2010.
Over the years, to encourage taxpayer registration
and/or compliance, Government has also offered
various tax amnesties. First, the Exchange Control
Amnesty and Amendment of Taxation Laws Act, 2003
gave amnesty to residents with unlawful holdings time
to register them (SARS, 2004). An exchange control
levy of 10 or 5% was payable if the illegal asset was
kept offshore or repatriated to South Africa respectively.
Second, the Small Business Tax Amnesty and
Amendment of Taxation Laws Act, 2006 gave small
businesses a chance to voluntarily state non-com-
pliance with the law (SARS, 2007a). Third, the Minister
of Finance, in his most recent budget speech,
announced that government will offer non-compliant
taxpayers the opportunity to disclose and make good
their tax liabilities under the Voluntary Disclosure
Programme which will run for a period of 12 months
from November 2010.
A study by the World Bank’s Financial Investment
Advisory Services (FIAS) group found “that overall the
[tax] compliance costs are regressive – the smaller the
business, the heavier the burden” (2007). As a result, the
majority (over 60%) of businesses with an annual turno-
ver of R300,000 or less preferred not to formalise their
businesses. The study recommended the design and
implementation of a simplified tax regime for small
businesses. A 2008 survey of small business enterprises
commissioned by the USAID endorsed a similar propo-
sal. Accordingly, from 1 March 2009, Government
introduced a simplified tax system for micro-businesses
(including sole proprietors, individuals, partnerships,
close corporations, companies and co-operatives) with
a turnover of R1 million or less. The new system requires
that small taxpayers pay a single turnover tax rather than
five separate taxes (i.e., VAT, provisional tax, income tax,
CGT and STC).
South Africa has been very proactive in the interna-
tional dialogue on trade facilitation. Therefore, the
government remains cognisant of the global trends,
Domestic Resource Mobilisation for Poverty Reduction in East Africa: Lessons for Tax Policy and Administration
38
13 Under apartheid, there were also separate revenue administrations in the homelands.
and in particular, customs duty which is not part of
the government budget. As a consequence, today,
over 70% of South Africa’s imports are tax free. “This
is not the case in most Sub-Saharan African
countries where Customs duties still account for a
large, even majority share of total state revenues”
(SARS, 2007b). The Minister of Trade and Industry
sets the rates of customs and excise duties based on
recommendations received from the International
Trade Commission of South Africa.
Institutional changes
By the mid-1990s, morale in the former Directorates of
Inland Revenue and Customs and Excise was low 13.
For example, poor pay contributed to high staff turno-
ver. Furthermore, the directorates were severely
underfunded. In 1996, the directorates were merged
into a general government department under the
leadership of an ex-chief executive of a major bank
(Marcus et al, 2005). Thereafter, as a means for “taking
on the issues of large-scale tax evasion and ineffective
countering of avoidance, and to reduce the considera-
ble tax gap” SARS was established under Act No. 34
of 1997 (Fan et al, 2007).
SARS is headed by a Commissioner, appointed by the
President, who is accountable to the Minister of
Finance. The Commissioner works closely with an
Executive Committee (ExCo) that he chairs, and which
comprises about 15 members from senior management.
ExCo is supported by various themes (e.g., on people
and modernisation) and oversight committees (e.g., audit
with some external members). It is noteworthy that until
2002, SARS had an Advisory Board. However, this board
was dissolved following the passage of the SARS
Amendment Act of 2002 (SARS, 2003).
SARS’s organisational set-up has undergone restruc-
turing over the years. It is currently composed of three
types of business units: (i) delivery business units; (ii)
enabling; and (iii) advisory (SARS, 2009b). Specifically,
the following divisions fall under:
• Delivery: (i) taxpayer services; (ii) business enabling
and delivery services; (iii) large business centre; (iv)
customs and border management; and (v) enforce-
ment and compliance risk;
• Advisory: (i) strategic services; (ii) legal and policy;
(iii) segmentation and research; and (iv) governance
and enterprise risk;
• Enabling: (i) finance; (ii) human resources; (iii)
institutional enablement and integrity; (iv) moder-
nisation and technology; and (v) internal audit.
There are 54 designated ports for customs purposes
in South Africa – five marine, eight airports and the
remainder land border points. In addition, SARS has
46 inland branch offices and mobile tax units. Branch
offices are spread around the country’s nine
provinces.
As of 31st March 2009, SARS employed a total of
15,307 employees, out of which 556 were hired on a
temporary basis (SARS, 2009b). It is noteworthy that
almost 90% of SARS staff were employed to support
its core business functions. Under its enabling Act,
SARS has management autonomy, including freedom
to operate outside the conditions of employment in the
public service. In this latter regard, SARS aims to pay
most of its staff against median market salary levels.
Changes in administrative
systems
SARS management has, over the years, exercised its
influence in the areas of staff and other resource
management to overhaul its administrative systems. For
example, it:
Domestic Resource Mobilisation for Poverty Reduction in East Africa: Lessons for Tax Policy and Administration
39
• Operates two bonus schemes. An annual bonus
is paid out when SARS meets its revenue target
and is tied to individuals meeting balanced
scorecard metrics. There is also the ‘Amakhwezi’
Programme which runs throughout the year –
Managers are allocated a certain number of points
each year, which they use to reward exceptional
performance;
• Has also invested heavily in transforming the culture
and work ethics of its work force through: intensive
communication; enforcing ethical practices; and
skills enhancement;
• Initiated a leadership management training initia-
tive in 2008/09 targeted at mid-career managers
and team leaders. The training aims to embed
four main leadership qualities and competencies
that SARS identifies as essential for supporting
and reinforcing its values (SARS, 2009a). They
are: higher purpose and integrity; empowering
delivery; transformation; and insight.
Also, since its establishment 13 years ago, SARS has
invested heavily in modernizing its systems, driven by
its objectives to increase revenue and reduce costs.
Providing good service and making compliance easier
underpin these objectives. Electronic filing (eFiling), the
launch of a call center and the automation of key
support systems are probably the most fundamental
and successful parts of the modernisation efforts that
SARS has introduced (see Annex 2.4).
Fiscal decentralisation and
taxation by local governments
The 1996 Constitution recognises three autonomous
levels, or “spheres”, of government: national, provin-
cial, and local (municipal). The South African intergo-
vernmental fiscal transfer system is generally regarded
as well-designed and well-implemented. The overar-
ching system is defined by the Intergovernmental Fiscal
Relations Act (1997) and the Financial and Fiscal
Commissions Act (1997). The latter Act establishes the
Financial and Fiscal Commission, which is constitutio-
nally mandated to make recommendations to
Parliament on the equitable division of revenues among
the three spheres of government.
Over three-quarters of municipal revenues are collected
from own source revenues (see Annex 2.3: Table 18).
Self-financing of municipal services is believed to ensure
that they are directly accountable to local residents for
the functions performed and the services provided. Local
revenues empower residents to play an important role in
deciding on the services they prefer and are willing to
pay for, and ensure that municipalities remain responsive
to the needs of their residents.
Municipalities in South Africa have traditionally had three
main sources of own revenues: service charges (inclu-
ding electricity fees, water tariff, sewerage fees and
refuse collection charges), property taxes (known as
property rates), and the RSC Levy. Municipal revenue
potential varies considerably among jurisdictions, with
metropolitan municipalities and urban local governments
collecting the bulk of own source revenues.
Reform sequencing,
implementation and results
Overview
The end of apartheid heralded reforms in the tax system.
According to Lieberman (2003), the “election of Nelson
Mandela in 1994 provided a significant opening to
reform the country’s tax system”. Between 1994 and
1999, the Katz Commission set the stage for reforming
policy and institutional aspects of the tax system in nine

Domestic Resource Mobilisation for Poverty Reduction in East Africa: Lessons for Tax Policy and Administration
40
14 The nine segments include: (1) tax practitioners; (2) trade intermediaries; (3) complex individuals; (4) standard individuals; (5) standard income taxemployees and below threshold; (6) medium businesses; (7) micro to small businesses; (8) non governmental organisations, public benefit organisa-tions and government departments; and (9) employers as agents (SARS, 2009b)
reports. Most of the Commission’s recommendations in
these two areas have been implemented and are reflec-
ted earlier. The subsequent series of reforms took place
following the establishment of SARS. Specifically,
between 1997 and 2000, SARS made changes to some
of its operational processes, which contributed to the
organisation surpassing revenue collection targets.
However, SARS management considered these changes
as ‘incremental’ and was of the view that the
organisation was performing significantly below its
potential (SARS, 2000). Therefore, the management
initiated a diagnostic study of its operations in order to
identify issues and problems and recommend measures
for resolving them. This exercise culminated in the deve-
lopment of a programme, called ‘Siyakha’ (‘we are
building’), whose main objectives were to: “broaden the
tax base, encourage a culture of voluntary compliance…
(so making tax cheaper to collect), and create a much
more efficient and effective business” (SARS, 2005). Siya-
kha was approved by the Cabinet in September 2000.
Sequencing and implementationof reforms under ‘Siyakha’
Siyakha 1’s implementation commenced in 2001 and ran
until 2005/06. It was sequenced by province as follows:
Kwa Zulu Natal (2001); Western Cape (2003); Gauteng
(2004); and other provinces (2005/06). Key initiatives
implemented under Siyakha 1 included: development of
a taxpayer and business strategy; process redesign in
revenue and customs; overhauling taxpayer services;
implementation of policies to promote integrity and
professionalism among staff (e.g., by re-advertising all
new positions and through training, standardising work
methods, creation of work teams, creating a professional
management cadre ); and refurbishment and re-tooling
initiatives to improve the working environment (SARS,
2000). SARS reports the following results: (i) its organisa-
tional structure is flatter; (ii) processes were redesigned
and standardised; (iii) a dedicated taxpayer function was
established; (iv) enforcement function was strengthened;
and (v) staff were better trained and more motivated.
In 2007/08, SARS launched Siyakha 2. The thrust under
this second wave of reform centred on the modernisa-
tion of SARS over a five- to seven-year period, in parti-
cular, “transforming both the tax and customs
administration through automation and other operatio-
nal efficiency gains” (SARS, 2008). Siyakha 2 comprises
10 programmes of modernisation, which are clustered
around implementing a new operating model, and
national priorities (i.e., protecting borders and imple-
menting social security and a wage subsidy), and streng-
thening SARS’s operational foundation. At the end of
Siyakha 2, expected to be completed in the next couple
of years, SARS anticipates that it will be able to better:
secure revenue; enhance compliance; protect and
manage its borders; and maximise productivity as a
result of operational effectiveness. Siyakha 2 is sequen-
ced into three implementation lots, each spanning over
two or so years (see Table 2.1). Some of the preliminary
implementation results from Siyakha 2 are as follows:
• SARS’s operating model was restructured. Speci-
fically, in addition to the segmentation of large
businesses, SARS clustered the remainder of its
taxpayer base into nine segments14;
• The nine segments are served by state-of-the-art call
and walk-in centres and the eFiling service. With
respect to the latter, since 2007/08, taxpayers began
to receive populated and restructured personal
income tax forms, resulting in the reduction of errors,
(which dropped by 85% from 600, 000 in 2007 to
90 000 in 2008)) and increased client satisfaction
(see Annex 2.4);
• Risk management processes were modernised.
Using an intelligent risk engine, SARS profiles cases
for audit/investigation to enable “enforcement to
focus its activities on higher possible yield cases”
Domestic Resource Mobilisation for Poverty Reduction in East Africa: Lessons for Tax Policy and Administration
41
(SARS, 2008). Furthermore, it is also able to
compare tax returns against third party information
to identify any anomalies;
• SARS was in the process of replacing 42 legacy
systems in customs with TATIScms software. The
increased use of ICT is expected to reduce the level
of interaction with importers, and reduce corruption
(see Annex 2.4);
• SARS staff continue to receive training in client
service and tools to enable them to be more
responsive to taxpayer queries. It is noteworthy that
SARS:
• Developed a knowledge database as “a repo-
sitory of FAQs [Frequently Asked Questions],
tax information and scripted responses”
(SARS, 2009b);
• Put in place standard operating procedures
and scripted information for staff in customs
and Inland Revenue branch offices respecti-
vely. These procedures aim to limit any level of
discretion around day to day work, and ensure
clarity and certainty indecision making;
• A multi-lingual interactive voice response (IVR)
system was launched in November 2008 to facilitate
self-service. By March 2009, 1.3 million callers had
used the IVR (SARS, 2009).
Initially, other than working towards meeting revenue
targets, SARS focused on a number of key result
areas (e.g., improving technology, tighter customs
control, business process changes). However, since
2001/02 it embarked on the development of a
performance management system informed by the
‘balanced scorecard’ approach (SARS, 2001). From
2007, SARS’s annual reports published actual achie-
vements against targets (see Annex 2.3: Table 20). In
sum, the results suggest that the administrative
reforms contributed to increased ta revenue due to
one or more of the following factors: simplification of
systems and processes encouraging voluntary
compliance; improved enforcement arrangements
(e.g., with respect to risk-based audits and debt
collection); and quicker processing times (e.g., for tax
returns).
With respect to these reforms, it is also noteworthy
that e-Filing contributed to a dramatic reduction in the
time taken to process income tax returns - in 2006/07
and 2007/08 the percentage of tax returns proces-
sed within 48 hours was 1.6% and 34% respectively.
Table C19 also shows that efforts to improve SARS’s
compliance and enforcement (i.e., audit, debt collec-
tion and investigation) functions paid off. In 2006/07
and 2007/08, the number of registered taxpayers
(particularly CIT payers) grew by 17% and 12%
respectively. So did SARS’s success in risk-based
audits – 68% (2006/07) and 73% (2007/08) of cases
yielded additional revenue.

Domestic Resource Mobilisation for Poverty Reduction in East Africa: Lessons for Tax Policy and Administration
42
Table 2.1: Sequencing of Siyakha 2 interventions
Lot 1: Create capacity, design and prepare for modernisation
Lot 2: Implement new model Lot 3: Deliver world-class service
• Align organisation on strategic
choices and direction
• Launch division-specific quick-wins
and no regrets moves
• Develop intelligence and transpa-
rency on taxpayer and trader seg-
ments and develop differentiated
business model
• Develop core skills and capabilities
to deliver
• Take actions to improve perfor-
mance transparency and business
processes
• Develop organisational capabilities
and capacity
• Implement new business model
per segment
• Capabilities in place
• Shift in effort and allocation of
resources
• Core tax process re-design
• Broader people process and
values programme
• Change the way SARS acts and
performs in all areas and on all
organiastion levels
• Deliver full results according to aspira-
tional targets and desired end state
(revenue, compliance, border
management)
Source: SARS
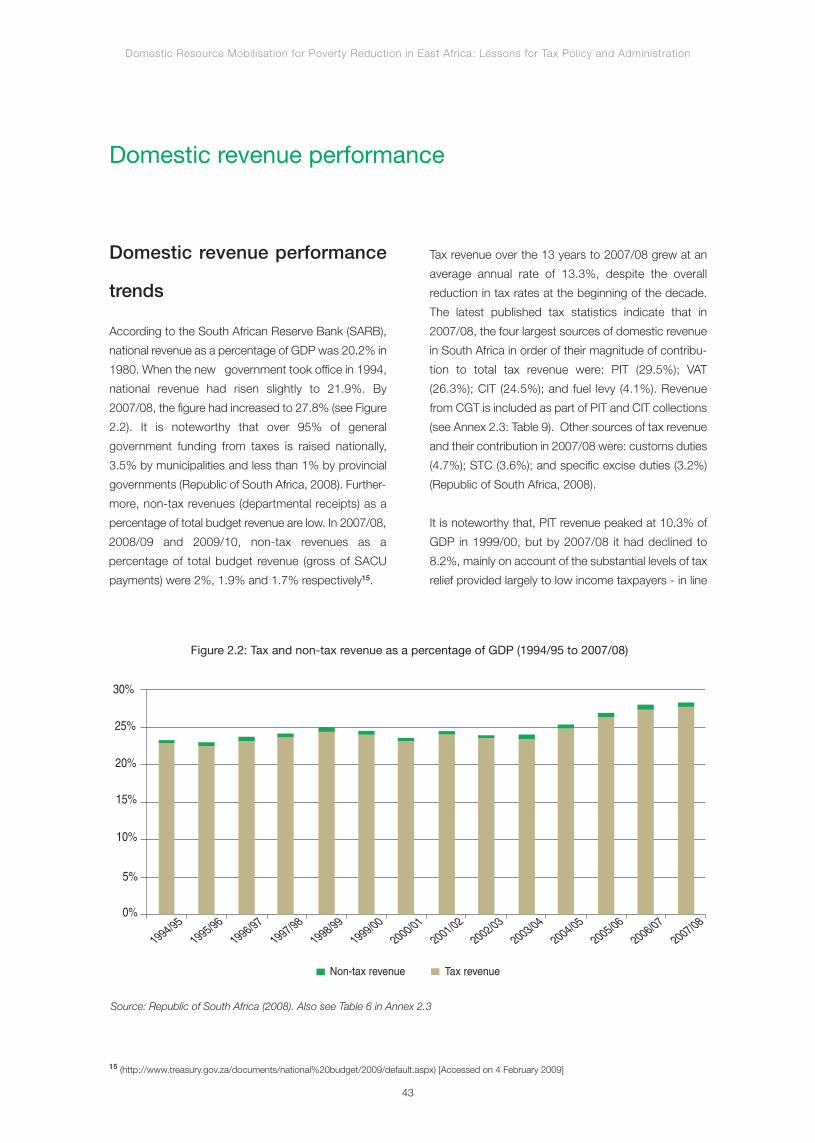
Domestic Resource Mobilisation for Poverty Reduction in East Africa: Lessons for Tax Policy and Administration
43
Domestic revenue performance
Domestic revenue performance
trends
According to the South African Reserve Bank (SARB),
national revenue as a percentage of GDP was 20.2% in
1980. When the new government took office in 1994,
national revenue had risen slightly to 21.9%. By
2007/08, the figure had increased to 27.8% (see Figure
2.2). It is noteworthy that over 95% of general
government funding from taxes is raised nationally,
3.5% by municipalities and less than 1% by provincial
governments (Republic of South Africa, 2008). Further-
more, non-tax revenues (departmental receipts) as a
percentage of total budget revenue are low. In 2007/08,
2008/09 and 2009/10, non-tax revenues as a
percentage of total budget revenue (gross of SACU
payments) were 2%, 1.9% and 1.7% respectively15.
Tax revenue over the 13 years to 2007/08 grew at an
average annual rate of 13.3%, despite the overall
reduction in tax rates at the beginning of the decade.
The latest published tax statistics indicate that in
2007/08, the four largest sources of domestic revenue
in South Africa in order of their magnitude of contribu-
tion to total tax revenue were: PIT (29.5%); VAT
(26.3%); CIT (24.5%); and fuel levy (4.1%). Revenue
from CGT is included as part of PIT and CIT collections
(see Annex 2.3: Table 9). Other sources of tax revenue
and their contribution in 2007/08 were: customs duties
(4.7%); STC (3.6%); and specific excise duties (3.2%)
(Republic of South Africa, 2008).
It is noteworthy that, PIT revenue peaked at 10.3% of
GDP in 1999/00, but by 2007/08 it had declined to
8.2%, mainly on account of the substantial levels of tax
relief provided largely to low income taxpayers - in line
15 (http://www.treasury.gov.za/documents/national%20budget/2009/default.aspx) [Accessed on 4 February 2009]
30%
25%
20%
Non-tax revenue Tax revenue
15%
10%
5%
0%
1994/95
1996/97
1998/99
1999/00
2000/01
2001/02
2002/03
2003/04
2004/05
2005/06
2006/07
2007/08
1997/98
1995/96
Figure 2.2: Tax and non-tax revenue as a percentage of GDP (1994/95 to 2007/08)
Source: Republic of South Africa (2008). Also see Table 6 in Annex 2.3
Domestic Resource Mobilisation for Poverty Reduction in East Africa: Lessons for Tax Policy and Administration
44
with government’s policy objective to do with equity.
“Tax relief in the 2002/03 - 2003/04 period amounted to
R28.3 billion or 14.6% of PIT collected, while the relief
in the 2004/05 - 2007/08 period amounted to R32.2
billion or 5.9%” (SARS, 2008). Still, PIT revenues did
grow at an average annual rate of 10.8% in the period
from 1994/95 to 2007/08. This increase is partly
attributed to higher levels of employment and
compensation in the economy.
VAT collections grew by an average rate of 13.5%
between 1994/95 and 2007/08. SARS attributes this
growth to an increase in consumer consumption,
higher than expected prices, and increases in fixed
capital formation in certain years (SARS, 2003). Also,
since 2004/05, SARS started to adjust VAT refunds
against other types of tax owed by taxpayers (SARS,
2005).
As earlier observed, despite reduction in top marginal
rates, SARS was able to record a remarkable average
annual growth in CIT revenue collections of 21.5%.
Specifically, CIT revenue grew from 2.4% of GDP in
1994/95 to 6.8% in 2007/08. The largest contributors to
CIT growth were from the financial services, manufactu-
ring, retail and wholesale, and telecommunications
sectors which all recorded strong growth (SARS, 2009b).
Also, the tax policy to widen the CIT base to include
income from foreign sources yielded positive results.
In addition, SARS introduced a range of administrative
reform measures to enforce and promote compliance.
The key ones were:
• Ensuring that provisional CIT payments were more
in line with companies’ latest profit positions as
provided for in legislation;
• Measures to enhance operational efficiencies (e.g.,
audits, debt collection). In particular, SARS
assesses returns with the aid of a risk engine. Any
discrepancies are subject to follow up by the
Compliance Risk Unit. If a discrepancy cannot be
resolved then the return is subject to audit. Investi-
gative audits look into: allegations of intentional
non-compliance; [and] ensure punitive actions are
taken against offenders (SARS, 2008). SARS also
investigates criminal cases, which it hands over to
the criminal justice system (i.e., the National
Prosecution Service, Police and Courts);
• Introduction of an advance tax ruling (ATR) system
in October 2006 to discourage tax avoidance or
aggressive tax planning. The ATR “is intended to
promote clarity, consistency, and certainty in
respect of the interpretation and application of the
tax laws to which it applies”16. Specifically, in an
ATR, SARS sets out its interpretation of tax legisla-
tion in the context of a transaction proposed by the
taxpayer who applied for the ruling; and
• Fostering “better and proactive” relationships with
corporate taxpayers (SARS, 2008) (see discussion
further on).
In addition to the above, other tax policies introduced
since 1994 have also positively contributed to domes-
tic revenue performance. First, the Exchange Control
Amnesty and Amendment of Taxation Laws Act of
2003 achieved its intended purpose. SARS reports that
it received 40,000 applications from South Africans with
unlawful foreign exchange assets and income (SARS,
2004). In his 2005 budget speech, the Minister of
Finance announced that the total value of assets
disclosed was R65 billion. In its 2005/06 budget, the
Government projected it would collect R2.1 billion in
exchange control levies.
Second, the Small Business Tax Amnesty of 2006 was
also a success. SARS launched an extensive media
campaign through ‘imbuzu’ (meetings) and by spon-
soring industrial theatres to encourage small
16 http://www.sars.gov.za/home.asp?pid=4109 [Accessed 10 March 2010].
Domestic Resource Mobilisation for Poverty Reduction in East Africa: Lessons for Tax Policy and Administration
45
businesses to apply for amnesty. “Almost 350,000
applications were received, which included 12% new
registrations” (SARS, 2008). In 2007/8, SARS collec-
ted an additional R12.8 billion as a result of the small
business tax amnesty (SARS, 2009b). In 2007/08, this
additional revenue constituted 2.2% of total tax
collections.
Tax administration performance
benchmarks Performance
efficiency
SARS’s operating costs as a percentage of tax
revenue collections have remained at around the 1%
mark (see Annex 2.3: Table 3), which is comparable to
the collection cost in countries with a tax revenue to
GDP ratio in the same range as South Africa. This ratio
spans from less than 0.6% (USA) to over 1.4% (Japan)
(OECD, 2009a). However, between 1998/99 and
2007/08, operating costs grew at an average annual
rate of around 14.8%. Employee costs (62%), adminis-
trative expenses (20%) and professional and special
services (13%) constituted the bulk of SARS’s
expenditure in 2007/08. Yet it is worth drawing
attention to the fact that the number of tax staff
available for every 1,000 persons in South Africa is 0.30
(see Annex 2.3: Table 4). This ‘tax staff per population
ratio’ is low compared to World and Sub-Saharan
African averages, which are 0.82 and 0.37 respecti-
vely17. This low ratio is partly attributable to the fact that
over two million taxpayers submit their pre-populated
tax returns electronically, thereby demanding fewer
SARS resources to check submissions. It is unlikely
therefore that SARS will vastly increase its staff
numbers - rather the priority is to improve the way in
which the organisation targets high revenue-generating
taxpayers through specialisation.
As alluded to in the previous section, SARS is organi-
sed along functional lines. As part of its delivery
function, in 2004, SARS launched a Large Business
Centre (LBC), with offices in Cape Town, Durban,
Johannesburg and Port Elizabeth. The LBC is currently
organised around industry sectors (e.g., manufacturing,
mining, communications, construction, financial
services). It serves around 22,000 taxpayers – both
entities and high net worth individuals who in aggregate
contribute 80% of CIT revenue. Each taxpayer has an
assigned Tax Relationship Manager. All senior mana-
gers in the LBC have been recruited externally (e.g.,
from large accounting firms and banks), where they
held senior positions.
The World Bank’s 2010 Doing Business survey ranks
South Africa 23rd out of 183 countries in terms of ease
of paying taxes. The tax regime makes it easier for
taxpayers to comply by keeping the number of yearly
payments at a low level. According to the World Bank’s
2010 Paying Taxes Survey, a company is required to
make only nine payments a year, which are far less
than the Sub-Saharan Africa (SSA) and OECD averages
of 37.7 and 12.8 respectively (see Annex 2.3: Table
15). Furthermore, the use of the risk engine to assess
tax returns together with eFiling services have been
instrumental in speeding up the length of time taken by
SARS to make income tax and VAT refunds. In 2006/7,
SARS reported that it was able to process 81% and
83% of income tax and VAT refunds within 30 days and
21 days respectively18 (SARS, 2007). These turnaround
times were maintained in 2007/08.
As part of its administrative reforms (see earlier
discussion), SARS has also been fairly aggressive since
2004/05 in collecting tax debt (see Annex 2.3: Table
10). Specifically, tax arrears as a percentage of total tax
revenue declined from 19.8% in 2002/03 to 10.7% in
2007/08. SARS ascribes this reduction to its debt
equalization practice – in which a taxpayer’s VAT, PAYE
17 http://www.fiscalreform.net/index.php?option=com_wrapper&Itemid=132 [Accessed 2 February 2010].18 The residual refund applications took longer to process as they were identified as ‘outliers’, requiring an audit.

Domestic Resource Mobilisation for Poverty Reduction in East Africa: Lessons for Tax Policy and Administration
46
and income tax refund and debt balances are offset
against each other. SARS also established a collections
centre to chase up tax debts. In addition, where it is
uneconomical to collect, SARS uses the provisions of
Section 91A of the Income Tax Act to write-off or
suspend tax debts (SARS, 2007).
South Africa has a high VAT gross compliance ratio
(VATGCR) of 86.90 in comparison to the world average
of 65.4819 (see Annex 2.3: Table 11). It suggests that
this revenue is collected very efficiently with minimal
exemptions, albeit with some leakages (e.g., arising from
under declarations, fraudulent VAT refunds). Neverthe-
less, a high VATGCR has benefited from increased
enforcement efforts. For example, in 2007/08, SARS, in
collaboration with other government institutions, repor-
ted 228 convictions and 32 successful prosecutions;
and a further 27 cases were referred to criminal investi-
gations.
Measures from the same source of both CIT revenue
productivity (CITPROD) and PIT revenue productivity
(PITPROD) of 0.27 and 0.22 respectively indicate that
South Africa uses the two taxes more efficiently in
generating revenue than World averages of 0.13 and
0.14 for CITPROD and PITPROD respectively – again
due to strong enforcement and other improvements
in the tax system. The preparation of a preliminary
compliance evaluation report in 2007/08 was instru-
mental to the development of SARS’s enforcement
programme. As part of this, SARS launched “specia-
lised campaigns to bring into the tax register’s ambit
entities such as small businesses”. It is also better
able to identify cases for audit (as discussed earlier).
19 http://www.fiscalreform.net/index.php?option=com_wrapper&Itemid=132 [Accessed 2 February 2010].
A0
500.000
1.000.000
1.500.000
2.000.000
2.500.000
3.000.000
3.500.000
4.000.000 Group Annual income (Rand)A : <0B : =0C : 1 - 20.000D : 20.001 - 30.000E : 30.001 - 40.000F : 40.001 - 50.000G : 50.001 - 60.000H : 60.001 - 70.000I : 70.001 - 80.000J : 80.001 - 90.000K : 90.000 - 100.000L : 100.001 - 110.000M : 110.001 - 120.000N : 120.001 - 130.000O : 130.001 - 140.000P : 140.001 - 150.000Q : 150.001 - 200.000R : 200.001 - 300.000S : 300.001 - 400.000T : 400.001 - 500.000U : 500.001 - 750.000V : 750.001 - 1.000.000W : 1.000.001 - 2.000.000X : 2.000.001 - 5.000.000Y : 5.000.001 +
B C D E F
Taxpapyer group
Tax
asse
ssed
(Ran
d)
G H I J K L M N O P Q R S T U V W X Y
Figure 2.3: Average PIT assessed by taxpayer income group (2006)
Source: Republic of South Africa (2008)

Domestic Resource Mobilisation for Poverty Reduction in East Africa: Lessons for Tax Policy and Administration
47
Furthermore, “improvements in service and outreach
to large corporations have generated a strong culture
of tax compliance” (Fan et al, 2007).
Allocative efficiency
South Africa’s equivalent to the export and special
processing zones in East Africa is the industrial de-
velopment zone (IDZ). The government offers various
customs and VAT incentives to firms operating in
IDZs, such as: duty and VAT suspension on imported
goods for manufacturing or storage; zero rating of
VAT on local inputs; and various trade facilitation
services20. However, any duty and tax waivers are
only offered within a customs controlled area (CCA).
When manufactured goods are exported they are not
subject to tax. But should goods enter the domestic
market, they are subject to tax as they are deemed to
be imports. Therefore, IDZs have no real tax expen-
diture implications and as such, are more allocatively
efficient than their equivalents in EAC countries.
Performance equity
Figure 2.3 presents the average PIT liability in 2006,
by each taxpayer group. It suggests that the regime is
progressive, with low income earners (groups A to I)
who constitute about 38% of total taxpayers, each
paying taxes ranging from an average of Rand 0 to
Rand 6,952 (around US$ 0 to US$ 964). In contrast,
high income earners (groups S to Y) constitute 7% of
total taxpayers, and each pay taxes ranging from an
average of Rand 95,014 to Rand 3.4 million (approxi-
mately US$ 13,200 to US$ 470,000) or between 27%
and 68% of total income tax respectively.
Under South Africa’s PIT regime, low income taxpayers
retain around 47% more income after taxes, making it
“one of the most progressive tax systems in the world”
(Lieberman, 2003). Furthermore, the Government
regularly revises tax brackets (see Annex 2.3: Table 13).
For example, between 2002/03 and 2008/09, it
increased the tax brackets for the lowest and highest
income earners by 205% and 104% respectively. In the
process, some lower income earners dropped out of
the tax net, because of the upward shift in tax brackets,
which will prolong their graduation to a higher category.
Yet, if one analyses the tax burden for CIT, large
taxpayers contribute almost 80% of this revenue source
(SARS, 2009b). Furthermore, key informants indicate
that the top 50 and 200 large taxpayers pay 30% and
80% of CIT revenues respectively. However, the ‘total
tax rate’ as a percentage of profit of 30.2% is more than
half and significantly lower than the SSA and OECD
averages of 67.5% and 44.5% respectively21 (see
Annex 2.3: Table 16).
A few studies on the equity of VAT in South Africa
suggest that to a minor degree it is regressive. In
particular, a study by Fourie and Owen (1993) suggests
that the VAT in South Africa is ‘mildly regressive’ even
though legislation provides for exemptions or zero
rated items (e.g., on basic foods and paraffin) utilised
by poor households (Go et al, 2004). Also, a subse-
quent study by Go et al (2004) concludes that the
“presence of a VAT in the South African tax system
impacts negatively on the welfare of low-income
households” with high and low income groups
spending less than 4% and more the 5% of their
incomes respectively. “Removing the VAT on food and
increasing the base rate on other goods to 16.4% so
as to keep VAT revenue constant transforms” it into a
progressive tax system (Gillingham, 2008).
Another indicator of the tax burden has to do with the
amount of time taken by taxpayers to comply with the
major types of taxes. In this regard, the 2010 World
Bank paying taxes survey indicates that South African
20 http://www.sars.gov.za/home.asp?pid=44747 [Accessed 22 June 2010].21 http://www.doingbusiness.org/ExploreEconomies/?economyid=172#PayingTaxes [Accessed 10 March 2010].

Domestic Resource Mobilisation for Poverty Reduction in East Africa: Lessons for Tax Policy and Administration
48
companies spend 200 hours a year on this task, as
opposed to 350 hours in 200822. This figure compares
favourably with the OCED average of 194.1 hours.
Performance effectiveness
According to IMF computations, there was no tax gap
in South Africa in 2005 – it was -0.4% (see Annex 2.3:
Table 18). Furthermore, the tax effort was 101.4%.
However, the results of SARS’s enforcement initiatives
suggest that a tax gap exists. On one hand, key
informants to this case study indicated the tax gap may
range between Rand25 billion and Rand35 billion (or
4.4% of 2007/08 revenue). On the other, the Commis-
sioner of SARS is recently quoted to have said that a
definitive amount is not available – "We have to be
certain that we can depend on a figure and explain it
before we release any percentage" (Temkin, 2010a).
Still, relative to the EAC countries, South Africa has a
substantially lower tax gap and higher tax effort.
At an operational level, SARS seeks to improve its
effectiveness by soliciting feedback on its performance
from various sources as a basis for informing the autho-
rity on its strengths and areas for improvement. Each
year, it engages big businesses from up to five industries
on tax trends, policies, and administration in South Africa
vis-à-vis the rest of the world. It has in recent times also
started to dialogue with public sector institutions
(primarily parastatals and local governments) focusing on
compliance trends. These interventions also both directly
and indirectly aim to promote tax morality, and
discourage aggressive tax planning.
In 2009, SARS and the Banking Association signed the
South African Banking Accord, setting out a framework
for cooperation, which, for instance, aims to ensure that:
SARS provides the industry with quality services; there
are high levels of compliance by banks; and impermissi-
ble tax avoidance is prevented. As part of the accord,
both parties have established ‘A Banking - SARS
Operational Forum’ comprising senior executives from
the authority and association, which will meet every six
months to discuss tax compliance, administrative and
legislative issues. The Commissioner of SARS is also
expected to meet the Banking Association’s Board at
least once a year (OECD, 2009b). The signing of the
accord is a major scoop for SARS in that very few
countries in the world have such an arrangement. And
yet, the financial services sector tends to have many
complex transactions. The sector can also be the source
of extremely useful third party information.
In addition, SARS commissions independent surveys
on the effectiveness of its services on an annual basis.
In 2005/06, SARS reported that: it achieved a year-on-
year reduction in the number of complaints of 14%; and
a customer satisfaction index rating of 93% (SARS,
2006). Also, in its 2006/07 annual report, SARS high-
lights “widespread public approval of SARS as revealed
by market research; [and] a high rating in ‘best
government department’ newspaper surveys” (SARS,
2007). In 2007/08, it focused on obtaining feedback
from taxpayers on the services provided by the LBC.
Summary of overall trends
On the basic parameter of tax revenue to GDP ratio, the
tax system in South Africa has consistently
improved performance since the onset of the reforms
that followed the end of the apartheid era (see Figure
2.2). The wide breadth and depth of policy, institutional
and administrative changes were informed by the analy-
tical, policy and strategic development work of the Katz
Commission, which existed parallel to both the mains-
tream government policy organs and tax administration
systems for a period of five years, 1994-1999.
One instructive facet of the Katz Commission was the
phasing of its recommendations, which were delivered
in nine separate packages (reports) over the five-year
period. In this sense, the Commission set the strategy
22 Ibid.
Domestic Resource Mobilisation for Poverty Reduction in East Africa: Lessons for Tax Policy and Administration
49
and pace for the sequencing of reforms in the early
years of their implementation. Thus, for example, the
establishment of SARS in 1996-1997 was in line with
the early recommendations of the Commission.
Thereafter, the sequencing of the reforms was ancho-
red in successive strategic plans of SARS.
Yet another unique feature of the reforms that reflect the
comprehensiveness and rigor of the Katz Commission
work was the depth of policy development. An example
of the latter was the successful introduction of the policy
to levy tax on income earned on a world-wide basis. This
policy, introduced in 2000, has yet to find a place in, for
instance, many SSA countries – possibly because it is
administratively challenging.
Impressive and sustained improvements in the
efficiency and effectiveness of SARS since its esta-
blishment, has, of course, been crucial to achieving the
overall high growth rate in tax revenue (an annual
average rate of about 13.3% in the 1995-2008 period).
SARS has been particularly successful in building and
applying systems and capacity for enforcements as well
as encouraging compliance. In more recent years,
aggressive and smart utilisation of ICT applications has
been the bedrock of the reforms.

Domestic Resource Mobilisation for Poverty Reduction in East Africa: Lessons for Tax Policy and Administration
50
Challenges and issues
Box 2.1: Rationale for restructuring the LBC
There are several issues that call for the reorganisation of the LBC. First, the case for being organised around
industry sectors (which was influenced by arrangements in the UK) is, with hindsight and experience, not entirely
suitable for South Africa. There is therefore a proposal that in future the LBC operates along functional lines (in the same
way that firms such as PwC operate). However, the LBC is likely to maintain some industries specialising in
mining and financial services as these two sectors have specific tax rules.
Second, there is a view that too many criteria are currently used to select taxpayers for the LBC. For instance, a
taxpayer is eligible to receive LBC services if : it is a listed entity or a parastatal or financial services or mining or
multinational institution; or has a turnover of over R250 million, or an annual income of more than R7 million, or assets
worth more than R75 million for individuals. Therefore, SARS, on the basis of country comparisons, is considering
revising the eligibility criteria to: groups with a combined turnover of more than R1 billion; and entities which are
considered risky (e.g., multi-nationals, financial services and mining institutions). If SARS adopts this new measure,
around 10,000 taxpayers will be transferred from the LBC, possibly to a medium-sized taxpayer grouping.
There are also discussions as to whether high net worth individuals should continue to be served by the LBC or
be moved into the ‘complex individuals’ segment. Many high net worth individuals in South Africa have international
investments, which are currently dealt with by the LBC only as their tax implications require specialised skills. If these
individuals are shifted, then the LBC would need to sign service level agreements with other units in SARS. However,
SARS is aware that a similar change in the USA was subsequently reversed.
Source: Key informant interviews
SARS is respected by many revenue administrations
in Africa and beyond. It is particularly strong because
of its ability as an organisation to: be introspective,
reflective, plan next steps and take action. As SARS
charts its way to becoming a world class services
provider, in our considered view, it grapples with a
few key medium- to long-term challenges and
issues. In addition, there are some challenges with
policy implications or which require involvement of
other public sector institutions. These challenges and
issues are elaborated in the remainder of this
section.
DRM efforts must be stepped
up to finance national
development strategies
When he presented South Africa’s Medium Term Bud-
get Policy Statement (MTBPS) for 2010/11 to 2012/13,
Minister Gordhan acknowledged that Government has
“made much progress since the advent of democracy,
yet much more remains to be done” particularly with
respect to job creation, provision of services in educa-

Domestic Resource Mobilisation for Poverty Reduction in East Africa: Lessons for Tax Policy and Administration
51
tion and health, rural development, and combating
corruption and crime (National Treasury, 2009). To these
ends, it is imperative for the Government to mobilise
greater levels of resources to address its development
priorities.
Government has indicated that it will borrow resources
as a short-term measure while the economy recovers,
and as tax revenue collections rise. By 2012/13, it
expects to reduce the fiscal deficit from its current level
of 7.6% to 4.2%. This expected reduction implies that
SARS must raise gross tax revenue as a percentage of
GDP from its projected level in 2009/10 of 24.5% to
26.2% by 2012/13.
A different approach for dealing
with taxpayer segments
is needed
The MTBPS anticipates that SARS will sustain the tax
compliance culture that it has cultivated over the
years. SARS management recognises it cannot
achieve this objective without rationalising the way in
which the authority utilises its human resources. Most
SARS staff serve middle-level taxpayers who form the
bulk of its clientele but contribute much less revenue
than large businesses and high net worth individuals.
In order to perform better with the same resources,
modernising SARS’s systems to minimise processing
effort, coupled with ensuring that staff dealing with
large taxpayers become increasingly specialised will
be critical.
There is also an ongoing review of segmentation
arrangements. Specifically, SARS has assessed that it
does not have sufficient capacity to run them all. The
LBC is already undergoing restructuring (see Box 2.1).
The restructuring of other segments will build on existing
infrastructure. However, it will be important to bear in
mind the different risks associated with each segment
(e.g., keeping practitioners honest and ensuring that any
exceptions arising with respect to small businesses are
dealt with at contact).
SARS must continue to widen
its tax base for the foreseeable
future
In addition to the above, SARS is challenged to bring
into the tax net both new taxpayers evolving as a
result of economic growth, and actors operating in the
informal economy. With respect to the latter group,
Friedman (2003), contends that SARS has not been
successful in assessing “the ideologies, and institu-
tions which underpin informal activity”, and thereafter
devise interventions which could be used to enhance
compliance. However, in recent years, it has attemp-
ted to engage both groups through education and
outreach initiatives, such as the small business
amnesty, which was an enormous success. Still, in the
medium-term, SARS is challenged to reduce the tax
gap by:
• Further expanding its outreach through ‘walka-
bouts’ to establish unknown economic activities,
which are outside the tax net;
• Assessing how SARS can expand its footprint into
areas where there are no branches. For example,
according to key informants, Soweto has one
branch but should probably have five. Such a
expansion would offer SARS the opportunity to
educate small businesses but may not be
economically viable in the short-term;
• Increasing the number of lifestyle audits. A SARS
spokesperson recently indicated to the press that
“a lifestyle questionnaire is used to obtain infor-

Domestic Resource Mobilisation for Poverty Reduction in East Africa: Lessons for Tax Policy and Administration
52
23 http://corruptionwatchdog.blogspot.com/ [Accessed 12 March 2010].
mation about the lifestyle of an identified taxpayer”
(Temkin, 2010b). In the same article, a tax
practitioner described what lifestyle audits entail:
“SARS may obtain information about nondisclosure of
taxable income from various sources, for instance, a
disgruntled employee, a recently divorced spouse or
media reports that raise suspicion about a taxpayer…”
SARS’s staff capacity must keep
abreast with its transformation
SARS is aware that whilst it has made great strides in
enhancing staff capacity, more needs to be done to
strengthen skills. The leadership management training
initiative (see discussion earlier) needs to be rolled out
across the organisation. It must also deepen it staff’s
business and technical skills, ensuring that they are
aligned with the new operating model. In this regard,
for example, one of the priority areas of action in
2009/10 was the development and launch of a
customs core skills training programme (SARS, 2009a).
SARS was also looking at options for recruiting and
retaining staff in critical areas with gaps, such as enfor-
cement, customs, strategy and analysis.
There may be trade-offs
between administering tax
and non-tax revenues
In addition to administering taxes, SARS currently collects
UIF contributions and SDLs on an agency basis. It has also
undertaken to support the implementation of govern-
ment’s social security and wage subsidy interventions from
2010. According to the Minister of Finance’s 2010/11
budget speech, the government is considering offering “a
cash reimbursement to employers for a two-year period,
operating through the SARS payroll tax platform”. Whilst
there is clearly advantage in using SARS’s infrastructure
and intelligence on compliant taxpayers, this initiative is
likely to place an additional burden on the authority.
The increased cases of crime
and corruption need to be kept
in check
The composition of the tax gap includes revenue for-
gone as a result of criminal and corrupt activities. On
this matter, SARS reports an increase in syndicated
crime, particularly in the areas of fraud and corruption.
It is also alleged that corrupt officers employed by the
Companies and Intellectual Property Registration Office
may have been part of a syndicate, which registered
non-existent companies with the intention of defrauding
SARS of VAT revenue23. In addition, key informants
indicated to us that syndicated crime has extended to
the banking system – specifically by using bank
accounts and cheques to defraud SARS.
There are challenges around
regional trade integration
The SACU arrangement has been in place since 1910
when the Republic of South Africa was formed. South
Africa and the BLNS countries, which form SACU, have
agreed fixed common external tariffs (CETs). The formula
for sharing customs receipts is as follows: the customs
duty pool is shared on the basis of intra-SACU imports;
and the excise duty pool is split two ways – 85% on the
basis of GDP, and the remaining 15% on developmental
indicators (e.g., life expectancy and literacy). Edwards et
al (2009) argue that current revenue sharing arrange-
ments could encourage countries to overstate SACU
intra-trade statistics. Furthermore, the same authors
consider that “the formula has perpetuated a depen-
Domestic Resource Mobilisation for Poverty Reduction in East Africa: Lessons for Tax Policy and Administration
53
dency on customs revenue as a source of government
revenue in many BLNS economies”.
There is ongoing dialogue around expanding this
customs union arrangement to the 14 SADC
countries, which are all signatories to a free trade
agreement. However, there are issues around rules of
origin, leading to a lot of paperwork. Also, Edwards et
al (2009) suggest that some BLNS countries may be
unwilling to further reduce CETs and/or admit new
members to a customs union as these measures
would imply a reduction in customs revenue. South
Africa is challenged to lead in addressing these
issues.

Domestic Resource Mobilisation for Poverty Reduction in East Africa: Lessons for Tax Policy and Administration
54
Lessons learned
There are considerable lessons to be learned from
South Africa’s experience around the trends in the tax
system, Siyakha, revenue performance and even the
challenges it faces going forward. However, in this
section we have selected what we consider to be the
six most profound lessons to be considered for inclu-
sion in the EAC policy note.
The strong collaboration
between SARS and the National
Treasury has been instrumental
to revenue mobilisation
SARS and the National Treasury collaborate effectively
at several levels. Since 2009, the Treasury, in partner-
ship with SARS, has initiated the production of very
comprehensive tax statistics. SARS also participates in
a committee chaired by the Treasury, which sets
revenue targets. There is even closer collaboration on a
daily basis. SARS advises the Treasury on a daily basis
of any likely changes to cash collections. If there is a
collection shortfall, this notification allows the Treasury
to borrow funds on a short-term basis to finance
public expenditure.
By all accounts, the National Treasury seems in
constant touch with SARS’s plans, operations and per-
formance. A close working relationship is evident in an-
nual reports and strategic plans produced by SARS,
which contain insightful messages from the Minister of
Finance, that, for example, reinforce the linkage bet-
ween government’s development agenda and revenue
performance. In the Minister’s budget speeches, there
is always mention of the results and impact of SARS’s
administrative reforms. It is also laudable that on the
first day following the fiscal year end (31 March), as a re-
sult of excellent planning and coordination as well as
unyielding commitment, SARS staff are able to provide
the Minister with preliminary revenue results for the year
that has just ended. The Minister announces the results
to the press on the same day.
Solid policy formulation and
evaluation capacity is also key
to strong revenue performance
The Government of South Africa has strong tax policy
capacity within SARS and the National Treasury. Until
three or so years ago, SARS was extensively involved
in tax policy development and drafting of legislation.
Since then, the National Treasury has developed its
own capacity in this area. Nevertheless, in recognition
of its expertise, the Treasury welcomes SARS’s views
on the: extent of fit of new tax policy proposals with the
prevailing tax structure, and implications of trade
policies and agreements for customs. Key informants
indicate that when the two institutions deliberate on tax
policy proposals, there is a ‘healthy tension’.
It appears that the arrangements above have borne
fruit. Government’s post-liberation tax policies have
achieved their intended aims. Furthermore, the go-
vernment has not buckled at any time to reverse any
tax policies in the face of resistance from strong lobby
groups. Rather, it has been accommodating of natio-
nal and global economic developments. Thus, for
example, the small business amnesty had been exten-
ded to April 2010, and the Mining Royalties Act of 2008
will not be enforced until 2010/11.
Domestic Resource Mobilisation for Poverty Reduction in East Africa: Lessons for Tax Policy and Administration
55
Compacts with professional
and industry groups can
reinforce compliance
and facilitate administrative
efficiency and effectiveness
SARS has entered into a unique accord with the banks
in South Africa. Under the accord, it has committed to
provide quality services to the banks, and in turn the
banks have committed to promoting tax compliance,
and in particular, discourage tax avoidance among their
customers. This kind of compact can definitely be
extended to other industries and professional groups.
The results of SARS’s initiative should be closely
watched for possible replication by other ARAs.
Minimising the level
of exemptions ensures
tax policies remain neutral
The government grants tax exemptions on an extre-
mely exceptional basis. Only a few public benefit and
public sector organisations are eligible for exemptions,
and these are legislated and not discretionary. Also tax
incentives offered in IDZs are designed to have limited
implications for tax expenditure (see earlier discussion).
Modernising through the use
of ICT can result in significant
operational efficiencies but
must be applied judiciously
This paper has highlighted SARS’s accomplishments
in the application of ICT. In particular, SARS has used
ICT to simplify its operating environment and enhance
business intelligence (e.g., through the use of third party
information and risk engines), enabling it to reduce
transaction and compliance costs, and focus more on
high risk taxpayer segments. Yet, there are some dis-
cernable lessons of experience for other revenue au-
thorities embarking on the modernisation journey as
follows:
• It is invaluable to have a ‘single view of the tax-
payer’, and therefore, integrating core tax systems
is critical – this practice was not observed by SARS
at inception, but measures are underway towards
this goal. Integrated systems also assist in enhan-
cing data quality;

• Systems usage by eFilers is not even throughout
the year. It peaks towards the end of the filing
season. This uneven usage can have significant
cost implications. In this regard, SARS is consi-
dering offering taxpayers discounts for filing within
prescribed periods – as in the UK;
• The tax environment is complex and therefore
change must be gradual. Table 17 in Annex 2.3
shows the number of registered CIT, PIT and VAT
taxpayers. In addition, customs deals with an
even higher volume of transactions. For example,
SARS indicates that in a year there are: 1.7 million
import transactions; 1.8 million SACU move-
ments; almost 1 million export transactions; and
14 million passengers passing through customs;
• Systems need to be kept secure on an ongoing
basis. In this respect, SARS is continuously
strengthening its security. It is subject to two phi-
shing attempts a week. This statistic should not
come as a surprise considering the magnitude of
SARS’s revenue collections, and the fact that the
bulk of taxpayer payments are effected electroni-
cally;
• Once systems are fully functional, maximising the
use of information generated is critical. In this res-
pect, SARS works on using the information avai-
lable from its modern ICT systems more effectively
by continuously questioning what it should be
measuring. This quest is expected to drive up re-
venue collection;
• There is need to accommodate taxpayers who,
for whatever reasons, cannot access electronic
services. It should be kept in mind that very few
Africans have access to Internet, and hence use
of ICT must be applied judiciously in tax adminis-
tration.
Good client service is critical forpromoting voluntary compliance
One key informant aptly described SARS’s overall
strategy around services delivery as to ensure that
‘people pay taxes with a smile’. SARS’s approach has
therefore been to resist intimidating taxpayers. Instead,
considerable effort has gone into enhancing its three
product offerings – call centres, walk-in centres and eFi-
ling. In addition, as part of its taxpayer education (TPE)
service, SARS puts in a lot of effort during the filing sea-
son in assisting taxpayers to complete their tax returns.
According to key informants that we interviewed, in
2009, SARS served up to 56,000 taxpayers a day. This
latter part of SARS’s TPE service offering is unique on
the African continent. And so is TPE’s:
• Points of service intervention for which SARS
employs a two-pronged approach. First, SARS
partners with shopping malls who provide space
and internet access to enable it to provide services
t o
individual taxpayers. Second, SARS provides the
same service in collaboration with other govern-
ment departments via ‘Thusong’ (one-stop) cen-
tres;
• Outreach service. TPE vets applications for VAT
registration by physically inspecting applicants’
places of business. It passes suspect cases to the
enforcement and compliance risk unit for further
investigation.
A policy of zero tolerance tocorruption is an important deterrent
On 1 April 2007, SARS established an Anti-Corruption
and Security (ACAS) Unit. Its mandate is to detect and
investigate: taxpayers who are registered but do not
make full or submit fraudulent declarations; and
Domestic Resource Mobilisation for Poverty Reduction in East Africa: Lessons for Tax Policy and Administration
56

employees who steal from taxpayers. The Unit’s work
is informed by SARS’s risk engine, which provides
information on taxpayers: who are generally compliant
(and therefore low risk); and those who are non
compliant (and therefore high risk).
The ACAS has developed a model to support its
efforts to curb corruption and ensure security covering:
prevention; detection; and investigation. It is worth
noting that as part of its:
• Prevention intervention, the unit has developed stan-
dards to safeguard physical and information access.
Furthermore, all SARS personnel must be vetted prior
to their confirmation of employment, and are also re-
quired to declare their interests on an annual basis;
• Detection activities, the unit works closely with the
police, banks, and the intelligence service. The unit
maintains a register of incidences, which list the
type of crime and whether it is limited, medium or
serious;
• Investigation activities, the unit pre-investigates
each reported incidence to establish its validity. If
an allegation is valid, the unit fully investigates the
case, which could result in a staff dismissal and/or
the criminal prosecution of a taxpayer/staff. SARS
employs prosecutors who compile case evidence
for submission to the National Prosecution Service
and South African Police. SARS also makes every
effort to recover lost revenue.
The work of the unit is also informed by research and
analysis activities, which pinpoint: the most prevalent
crimes; and thematic/systemic problem areas to
address. As syndicated operations continue to become
more complex with time, SARS also uses the results of
research and analysis to fine-tune its policies,
procedures and systems.
Domestic Resource Mobilisation for Poverty Reduction in East Africa: Lessons for Tax Policy and Administration
57

Domestic Resource Mobilisation for Poverty Reduction in East Africa: Lessons for Tax Policy and Administration
59
Annex 2.1: Key informants
Aidan Keanly (Mr), South African Revenue Service
Alfred Cuevas (Mr) – Senior Resident Representative, International Monetary Fund
Andrew Fisher (Mr), Group Executive – Segmentation, South African Revenue Service
Brandley Ngcobo (Mr), Senior Manager Capacity Development, South African Revenue Service
Clifford Collings (Mr), Head of Anti-Corruption and Security, South African Revenue Service
Deprose Muchena (Mr), Economic Justice Programme Manager, Open Society Initiative for Southern Africa
Erich Kieck (Mr), Group Executive - Customs Policy and Strategy, South African Revenue Service
Frank Strake (Mr), Manager - Taxpayer Services (Services), South African Revenue Service
Franz Tomasek (Mr), Group Executive, Legal Research and Development, South African Revenue Service
Godfrey Modise (Mr), Manager - Taxpayer Services (Services), South African Revenue Service
Hannelie Schoeman (Ms), Remuneration (Human Resources), South African Revenue Service
Hope Selana (Ms), Self-employed
John Roberts (Captain), Marine Superintendent/Barge Move Master
Joseph Rock (Mr), Group Executive: Large Business Centre, Technical Enablement, South African Revenue Service
Keith Brebnor (Mr), Chief Executive Officer, Chamber of Commerce and Industry – Johannesburg
Lionel Schoeman (Mr), Project Management Office (IDZs), South African Revenue Service
Logan Wort (Mr), Group Executive – Reputation Management, South African Revenue Service
Mike Jarvis (Mr), Head of Architecture Division – Modernisation and Technology, South African Revenue Service
Nancy Dubosse (Dr), Head of Research – Economic Governance Programme, Idasa
Randall Carolissen (Dr), Group Executive: Revenue Analysis, Planning and Reporting, South African Revenue Service
Saki Macozoma (Mr), Chairman, Business Leadership South Africa
Sandeep Mahajan (Mr), Lead Economist and Cluster Leader – Poverty Reduction and Economic Management, World
Bank
Sekgobela Mi Conty (Mr), Employee in the service sector
Sobantu Ndlangalavu (Mr), Manager – Taxpayer Services (Education), South African Revenue Service
Varsha Singh (Ms), Senior Manager International Relations, South African Revenue Service
Victor Masola (Mr), Executive - Enforcement Legal (Enforcement), South African Revenue Service
Yotam Longwe (Mr), Divisional Executive: International Finance Cluster, Development Bank of South Africa

Domestic Resource Mobilisation for Poverty Reduction in East Africa: Lessons for Tax Policy and Administration
60
Annex 2.2: Bibliography
Africa Peer Review Mechanism (2007); Country Review Report of the Republic of South Africa. APRM, 2007.
Report no. 5.
Ajam, T. and Aron, J. (2009); Transforming Fiscal Governance. In J. Aron, B. Kahn and G. Kingdon (eds) South
African Economic Policy under Democracy Oxford: New York, pp. 92-117.
Aron, J. and Muellbauer, J. (2000); Personal and Corporate Saving In South Africa, World Bank Economic Review,
14(3):509-544.
Bolnik, B. (2004); Effectiveness and Economic Impact of Tax Incentives in the SADC Region, Technical report submitted
to USAID contract no. PCE-1-00-98-0016-00.
Brautigam, D.A. (2008); Introduction: Taxation and State Building in Developing Countries. In D.A Brautigam., O-H.
Fjeldstad and M. Moore (eds) Taxation and State Building in Developing Countries Cambridge University
Press: Cambridge, pp. 1-33.
Christensen, J. (2009); Africa’s Bane: Tax Havens, Capital Flight and the Corruption Interface Elcano Royal Institute,
2009. Working paper no 1/2009.
Coolidge, J. and Ilic,D. (2009); Tax Compliance Perceptions and Formalization of Small Businesses in South Africa.
World Bank, 2009. Working Paper no. 4992.
Du Plessis, S. and Smit, B. (2007); South Africa’s Growth Revival After 1994 Journal of African Economies 16(5):
668-704.
Economist Intelligence Unit (EIU) (2008); E-readiness rankings 2008: maintaining momentum. Online EIU [Available:
a330.g.akamai.net/…/graphics.eiu.com/upload/ibm_ereadiness_2008.pdf Accessed 30 April 2009].
Edwards, L., Cassim, R., van Seventer, D. (2009); Trade Policy in South Africa. In J. Aron, B. Kahn and G. Kingdon
(eds) South African Economic Policy under Democracy Oxford: New York, pp. 151-181.
Fan, Q., Reis, J.G., Jarvis, M., Beath, A. Frauscher, K. (2007); The Investment Climate in Brazil, India and South
Africa: A Comparison of Approaches for Sustaining Economic Growth in Emerging Economies World Bank:
Washington.
Faulkner, D. and Loewald, C. (2008); Policy Change and Economic Growth: A Case Study of South Africa. AusAID,
DFID, Hewlett Foundation, SIDA and World Bank, 2008. Working Paper np.41.
FIAS (2007); South Africa: Tax Compliance Burden for Small Businesses: A Survey of Practitioners. FIAS, 2007.
Financial and Fiscal Commission (2004); Annual Report 2003-2004. FFC, 2004.
Fjeldstad, O. and Moore, M. (2008); Revenue Authorities and State Capacity in Anglophone Africa. Chr. Michelsen
Institute, 2008. WP 2008:1.
Fox (2009); Research Report on the Survey of Tax Season 2008 for Individual Taxpayers and Employees. Fox, 2009.
Friedman, S. (2003); Sending them a Message: Culture, Tax Collection and Governance in South Africa Policy: Issues
and Actors 16(3).
Gillingham, R. (2008); Poverty and Social Impact Analysis by the IMF: Review of Methodology and Selected Evidence
IMF: Washington.
Go, D.S., Kearney, M., Robinson, S., Thierfelder, K. (2004); An Analysis of South Africa’s Value Added Tax.
Gordhan, P. (2010); Budget Speech 2010. Tabled to Parliament Cape Town: National Treasury, 1-28.
Hickey, A. and van Zyl, A. (2002); 200s South African Budget Guide and Dictionary Idasa: Cape Town, 1st edtn.
Domestic Resource Mobilisation for Poverty Reduction in East Africa: Lessons for Tax Policy and Administration
61
Horton, M. (2005); Role of Fiscal Policy in Stabilization and Poverty Alleviation. In M. Nowak and L.A. Ricci (eds) Post
Apartheid South Africa: The First Ten Years International Monetary Fund: Washington, pp. 1 – 10.
Hviding, K. (2005); Liberalizing Trade and Capital Transactions: An Overview. In M. Nowak and L.A. Ricci (eds) Post
Apartheid South Africa: The First Ten Years International Monetary Fund: Washington, pp. 133 – 141.
IMF (1998); South Africa: Selected Issues. IMF,1998. Report no. 99/96.
IMF (2009a); South Africa: 2009 Article IV Consultation—Staff Report. IMF, 2009. Report no. 09/273.
IMF (2009b); Some Observations on Domestic Revenue Mobilization. Presentation made during IMF Staff Visit to
Rwanda, Oct-November 2009.
Jenkins, G.P. (1995); An Autonomous Revenue Authority for South Africa. Paper prepared for the International Tax
Program Harvard, USA, 27/04/95.
Leibbrandt, M., Woolard, I., Finn, A., Argent, J. (2010); Trends in South African Income Distribution and Poverty
since the Fall of Apartheid. OECD Social, Employment and Migration Working Papers, No. 101.
Leibbrandt, M., Woolard, I., Woolard, C. (2009); A Long-run Perspective on Contemporary Poverty and Inequality
Dynamics In J. Aron, B. Kahn and G. Kingdon (eds) South African Economic Policy under Democracy
Oxford: New York, pp. 270-299.
Lieberman, E.S. (2003); Race and Regionalism in the Politics of Taxation in Brazil and South Africa Cambridge
University Press: Cambridge, 1st edtn.
Lowenberg, A.D. and Kaempfer, W.H. (1998); The Origins and Demise of South African Apartheid: A Public Choice
Analysis University of Michigan Press: Michigan.
Manuel, T.A. (2002); The South African Tax Reform Experience. Address by the Honourable Trevor A Manuel, MO,
Minister of Finance at Annual Conference of the International Bar Association South Africa, 24/10/02.
Marcus, G., Ketley, R., Hennie, B., Short, R., Mogapi, S., Smith, A. (2005); Public Financial Management Reform:
A Case Study of South Africa, 1994 to 2004. Genesis Analytics, 2005.
Mathews, C. (2010); Industrial Development Zones Continue to Attract Investors Business Day 18/02/2010, p.4
National Treasury (2009); Medium Term Budget Policy Statement National Treasury 27/1009, p.1-80.
National Treasury (2010); Budget Review 2010. National Treasury South Africa, 2010. RP:04/10.
Ndulu, B.J., Chakraborti, L., Lijane, L., Ramachandran, V., Wolgin, J. (2007); Challenges of African Growth:
Opportunities, Constraints, and Strategic Directions IBRD/World Bank: Washington, 1st edtn.
Nowak, M. (2005); The First Ten Years After Apartheid: An Overview of the South African Economy. In M. Nowak and
L.A. Ricci (eds) Post Apartheid South Africa: The First Ten Years International Monetary Fund: Washington,
pp. 1 – 10.
OECD (2009a); Tax Administration in OECD and Selected Non-OECD Countries: Comparative Information Series
(2008). Forum on Tax Administration, 2009.
OECD (2009b); Building Transparent Tax Compliance by Banks. OECD, 2009.
PricewaterhouseCoopers (2007); Guide to the Small Business Tax Amnesty. PwC, 2007.
Republic of South Africa (1996); Growth Employment And Redistribution: A Macro-Economic Strategy [Online]
Republic of South Africa. Available: http://www.treasury.gov.za/publications/other/gear/default.aspx
[Accessed 1 February 2010].
Domestic Resource Mobilisation for Poverty Reduction in East Africa: Lessons for Tax Policy and Administration
62
Republic of South Africa (2008); 2008 Tax Statistics, A joint publication between National Treasury and the South
African Revenue Service.
Republic of South Africa (2009); Government’s Programme of Action 2009. Republic of South Africa, 2009.
Smith, L. 2003. The Power of Politics: The Performance of the South African Revenue Service and some of
its implications Policy: Issues and Actors, 16(2):4-17.
South African Revenue Service (1999); Annual Report 1998/99. SARS, 1999.
South African Revenue Service (2000); Annual Report 1999/00. SARS, 2000.
South African Revenue Service (2001); Annual Report and Financial Statements 2000/01. SARS, 2001.
South African Revenue Service (2002); Annual Report and Financial Statements 2001/02. SARS, 2002.
South African Revenue Service (2003); Annual Report 2002/03. SARS, 2003.
South African Revenue Service (2004); Annual Report 2003/04. SARS, 2004.
South African Revenue Service (2005); Annual Report 2004/05. SARS, 2005.
South African Revenue Service (2006); Annual Report 2005/06. SARS, 2006.
South African Revenue Service (2007); Annual Report 2006/07. SARS, 2007.
South African Revenue Service (2007b); Customs Green Paper. SARS, 2007.
South African Revenue Service (2008); Annual Report 2007/08. SARS, 2008.
South African Revenue Service (2009a); Strategic Plan 2009-2012: Update for 2009-2010. SARS, 2009.
South African Revenue Service (2009b); Annual Report 2008/9. SARS, 2009. Report no. 205/2007.
South African Revenue Service (2009c); Tax Guide for Micro Businesses 2009/10. SARS, 2009.
Stotsky, J.G. and WoldeMariam, A. (1997); Tax Effort in Sub-Saharan Africa. IMF, 1997. WP/97/107.
Tanzi,V. and Zee, H. (2001); Tax Policy for Developing Countries Economic Issues 27.
Temkin, S. (2010a); Information the Currency of Tax Collection Business Day 28/04/10, [online].
Temkin, S. (2010b); Long Arm of the SARS Lifestyle Audit Business Day 01/03/10, [online].
The Economist (2006); Chasing the Rainbow: A Survey of South Africa The Economist 08/04/2006, p.1-10
The Economist (2010a); Corruption in South Africa: Stop that Virus The Economist 06/02/2010, p.41.
The Economist (2010b); South Africa’s Economy: Steady As She Goes The Economist 27/02/10, p.41.
The World Bank Group and DFID (2008); The Political Economy of Taxation in Developing Countries: Challenges to
Practitioners. The World Bank Group and DFID, 2008.
Tuiranskyi, Y. (2010); Off Track? Findings from South Africa’s First APRM Implementation ReportI. South African
Institute of International Affairs, 2010. Paper no. 53.
USAID (2008); Formal SMME Tax Compliance Survey Report. USAID, 2008 - Prepared for National Treasury Republic
of South Africa.

Domestic Resource Mobilisation for Poverty Reduction in East Africa: Lessons for Tax Policy and Administration
63
Annex 2.3: Selected indicators
SectorRatio to nominal
GDP (%)Average
annual real change (%)
1984 1994 1985-1994
Primary sector
Agriculture, forestry and fishing 4.8 4.6 3.9
Mining and quarrying 12.7 7.3 -0.6
Secondary sector
Manufacturing 23.0 20.9 -0.1
Electricity, gas and water 3.7 3.6 4.0
Construction (contractors) 3.7 3.1 -2.6
Tertiary sector
Wholesale and retail trade, catering and accommodation 11.6 14.2 -0.1
Transport, storage and communication 9.0 8.7 1.6
Financial intermediation, insurance, real estate and business services 13.1 16.0 1.8
Community, social and personal services 18.3 21.5 2.0
GDP at basic prices 100 100 3.1
Source: South African Reserve Bank and Du Plessis and Smit (2007)
Fiscal year PIT CIT STC VAT
1994/95 - 35% - 14%
1995/96 - 35% - 14%
1996/97 - 35% - 14%
1997/98 - 35% - 14%
1998/99 - 35% - 14%
1999/00 45% 30% - 14%
2000/01 45% 30% - 14%
2001/02 42% 30% - 14%
2002/03 40% 30% 12.5% 14%
2003/04 40% 30% 12.5% 14%
2004/05 40% 30% 12.5% 14%
2005/06 40% 30% 12.5% 14%
2006/07 40% 30% 12.5% 14%
2007/08 40% 30% 10% 14%
Table 2: Tax policy – Maximum marginal tax rates (1994/95 to 2007/08)
Source: Republic of South Africa (2008)
Table 1: An analysis of sector contributions to production

Domestic Resource Mobilisation for Poverty Reduction in East Africa: Lessons for Tax Policy and Administration
64
Fiscal year Operating cost (R million) Operating cost as a % of tax revenue
1998/99 1,663.2 0.90%
1999/00 1,906.3 0.95%
2000/01 1,922.5 0.87%
2001/02 2,332.6 0.92%
2002/03 2,878.5 1.02%
2003/04 3,562.8 1.18%
2004/05 4,311.7 1.21%
2005/06 5,135.5 1.23%
2006/07 5,156.1 1.04%
2007/08 5,607.9 0.98%
Source: Republic of South Africa (2008)
Table 3: Tax administration costs (1998/99 to 2007/08)
Indicator South Africa’s measure World’s measure SSA’s measure
Upper income economies’
measure
TAXSTAFF 0.30 0.82 0.37 0.88
Table 4: Ratio of tax staff per population (TAXSTAFF)
Source: http://www.fiscalreform.net/index.php?option=com_wrapper&Itemid=132 [Accessed 2 February 2010].
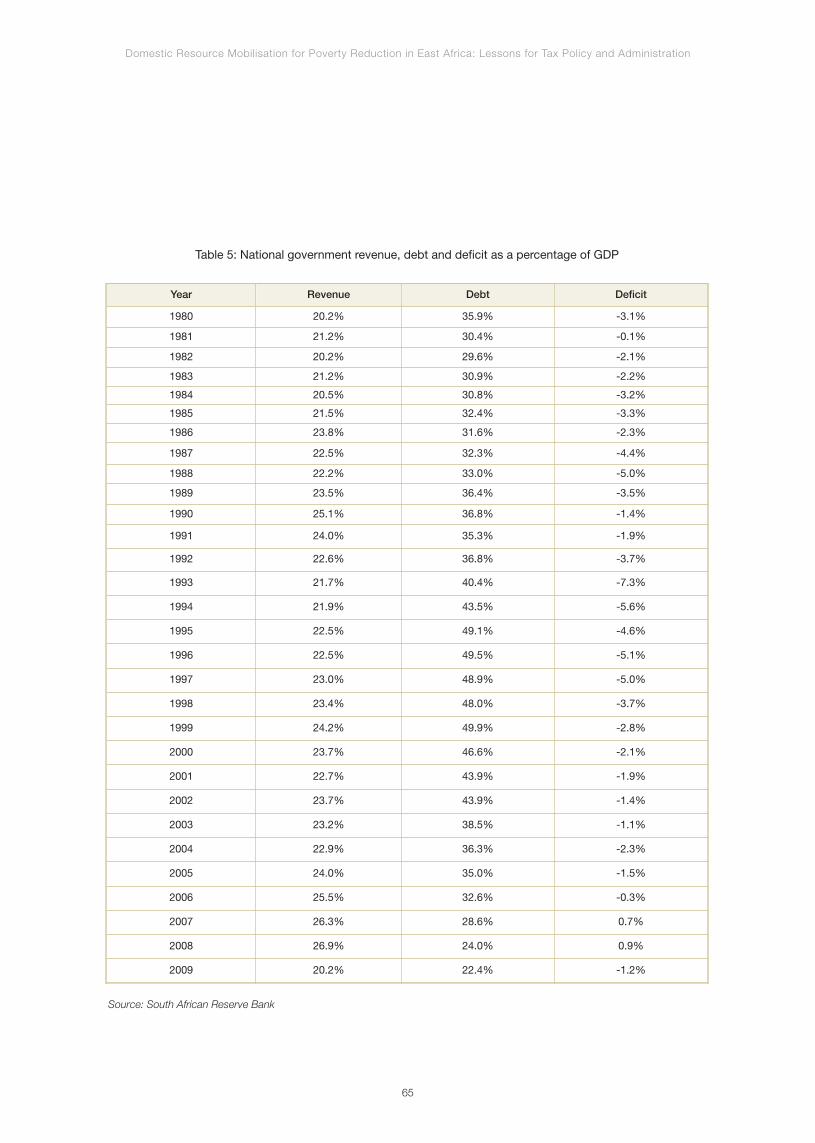
Domestic Resource Mobilisation for Poverty Reduction in East Africa: Lessons for Tax Policy and Administration
65
Year Revenue Debt Deficit
1980 20.2% 35.9% -3.1%
1981 21.2% 30.4% -0.1%
1982 20.2% 29.6% -2.1%
1983 21.2% 30.9% -2.2%
1984 20.5% 30.8% -3.2%
1985 21.5% 32.4% -3.3%
1986 23.8% 31.6% -2.3%
1987 22.5% 32.3% -4.4%
1988 22.2% 33.0% -5.0%
1989 23.5% 36.4% -3.5%
1990 25.1% 36.8% -1.4%
1991 24.0% 35.3% -1.9%
1992 22.6% 36.8% -3.7%
1993 21.7% 40.4% -7.3%
1994 21.9% 43.5% -5.6%
1995 22.5% 49.1% -4.6%
1996 22.5% 49.5% -5.1%
1997 23.0% 48.9% -5.0%
1998 23.4% 48.0% -3.7%
1999 24.2% 49.9% -2.8%
2000 23.7% 46.6% -2.1%
2001 22.7% 43.9% -1.9%
2002 23.7% 43.9% -1.4%
2003 23.2% 38.5% -1.1%
2004 22.9% 36.3% -2.3%
2005 24.0% 35.0% -1.5%
2006 25.5% 32.6% -0.3%
2007 26.3% 28.6% 0.7%
2008 26.9% 24.0% 0.9%
2009 20.2% 22.4% -1.2%
Source: South African Reserve Bank
Table 5: National government revenue, debt and deficit as a percentage of GDP

Domestic Resource Mobilisation for Poverty Reduction in East Africa: Lessons for Tax Policy and Administration
66
24 Budget figures
Fiscal year
Provinces Local government
Casino taxesHose racing
taxesLiquor licences
Motor vehiclelicences
Property taxesRegional
service levies
2002/03 19.2% 3.7% 0.5% 76.5% 73.9% 26.1%
2003/04 19.7% 3.1% 0.4% 76.8% 73.7% 26.3%
2004/05 20.5% 2.5% 0.5% 76.4% 70.1% 29.9%
2005/06 20.8% 2.2% 0.4% 76.5% 69.6% 30.4%
2006/07 22.1% 2.6% 0.4% 74.9% 98.0% 2.0%
2007/0824 22.5% 2.4% 0.8% 74.3% 99.6% 0.4%
Table 8: Breakdown of provincial and local government tax revenues (2002/03 to 2007/08)
Source: Republic of South Africa (2008)
Fiscal year Tax revenue Non-tax revenue
1994/95 22.9% 0.4%
1995/96 22.6% 0.5%
1996/97 23.2% 0.6%
1997/98 23.6% 0.5%
1998/99 24.4% 0.6%
1999/00 24.1% 0.5%
2000/01 23.2% 0.4%
2001/02 24.1% 0.4%
2002/03 23.5% 0.4%
2003/04 23.5% 0.5%
2004/05 24.9% 0.4%
2005/06 26.3% 0.5%
2006/07 27.4% 0.6%
2007/08 27.8% 0.6%
Table 6: Total budgeted tax and non-tax revenue as a percentage of GDP gross
of SACU payments (1994/95 to 2007/08)
Source: Republic of South Africa (2008)
Fiscal year National Provinces Local government
2002/03 23.5% 0.2% 1.4%
2003/04 23.5% 0.3% 1.5%
2004/05 24.9% 0.2% 1.6%
2005/06 26.3% 0.3% 1.6%
2006/07 27.4% 0.3% 1.0%
2007/08 27.8% 0.2% 1.0%
Table 7: Tax revenue collected at national, provincial and local government level
as a percentage of GDP (2002/03 to 2007/08)
Source: Republic of South Africa (2008)
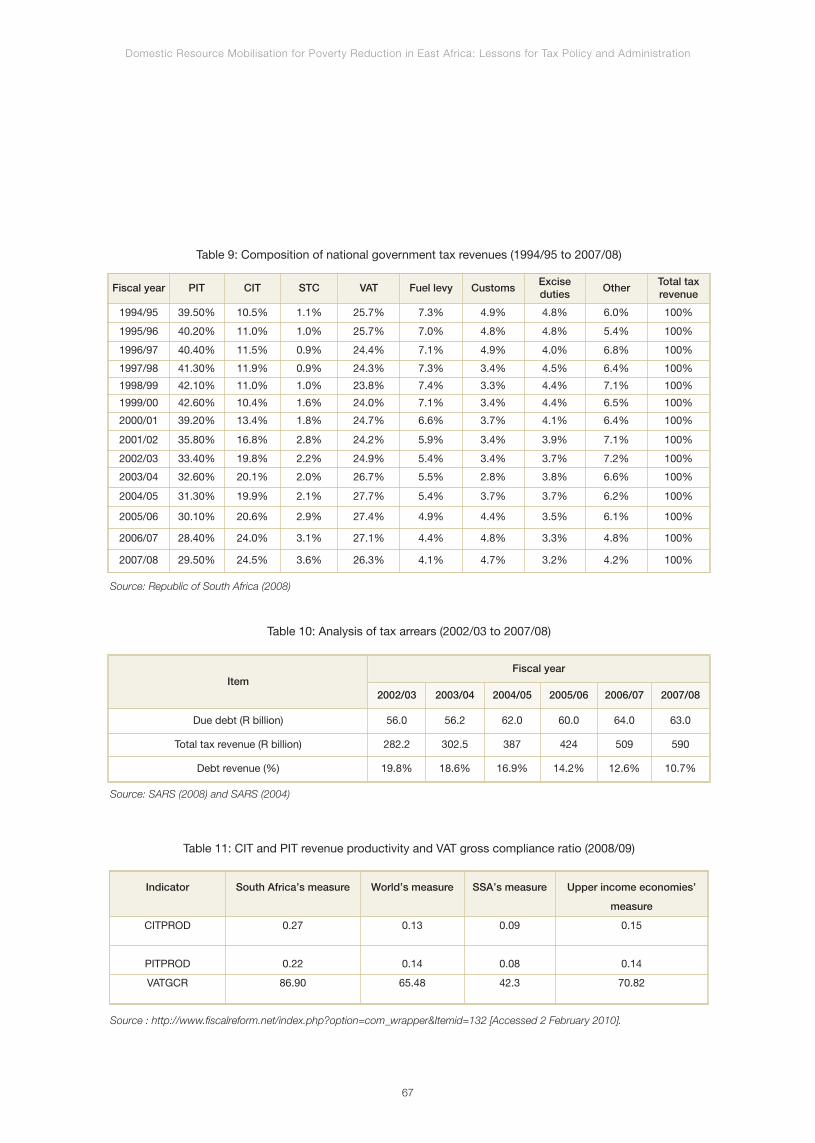
Domestic Resource Mobilisation for Poverty Reduction in East Africa: Lessons for Tax Policy and Administration
67
Fiscal year PIT CIT STC VAT Fuel levy CustomsExciseduties
OtherTotal taxrevenue
1994/95 39.50% 10.5% 1.1% 25.7% 7.3% 4.9% 4.8% 6.0% 100%
1995/96 40.20% 11.0% 1.0% 25.7% 7.0% 4.8% 4.8% 5.4% 100%
1996/97 40.40% 11.5% 0.9% 24.4% 7.1% 4.9% 4.0% 6.8% 100%
1997/98 41.30% 11.9% 0.9% 24.3% 7.3% 3.4% 4.5% 6.4% 100%
1998/99 42.10% 11.0% 1.0% 23.8% 7.4% 3.3% 4.4% 7.1% 100%
1999/00 42.60% 10.4% 1.6% 24.0% 7.1% 3.4% 4.4% 6.5% 100%
2000/01 39.20% 13.4% 1.8% 24.7% 6.6% 3.7% 4.1% 6.4% 100%
2001/02 35.80% 16.8% 2.8% 24.2% 5.9% 3.4% 3.9% 7.1% 100%
2002/03 33.40% 19.8% 2.2% 24.9% 5.4% 3.4% 3.7% 7.2% 100%
2003/04 32.60% 20.1% 2.0% 26.7% 5.5% 2.8% 3.8% 6.6% 100%
2004/05 31.30% 19.9% 2.1% 27.7% 5.4% 3.7% 3.7% 6.2% 100%
2005/06 30.10% 20.6% 2.9% 27.4% 4.9% 4.4% 3.5% 6.1% 100%
2006/07 28.40% 24.0% 3.1% 27.1% 4.4% 4.8% 3.3% 4.8% 100%
2007/08 29.50% 24.5% 3.6% 26.3% 4.1% 4.7% 3.2% 4.2% 100%
Table 9: Composition of national government tax revenues (1994/95 to 2007/08)
Source: Republic of South Africa (2008)
ItemFiscal year
2002/03 2003/04 2004/05 2005/06 2006/07 2007/08
Due debt (R billion) 56.0 56.2 62.0 60.0 64.0 63.0
Total tax revenue (R billion) 282.2 302.5 387 424 509 590
Debt revenue (%) 19.8% 18.6% 16.9% 14.2% 12.6% 10.7%
Table 10: Analysis of tax arrears (2002/03 to 2007/08)
Source: SARS (2008) and SARS (2004)
Indicator South Africa’s measure World’s measure SSA’s measure Upper income economies’
measure
CITPROD 0.27 0.13 0.09 0.15
PITPROD 0.22 0.14 0.08 0.14
VATGCR 86.90 65.48 42.3 70.82
Table 11: CIT and PIT revenue productivity and VAT gross compliance ratio (2008/09)
Source : http://www.fiscalreform.net/index.php?option=com_wrapper&Itemid=132 [Accessed 2 February 2010].

Domestic Resource Mobilisation for Poverty Reduction in East Africa: Lessons for Tax Policy and Administration
68
Fiscal year PIT assessed as a % of taxable income CIT assessed as a % of taxable income
2002/03 23.8% 30.2%
2003/04 21.7% 30.1%
2004/05 21.7% 29.9%
2005/06 20.7% 28.8%
Table 12: Analysis of PIT and CIT burden – Tax assessed as a percentage
of taxable income (2002/03 to 2005/06)
Source: Republic of South Africa (2008)
Brackets in Rand Marginal Cumulative
2002/03 2008/09 PIT rates % increase
- 40,000 - 122,000 18% 205%
40,001 80,000 122,001 195,000 25% 144%
80,001 110,000 195,001 270,000 30% 145%
110,001 170,000 270,001 380,000 35% 124%
170,001 240,000 380,001 490,000 38% 104%
240,001 & over 490,001 & over 40%
Table 13: Personal Income Tax (PIT) brackets, 2002/03 and 2008/09
Source: Republic of South Africa (2008)
SegmentNumber
registeredCIT VAT PAYE Total
Large businesses 21,561 79% 4% 43% 31%
Medium businesses 42,286 12% 57% 26% 22%
Micro to small businesses 2,347,341 9% 36% 16% 15%
Complex individuals 2,750,000 0% 0% 0% 18%
Standard individuals 2,900,000 0% 0% 0% 9%
SITE 5,600,000 0% 0% 0% 1%
NGOs, PBOs, Embassies and Governmentdepartments
27,568 0% 3% 15% 4%
Total 13,688,756 100% 100% 100% 100%
Table 14: Analysis of tax burden – Taxes paid by the various taxpayer segments in 2008/09
Source: SARS (2009b)

Domestic Resource Mobilisation for Poverty Reduction in East Africa: Lessons for Tax Policy and Administration
69
Indicator
Region
South Africa OECD SSA
Number of tax payments a year 9 12.8 37.7
Time taken to comply with the major tax types 200 194.1 306.0
Total tax rate as % of profit 30.2% 44.5% 67.5%
Table 16: World Bank Doing Business indicators (2010) on the tax burden
(South Africa vis-à-vis the OECD and SSA)
Source: http://www.doingbusiness.org/ExploreEconomies/?economyid=172 [Accessed 10 March 2010]
Table 17: Growth of registered taxpayers
Source: Smith (2003) and Republic of South Africa (2008)
Registered asTotal Number Registered for Tax Percentage
increase (1998/99to 2007/08)1998/99 2002/03 2005/06 2007/08
Individuals 2,485,703 3,415,432 4,476,261 5,204,805 109%
Companies 777,864 814,894 1,054,969 1,584,002 104%
Trusts - 254,593 344,882 348,747 -
Indicator
Year
2008 2009 2010
South Africa’s global ranking - 23 23
Number of tax payments a year 11 9 9
Time taken to comply with the major tax types 350 200 200
Table 15: World Bank Doing Business indicators on the tax burden (South Africa only)
Source: http://www.doingbusiness.org/ExploreEconomies/?economyid=172 [Accessed 10 March 2010]
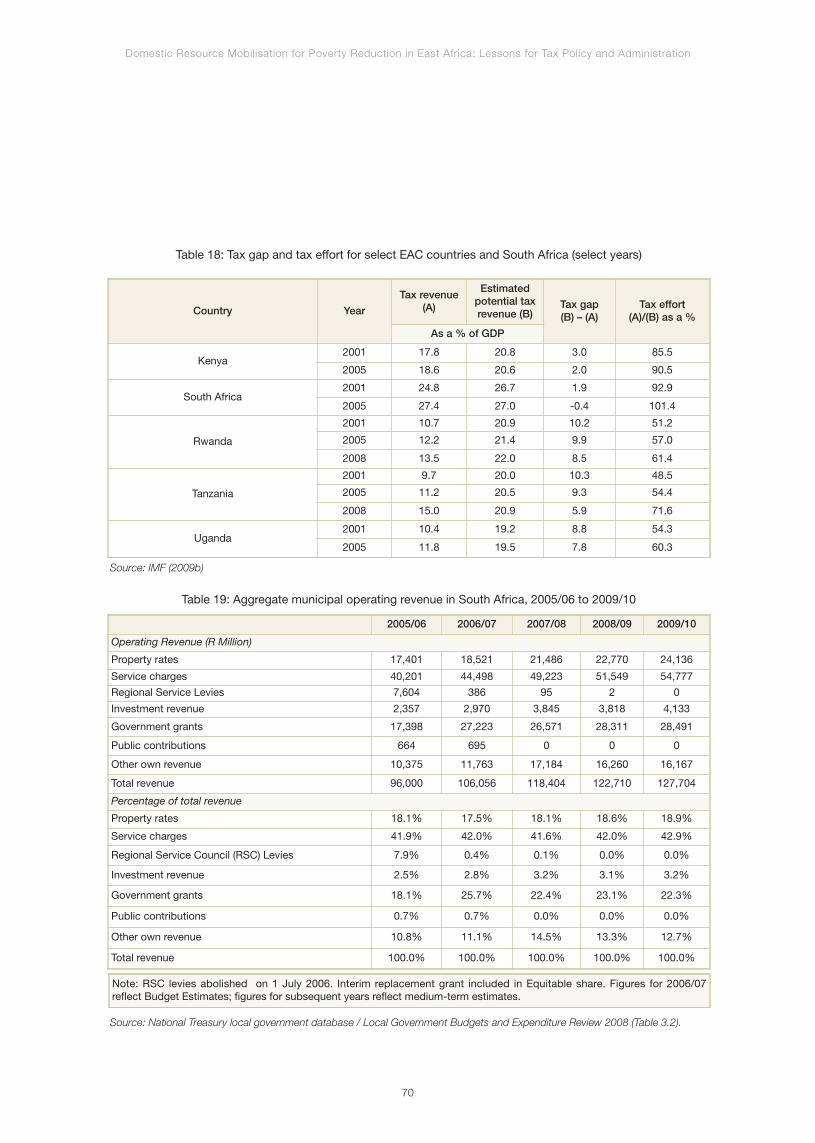
Domestic Resource Mobilisation for Poverty Reduction in East Africa: Lessons for Tax Policy and Administration
70
Country Year
Tax revenue(A)
Estimatedpotential taxrevenue (B)
Tax gap(B) – (A)
Tax effort(A)/(B) as a %
As a % of GDP
Kenya2001 17.8 20.8 3.0 85.5
2005 18.6 20.6 2.0 90.5
South Africa2001 24.8 26.7 1.9 92.9
2005 27.4 27.0 -0.4 101.4
Rwanda
2001 10.7 20.9 10.2 51.2
2005 12.2 21.4 9.9 57.0
2008 13.5 22.0 8.5 61.4
Tanzania
2001 9.7 20.0 10.3 48.5
2005 11.2 20.5 9.3 54.4
2008 15.0 20.9 5.9 71.6
Uganda2001 10.4 19.2 8.8 54.3
2005 11.8 19.5 7.8 60.3
Table 18: Tax gap and tax effort for select EAC countries and South Africa (select years)
Source: IMF (2009b)
2005/06 2006/07 2007/08 2008/09 2009/10
Operating Revenue (R Million)
Property rates 17,401 18,521 21,486 22,770 24,136
Service charges 40,201 44,498 49,223 51,549 54,777
Regional Service Levies 7,604 386 95 2 0
Investment revenue 2,357 2,970 3,845 3,818 4,133
Government grants 17,398 27,223 26,571 28,311 28,491
Public contributions 664 695 0 0 0
Other own revenue 10,375 11,763 17,184 16,260 16,167
Total revenue 96,000 106,056 118,404 122,710 127,704
Percentage of total revenue
Property rates 18.1% 17.5% 18.1% 18.6% 18.9%
Service charges 41.9% 42.0% 41.6% 42.0% 42.9%
Regional Service Council (RSC) Levies 7.9% 0.4% 0.1% 0.0% 0.0%
Investment revenue 2.5% 2.8% 3.2% 3.1% 3.2%
Government grants 18.1% 25.7% 22.4% 23.1% 22.3%
Public contributions 0.7% 0.7% 0.0% 0.0% 0.0%
Other own revenue 10.8% 11.1% 14.5% 13.3% 12.7%
Total revenue 100.0% 100.0% 100.0% 100.0% 100.0%
Table 19: Aggregate municipal operating revenue in South Africa, 2005/06 to 2009/10
Source: National Treasury local government database / Local Government Budgets and Expenditure Review 2008 (Table 3.2).
Note: RSC levies abolished on 1 July 2006. Interim replacement grant included in Equitable share. Figures for 2006/07reflect Budget Estimates; figures for subsequent years reflect medium-term estimates.

Domestic Resource Mobilisation for Poverty Reduction in East Africa: Lessons for Tax Policy and Administration
71
Strategic objective Performance indicator TargetActual results
2006/07 2007/08
Optimizing compliance &managing risk
Revenue collections Budget Exceeded Exceeded
Administrative cost as a % oftotal revenue
1.06% 1.04% 0.98%
Due debt as a % of totalrevenue
14% 12.6% 10.7%
Ensuring a better taxpayer & trader
experience
% achievement againstservice charter
85% 94% 99.8%
Call center—80% of callsanswered in 20 seconds
80% 71% 49%
Branch office walk ins- attend 95% in 15 mins,
90% (peak)
Off peak - 95%Peak - 90%
Off peak – 96.5%(March – June)Peak – 93.9%(July – February)
98.6%
Correspondence—respond to 80% within 21
working days 80% 80% -
Improving enforcement
% overall increase incompliance behavior—
increase in active register,decrease in outstandingreturns, & decrease in
debtors
9%
Increase of 17% inactive register
Decrease of 6% inOutstanding Returnbook Decrease of3,75% in debt book
12%
Increase ineffective tax ratesper selected industry
5% Not measured -
Due debt collected R17bn R17.7bn R15,6bn
% success in risk basedaudits
70% 68% 73%
Audit coverage across all taxtypes
66,000 69,270 69,118
Continuing staff development & promoting a
culture of integrity & professionalism
% compliance with equityplan
100% 90% -
% closure of skills gap 25% 55.4% -
Implement new performancemanagement development
system 90% 90% 100%
Enhancing trade facilitation
& border control
Imports 4 hrs – electronicdata interchange
% success of anti-smugglingactivities : SACU
15% 30.3% -
% achievement of passengerexamination and successrate: SACU success rate
2% 1% 1%
Table 20: Balanced scorecard performance measures
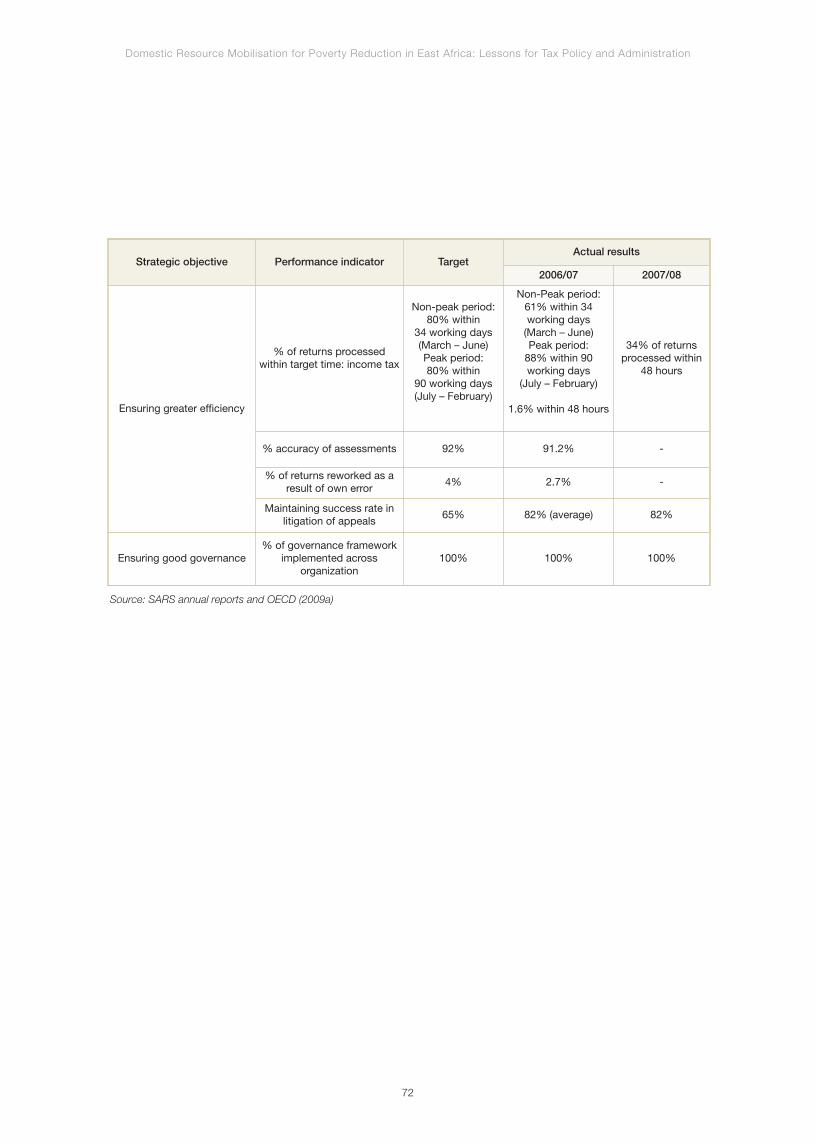
Domestic Resource Mobilisation for Poverty Reduction in East Africa: Lessons for Tax Policy and Administration
72
Strategic objective Performance indicator TargetActual results
2006/07 2007/08
Ensuring greater efficiency
% of returns processed within target time: income tax
Non-peak period:80% within
34 working days(March – June)Peak period:80% within
90 working days(July – February)
Non-Peak period:61% within 34 working days(March – June)Peak period:88% within 90 working days
(July – February)
1.6% within 48 hours
34% of returnsprocessed within
48 hours
% accuracy of assessments 92% 91.2% -
% of returns reworked as aresult of own error
4% 2.7% -
Maintaining success rate in litigation of appeals
65% 82% (average) 82%
Ensuring good governance % of governance framework
implemented across organization
100% 100% 100%
Source: SARS annual reports and OECD (2009a)
Domestic Resource Mobilisation for Poverty Reduction in East Africa: Lessons for Tax Policy and Administration
73
Annex 2.4: Changes to the administrativesystems at SARS
SARS first introduced eFiling in July 2001 for VAT and
provisional income tax returns and payments, which
were submitted via a third party provider at a cost. The
initial uptake in 2001/02 of 10,500 returns was not as
high as expected due to the associated third party
provider costs (SARS, 2002). Not surprisingly, the third
party provision was abandoned; instead taxpayers
were encouraged to file returns directly to SARS. Since
then, eFiling has been extended to cover PAYE, SDL,
UIF, STC, transfer duty, ATR and Provisional Tax. With
respect to PAYE, SARS launched ‘e@syfile for
employers’. This platform enables SARS to receive over
90% of PAYE submissions electronically.
Furthermore, SARS has since directed significant
resources to pre-populating PIT records with informa-
tion available from third parties (e.g., employers and
individuals), thereby enhancing the accuracy of records.
In addition, SARS restructured the cumbersome tax
return form from 11 to 2 pages; and “the need to
provide paper schedules with the tax returns was done
away with” (SARS, 2008). Also, SARS invested
resources in educating taxpayers on new arrangements
– especially eFiling. Taxpayers have every incentive to
file their returns electronically, especially since they have
a longer submission deadline than those who submit
returns manually. Furthermore, SARS is able to provide
eFilers with a 24/7 service as well as a short messaging
service (SMS) to remind taxpayers when returns are
due. SARS estimates that there are currently 2 million
eFilers. Moreover, this technology has: enabled SARS
staff to improve its workflow management – it now
takes 48 hours to complete a tax assessment as
opposed to 58 days under the manual filing system;
and empowered frontline staff by providing them with
business intelligence and data mining facilities.
In 2004/05, SARS launched a National Call Centre to
offer a single contact for all taxpayer enquiries (SARS,
2005). Within one year, SARS reported that it received
over 3 million calls of which 80% were answered within
20 seconds. This level of responsiveness can be attribu-
ted to staff training to maximise timeliness of service – in
particular: a taxpayer only calls once; call times are
reduced; issues are resolved as quickly as possible; and
backlogs are minimised. In 2008/09, SARS further
modernised the call centre by incorporating an
interactive voice response system.
SARS has also modernised its internal systems. In
2004/05, it settled on a SAP solution for its financial
management system (SARS, 2005). The SAP system
enables SARS to: undertake bank reconciliations natio-
nally on a daily basis; obtain a daily report on revenue
accounts; and a view every 15 minutes on deposits
which serves many uses – for example, SARS sends
daily SMS on collections to relevant staff. In 2008/9,
SARS extended the functionality of SAP to manage its
human resource processes and transactions.
Over and above the SAP financials platform, considera-
ble effort has gone into finessing revenue planning and
monitoring systems. In particular, SARS maintains
various models (e.g., time series, regression analysis,
bottom-up) to inform revenue forecasting. The models
are built on the basis of indicators in the macro-econo-
mic framework, collection patterns, compliance trends
and so forth. SARS tests the validity of the models on an
ongoing basis. It also compares its models with those
used in world class revenue services.
In terms of the framework in place for monitoring and
evaluation (M&E) of its operations, SARS prepares
medium-term strategic plans with clear objectives and
specific measures of performance. These plans feed
into SARS’s MTEF for financial resource allocation
purposes. In addition to revenue targets by type of tax,
the M&E framework defines targets for: number of
taxpayers and traders; volumes of tax returns and bills
of entry to be processed per annum; service volumes;
processing and response times; compliance actions
(e.g., number of audits per annum); and effectiveness
Domestic Resource Mobilisation for Poverty Reduction in East Africa: Lessons for Tax Policy and Administration
74
(e.g., success rates) (SARS, 2009a). SARS reports on
its performance in annual reports, which detail actual
performance against the targets set in the strategic
plan. These metrics are supplemented by narratives,
which explain any positive and negative variances
(SARS, 2009b).
SARS was in the process of replacing 42 legacy
systems in customs with TATIScms software. The new
system builds on the lessons learned from the
modernisation of the income tax system. TATIScms
offers features such as: generation of statistics;
reconciliation/acquittal; risk engine rules; and facilities
to support the Authorised Economic Operator (AEO)
accreditation programme across SACU and SADC.
SARS, on the back of TATIScms, has embarked on
simplifying processes (in a similar way to Inland
Revenue), so that there is no requirement in future for
importers/agents to provide supporting documentation.
Furthermore, increased use of ICT is expected to
reduce the level of interaction with importers, and
minimise corruption.
SARS receives a grant from the National Treasury to fund
its operations. It budgets for its resource requirements in
the Medium Term Expenditure Framework (MTEF).
“Other operating revenue consists mainly of commis-
sions earned from acting as the agent for the
Department of Labour” (SARS, 2009b). In particular,
SARS collects Unemployment Insurance Fund (UIF)
contributions and Skills Development Levies (SDLs) in
line with the Unemployment Insurance Contributions Act,
2002 and the Skills Development Levies Act, 1999.
SARS invests surplus cash and retains any interest.

Chapter 3
South Korea


Summary of Key Findings
This case study explores some of the key achievements
of South Korea’s tax reforms undertaken during its
takeoff phase - 1960s and 1970s -- with a view to
drawing useful lessons for East Africa Community (EAC)
member countries today. It is part of a broader project
on Domestic Resource Mobilisation (DRM) carried out
by the African Tax Administrations Forum (ATAF), with
the support of the African Development Bank (AfDB).
The project aims at sharing best practices among EAC
member countries, South Africa and South Korea.
Korea’s spectacular rise from an impoverished country
in the 1960s to an economic power house in just a
generation is an unprecedented success story in
human history. In the early years, its socioeconomic
conditions were similar in many respects to those of the
EAC member countries today. Korea’s Gross Domes-
tic Product (GDP) per capita grew from US$130 in 1954
to about US$19,115 in 2008. This growth was relati-
vely well shared among its people, as evidenced by a
Gini coefficient of 32 in 2008, which is equal to the Eu-
ropean average. Korea implemented an export-orien-
ted infant industry strategy to transform itself from a
third world country into a first world economic power
in one generation. In the 1960s, Korea’s GDP per
capita was similar to that of EAC member countries
today and much lower than South Africa’s. It was a
fragile state, emerging from a devastating war with
North Korea. It was also predominantly rural, with a
large informal sector. This formed the project’s rationale
for inclusion of Korea’s tax experience in the 1960s and
1970s.
Korea’s tax reforms in those years consisted of three
phases which successively focused on: improving
policies and laws; efficient implementation; and streng-
thening equity and the introduction of Value Added Tax
(VAT). First, until 1966, reforms concentrated on revi-
sing tax policies to increase revenue collection and
support growth. This involved merging a number of
taxes, increasing the share of indirect taxes and using
tax incentives to support selected sectors. These
measures, along with others, contributed to boosting
growth, which reached 9.3% in 1963 and has since
been sustained at an average of 7.2%. But revenue
collection still fell short of expectations. The focus
therefore shifted from reforming tax policies to
implementing them efficiently. Consequently, the
second phase, from 1966 to 1974, focused on
strengthening the tax administration. The creation of the
National Tax Service (NTS), as a semi-autonomous
body in 1966, initiated a period of rapid revenue
growth. During the third phase, from 1974 to 1980, the
importance of equity as an objective of tax policy
increased and VAT was introduced. Government
revenue increased from 9% of GDP in 1966 to 15% in
1980. Combined with a decrease in government
expenditure, this enabled Korea to rapidly achieve
fiscal balance, which was a priority strategic objective.
Furthermore, tax incentives also contributed to stimu-
lating growth, though to a much lesser extent than
non-tax incentives, such as targeted credit subsidies.
Two lessons of particular relevanceto EAC countries emerge fromKorea’s tax experience.
First, Korea achieved faster results by focusing its tax
policies on a few priorities fully aligned with its national
development strategy. In the 1960s and 1970s, Korea’s
national strategy, on one hand, was to rapidly achieve
fiscal balance with a small government budget, and on
the other, to promote growth through an infant industry
policy.To this end, it successfully implemented tax
policies aimed at increasing adequate revenues to
match low levels of expenditures by international
standards, broadening the tax base, and providing
incentives to strategic sectors. At the same time, less
priority was given to other tax objectives, such as
neutrality and equity. However, trade-offs in the tax
space were largely made up in other policy areas, in
particular through equity-oriented expenditure, rural
Domestic Resource Mobilisation for Poverty Reduction in East Africa: Lessons for Tax Policy and Administration
78

development programmes and growth. All this
provided Korea with sustainable means to achieve
equity. EAC countries are also challenged by multiple
tax objectives, which can be conflicting if pursued at
the same time. For instance, exemptions can be
necessary to provide safety nets or stimulate
investments, but they conflict with the objectives of
broadening the tax base and minimising distortions.
The priorities opted by Korea may or may not fit the
strategies of EAC countries. But prioritisation and
sequencing could help overcome the general problem
of conficting tax objectives.
Second, Korea broadened its tax base by making its tax
administration simultaneously empowered and accoun-
table. The National Tax Service (NTS) benefitted from full
support by top Government officials. NTS was shielded
from political interference in its operations, as illustrated
from the President’s personal support to the
Commissioner against external pressure. In addition,
enforcement capability of the tax administration was
dramatically strengthened. For instance, three years after
its creation, NTS staff headcount increased by 70% to
reach 0.3 staff for 1000 inhabitants, 5 times the EAC
average. On the other hand, the President was perso-
nally committed to the success of the tax administration,
approving targets himself and closely monitoring its
performance. Operational empowerment and accoun-
tability for performance together helped Korea succeed
in broadening its tax base. This is illustrated by a VAT
Gross Compliance Ratio of 55%, which was achieved
by 1978, against a range of 27% (Uganda) to 41%
(Kenya) in the EAC today.
One useful way to interpret these lessons is that part of
Korea’s success can be explained by a strong empha-
sis on implementation, over and above strategy and po-
licies. In fact, many of Korea’s policies and strategies
have been adopted in the EAC in one form or another.
These include, for example, incentives to promote in-
vestment, simplified tax filings for small enterprises, and
special initiatives for large tax payers. Korea, therefore,
stands out for its emphasis on implementation rather
than the nature of its policies. Indeed, focused and co-
herent strategies are a prerequisite for solid implementa-
tion. Likewise, empowered and accountable execution
agencies are critical for effective delivery. Implementation
plays a central role in Korea’s experience in general,
beyond the field of taxation. As an illustration, it is said
that President Park Chung Hee, Korea’s leader during
its takeoff phase, allocated 20% of his time to decision
making, and 80% to implementation. As a result, over
his 18-year tenure, he spent about 119 days a year criss-
crossing the country, demonstrating his commitment to
results, monitoring them and listening to practical feed-
back from the ground.
Domestic Resource Mobilisation for Poverty Reduction in East Africa: Lessons for Tax Policy and Administration
79

Introduction
This case study explores some of the key achievements
of Korea’s tax reforms undertaken during its takeoff
phase - the 1960s and 1970s - with a view to drawing
some useful lessons for EAC member countries today.
It is part of a broader project on Domestic Resource
Mobilisation carried out by the African Tax Administra-
tions Forum (ATAF), with the support of the African
Development Bank. This project aims at sharing the
best practices among EAC member countries, South
Africa and South Korea. It consists of a case study or
a summary paper for each of the countries included in
the project (Burundi, Rwanda, Uganda, Kenya, Tanza-
nia, South Africa, and South Korea). The project also
included a study tour of Korea’s tax system and
history, which took place in November 2009. It gave top
Korean and East African tax officials an opportunity to
exchange views about their respective experience. A
comparative study will bring the lessons from the case
studies, summary papers and study tour together and
propose policy recommendations.
South Africa and South Korea were included in the
project in order to put East African experiences in
perspective with that of countries with more advanced
systems and which had experienced most of the
challenges being faced by East African countries today.
While South Africa brings another example on the same
continent, Korea brings an example from a different one.
South Korea’s development is one of the most success-
ful in human history, and yet, in the 1960s, it faced many
of the challenges that African countries still encounter
today. Korea’s GDP per capita grew from US$130 in
1954 to about US$19,115 in 2008. This growth was
relatively well shared, as evidenced by a Gini coefficient of
32 in 2008 - equal to the European average. Korea
implemented an export-oriented infant industry strategy
to transform itself from a third world country into a first
world economic power in one generation. In the 1960’s,
Korea’s GDP per capita was similar to that of EAC
member countries today and much lower than South
Africa’s. South Korea was a fragile state, emerging from
a devastating war with the North. It was also predomi-
nantly rural, with a large informal sector. This formed the
rationale for inclusion of Korea’s tax experience in the
1960s and 1970s in the project.
This study focuses on Korea’s tax reforms during its
takeoff period, in the 1960’s and 1970’s. Indeed, as we
will see, those were the periods when Korea’s economy
was most similar to that of EAC member countries
today, and hence its experience is most relevant. They
were also the periods when Korea achieved rapid tax
revenue growth, on which relatively little has been
written. On the other hand, it would have been neither
feasible nor desirable to explore in detail the tax
policies of modern Korea, as for the most part, they
have already been extensively studied and are not
relevant to today’s Africa. For instance, one of the key
problems faced by Korea’s tax system today is the
impact of an ageing population, which obviously is not
relevant to Africa. That said, a brief overview of Korea’s
tax system from the 1980s to the present time is also
provided to illustrate the long-term effects of Korea’s
early policies.
This study also focuses on domestic and central taxes.
Customs taxes are not covered in detail, because the
EAC integration process and international trade
agreements result in a reduction of their importance in
the EAC countries’ revenue composition. In addition,
local taxes are not discussed, because they remained
at relatively low levels in Korea during the 1960s and
1970s, the focus periods of this study, and very little
research material seems available on this. However,
basic information on these taxes and on their
contribution to total revenues is provided as part of the
background for domestic and central taxes.
It is important to emphasise that Korea’s tax experience
in the 1960’s and 1970’s is in general poorly docu-
Domestic Resource Mobilisation for Poverty Reduction in East Africa: Lessons for Tax Policy and Administration
80

mented. As explained earlier, Korea in the 1960s was
very poor –per capita GDP was about US$130
during the first half of the decade -- and was not
producing even basic statistics such as detailed
national accounts. Most of the data that we used was
actually produced by the National Tax Service, created
in 1966. Still, it took many years for the NTS to produce
comprehensive and consistent data sets. Much of the
data used in this study is the result of a reconciliation
and cross-checking of various sources. Some
discrepancies could not be fully resolved. There was
therefore also extensive use of qualitative information
collected from the literature - mostly Korean - to check
and complement the quantitative evidence available.
Some uncertainty will therefore remain on the details
presented in this paper. Still, we believe the study’s
main findings do emerge quite clearly from the
evidence available.
The case study is structured around three parts. First,
the “Background and context” section presents
Korea’s development since the end of the Korean War
in 1953, and discusses the comparability of Korea
during its takeoff years with that of the EAC today.
Second, Korea’s tax reforms are set out chronologically,
presenting at each phase policies and administrative
reforms. The third section discusses two selected key
lessons from an EAC perspective.
Domestic Resource Mobilisation for Poverty Reduction in East Africa: Lessons for Tax Policy and Administration
81
AfDB staff with tax officials from EAC Partner States and South Korea

Background
This section presents Korea’s development since the
end of the Korean War in 1953 until today, and discusses
the comparability of Korea during its takeoff period with
that of the EAC today. Though the focus of this study is
the takeoff period, this section provides an overview of
Korea’s development until today. Indeed, this is neces-
sary to understand the long-term consequences of the
tax reforms during the takeoff period.
Korea’s development
experience and strategy
From 1962 to 2008, Korea’s real GDP grew at an
impressive rate of 7.2% on average, while achieving
remarkable equity and social development. Its GDP per
capita grew from US$130 in 1954 to about US$19,115
in 2008 (Figure 3.1). Korea’s Gini index was 32 in 2008
- equal to the European average – reflecting the
success of its model in mitigating the risk of high
inequality despite rapid growth. Social indicators also
made impressive gains. For instance, life expectancy
increased from 55 to 79 years between1962 and 2008;
and secondary school enrollment increased from 42%
in 1971 to 98% today.
Following the War, the military Government adopted
an import substitution policy, which did not result in
significant growth. Foreign aid was the principal
source of income until 1958, accounting for 45% of
government revenues and 70% of imports. In 1957,
the United States, which provided the bulk of the aid,
unexpectedly announced that it was phasing out
financial aid, which effectively started to decline from
1958. The import substitution policy was to a large
extent devised to address the fiscal and current
account deficits, which as a result, were widening. The
Government exercised, in particular, currency control
and import licensing.
Domestic Resource Mobilisation for Poverty Reduction in East Africa: Lessons for Tax Policy and Administration
82
25.000
20.000
15.000
10.000
5.000GD
P pe
r cap
ita in
cur
rent
US$
Real
grow
th ra
te in
%
GDP real growth rate
GDP per capita
0
1961 1971 1981 2001
30%
25%
20%
15%
10%
5%
0%
-5%
-10%1991
Figure 3.1: 50 years of growth in Korea
Source: WDI
In 1961, a military coup brought Park Chung Hee to
power. He changed the policy from import substitution to
export promotion. Another important feature of his policy
was to achieve economic freedom, highlighted in the slo-
gan “From Poverty to Self-sufficiency”. In order to design
and implement this policy, President Park created a num-
ber of institutions. For instance, the Economic Planning
Board was established in July 1961 with the mission to
develop 5-year Economic Development Plans (EDP), in-
cluding both macroeconomic planning and detailed im-
plementation plans. A year later, the Korea Trade
Investment Promotion Agency was established, which re-
ported its progress in monthly meetings to the President
towards meeting the export targets1.
The export strategy resulted in rapid growth in the 1960’s
and 1970’s. It relied on intensive government
intervention to protect and promote private investment in
infant industries in selected sectors. Indeed, the
Government considered that Korean industries had not
reached the critical mass to be able to compete on
international markets and therefore required protection as
economies of scale were being built. Government inter-
vention took many forms, in which tax incentives played a
role. However, the central area of its intervention was in fi-
nancial markets. The support system included placing the
central bank under the authority of the Government, na-
tionalising banks, giving them lending objectives by sec-
tor, controlling interest rates, subsidising credit and
providing government guarantees. Other measures inclu-
ded: foreign exchange control (in particular the 1964 de-
valuation); pooled marketing boards (which purchased
imported inputs in bulk for Korean SMEs); selection of high
potential SMEs for special support and close government
performance monitoring; capacity building for SMEs; and
overhauling the education system to supply skilled labour
to the priority industries.
The first and second EDPs, covering the 1962-1971
period, focused on manufacturing exports, such as
steel, machinery, and chemical industries. Basic inputs
for production were also emphasised, such as coal,
electricity, fertilizer, oil refining, synthetic fibers and
cement.The third and fourth EDPs focused on higher
value added and heavy industry exports, including
household electronics, cars, shipbuilding and petro-
chemicals.
By the end of the 1970s, however, the distortions
acumulated over 20 years of strong government inter-
ventions in the financial and labour markets had become
unsustainable. In particular, some industries were
suffering overinvestment and excess capacity. The wage
of skilled labour increased very rapidly, up to 31% per
year from 1974 to 1980. This, along with the creation of
rents in priority sectors, caused growing inequalities. Fur-
ther compounding the problem was a persistent high
inflation, which started with the first oil shock in 1973. All
this resulted in growing disenchanment against the
regime, culminating in the assassination of President Park
in October 1979. After a brief political interregnum,
General Chun Doo Hwan came to power through a coup.
In 1980, the change of regime, combined with the
economic crisis, marked the shift from a high go-
vernment intervention to a liberalisation policy. As Ge-
neral Chun took power the second oil crisis hit Korea,
making a tight stabilisation policy even more urgent. It
focused on zero-based budgeting, including a freeze
on public wages and a monetary squeeze. As a result,
inflation declined from 21% to 2% during 1981-1984.
In addition, the financial sector was rapidly liberalised,
leading to privatisation of four of the five largest banks
and creation of two commercial banks, along with
many other private financial institutions. At the same
time, government credit control progressively phased
out. The Banking Act was amended to prevent Chae-
bols2 from owning excessive shares in financial
institutions. By 1986, Korea had resumed high growth
rates. It was, in particular, benefiting from a low dollar
Domestic Resource Mobilisation for Poverty Reduction in East Africa: Lessons for Tax Policy and Administration
1 Interestingly, ambassadors were also given sales objectives and were assessed on this basis2 Chaebols are large family-owned Korean business conglomerates, which benefitted from strong government support to become powerful multinatio-nals. There are several dozen Chaebols, including well-known brands such as Samsung, Hyundai and LG.
83

and low oil prices. Its current account surpluses
reached 8%. Liberalisation continued, with direct
investment by foreigners in the Korean stock market
being allowed from 1992, Korea joining the World
Trade Organisation (WTO) in 1994 and the Organisa-
tion for Economic Cooperation and Development
(OECD) in 1996. The liberalization was considered
succcessful until the financial crisis in 1997 hit Korea
and international financial flows abruptly reverted.
Identifying the root causes of the crisis is difficult as
both pro- and anti-liberal interpretations of the Asian
financial crisis can be found. However, there is a broa-
der agreement that over-investment by the Chaebols
and excessive maturity mismatches in financial insti-
tutions were some of the key reasons for the rapid loss
of investor confidence. Korea’s economy grew a little
above 4% as a result of the crisis, which was very low
compared to its 8% average growth from 1962 to
1997. It has since recovered and grown at an average
of 6.2% from 1999 to 2007. The 2008 financial crisis
took a heavy toll on Korea, causing growth to decline
to 2.2% that year. Korea has since benefited from a
steady recovery, in line with the faster growth of the
global economy.
Comparing Korea in the
1960s/1970s and the EAC today
Korea was included in this project because of
itsimpressive development and the importance of the
role of taxation.
In addition, this study focuses on Korea in the
1960s/1970s because it was then similar to EAC
member countries in many respects. We therefore
present the following similarities with EAC member
countries, which make them relevant to Korea’s
experience. However, we also present some of the key
differences, which are important to bear in mind when
considering applying such lessons3.
Domestic Resource Mobilisation for Poverty Reduction in East Africa: Lessons for Tax Policy and Administration
3 The specificities of Korea’s initial conditions and their implication for replicating Korea’s approach to development in general have been discussed ex-tensively. Examples can be found in the “Korea’s Development experience” section of the list of references.
84
0 10.000 20.000 30.000 40.000
GDP per capita, 2005 constant US$ at PPP
OECD, 2008
Middle Income Countries, 2008
South Africa, 2008
Korea, 1962
Kenya, 2008
EAC, 2008
Figure 3.2: Korea in the 1960s was in the same income group as EAC countries today
Source: WDI, calculations by the authors

Korea in the 1960s was in the same income group as
the EAC today. After adjusting for inflation and purcha-
sing power parity (constant 2005 US$ at PPP)4, Korea’s
GDP per capita in 1962 was US$1849, about 25%
greater than that of Kenya in 2008, the EAC country with
the highest GDP per capita. However, EAC countries
today and South Korea in 1962 should still be conside-
red in the same income group as South Korea’s GDP
was less than one-fourth of that of South Africa (constant
2005 US$ 9343 at PPP) and the average of other
Middle-Income countries, and 19 times less than the
average of OECD countries (see Figure 3.2).
Since 1954 until 1968, Korea’s budget (excluding grant
revenues) and current account were in chronic deficit
(for instance, 6% and 12% of GDP in 1962 respecti-
vely). These deficits were largely financed by grants
from the USA.
Korea’s economic structure, like the EAC today,
comprised a large agrarian sector, but was less
industrialised and had lower levels of trade. Agricul-
ture contributed 36% of GDP in 1962, as against 30%
in the EAC in 20055. Industrial output accounted for
only 17% of GDP in 1962, which was 26% in the EAC
in 20056. In addition, the level of trade (exports +
imports) in Korea was 21% of GDP in 1962, compa-
red to 59% in EAC in 20077.
Korea was a post-conflict country, emerging from the
Korean War and faced constant threat of invasion from
the North. Similarly, Burundi, Rwanda and Uganda have
suffered from armed conflicts, which have been
followed by continued tensions.
Moreover, Koreans had developed a culture of tax
evasion, which became widespread under the Japa-
nese occupation as a form of resistance, but continued,
nonetheless, even after the end of its colonisation.
Similarly, many authors share the view that tax evasion
is widespread in EAC countries8.
Differences emerge on social dimensions. Health indica-
tors were similar but education levels were much higher
in Korea. Life expectancy was 55 years in 1962, against
54 in the EAC in 20079. However, gross secondary
school enrollment was 42% in 197110, against 35% in
the EAC in 200711.
Moreover, in contrast with the EAC, Korea’s tradition of
centralised government was centuries old.
Taxation systems, from the Three Kingdoms Era
dating back to 54 BC, had evolved into advanced
systems of delegation of powers to and control of the
local level. This system was severely affected by the Ja-
panese colonisation and the Korean War. However, it
would be fair to assume that institutions that were cen-
turies old were able to survive to some extent and pro-
vide a starting base for a new government, including
the tax administration.
Korean culture strongly emphasises education and
savings. Koreans traditionally invest enormously in the
education of their children. Indeed, the education
Domestic Resource Mobilisation for Poverty Reduction in East Africa: Lessons for Tax Policy and Administration
4 2005 was chosen as a reference year in this section because in the World Development Indicators (WDI) database – our main source for PPP GDP atconstant value - PPP exchange rates are available for this year only. In interpreting these PPP and inflation adjusted figures, one should bear in mind thatinflation adjustments over long periods of time – here five decades – are subject to significant inaccuracies, especially when the structure of economieshave changed significantly, as it is the case for Korea. Inaccuracies are caused in particular by the significant changes, which occur over long periods inthe basket of reference goods and services used to calculate inflation.5 WDI, data missing for some EAC countries after 20056 WDI, data missing for some EAC countries after 20057 WDI, data missing for some EAC countries after 20078 See for instance Matovu (2008) on Uganda, and Muriithi and Moyi (2003) in Kenya.9 WDI, population-weighted average, data missing for some EAC countries after 200710 WDI, no data is available before 1971, and no other education than secondary school enrollment indicator could be found.11 WDI, population-weighted average, data missing for some EAC countries after 2007
85

system under the empires was designed to identify
talented students from lower class and provide them
with rapid career progress in the administration. Stories
of poor students reaching the top of the hierarchy,
thanks to their talent and intelligence, abound in the
literature. This reflects the general sense that education
is a way to rapidly move up the social ladder. In addition,
learning to be frugal in spending and save is also
steeped in Korean tradition.
One other distinctive aspect was the strength of
Korea’s national sentiment. It has been sustained by a
relatively united people and fueled with an urge to catch
up with Japan. This contrasts sharply with a history of
ethnic tensions found in the EAC and South Africa. The
global environment in several respects was more fa-
vourable in Korea than it is today. International compe-
tition was not as fierce as today and Korea could take
advantage of its low wages in those days more easily
than Africa today, which is competing with cheap la-
bour in China and India. Then Korea was not bound by
many trade agreements or regional tariff structure as
many African countries are today, and therefore had
much more freedom to negotiate its trade policies.
On the other hand, many African countries can benefit
from increasingly integrated regional markets that are
significantly larger than the domestic market of Korea at
the time.
Importantly, the ongoing digital revolution is offering
African countries many opportunities to increase
productivity, including in the area of taxation that Korea
did not have at the time.
Korea’s tax experience
In this section, Korea’s tax reforms are set out chrono-
logically, presenting policies and administrative reforms
in each phase. This section is mostly descriptive, while
Domestic Resource Mobilisation for Poverty Reduction in East Africa: Lessons for Tax Policy and Administration
86
0%
20%
30%
1953 1963 1973 1983 1993 2003
Tax revenues(centralgovernment)
Total centralgovernmentexpenditure (ind.military, exd.socialcontributions)
Total grants(includingmilitary)
25%
15%
10%
5%
% o
f GDP
creation of NTS
Figure 3.3: Central tax revenues and expenditures over the past 50 years
Source: MOSF, NTS, WDI, calculations by the authors
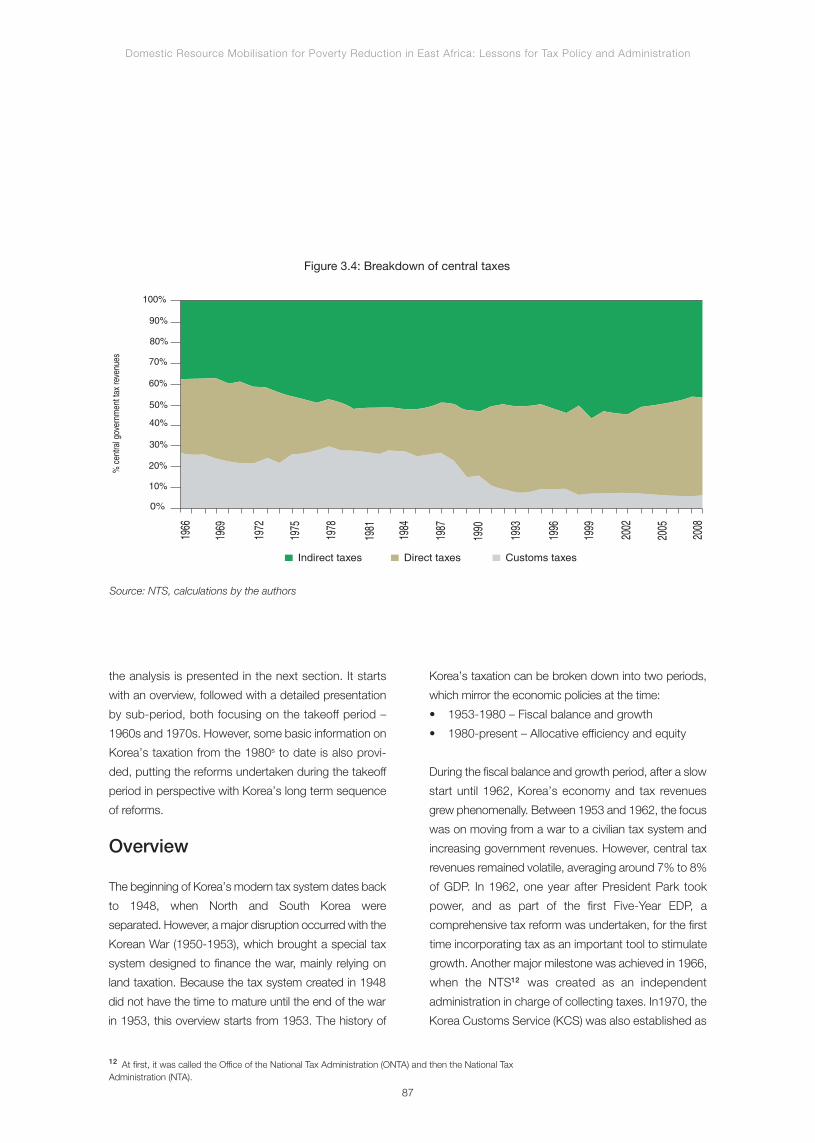
the analysis is presented in the next section. It starts
with an overview, followed with a detailed presentation
by sub-period, both focusing on the takeoff period –
1960s and 1970s. However, some basic information on
Korea’s taxation from the 1980s to date is also provi-
ded, putting the reforms undertaken during the takeoff
period in perspective with Korea’s long term sequence
of reforms.
Overview
The beginning of Korea’s modern tax system dates back
to 1948, when North and South Korea were
separated. However, a major disruption occurred with the
Korean War (1950-1953), which brought a special tax
system designed to finance the war, mainly relying on
land taxation. Because the tax system created in 1948
did not have the time to mature until the end of the war
in 1953, this overview starts from 1953. The history of
Korea’s taxation can be broken down into two periods,
which mirror the economic policies at the time:
• 1953-1980 – Fiscal balance and growth
• 1980-present – Allocative efficiency and equity
During the fiscal balance and growth period, after a slow
start until 1962, Korea’s economy and tax revenues
grew phenomenally. Between 1953 and 1962, the focus
was on moving from a war to a civilian tax system and
increasing government revenues. However, central tax
revenues remained volatile, averaging around 7% to 8%
of GDP. In 1962, one year after President Park took
power, and as part of the first Five-Year EDP, a
comprehensive tax reform was undertaken, for the first
time incorporating tax as an important tool to stimulate
growth. Another major milestone was achieved in 1966,
when the NTS12 was created as an independent
administration in charge of collecting taxes. In1970, the
Korea Customs Service (KCS) was also established as
Domestic Resource Mobilisation for Poverty Reduction in East Africa: Lessons for Tax Policy and Administration
12 At first, it was called the Office of the National Tax Administration (ONTA) and then the National TaxAdministration (NTA).
87
Figure 3.4: Breakdown of central taxes
Source: NTS, calculations by the authors
Direct taxes Customs taxesIndirect taxes
0%
1966
1969
1972
1975
1978
1981
1984
1987
1990
2002
2005
2008
1999
1996
1993
10%
20%
30%
60%
100%
90%
80%
70%
50%
40%
% c
entra
l gov
ernm
ent t
ax re
venu
es

an independent organisation, with the mission to col-
lect tariffs but also to provide first class services in res-
ponse to growing trade volumes. The creation of NTS
marked the beginning of a rapid growth in revenues.
From then on, central tax revenues increased drama-
tically from 9% to reach around 15% in 1980 (7% to
11% for domestic taxes alone). Over the same period,
governmentexpenditures declined from an average of
20% of GDP to 15%, achieving fiscal balance. As
inflation started to increase following the 1973 oil crisis,
equity measures were introduced in 1974, including
tax-based safety nets and comprehensive income tax.
Equity measures were then improved and mainstrea-
med from the 1980s. Another significant development
was the introduction of VAT in 1976.
From 1980, along with the national strategy, tax
policies shifted to liberalisation in order to minimise
distortions and ensure equity. Taxes became more
neutral and the focus was on maintaining fiscal balance,
and further broadening the tax base by curtailing
exemptions and equity.
First, an analysis of the composition of tax revenues
shows that Korea has heavily relied on indirect taxes,
significantly more than international benchmarks.
Indirect taxes progressively increased from about 45%
to 55% of total taxes, against an average of 32% in
OECD countries in 200513. The progressive increase of
indirect taxes’ share was initiated in 1960 during the
so-called tax reforms of the Democratic Party. The
thinking then was that in a low-income country, indirect
taxes were easier to collect.
Second, customs taxes were designed to promote
strategic export sectors during the 1960s/1970s, and
dramatically reduced from the 1980s as a result of
liberalisation. Customs revenues remained just below
30% of central government revenues from the 1960s
through the 1970s and until about the mid-1980s.
During the take-off period, import tariffs were removed
or significantly reduced on imports of inputs to support
strategic infant industries. Similarly, tariffs were reduced
for exports of the same industries. Furthermore, import
tariffs were raised to protect the domestic market from
foreign competitors in the priority industries. The
reduction in customs taxes in the mid1980s was driven
by trade liberalisation policy. From the mid-1980s,
customs revenue has fallen as a share of total central
government revenue to about 8%, due to reductions in
customs tax rates. Direct taxes increased from 1989 to
compensate for that loss. This increase was largely
driven by two reforms: (i) a more comprehensive
income tax system was introduced, including financial
revenues; and (ii) introduction of taxes on real estate
gains in 1990 in order to curb rising speculation.
Measures to improve performance of customs and local
taxes are not discussed further in this paper. Customs
taxes are not covered in detail because the EAC
integration process and international trade agreements
reduced the importance of customs taxes in the revenue
composition of EAC countries. In addition, local taxes
are not discussed, because they remained at relatively
low levels during the 1960s and 1970s. Indeed, up until
1987, the share of local taxes was consistently around
10% of total taxes (1% of GDP). However, it is worth
noting that local taxes have played an increasingly
important role in financing public services from the
1980s14.The basic information provided above is aimed
at giving a sense of the relative contribution of central
domestic taxes to total revenues.
Domestic Resource Mobilisation for Poverty Reduction in East Africa: Lessons for Tax Policy and Administration
13 OECD (2007)14 In 1988, the share of local taxes to total taxes suddenly increased to about 14%, to progressively reach just over 20% of total taxes in 2006 (5% ofGDP) (Choi, 2008). This can be compared to the average of the share of local taxes in other OECD countries, which is 13.8% (Kim, 2005). The suddenincrease in 1987 was driven by a new excessive land holding tax to help curb land speculation, and it was administrated locally. In 1989, this ratio thenincreased to around 20%, due the tobacco sales tax being changed from a national to local tax. This seems to have been part of the preparations, in1989, for an election campaign, whereby tobacco sales tax was changed to a local tax in order to make it a major source of revenue for local govern-ments. This has indeed been the case, with the reallocation of the tobacco tax providing local governments with an additional 39.8% of tax revenues in1989 (Choi & Hyun, 1997).
88

Domestic Resource Mobilisation for Poverty Reduction in East Africa: Lessons for Tax Policy and Administration
89
Box 3.1: Summary of tax incentives during the takeoff phase and continuous improvement
Though the incentives introduced in the early 1960s remained the same throughout Korea’s takeoff phase,
their design was improved frequently until the liberalisation period, in part to address issues with firms
abusing these preferential treatments. In trying to learn from Korea’s experience, it is therefore important to
understand the reasons for the changes in the design of tax incentives that are particularly insightful.
First, in 1967, the accelerated depreciation incentive was improved benefits that are proportional to the
actual share of exports in a company’s sales. Indeed, export companies would initially quality for accelerated
depreciation, regardless of how much they would export. This resulted in abuses, with companies registering as
exporters even with very small shares of exports. Making the extent of the accelerated depreciation proportional to the
share of exports solved this issue.
Second, in 1974, key and strategic industries were given the choice between three types of incentives : tax
holidays, investment tax credit, and special depreciation. Tax holidays consisted of 100% exemption over the first
three years, then 50% for two years. The investment tax credit was 8% on foreign capital goods and 10% on
domestic capital goods. A special depreciation on 100% of asset value was also offered. This was decided after a
decade of trying different tax incentives. It was perhaps a clever way to let the market choose what incentive was best
for each type of industry, rather than the government trying to guess so.
Third, again in 1974, all incentives were unified under one law : «Tax exemption and reduction control law».
This was probably a way to improve the transparency of the incentive system, and hence eliminate duplications and
reduce abuses.
Incentive Effect
Incentives to increase savings Reduced tax on interest, dividends andcapoital gains
Increase returns from savings
Special Consumption Tax on luxury goods Reduces the opportunity cost of saving
Reduced income tax on listed companiesIncreases the demand for savings hence
interest rates
Greater share of consumption tax in thetax mix
Increases the cost of consumption
Incentives to increase invest-ment in priority sectors
Income tax reduction Increases Return On investment (ROI)
VAT exemption on export products Increases ROI
Accelerated depreciation Increases ROI
Investment tax credit Increases ROI
Reduced taxes on inputs for exportindustries
Increases ROI
Source: consolidated by the authors from various sources

1953-66: Improving policies
and laws
From 1953 to 1966, the central objective was to
increase tax revenues and promote export-led growth.
Following the end of the Korean War, attempts to
increase tax revenues took many different forms. New
taxes, such as the education tax (a surtax on income
tax), asset revaluation tax and foreign exchange tax
were introduced in 1958. It is in 1960 that the strategy
to raise indirect tax rates and reduce direct taxes was
introduced for the first time. It was done so considering
that indirect taxes were easier to collect in a poor coun-
try with a large informal sector. This resulted in indirect
taxes contributing a prominent share to tax revenues in
Korea, a feature that still prevails today.
For the first time during this period, tax incentives,
aiming at stimulating growth, were introduced. In 1960,
tax exemptions were introduced to support export,
investment and SMEs in key industries. For instance, a
30% corporate tax rate exemption was granted to
export businesses. It was, however, only in 1961, when
President Park took power that tax incentives for growth
assumed a truly central role. He created the Economic
Planning Board, in charge of defining the 5-year EDPs.
Tax reforms, as well as other policy tools were integrated
in the EDPs and designed to achieve its goals. The first
5-year EDP focused on export manufacturing. As a
consequence, 10 tax laws were revised to introduce a
complete system of incentives. It included a drastic
reduction of taxation of capital, tariffs on inputs, and
income in “Key and strategic industries” and export
industries. A 50% exemption on income tax was granted
to all foreign exchange-earning businesses. Machinery
and equipment directly employed for foreign exchange-
earning activities benefited from a special depreciation, at
rates 30% higher than the standard rates. Tax on interest
income was close to zero to encourage savings. In
addition, corporate taxes were greater for open listed
companies than for closely-held companies to increase
investment opportunities through capital markets. Box
3.3.1 provides an overview of tax incentives used by
Korea and of some of their improvements over time.
The Park Administration also introduced a number of
reforms aimed at improving administrative efficiency.
There were attempts to simplify the tax administration
- such as absorbing the textile tax into the commodity
tax in 1953, streamline the functioning of regional tax
offices, and tax officials were screened to keep the best
performing staff.
Though growth did start in 1963, with a rate of 9.3%
which was later sustained, tax revenue performance fell
short of expectations, remaining at around 7% of GDP.
The Park administration analysed the reasons for the fai-
lure which led them, from 1966, to refocus their
approach from tax policy reforms to their implementation.
1966-74: Focusing
on implementation
Tax incentives continued to be used extensively during
this period and the following one (Chapter 3.4). But they
were not developed further because, as most other
policies, they did not change in nature following their
introduction during the first 5-year EDP. Most tax
incentives were introduced in the previous EDP15. The
subsequent changes only concerned the sectors to
which they applied and the rates of exemptions,
reflecting changes in the sectors which were given
priority. In addition, their design was improved. These
improvements have been summarized in Box 3.1. The
key reform of this period was the establishment in 1966
of the National Tax Service (called Office of
National Taxation at the time) in order to dramatically
reinforce tax administration. NTS was created as an
independent government agency, with the mission to
International experience and lessons
15 One exception is the investment tax credit, which was introduced in 1968.
90

assess and collect direct and indirect central domestic
taxes. Before its creation, these functions were carried
out by the Tax Bureau under the Ministry of Finance.
The Bureau was responsible for formulating tax policies
and drafting tax laws.
Many analysts interpreted the disappointing perfor-
mance of the previous policy-focused reforms as a re-
sult of weak implementation, and recommended the
creation of a tax administration with strong capacity.
After significant tax reforms in 1961, a comprehensive
tax reform in 1962 and numerous other reforms were
introduced until 1965, when tax revenues grew less
than the economy and remained very volatile. In 1954,
the Nathan Report on tax policy suggested that impro-
vements in tax investigation and collection would be im-
perative to increase tax revenues (KDB, 1954). In 1964,
the Economic Planning Bureau (EPB) recommended
creation of an independent tax agency. In 1965, during
his mission to Korea as a member of the Nathan eco-
nomic advisor, R.A. Musgrave, from Harvard University,
also emphasised the need to establish a tax agency fo-
cused on fighting tax evasion (NTS, 1986).
Subsequently, President Park formed a Special Inves-
tigation Team, with the mission to assess the potential
revenue increase from a fully capacitated administra-
tion. The team was created in September 1965. It was
led by a secretary, reporting directly to him (Mr. Lee,
Nak-Sun), and comprised 12 staff from the office of the
President (the Blue House), the Board of Audit and Ins-
pection, and the prosecution service. It was an excel-
lent combination of political leadership, professional
expertise and investigation power. The President en-
trusted the team with full powers to conduct tax inves-
tigation, and provided the team leader with a mission
letter saying: “all executive and investigating authorities
as well as all chiefs of state and local government agen-
cies must comply with the team's requests related to its
duty.” (KIPF, 1997).
The investigation results convinced President Park of
the benefits of creating the National Tax Service. The
Special Investigation Team decided to focus on the
textile industry as an example. It was chosen because
of its complex value chain, which provided numerous
opportunities for tax evasion. By the end of the year,
the $ Team had uncovered tax evasions worth US$9.3
million in that $ industry alone. Though the investiga-
tions concerned a small fraction of the economy, the
extent of evasion uncovered was very substantial, at
almost 5% of the total tax revenues collected in 1965
(US$205 million). The outcome convinced President
Park that tax revenues could increase substantially by
strengthening the tax administration, prompting him to
create the NTS in 1966.
NTS’s implementation relied on the following principles:
• full top-down accountability;
• full empowerment;
• dramatic strengthening of enforcement capacity;
• promoting voluntary compliance; and
• increasing legitimacy.
Full top-down accountability
The President made a strong public and personal
commitment to meeting revenue mobilisation objectives.
He appointed Mr. Lee, the head of the Special Investi-
gation Team, who had won his confidence as the NTS
Commissioner. He was in the process making him fully
accountable for his recommendations. President Park
set targets based on the recommendations of the Team,
and personally monitored results. One anecdotal
evidence best illustrates how serious the level of the
President’s commitment was. Confident of the high
potential of taxation, in 1966, he asked NTS to collect
tax revenues of KRW70 billion (US$258 million), an
amount 30% higher than revenues in the previous year,
and which many considered to be over ambitious. As a
Domestic Resource Mobilisation for Poverty Reduction in East Africa: Lessons for Tax Policy and Administration
91
symbolic gesture of his resolve, President Park chan-
ged both his car plate number and telephone number
for “700”16 (KIPF, 1997). Eventually, the Commissioner
met the target.
In addition, a chain of targets, called the target revenue
approach, were set at all levels of the organisation, from
the Commissioner of NTS to the heads of Regional Tax
Offices to the heads of District Tax Offices to the division
managers, down to the tax officers. These targets were
broken down by geographical areas and tax categories.
Monetary incentives were introduced at all levels, which
rewarded outperformers with bonuses and penalised
underperformers.
The President made a public commitment to
implement a zero-tolerance policy for corruption. He
explicitly pointed out that repairing the shame and
blame of the past resulting from corruption was one of
the main objectives of the NTS creation. A clear and
strict rule established that whoever was involved in
corruption would be fired and punished. This was
enforced by a special anti-corruption team of 20
young, committed government officials, who were
selected through the Senior Government Official
Examination. To increase their visibility, they used to
wear blue neckties and their slogan was an old
Korean proverb, which means “Treat gold as stone”.
The fight against corruption also targeted bribers. In
the first years of President Park’s rule, 24 leading
business men were arrested for corruption17.
Full empowerment
Such stringent accountability system would not be
successful without a commensurate empowerment.
NTS benefited from full empowerment under two
forms: political and financial.
First, NTS received full political support from the Presi-
dent. The Commissioner, as a result of NTS’s intensive
investigations, faced high levels of pressure powerful
people. But he didn’t budge because of the President’s
unstinted support.
Second, NTS was given resources to dramatically
increase its size and capability. From 1966 to 1969, in
just three years, its budget increased by 71% in real
terms, and its number of staff per inhabitant by 57%.
During that short time, staff strength rose by 3747
personnel, from 5500 to 9247. The increase benefited
both headquarters and local offices. A substantial part
of these resources was used to strengthen the
administration’s enforcement capacity.
Dramatic strengthening ofenforcement
First, research functions were significantly strengthe-
ned. These functions are of course not limited to en-
forcement only. Research, for instance, can be used to
assess the impact of tax policies on equity, or on com-
petitiveness. We focus here on two research functions
that are critical for enforcement: the assessment of re-
venue targets at a macro level; and at the tax payer
level. If properly conducted, these two functions can
help ensure targets are realistic and that appropriate
taxpayers are identified for investigation. NTS research
department extensively developed and used differen-
tial tax payer management systems. They consist of
cross-checking all sources of information available – in-
cluding sector level surveys, and individual reports –
about tax payers to categorise them into degrees of
presumed compliance. High income earners categori-
sed in the low degrees of presumed compliance would
be targeted in particular for in-depth investigation. In
addition, to secure highly qualified and fully committed
tax officials, the National Tax Officials Training Institute
was established in 196718. In 1968, the institute had
88 staff. Information Technology was introduced in the
very early days, in 1970, to facilitate processing of large
amounts of information. Computers were installed and
training of in-house IT specialists began in earnest. The
Domestic Resource Mobilisation for Poverty Reduction in East Africa: Lessons for Tax Policy and Administration
16 In Korea, there is a unit which is worth 0.1 billion. 70 billion is therefore equivalent to 700 of this unit.17 See www.sjsu.edu/faculty/watkins/park.htm18 It was then replaced by the National Tax University in 1980 (up to 2001) of which all graduates were employed by NTS.
92

strong IT support also enabled introduction of the Ge-
neral Income Tax in 1975 and VAT in 1977, which in-
volve heavy processing of income and transaction data
(KIPF, 1997).
Second, NTS dramatically strengthened its capacity
to conduct on-site investigations. Before the creation
of NTS, the division responsible for on-site investi-
gations within the Ministry of Finance was also res-
ponsible for other tasks, such as staff performance
evaluations. It was therefore not possible to carry out
intensive tax investigations until NTS was created,
with one investigation division at headquarters, and
one in each field office. Investigations were sequen-
ced in several campaigns, each with its own focus.
For instance, in 1966 the focus was on high income
earners. In 1969, the focus shifted to tax payers with
a poor reporting record. Each campaign was care-
fully prepared by intensive data analysis and field sur-
veys.
Third, NTS heavily invested in decentralisation.
Between 1966 and 1968, the number of staff in district
tax offices increased from 4,906 to 8,033, which
represents a 64% increase. Research teams were
created in each local tax office. Investigation teams
were reinforced. At its creation, NTS had four Regional
Tax Offices and 77 District Tax Offices. In its first two
years, two new Regional Tax Offices and 14 District Tax
Offices were added.
Fourth, NTS enforced a policy of full registration and
simplified tax filing for small businesses. One registra-
tion was required for each business location. This
system lasted until 2008, when registration by business
unit (with one consolidated balance sheet) became re-
quired for every business. Given the geographical na-
ture of the full registration policy, local offices were in
charge of enforcing it. Relevant regional or district tax
offices were in charge of ensuring that all businesses
were registered and of all the subsequent steps of the
tax cycle, including collecting returns, payments, and
investigation. Full registration would not have yielded
results had the small businesses been requested to
submit tax returns based on book-keeping and tax in-
voices. Instead, small businesses were simply required
to pay tax calculated with the Standard Assessment
Method, which has been widely used in Korea for both
income tax and sales taxes. It was later replaced by
VAT. The Method estimates income and sales based
on a series of objective and easy-to-observe measures.
These can be used, for instance, for calculating the
number staff or machines. Ratios based on these mea-
sures and defined in a standard assessment guide were
then used by tax officials to determine the base for cal-
culating taxes, either gross sales in the case of sales
tax or gross income in the case of income tax. Tax
payers were given the option to file full returns to de-
termine their taxes if they felt they would pay less taxes
(Choi, 1990).
Promoting voluntary compliance
Many efforts were directed towards encouraging volun-
tary and unvarnished submissions and registration of tax
payers. At the same time, a system of incentives was
put in place to reward tax payers using transparent re-
porting methods and penalise those who were not.
The “Green Report System”, established in 1965, was
the Government’s first effort to introduce voluntary
self-assessment system. Once a taxpayer was found
to be a green reporter as a result of faithful reporting, he
was granted preferential treatments, such as tax
deductions and installment payments. As an illustration,
one of the criteria for becoming a green reporter was
that field investigations would confirm earnings within
+/-5% of the amount originally reported. However,
some green reporters exploited the system to evade
tax. As a result, from 1968, additional control measures
were taken, such as field investigations of green
reporters.19
Domestic Resource Mobilisation for Poverty Reduction in East Africa: Lessons for Tax Policy and Administration
19 The Green Report System prevailed until the full introduction of voluntary self-assessment system of income tax in 1995.
93
NTS also made substantial efforts to encourage book
keeping, as a way to increase compliance and
accuracy of tax submissions. These efforts started in
1966 and continue uninterrupted until today. The
number of taxpayers using book keeping was 5163 in
1966. It was 219,000 in 1987 and 1,585,000 in 2007,
which constituted 33.2% and 54.7% respectively of
Global Income Taxpayers 20.
From 1966, NTS held seminars for various types of
businesses and conducted promotional campaigns
through mass media to encourage book keeping. In
1972, Regional and District Tax Offices were given
responsibility to actively guide tax payers on double-
and single-entry book keeping techniques. Since 1985,
NTS has maintained a database of target taxpayers to
guide them on book keeping. It also distributed a
simplified book keeping form in 1999. In 2004, tax rates
were raised for negligent book keepers. Certificated Tax
Attorneys (CTA) were trained to help taxpayers – mainly
personal taxpayers and small businesses – produce
compliant books, tax returns and payment claims. In
2007, a total of 7,260 CTAs were registered.
Increasing legitimacy
With strong emphasis on enforcement, it was critical at
the same time to increase legitimacy of taxation.
Zero-tolerance policy for corruption played an impor-
tant role in this regard. As explained in Chapter 3.3.1,
the President publicly committed to eradicate corrup-
tion and introduced very visible anti-corruption mea-
sures. This was important as tax payers initially had a
negative image of tax officials because of widespread
corruption. Interestingly, it was observed that as their
image improved, the morale of the tax officials also im-
proved. Public relations and education were also em-
phasised. In 1967, Government set March 3 as the Tax
Day to be observed every year in order to promote a
clean image of the tax administration, create awareness
of the central role of taxation in meeting the nation’s de-
velopment goals, and encourage self-compliance. The
event was chaired by President Park himself. Some of
the interesting features of the Day included award of
prizes to the best taxpayer and involvement of national
celebrities. The Tax Day is still observed today21. In
addition, as part of the public relation effort, an
NTS-sponsored Woman volleyball team was created.
A greater emphasis was also put on improving the
fairness of taxation. This involved improving the
accuracy of the Standard Assessment Method (see
Chapter 3.3.3). It was very basic at the beginning, and
became gradually more sophisticated. At the creation of
NTS, research teams in Regional Tax Offices undertook a
revision of the ratios of the standard assessment based on
field surveys of reference businesses. Subsequently, in
1975, a multi-stakeholder group -- involving tax adminis-
trators, tax specialists, representatives from the business
community and financial institutions -- was set up to revise
the guidelines. In 1978, the method was adjusted based
on geographic considerations, and business cycles were
taken into account. In 1981, the standard ratios also re-
flected many other factors, such as the amount of capital,
type of facility, business reputation and so on.
1974-80: Strengthening equity
and introducing VAT
The main features of tax reforms of this period were
strengthening of equity as an objective of taxation, and
introduction of VAT.
Strengthening equity
Following the 1973 oil crisis, the equity objective
became more important. Korea experienced two years
Domestic Resource Mobilisation for Poverty Reduction in East Africa: Lessons for Tax Policy and Administration
20 Global Income Tax was introduced in 1974.21 In 2010, four show business Korean stars were appointed goodwill ambassadors. Seehttp://english.chosun.com/site/data/html_dir/2010/06/01/2010060101043.html
94
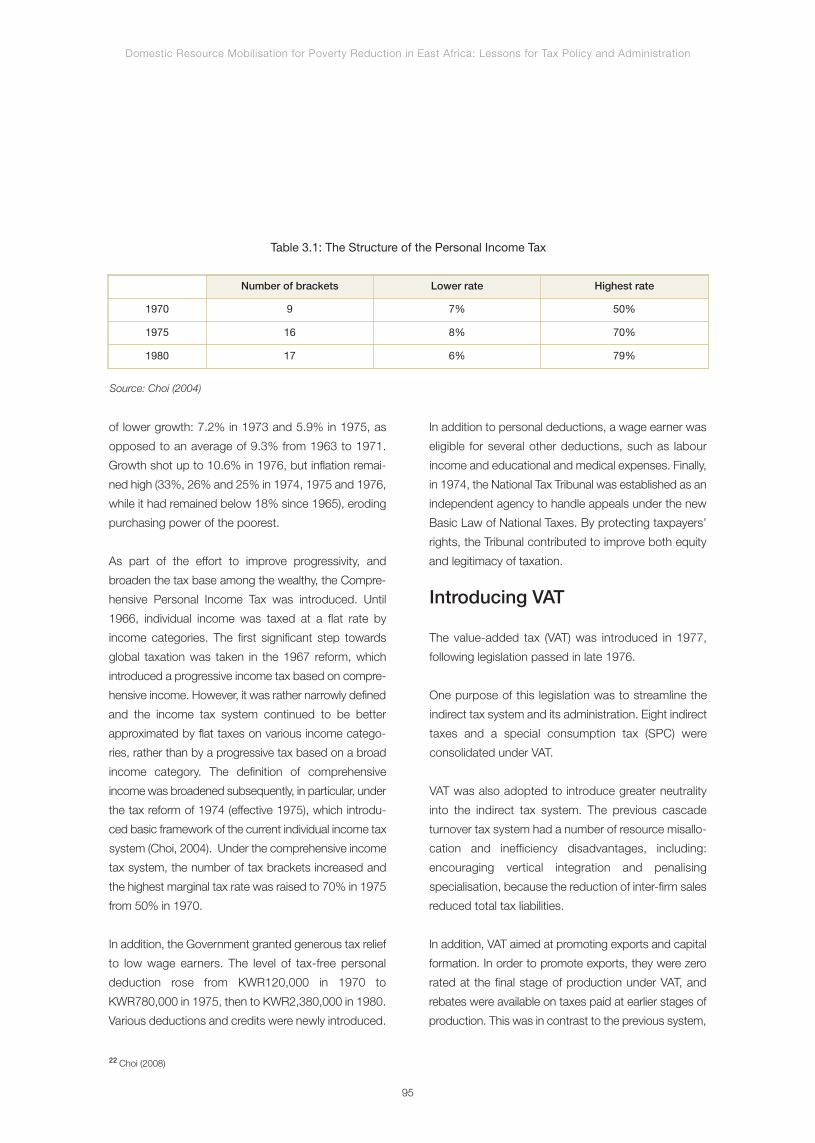
of lower growth: 7.2% in 1973 and 5.9% in 1975, as
opposed to an average of 9.3% from 1963 to 1971.
Growth shot up to 10.6% in 1976, but inflation remai-
ned high (33%, 26% and 25% in 1974, 1975 and 1976,
while it had remained below 18% since 1965), eroding
purchasing power of the poorest.
As part of the effort to improve progressivity, and
broaden the tax base among the wealthy, the Compre-
hensive Personal Income Tax was introduced. Until
1966, individual income was taxed at a flat rate by
income categories. The first significant step towards
global taxation was taken in the 1967 reform, which
introduced a progressive income tax based on compre-
hensive income. However, it was rather narrowly defined
and the income tax system continued to be better
approximated by flat taxes on various income catego-
ries, rather than by a progressive tax based on a broad
income category. The definition of comprehensive
income was broadened subsequently, in particular, under
the tax reform of 1974 (effective 1975), which introdu-
ced basic framework of the current individual income tax
system (Choi, 2004). Under the comprehensive income
tax system, the number of tax brackets increased and
the highest marginal tax rate was raised to 70% in 1975
from 50% in 1970.
In addition, the Government granted generous tax relief
to low wage earners. The level of tax-free personal
deduction rose from KWR120,000 in 1970 to
KWR780,000 in 1975, then to KWR2,380,000 in 1980.
Various deductions and credits were newly introduced.
In addition to personal deductions, a wage earner was
eligible for several other deductions, such as labour
income and educational and medical expenses. Finally,
in 1974, the National Tax Tribunal was established as an
independent agency to handle appeals under the new
Basic Law of National Taxes. By protecting taxpayers’
rights, the Tribunal contributed to improve both equity
and legitimacy of taxation.
Introducing VAT
The value-added tax (VAT) was introduced in 1977,
following legislation passed in late 1976.
One purpose of this legislation was to streamline the
indirect tax system and its administration. Eight indirect
taxes and a special consumption tax (SPC) were
consolidated under VAT.
VAT was also adopted to introduce greater neutrality
into the indirect tax system. The previous cascade
turnover tax system had a number of resource misallo-
cation and inefficiency disadvantages, including:
encouraging vertical integration and penalising
specialisation, because the reduction of inter-firm sales
reduced total tax liabilities.
In addition, VAT aimed at promoting exports and capital
formation. In order to promote exports, they were zero
rated at the final stage of production under VAT, and
rebates were available on taxes paid at earlier stages of
production. This was in contrast to the previous system,
Domestic Resource Mobilisation for Poverty Reduction in East Africa: Lessons for Tax Policy and Administration
22 Choi (2008)
95
Number of brackets Lower rate Highest rate
1970 9 7% 50%
1975 16 8% 70%
1980 17 6% 79%
Table 3.1: The Structure of the Personal Income Tax
Source: Choi (2004)
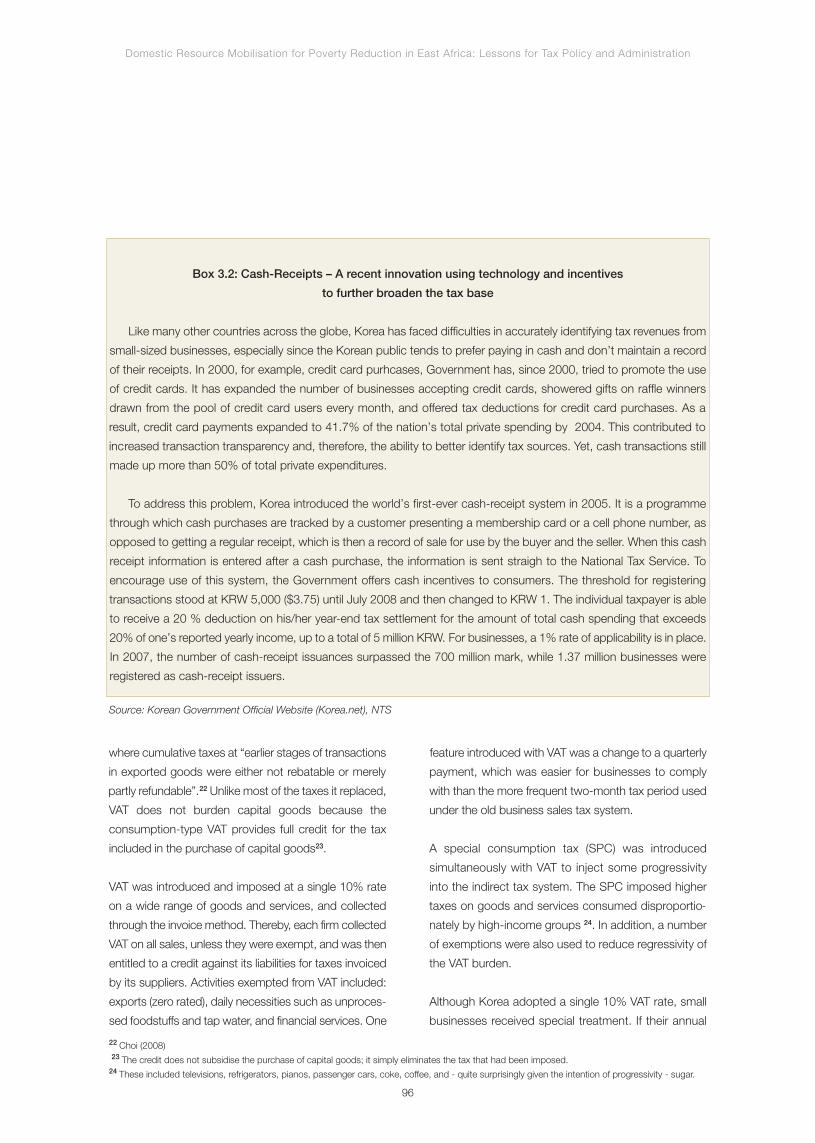
where cumulative taxes at “earlier stages of transactions
in exported goods were either not rebatable or merely
partly refundable”.22 Unlike most of the taxes it replaced,
VAT does not burden capital goods because the
consumption-type VAT provides full credit for the tax
included in the purchase of capital goods23.
VAT was introduced and imposed at a single 10% rate
on a wide range of goods and services, and collected
through the invoice method. Thereby, each firm collected
VAT on all sales, unless they were exempt, and was then
entitled to a credit against its liabilities for taxes invoiced
by its suppliers. Activities exempted from VAT included:
exports (zero rated), daily necessities such as unproces-
sed foodstuffs and tap water, and financial services. One
feature introduced with VAT was a change to a quarterly
payment, which was easier for businesses to comply
with than the more frequent two-month tax period used
under the old business sales tax system.
A special consumption tax (SPC) was introduced
simultaneously with VAT to inject some progressivity
into the indirect tax system. The SPC imposed higher
taxes on goods and services consumed disproportio-
nately by high-income groups 24. In addition, a number
of exemptions were also used to reduce regressivity of
the VAT burden.
Although Korea adopted a single 10% VAT rate, small
businesses received special treatment. If their annual
Domestic Resource Mobilisation for Poverty Reduction in East Africa: Lessons for Tax Policy and Administration
22 Choi (2008)23 The credit does not subsidise the purchase of capital goods; it simply eliminates the tax that had been imposed.
24 These included televisions, refrigerators, pianos, passenger cars, coke, coffee, and - quite surprisingly given the intention of progressivity - sugar.
96
Box 3.2: Cash-Receipts – A recent innovation using technology and incentives
to further broaden the tax base
Like many other countries across the globe, Korea has faced difficulties in accurately identifying tax revenues from
small-sized businesses, especially since the Korean public tends to prefer paying in cash and don’t maintain a record
of their receipts. In 2000, for example, credit card purhcases, Government has, since 2000, tried to promote the use
of credit cards. It has expanded the number of businesses accepting credit cards, showered gifts on raffle winners
drawn from the pool of credit card users every month, and offered tax deductions for credit card purchases. As a
result, credit card payments expanded to 41.7% of the nation’s total private spending by 2004. This contributed to
increased transaction transparency and, therefore, the ability to better identify tax sources. Yet, cash transactions still
made up more than 50% of total private expenditures.
To address this problem, Korea introduced the world’s first-ever cash-receipt system in 2005. It is a programme
through which cash purchases are tracked by a customer presenting a membership card or a cell phone number, as
opposed to getting a regular receipt, which is then a record of sale for use by the buyer and the seller. When this cash
receipt information is entered after a cash purchase, the information is sent straigh to the National Tax Service. To
encourage use of this system, the Government offers cash incentives to consumers. The threshold for registering
transactions stood at KRW 5,000 ($3.75) until July 2008 and then changed to KRW 1. The individual taxpayer is able
to receive a 20 % deduction on his/her year-end tax settlement for the amount of total cash spending that exceeds
20% of one’s reported yearly income, up to a total of 5 million KRW. For businesses, a 1% rate of applicability is in place.
In 2007, the number of cash-receipt issuances surpassed the 700 million mark, while 1.37 million businesses were
registered as cash-receipt issuers.
Source: Korean Government Official Website (Korea.net), NTS

sales were below a certain amount (KRW24 million, or
US$50,000 when VAT was first introduced), they were
taxed at a rate of 2% of turnover. The special treatment
for small businesses tended to be abused by them
because they were prone to under-report their
turnover. To tackle the issue, Government has tried to
expose transactions as much as possible with various
measures, such as increasing the use of credit cards
and introducing cash receipts system (see Box 3.2). As
a result of these efforts, proportion of special taxpayers
decreased below 40% by 2006.
Careful examination and extensive preparation prece-
ded the introduction of VAT. The Economic Planning
Board and Ministry of Finance worked very closely in
formulating and implementing VAT. This was done to
ensure that there was close alignment of the new tax
with the ongoing five-year development plans (the
purpose of introducing VAT in the late 1970s is noted
above). Foreign tax experts and well-known institutions
(e.g., the IMF) assisted in developing the VAT system.
Government launched extensive information
campaign and education programmes about a year
before VAT became effective. These included educa-
ting taxpayers and the general public about the
characteristics of the new tax, as well as about new
requirements which taxpayers would have to comply
with. VAT guidebooks were distributed through trade
and business associations, and nationwide test exer-
cises involving filing of tax returns were carried out
before VAT was introduced.
Government expanded and retrained the tax adminis-
tration personnel. The number of staff at NTS
increased from 9,443 in 1976 to 11,442 in 1977. The
new recruits did not begin working for VAT straight
away and, instead, were put into other sections in order
to release more experienced staff for VAT administra-
tion. This was complemented by staff handbooks
prepared by NTS for officials working on VAT.
The success of VAT largely depended on the degree of
voluntary cooperation from the business community. In
order to build this support and allow for business input,
Government set up different committees, which inclu-
ded representatives from the Chamber of Commerce,
Korean Tax Accountants Association and other relevant
institutions.
A decentralised regional system was put in place. NTS
considered registration by operation important since VAT,
in principle, is imposed per place of business. In this light,
VAT administration – assessment, collection and investi-
gation – has been conducted mainly under the responsi-
bility of relevant regional or district tax offices. Initially, VAT
officers were specified for each area, where they were
responsible for almost all taxation procedures, including:
business registration, tax returns and payment, investi-
gation, and tax base development. In addition, they
provided guidance and reviewed tax reports to ensure
faithful compliance and early settlement of VAT disputes.
From its first year of introduction, a computerised
system was put in place to cross-check seller and
purchaser invoices of general tax payers. In the last half
of 1977, 7.2% of all invoices did not match, but in
1982, the proportion of mismatches decreased to
1.4%. Improved compliance enabled the administra-
tion to progressively decrease the number of tax
invoices processed.25
1980-today: Liberalisation
From the 1980s, in keeping with a policy of structural
adjustment and liberalisation, tax reform activities
slowed down.
The focus was on reducing the range of tax incentives
and broadening the tax base to improve allocation effi-
ciency. In 1982, liberal tax privileges of strategic indus-
tries were almost completely removed. The 1988 tax
reform significantly reduced remaining exemptions. This
Domestic Resource Mobilisation for Poverty Reduction in East Africa: Lessons for Tax Policy and Administration
25 Choi (2008)
97

effort has continued ever since, along with the 1998 re-
form, which removed VAT exemptions on professional
services, such as lawyers and accountants. In 1993,
the real-name system of financial transactions included
tax on capital income into the individual tax base, com-
pleting the efforts of the 1976 comprehensive income
tax to improve progressivity. In addition, a number of
ad-hoc revisions of tax policies were introduced to ad-
dress new issues as they arose.
To curb real estate speculation, the excessive land
holding tax in 1986 significantly increased land-related
taxes. These included taxes on capital gains and land
property. These measures have often been viewed as
ineffective, in part due to their not being comprehen-
sive and hence not creating enough incentives for the
wealthiest to reduce speculation26.
Following the 1997 Asian crisis, it became critical to
rapidly restructure inefficient chaebols. Incentives
were granted to transaction-related taxes, such as
capital gains, acquisition, and registration tax. For
instance, corporate assets after mergers and acqui-
sitions were exempted from registration tax.
As part of the efforts to reverse capital flight
prompted by the crisis, the Foreign Investment
Promotion Law (FIPL) was enacted in 1998. For
instance, foreign businesses and investors who made
investment in advanced technology in Korea were eli-
gible for exemption from individual and
corporate income taxes for the first seven years, and a
50% reduction for each of the following three years.
One of the more recent challenges faced by Korea has
been the ageing population. The National Pension Fund
was created in 1988 to help address this issue. Annual
contributions have grown to 7% of GDP today (see Fig 4).
According to OECD simulations, Korea’s public spending
on health and long-term care might rise by 6 to 9 percen-
tage points of GDP by 2050, the largest increase in the
OECD area. OECD recommends taking early action to
increase revenue so as to limit the long-term cost from the
higher fiscal burden27.
Domestic Resource Mobilisation for Poverty Reduction in East Africa: Lessons for Tax Policy and Administration
26 Choi (2004) p8127 Randall (2009)
98

Select lessons from an EAC perspective
Domestic Resource Mobilisation for Poverty Reduction in East Africa: Lessons for Tax Policy and Administration
28 The figure excludes local government revenues. It shows ‘central tax revenues’, but also ‘total central revenues including tax revenues, proceeds fromdivestitures, investment income and grants’, and ‘total central revenues including the former and social contributions’. Social contributions are mostlyconstituted of the National Pension Fund (NPF), which is the largest public fund in Korea. It was established in 1988 and has been largely accumulatingreserves rather than making payments. As revenues, including social contributions, were not available every year, they are indicated in dots. The mainpoint for this case study is that in the 1960s and 1970s, before the creation of the NPF, total central revenues were much lower than the EAC averageand much lower than in South Africa. In addition, after the creation of the NPF, total revenues including social contributions, remained below 26% up totoday, which is much lower than the OECD average of 37% today. This illustrates that Korea has continued its policy of low public expenditure.
99
US$
% of
GDP
23000
18000
13000
8000
3000
1990 2000 0%
5%
10%
15%
25%
40%
35%
30%
20%
198019701960-2000
GDP per capita, PPP (constantinternational 2000$)
Total central revenues (incl. socialcontributions)
Total central expenditure
Total central tax revenuesTotal central revenues (incl. fees,investment income, grants)
Figure 3.5: Government budget and growth 28
Source: WDI, calculations by the authors
While the previous section provided a narrative of
Korea’s tax reforms during its takeoff phase, this
section analyses two lessons of particular relevance to
EAC member countries. First, Korea achieved faster
results by focusing its tax policies on a few priorities fully
aligned with its national development strategy. Second,
Korea broadened its tax base by making its tax
administration both empowered and accountable.
Focusing on a few priorities
aligned with the national
development strategy
Like EAC member countries today, Korea, during its
takeoff years, was challenged by multiple and conflic-
ting tax objectives. They included increasing revenues,
allocating resources efficiently, stimulating savings and
investment, providing safety nets and promoting social
equity. However, stimulating investments or providing
safety nets, for instance, involve exemptions, which
unfortunately conflicts with the objectives of allocating
resources neutrally and broadening the tax base.
Korea focused its tax policies on a few priorities fully
aligned with its national development strategy. In the
1960s and 1970s, its national strategy, on one hand,
was to rapidly achieve fiscal balance through low level
of expenditure, and on the other, to promote growth by
supporting an infant industry policy. To this end, Korea
focused on increasing revenues from a very low base
up to a level still low by international standards,
broadening the tax base, and providing incentives to
strategic sectors.

Domestic Resource Mobilisation for Poverty Reduction in East Africa: Lessons for Tax Policy and Administration
29 GDP-weighted average, calculated by the authors from IMF staff reports.
100
Figure 3.6: Savings and investment in Korea
Source: Bank of Korea, WDI
5%
10%
15%
20%
30%
50%
45%
40%
35%
25%
0%
1980 2000199019701960
Investment (Private)
Total Domestic Savings
% of
GDP
The following illustrates the alignment of Korea’s tax
policies with three specific national strategies: (i) small
balanced budget; (ii) active export promotion; and (iii)
liberalisation.
Small and balanced
government budget
During the takeoff period and after 1980, government
budget was small by international standards, with tax
revenues and expenditures below 16% of GDP (see
Figure 3.5). Central tax revenues of 16% are in the
same range as in the EAC today and much lower than
in South Africa. Average tax revenues in 2008 in the
EAC stood at 16%29, ranging from 12% (Uganda) to
19% (Kenya). It was 28% in South Africa in 2008. In
addition, a study by Bahl, Kim and Park (1986)
compares Korea’s expenditure to 31 other developing
countries from 1973 to 1976, making adjustments to
ensure comparability. It finds that the average expendi-
ture share of GDP in Korea was significantly lower than
in the comparator countries (15.9% vs. 28.4%
including military expenditures, and 11% vs. 17.4% for
nondefense expenditure).
One of the main rationales for a small government
budget was to rapidly achieve fiscal balance. Achieving
fiscal balance primarily stemmed from an anticipated
decline in foreign aid. Following the Korean War, United
States was the main provider of aid to Korea, which
accounted for up to 45% of government revenues and
70% of imports. In 1957, USA unexpectedly announ-
ced that it was phasing out financial aid, which effecti-
vely started to decline from 1958. From that year,
addressing the resulting twin deficit became a central
objective of government policies. The government ex-
penditure was reduced from around 20% of GDP in the
early 60s to 16% in the 70s, while tax revenues were
increased from 9% to 15% during the same period.
Government has consistently achieved fiscal balance
from the mid-1970s.
The other important rationale was to encourage private
investment and growth. Korea’s development was
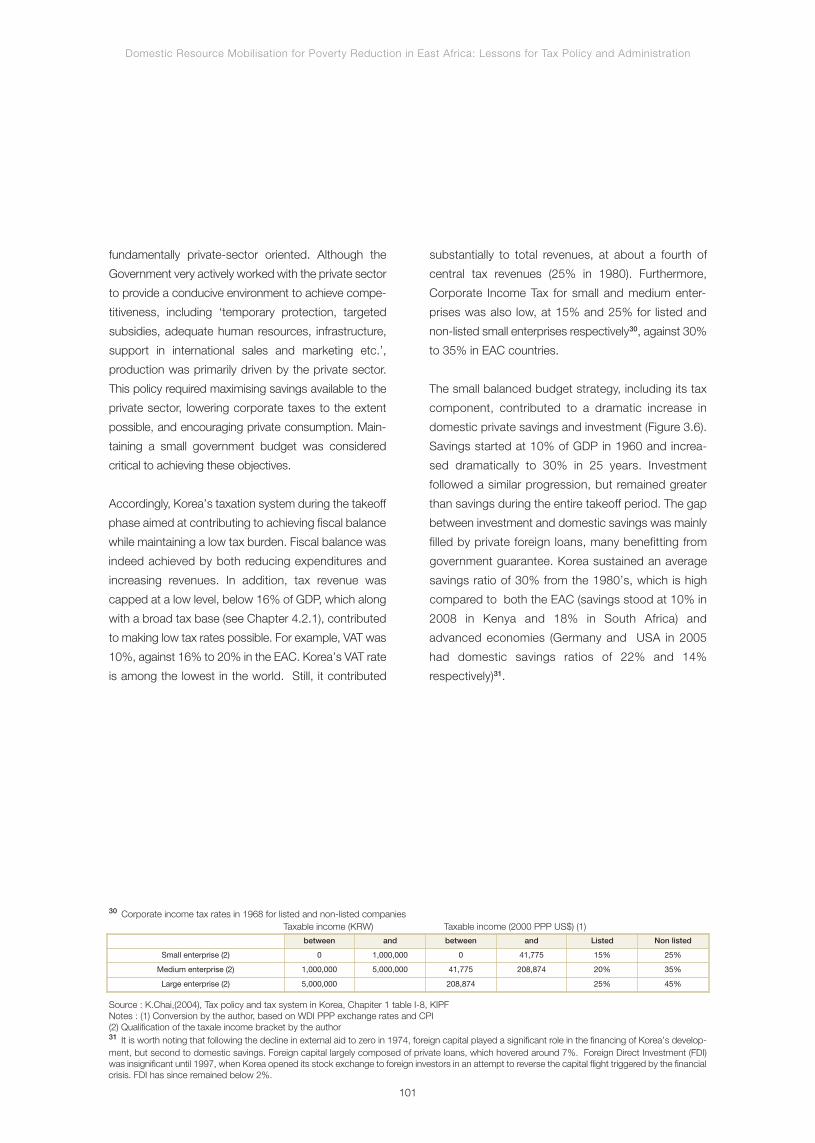
Domestic Resource Mobilisation for Poverty Reduction in East Africa: Lessons for Tax Policy and Administration
30 Corporate income tax rates in 1968 for listed and non-listed companiesTaxable income (KRW) Taxable income (2000 PPP US$) (1)
Source : K.Chai,(2004), Tax policy and tax system in Korea, Chapiter 1 table I-8, KIPFNotes : (1) Conversion by the author, based on WDI PPP exchange rates and CPI(2) Qualification of the taxale income bracket by the author31 It is worth noting that following the decline in external aid to zero in 1974, foreign capital played a significant role in the financing of Korea’s develop-ment, but second to domestic savings. Foreign capital largely composed of private loans, which hovered around 7%. Foreign Direct Investment (FDI)was insignificant until 1997, when Korea opened its stock exchange to foreign investors in an attempt to reverse the capital flight triggered by the financialcrisis. FDI has since remained below 2%.
101
between and between and Listed Non listed
Small enterprise (2) 0 1,000,000 0 41,775 15% 25%
Medium enterprise (2) 1,000,000 5,000,000 41,775 208,874 20% 35%
Large enterprise (2) 5,000,000 208,874 25% 45%
fundamentally private-sector oriented. Although the
Government very actively worked with the private sector
to provide a conducive environment to achieve compe-
titiveness, including ‘temporary protection, targeted
subsidies, adequate human resources, infrastructure,
support in international sales and marketing etc.’,
production was primarily driven by the private sector.
This policy required maximising savings available to the
private sector, lowering corporate taxes to the extent
possible, and encouraging private consumption. Main-
taining a small government budget was considered
critical to achieving these objectives.
Accordingly, Korea’s taxation system during the takeoff
phase aimed at contributing to achieving fiscal balance
while maintaining a low tax burden. Fiscal balance was
indeed achieved by both reducing expenditures and
increasing revenues. In addition, tax revenue was
capped at a low level, below 16% of GDP, which along
with a broad tax base (see Chapter 4.2.1), contributed
to making low tax rates possible. For example, VAT was
10%, against 16% to 20% in the EAC. Korea’s VAT rate
is among the lowest in the world. Still, it contributed
substantially to total revenues, at about a fourth of
central tax revenues (25% in 1980). Furthermore,
Corporate Income Tax for small and medium enter-
prises was also low, at 15% and 25% for listed and
non-listed small enterprises respectively30, against 30%
to 35% in EAC countries.
The small balanced budget strategy, including its tax
component, contributed to a dramatic increase in
domestic private savings and investment (Figure 3.6).
Savings started at 10% of GDP in 1960 and increa-
sed dramatically to 30% in 25 years. Investment
followed a similar progression, but remained greater
than savings during the entire takeoff period. The gap
between investment and domestic savings was mainly
filled by private foreign loans, many benefitting from
government guarantee. Korea sustained an average
savings ratio of 30% from the 1980’s, which is high
compared to both the EAC (savings stood at 10% in
2008 in Kenya and 18% in South Africa) and
advanced economies (Germany and USA in 2005
had domestic savings ratios of 22% and 14%
respectively)31.
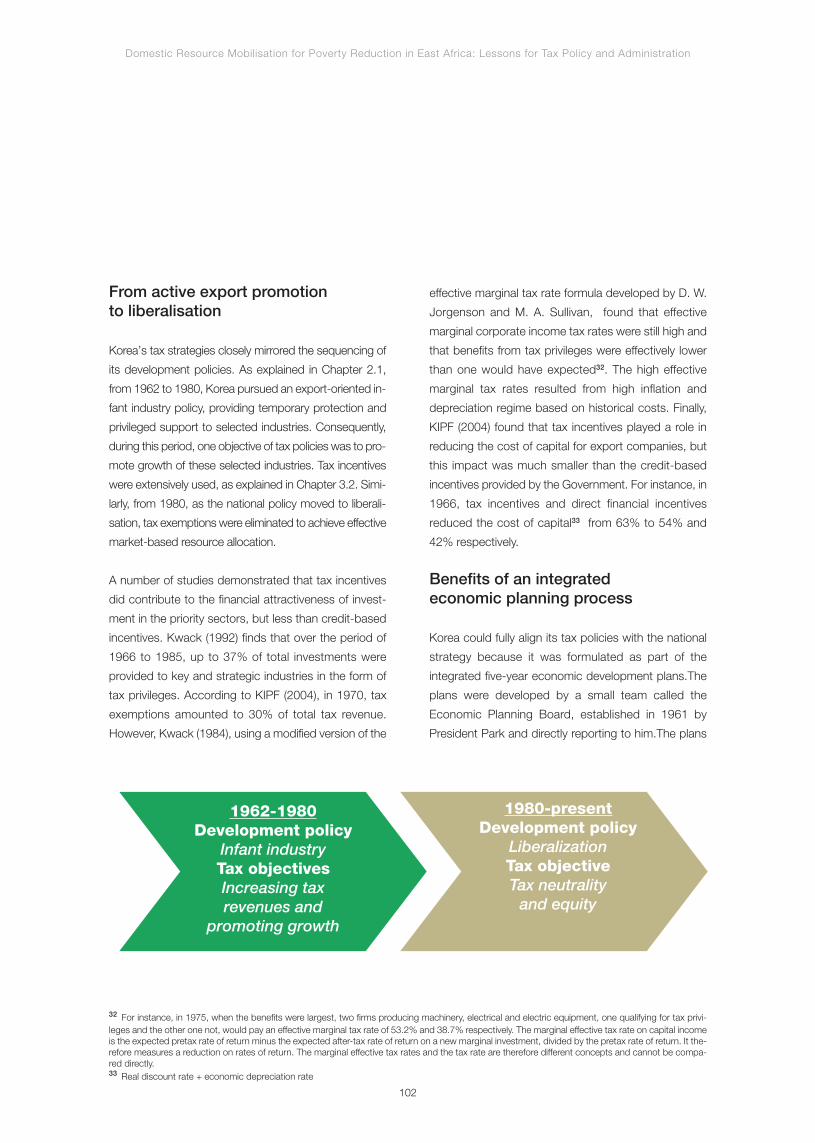
From active export promotionto liberalisation
Korea’s tax strategies closely mirrored the sequencing of
its development policies. As explained in Chapter 2.1,
from 1962 to 1980, Korea pursued an export-oriented in-
fant industry policy, providing temporary protection and
privileged support to selected industries. Consequently,
during this period, one objective of tax policies was to pro-
mote growth of these selected industries. Tax incentives
were extensively used, as explained in Chapter 3.2. Simi-
larly, from 1980, as the national policy moved to liberali-
sation, tax exemptions were eliminated to achieve effective
market-based resource allocation.
A number of studies demonstrated that tax incentives
did contribute to the financial attractiveness of invest-
ment in the priority sectors, but less than credit-based
incentives. Kwack (1992) finds that over the period of
1966 to 1985, up to 37% of total investments were
provided to key and strategic industries in the form of
tax privileges. According to KIPF (2004), in 1970, tax
exemptions amounted to 30% of total tax revenue.
However, Kwack (1984), using a modified version of the
effective marginal tax rate formula developed by D. W.
Jorgenson and M. A. Sullivan, found that effective
marginal corporate income tax rates were still high and
that benefits from tax privileges were effectively lower
than one would have expected32. The high effective
marginal tax rates resulted from high inflation and
depreciation regime based on historical costs. Finally,
KIPF (2004) found that tax incentives played a role in
reducing the cost of capital for export companies, but
this impact was much smaller than the credit-based
incentives provided by the Government. For instance, in
1966, tax incentives and direct financial incentives
reduced the cost of capital33 from 63% to 54% and
42% respectively.
Benefits of an integratedeconomic planning process
Korea could fully align its tax policies with the national
strategy because it was formulated as part of the
integrated five-year economic development plans.The
plans were developed by a small team called the
Economic Planning Board, established in 1961 by
President Park and directly reporting to him.The plans
Domestic Resource Mobilisation for Poverty Reduction in East Africa: Lessons for Tax Policy and Administration
32 For instance, in 1975, when the benefits were largest, two firms producing machinery, electrical and electric equipment, one qualifying for tax privi-leges and the other one not, would pay an effective marginal tax rate of 53.2% and 38.7% respectively. The marginal effective tax rate on capital incomeis the expected pretax rate of return minus the expected after-tax rate of return on a new marginal investment, divided by the pretax rate of return. It the-refore measures a reduction on rates of return. The marginal effective tax rates and the tax rate are therefore different concepts and cannot be compa-red directly.33 Real discount rate + economic depreciation rate
102
1962-1980Development policy
Infant industryTax objectivesIncreasing taxrevenues and
promoting growth
1980-presentDevelopment policy
LiberalizationTax objectiveTax neutralityand equity

encompassed all policies, including taxation, focusing
on a few common objectives (see earlier for details).
The impact of tax policies was enhanced because they
were complementing other policies. The list of comple-
mentary non-tax measures during the takeoff period is
long and included the following: the won was devalua-
ted in 1964 by 50%, official interest rates on deposits
were raised dramatically in the mid-1960’s to
encourage savings, credit-based subsidies were
provided to key industries, preferential access to
imports in the form of quotas was given to companies
with strong export performance, free trade zones were
established with streamlined customs procedures,
public investments focused on export infrastructure
such as ports, systems of centralised wholesale
purchase of imported inputs were put in place to
increase bargaining power of export-oriented SMEs,
high potential SMEs were selected for special support
including capacity building and close government
performance monitoring, ambassadors were given
export targets and held accountable for meeting them.
In the social sector, special education programmes
were put in place to provide priority industries with
adequate skills, and active family planning cut fertility
rate from 6.0 to 1.6 over the period 1960-87, thus
facilitating capital accumulation (including human
capital)34.
Furthermore, tax policy trade-offs could be made up by
non-tax policies, illustrating that prioritisation and
sequencing offer a solution to overcome conficting tax
objectives. The objectives of increasing revenues and
providing incentives for savings and investment in
target sectors were given higher priority than others--
such as neutrality and equity35. However, these trade-
offs were largely made up by the outcome of other
policies. These, rather than direct revenue transfers,
focused on providing pro-poor opportunities. They
included equity-oriented expenditure programmes-
such as the New Village Movement, which provided
performance-based subsidies to villages to improve
productivity36, a thorough land redistribution pro-
gramme between 1945 and 1950, and education poli-
cies that promote upward social mobility37. These
policies, combined with decades of sustained growth,
enabled Korea to achieve better performance in equity,
as evidenced by Korea’s Gini coefficient of 32 in 2008,
which is equal to the European average.
Empowering and holding the
tax administration accountable
Korea broadened its tax base by making its tax ad-
ministration both empowered and accountable. The
most visible result of creating the NTS was the sub-
sequent rapid increase in central tax revenues, from
9% of GDP in 1966 to 15% in 1980 (7% to 11% for
domestic taxes, the remaining coming from customs
taxes, under the responsibility of a separate agency).
Most EAC member countries have achieved revenue
levels in the same range over similar period. Howe-
ver, at similar levels of revenues, Korea seems to have
achieved a broader tax base. Below, we present evi-
dence of Korea’s relatively broader tax base and ana-
lyse the links between this performance and two
distinctive features of Korea’s tax system: a tax ad-
ministration benefitting from adequate resources and
Domestic Resource Mobilisation for Poverty Reduction in East Africa: Lessons for Tax Policy and Administration
34 From 1966, the average population growth was more than two times higher in Uganda and Kenya than in Korea (source: WDI and calculations bythe authors). Family planning policy in the 1960s promoted small families. It contained communication campaigns including use of contraceptives. It wasrecognised internationally as being successful and was acclaimed by the United National Fund for Population Activities. A low population growth is li-kely to have played a critical role in making rapid capital accumulation possible in Korea. It also helped limit the burden on the government for the pro-vision of public services.35 Social spending in Korea has been relatively low, below 3% until 1990. Though it has continuously grown since to reach 7% of GDP today, an OECDstudy observes that Korea still ranks last among OECD countries on that dimension (Randall, 2009).36 The initiative (Saemaeul Undong) was launched 1970 by South Korean president Park Chung Hee. It sought to rectify the growing disparity of thestandard of living between the nation's urban centres and the small villages. It was performance-based and concentrated on building up rural infra-structure. It was hailed as a great success in the 1970s, contributing to a rapid increase in rice productivity from 2.5 to 4.5 ton/ha (among the highestin the world, on a par with Japan). The movement lost momentum during the 1980s as it was plagued by several challenges, including rent capture (Kim,2010).37 Zagha and Shvets (2004)
103
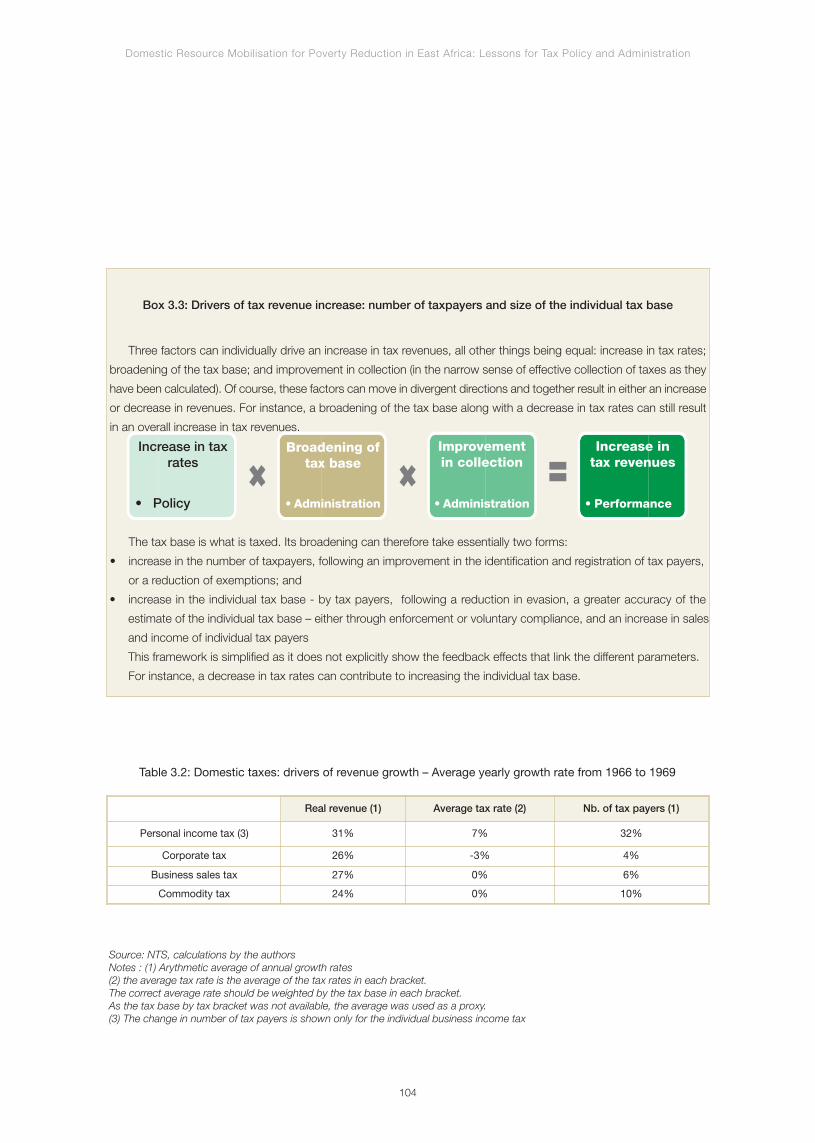
Domestic Resource Mobilisation for Poverty Reduction in East Africa: Lessons for Tax Policy and Administration
104
Box 3.3: Drivers of tax revenue increase: number of taxpayers and size of the individual tax base
Three factors can individually drive an increase in tax revenues, all other things being equal: increase in tax rates;
broadening of the tax base; and improvement in collection (in the narrow sense of effective collection of taxes as they
have been calculated). Of course, these factors can move in divergent directions and together result in either an increase
or decrease in revenues. For instance, a broadening of the tax base along with a decrease in tax rates can still result
in an overall increase in tax revenues.
The tax base is what is taxed. Its broadening can therefore take essentially two forms:
• increase in the number of taxpayers, following an improvement in the identification and registration of tax payers,
or a reduction of exemptions; and
• increase in the individual tax base - by tax payers, following a reduction in evasion, a greater accuracy of the
estimate of the individual tax base – either through enforcement or voluntary compliance, and an increase in sales
and income of individual tax payers
This framework is simplified as it does not explicitly show the feedback effects that link the different parameters.
For instance, a decrease in tax rates can contribute to increasing the individual tax base.
Increase in taxrates
• Policy
Broadening oftax base
• Administration
Improvementin collection
• Administration
Increase intax revenues
• Performance
Real revenue (1) Average tax rate (2) Nb. of tax payers (1)
Personal income tax (3) 31% 7% 32%
Corporate tax 26% -3% 4%
Business sales tax 27% 0% 6%
Commodity tax 24% 0% 10%
Table 3.2: Domestic taxes: drivers of revenue growth – Average yearly growth rate from 1966 to 1969
Source: NTS, calculations by the authorsNotes : (1) Arythmetic average of annual growth rates(2) the average tax rate is the average of the tax rates in each bracket.The correct average rate should be weighted by the tax base in each bracket.As the tax base by tax bracket was not available, the average was used as a proxy.(3) The change in number of tax payers is shown only for the individual business income tax
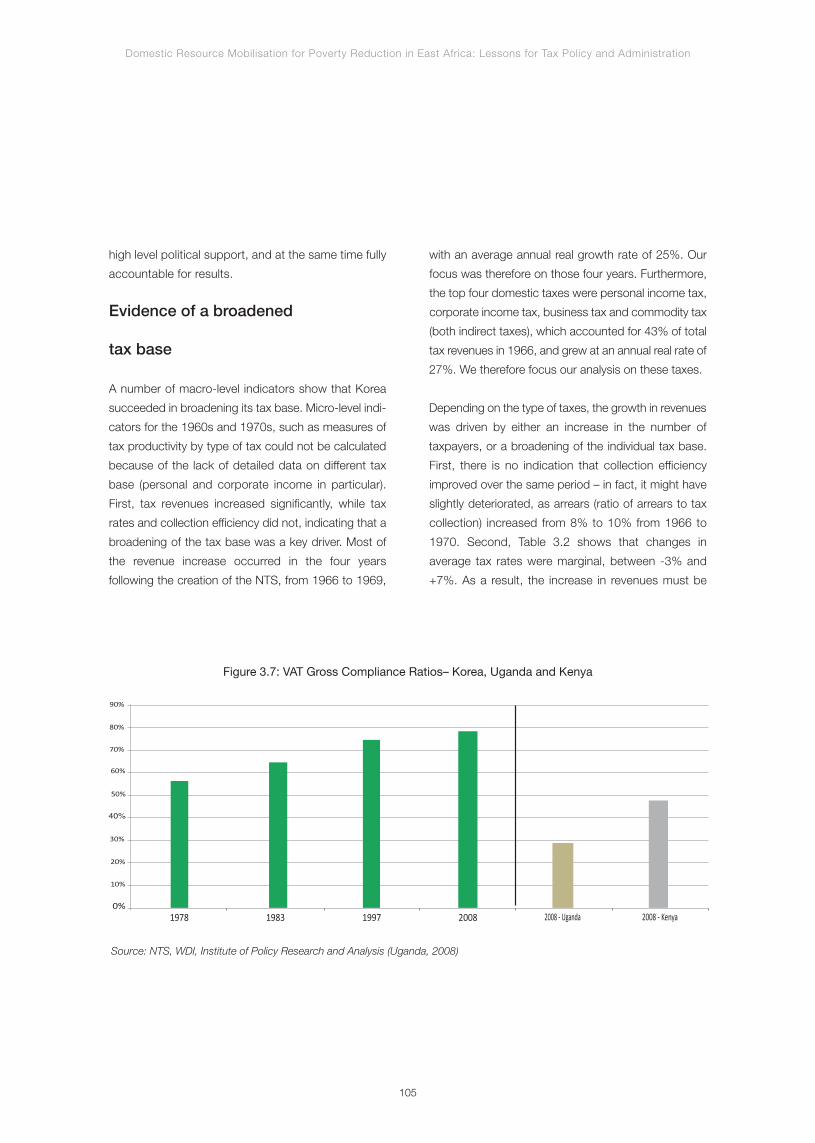
high level political support, and at the same time fully
accountable for results.
Evidence of a broadened
tax base
A number of macro-level indicators show that Korea
succeeded in broadening its tax base. Micro-level indi-
cators for the 1960s and 1970s, such as measures of
tax productivity by type of tax could not be calculated
because of the lack of detailed data on different tax
base (personal and corporate income in particular).
First, tax revenues increased significantly, while tax
rates and collection efficiency did not, indicating that a
broadening of the tax base was a key driver. Most of
the revenue increase occurred in the four years
following the creation of the NTS, from 1966 to 1969,
with an average annual real growth rate of 25%. Our
focus was therefore on those four years. Furthermore,
the top four domestic taxes were personal income tax,
corporate income tax, business tax and commodity tax
(both indirect taxes), which accounted for 43% of total
tax revenues in 1966, and grew at an annual real rate of
27%. We therefore focus our analysis on these taxes.
Depending on the type of taxes, the growth in revenues
was driven by either an increase in the number of
taxpayers, or a broadening of the individual tax base.
First, there is no indication that collection efficiency
improved over the same period – in fact, it might have
slightly deteriorated, as arrears (ratio of arrears to tax
collection) increased from 8% to 10% from 1966 to
1970. Second, Table 3.2 shows that changes in
average tax rates were marginal, between -3% and
+7%. As a result, the increase in revenues must be
Domestic Resource Mobilisation for Poverty Reduction in East Africa: Lessons for Tax Policy and Administration
105
40%
Figure 3.7: VAT Gross Compliance Ratios– Korea, Uganda and Kenya
Source: NTS, WDI, Institute of Policy Research and Analysis (Uganda, 2008)
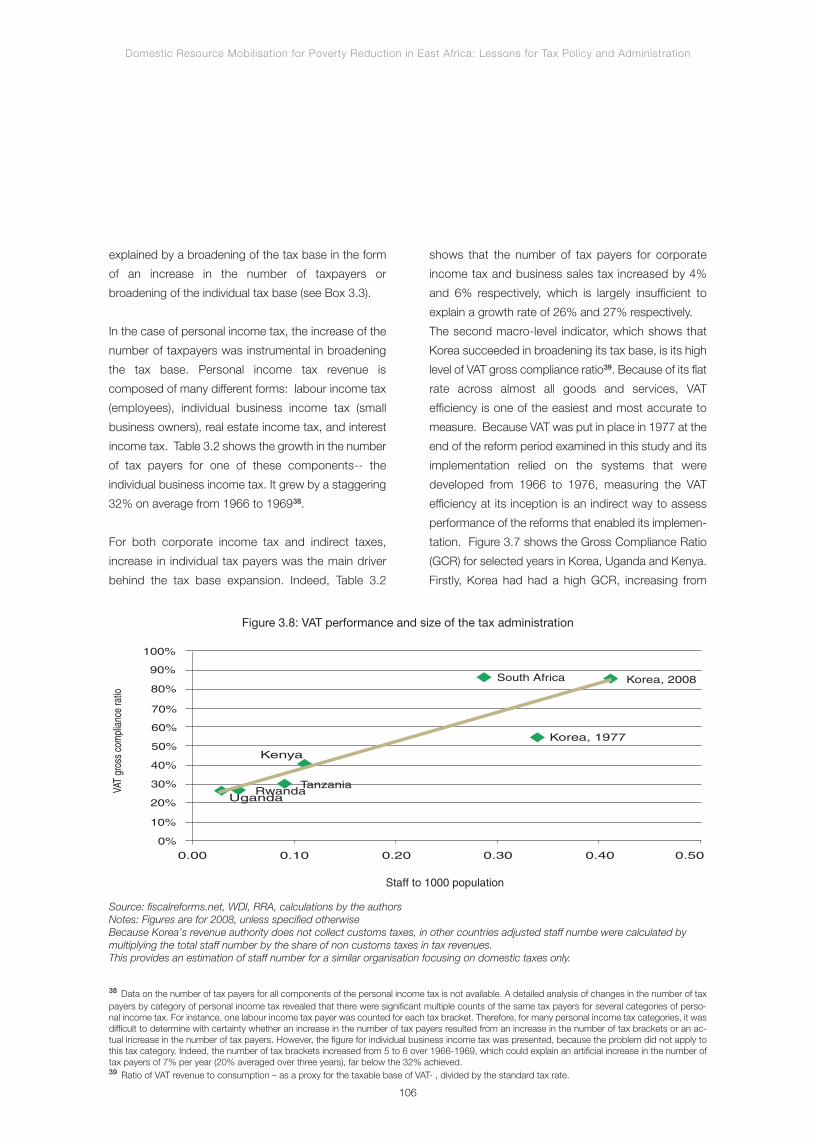
explained by a broadening of the tax base in the form
of an increase in the number of taxpayers or
broadening of the individual tax base (see Box 3.3).
In the case of personal income tax, the increase of the
number of taxpayers was instrumental in broadening
the tax base. Personal income tax revenue is
composed of many different forms: labour income tax
(employees), individual business income tax (small
business owners), real estate income tax, and interest
income tax. Table 3.2 shows the growth in the number
of tax payers for one of these components-- the
individual business income tax. It grew by a staggering
32% on average from 1966 to 196938.
For both corporate income tax and indirect taxes,
increase in individual tax payers was the main driver
behind the tax base expansion. Indeed, Table 3.2
shows that the number of tax payers for corporate
income tax and business sales tax increased by 4%
and 6% respectively, which is largely insufficient to
explain a growth rate of 26% and 27% respectively.
The second macro-level indicator, which shows that
Korea succeeded in broadening its tax base, is its high
level of VAT gross compliance ratio39. Because of its flat
rate across almost all goods and services, VAT
efficiency is one of the easiest and most accurate to
measure. Because VAT was put in place in 1977 at the
end of the reform period examined in this study and its
implementation relied on the systems that were
developed from 1966 to 1976, measuring the VAT
efficiency at its inception is an indirect way to assess
performance of the reforms that enabled its implemen-
tation. Figure 3.7 shows the Gross Compliance Ratio
(GCR) for selected years in Korea, Uganda and Kenya.
Firstly, Korea had had a high GCR, increasing from
Domestic Resource Mobilisation for Poverty Reduction in East Africa: Lessons for Tax Policy and Administration
38 Data on the number of tax payers for all components of the personal income tax is not available. A detailed analysis of changes in the number of taxpayers by category of personal income tax revealed that there were significant multiple counts of the same tax payers for several categories of perso-nal income tax. For instance, one labour income tax payer was counted for each tax bracket. Therefore, for many personal income tax categories, it wasdifficult to determine with certainty whether an increase in the number of tax payers resulted from an increase in the number of tax brackets or an ac-tual increase in the number of tax payers. However, the figure for individual business income tax was presented, because the problem did not apply tothis tax category. Indeed, the number of tax brackets increased from 5 to 6 over 1966-1969, which could explain an artificial increase in the number oftax payers of 7% per year (20% averaged over three years), far below the 32% achieved.39 Ratio of VAT revenue to consumption – as a proxy for the taxable base of VAT- , divided by the standard tax rate.
106
VAT
gros
s co
mpl
ianc
e ra
tio
Staff to 1000 population
Uganda
Korea, 2008
Korea, 1977
South Africa
Kenya
TanzaniaRwanda
0.00
40%
70%
100%
90%
80%
60%
50%
30%
20%
10%
0%0.10 0.20 0.30 0.40 0.50
Figure 3.8: VAT performance and size of the tax administration
Source: fiscalreforms.net, WDI, RRA, calculations by the authorsNotes: Figures are for 2008, unless specified otherwiseBecause Korea’s revenue authority does not collect customs taxes, in other countries adjusted staff numbe were calculated bymultiplying the total staff number by the share of non customs taxes in tax revenues.This provides an estimation of staff number for a similar organisation focusing on domestic taxes only.
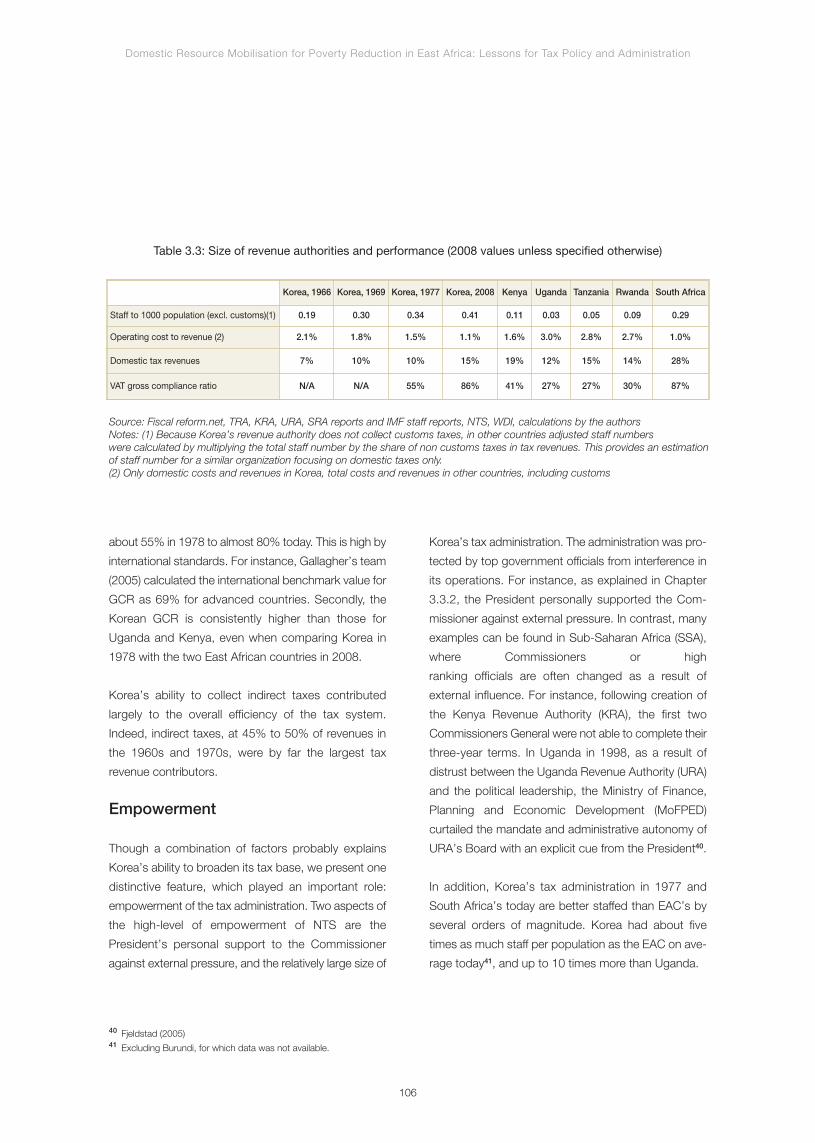
Domestic Resource Mobilisation for Poverty Reduction in East Africa: Lessons for Tax Policy and Administration
40 Fjeldstad (2005)41 Excluding Burundi, for which data was not available.
106
Korea, 1966 Korea, 1969 Korea, 1977 Korea, 2008 Kenya Uganda Tanzania Rwanda South Africa
Staff to 1000 population (excl. customs)(1) 0.19 0.30 0.34 0.41 0.11 0.03 0.05 0.09 0.29
Operating cost to revenue (2) 2.1% 1.8% 1.5% 1.1% 1.6% 3.0% 2.8% 2.7% 1.0%
Domestic tax revenues 7% 10% 10% 15% 19% 12% 15% 14% 28%
VAT gross compliance ratio N/A N/A 55% 86% 41% 27% 27% 30% 87%
Table 3.3: Size of revenue authorities and performance (2008 values unless specified otherwise)
Source: Fiscal reform.net, TRA, KRA, URA, SRA reports and IMF staff reports, NTS, WDI, calculations by the authorsNotes: (1) Because Korea’s revenue authority does not collect customs taxes, in other countries adjusted staff numberswere calculated by multiplying the total staff number by the share of non customs taxes in tax revenues. This provides an estimationof staff number for a similar organization focusing on domestic taxes only.(2) Only domestic costs and revenues in Korea, total costs and revenues in other countries, including customs
about 55% in 1978 to almost 80% today. This is high by
international standards. For instance, Gallagher’s team
(2005) calculated the international benchmark value for
GCR as 69% for advanced countries. Secondly, the
Korean GCR is consistently higher than those for
Uganda and Kenya, even when comparing Korea in
1978 with the two East African countries in 2008.
Korea’s ability to collect indirect taxes contributed
largely to the overall efficiency of the tax system.
Indeed, indirect taxes, at 45% to 50% of revenues in
the 1960s and 1970s, were by far the largest tax
revenue contributors.
Empowerment
Though a combination of factors probably explains
Korea’s ability to broaden its tax base, we present one
distinctive feature, which played an important role:
empowerment of the tax administration. Two aspects of
the high-level of empowerment of NTS are the
President’s personal support to the Commissioner
against external pressure, and the relatively large size of
Korea’s tax administration. The administration was pro-
tected by top government officials from interference in
its operations. For instance, as explained in Chapter
3.3.2, the President personally supported the Com-
missioner against external pressure. In contrast, many
examples can be found in Sub-Saharan Africa (SSA),
where Commissioners or high
ranking officials are often changed as a result of
external influence. For instance, following creation of
the Kenya Revenue Authority (KRA), the first two
Commissioners General were not able to complete their
three-year terms. In Uganda in 1998, as a result of
distrust between the Uganda Revenue Authority (URA)
and the political leadership, the Ministry of Finance,
Planning and Economic Development (MoFPED)
curtailed the mandate and administrative autonomy of
URA’s Board with an explicit cue from the President40.
In addition, Korea’s tax administration in 1977 and
South Africa’s today are better staffed than EAC’s by
several orders of magnitude. Korea had about five
times as much staff per population as the EAC on ave-
rage today41, and up to 10 times more than Uganda.
Analysing the breadth of the tax base against the size
of the administration suggests that EAC tax adminis-
trations may be inadequately resourced. Figure 3.8
shows VAT GCR against the size of the tax administra-
tion (as explained in the previous chapter, for lack of
better measures available, VAT GCR is used as a proxy
for measuring the breadth of the tax base). In this sam-
ple, no tax administration in EAC has achieved the VAT
performance of Korea and South Africa with signifi-
cantly less staff. This does not mean that increasing the
size of the administration is sufficient to achieve a broa-
der tax base, but does indicate that more adequate re-
sources may be necessary to do so42 .
Using the operating cost-to-revenue ratio as benchmark
for the size of a tax administration is misleading and can
result in undersized administrations. This ratio is often quo-
ted to justify limiting the size of EAC tax administrations.
For instance, an operating cost ratio of 3% in Uganda (see
Table 3.3) would be considered high, suggesting that its
tax administration would be too large. This is incorrect as
it measures size only against one dimension of perfor-
mance: revenue-to-GDP ratio. It leaves out another criti-
cal dimension of performance: the breadth of the tax base,
also rightly called efficiency of a tax administration. In the
case of Korea, generating high levels of revenues was not
an objective in line with Korea’s small government bud-
get strategy. Revenue targets and tax rates were intentio-
nally kept low, which automatically resulted in a relatively
high average operating cost-to-revenue efficiency ratio, at
1.8% in 1969. However, this low ratio, reflecting high level
of operational resources, could be justified by a good per-
formance on broadening the tax base. It is therefore in-
correct to conclude from a high operating cost-to-
revenue ratio that resources are inefficiently used and that
resources should be reduced. Korea’s case clearly indi-
cates that many of the measures required to broaden the
tax base demand significant resources. In particular, staff
was required to implement the many measures described
in Chapter 3.3.3: creating a tax training institute, streng-
thening research, conducting on-site investigations, ope-
ning of decentralised offices, and registration of all small
businesses. Many of these measures have already been
undertaken by EAC countries but may require additional
resources to yield the expected results.
Accountability and empowerment,
two sides of the coin
As explained in Chapter 3.3.1, accountability took three
main forms: (i) close performance monitoring at the
highest level; (ii) target revenue approach and incentives
for performance; (iii) and zero-tolerance for corruption.
To some extent, most EAC countries have implemented
these forms of accountability. However, the fact that
President Park personally monitored the performance
of NTS sets Korea apart and illustrates the commitment
for results at the highest level.
Empowerment and accountability should be viewed as
two sides of the same coin. Providing large resources
and protection from interference at the operational level
could have resulted in efficiencies without a tight
supervision. Reciprocally, the high pressure to deliver
would have been fruitless without adequate means.
Domestic Resource Mobilisation for Poverty Reduction in East Africa: Lessons for Tax Policy and Administration
42 One should exert caution when directly comparing sizes of tax administrations across countries and time periods. For instance, a country with a lar-ger population or economy should normally be able to achieve better economies of scale. In addition, information technologies, which were not availa-ble in the 1960s are now widely used and contributing to increased efficiency. In practice, adjusting for differences in these factors is difficult. However,in this specific case, the assumption of the authors is that the effect of adjustments would be marginal compared to the very large size difference bet-ween administrations in the EAC on the one hand, and South Africa and Korea on the other.
107
Conclusion
Tax reforms significantly contributed to Korea’s
successful development. They helped Korea rapidly
achieve fiscal balance and promoted savings and
investment through incentives. However, one of the key
reasons for the success of Korea’s tax reforms was
their full integration into the broader national strategy.
Indeed, fiscal balance was achieved largely because
expenditure was reduced; and tax incentives for
investment had a major impact because they
complemented credit- based incentives.
This study found two lessons of particular relevance to
EAC member countries. First, Korea achieved faster
results by focusing its tax policies on a few priorities fully
aligned with its national development strategy. Second,
it broadened its tax base by making the tax administra-
tion both empowered and accountable.
One useful way of interpreting these lessons is that part
of Korea’s success can be explained by a strong
Domestic Resource Mobilisation for Poverty Reduction in East Africa: Lessons for Tax Policy and Administration
108
emphasis on implementation, beyond strategy and
policies. In fact, many of Korea’s policies and strate-
gies have been adopted in the EAC in one form or
another. They include, among others, incentives to
promote investment, simplified tax filings for small
enterprises, and special initiatives for large payers.
Korea therefore stands out for its emphasis on imple-
mentation rather than the nature of its policies. Indeed,
focused and coherent strategies are a prerequisite for
effective implementation. Empowered and accountable
execution agencies are critical for efficient delivery. At
the same time, implementation plays a central role in
Korea’s experience in general, beyond the field of
taxation. In this context, it is worthwhile to note that
President Park allocated 20% of his time to decision
making, and 80% to implementation. As a result, over
his 18-year tenure, he spent 119 days a year
crisscrossing the country, demonstrating his commit-
ment for results, monitoring them and listening to
practical feedback from the ground.

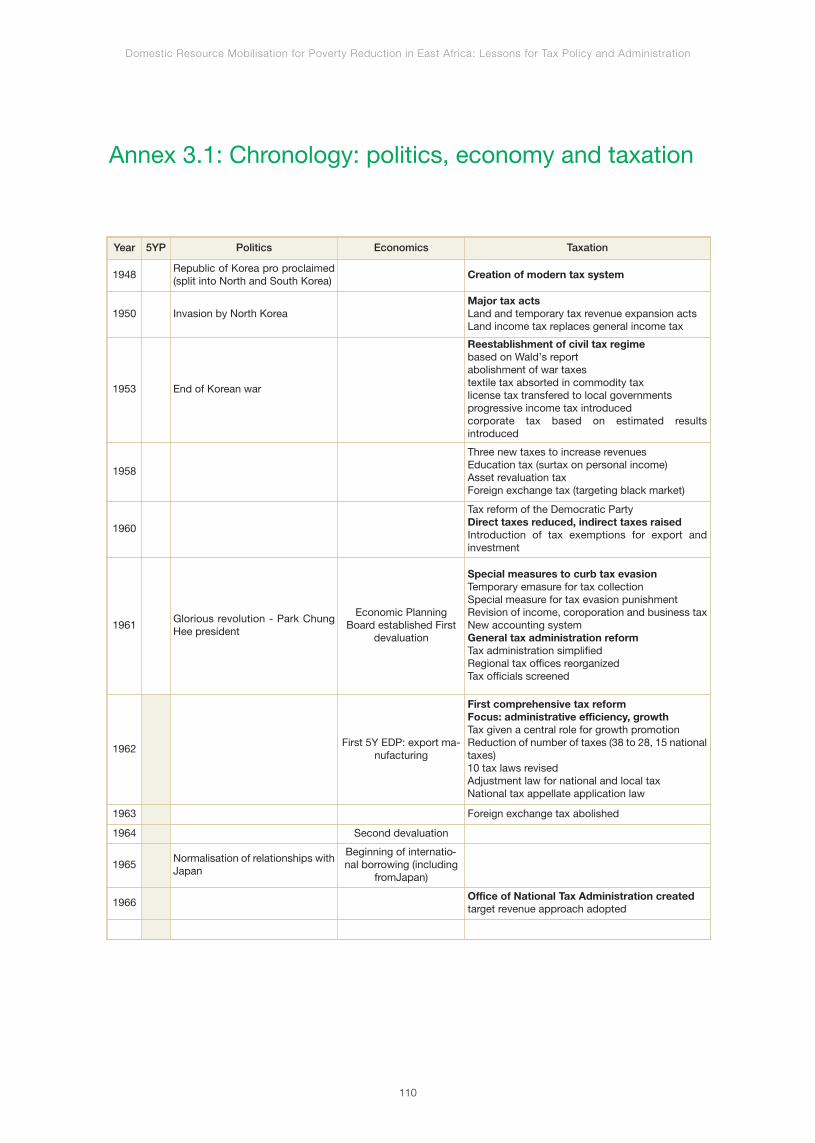
Annex 3.1: Chronology: politics, economy and taxation
Domestic Resource Mobilisation for Poverty Reduction in East Africa: Lessons for Tax Policy and Administration
110
Year 5YP Politics Economics Taxation
1948Republic of Korea pro proclaimed(split into North and South Korea)
Creation of modern tax system
1950 Invasion by North KoreaMajor tax actsLand and temporary tax revenue expansion actsLand income tax replaces general income tax
1953 End of Korean war
Reestablishment of civil tax regimebased on Wald’s reportabolishment of war taxestextile tax absorted in commodity taxlicense tax transfered to local governmentsprogressive income tax introducedcorporate tax based on estimated resultsintroduced
1958
Three new taxes to increase revenues Education tax (surtax on personal income)Asset revaluation taxForeign exchange tax (targeting black market)
1960
Tax reform of the Democratic PartyDirect taxes reduced, indirect taxes raisedIntroduction of tax exemptions for export andinvestment
1961Glorious revolution - Park ChungHee president
Economic PlanningBoard established First
devaluation
Special measures to curb tax evasionTemporary emasure for tax collectionSpecial measure for tax evasion punishmentRevision of income, coroporation and business taxNew accounting systemGeneral tax administration reformTax administration simplifiedRegional tax offices reorganizedTax officials screened
1962First 5Y EDP: export ma-
nufacturing
First comprehensive tax reformFocus: administrative efficiency, growthTax given a central role for growth promotionReduction of number of taxes (38 to 28, 15 nationaltaxes)10 tax laws revisedAdjustment law for national and local taxNational tax appellate application law
1963 Foreign exchange tax abolished
1964 Second devaluation
1965Normalisation of relationships withJapan
Beginning of internatio-nal borrowing (including
fromJapan)
1966Office of National Tax Administration createdtarget revenue approach adopted

Domestic Resource Mobilisation for Poverty Reduction in East Africa: Lessons for Tax Policy and Administration
111
1967
Second comprehensive tax reformFocus: growth, equity, administrative efficiencySubstantial expansion of tax exemptions formanufacturing exportReduction of taxes on capital gains from listedcompanies, and interests on bank deposits topromote savingsLiquor and commodity tax raised to discourageconsumption of target goods Investment 19 tax laws revisedReal estate speculation control tax introducedHigher bracket income and inheritance tax rates rai-sed, lower bracketslowered for equity
1968
Measure to improve compliancetax penalties raised, tax credits for voluntary returnsincresed, acceleration of return of overpaid taxes,improvement of the tax appeal system
1969Revision of laws to improve voluntary submission (6laws including corporate)
1970
1971
New Community policy(high grain prices). Beforethat, low grain priceswere imposed.
Third comprehensive tax reformexpansion of corporate and investment tax incen-tives. Special tax exemptions and depreciation upto 80% for strategic industries, including small andmedium size businesses
1972
Third5Y EDP: diversifi-cationheavy and chemical in-dustries, steel, machinery,shipbuilding, electronics,oil refining
Emergency decree for economic stability andgrowthgenerous investment tax creditsabolished revenue sharing scheme for local govern-ments
1973First oil crisisFollowed by a sustainedinflation in the 70’s
1974
January - Emergency tax reformsFocus: equity (protect poor from inflation)Tax relief for low wage earnsDecember - Fourth Comprehensive tax reformFocus: equity and growthComprehensive global income tax introducedCapital gains tax replaces real estate speculationcontrol taxAll incentives to promote key industries iniifed underone law: «Tax exemption and reduction control law».Strategic industries (shipbilding, machinery) aregiven choice between one of three incentives: directexemption, investment credit, special depreciationBusiness tax rates raised to prepare for VATWitholding tax extended to manufacturers andwholesalersReporting system reinforcedBasic law for National Taxes: improve tax payersrights by prohibiting retroactive taxation, introducingassessment based on bookkeeping andestablishmentof the Tax tribunal as a specialindependent agency
1975 defence tax law introduced
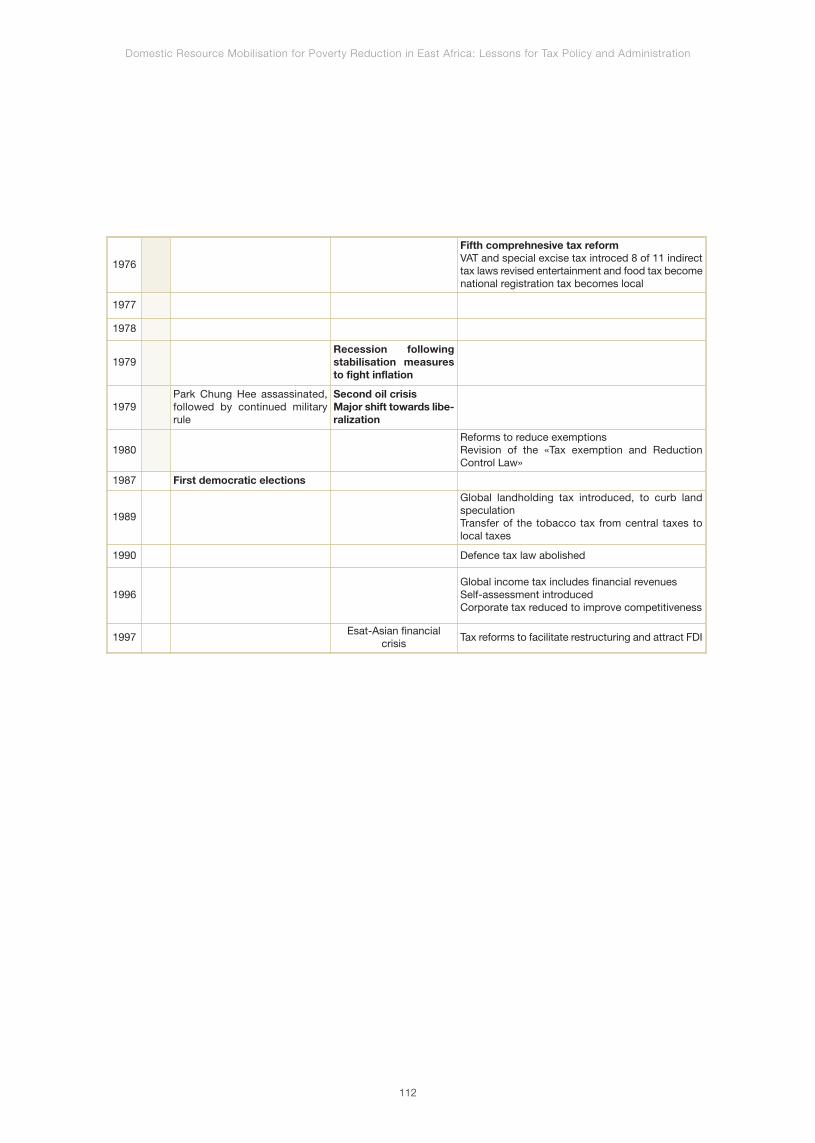
Domestic Resource Mobilisation for Poverty Reduction in East Africa: Lessons for Tax Policy and Administration
112
1976
Fifth comprehnesive tax reformVAT and special excise tax introced 8 of 11 indirecttax laws revised entertainment and food tax becomenational registration tax becomes local
1977
1978
1979Recession followingstabilisation measuresto fight inflation
1979Park Chung Hee assassinated,followed by continued militaryrule
Second oil crisisMajor shift towards libe-ralization
1980Reforms to reduce exemptionsRevision of the «Tax exemption and ReductionControl Law»
1987 First democratic elections
1989
Global landholding tax introduced, to curb landspeculationTransfer of the tobacco tax from central taxes tolocal taxes
1990 Defence tax law abolished
1996Global income tax includes financial revenuesSelf-assessment introducedCorporate tax reduced to improve competitiveness
1997Esat-Asian financial
crisisTax reforms to facilitate restructuring and attract FDI
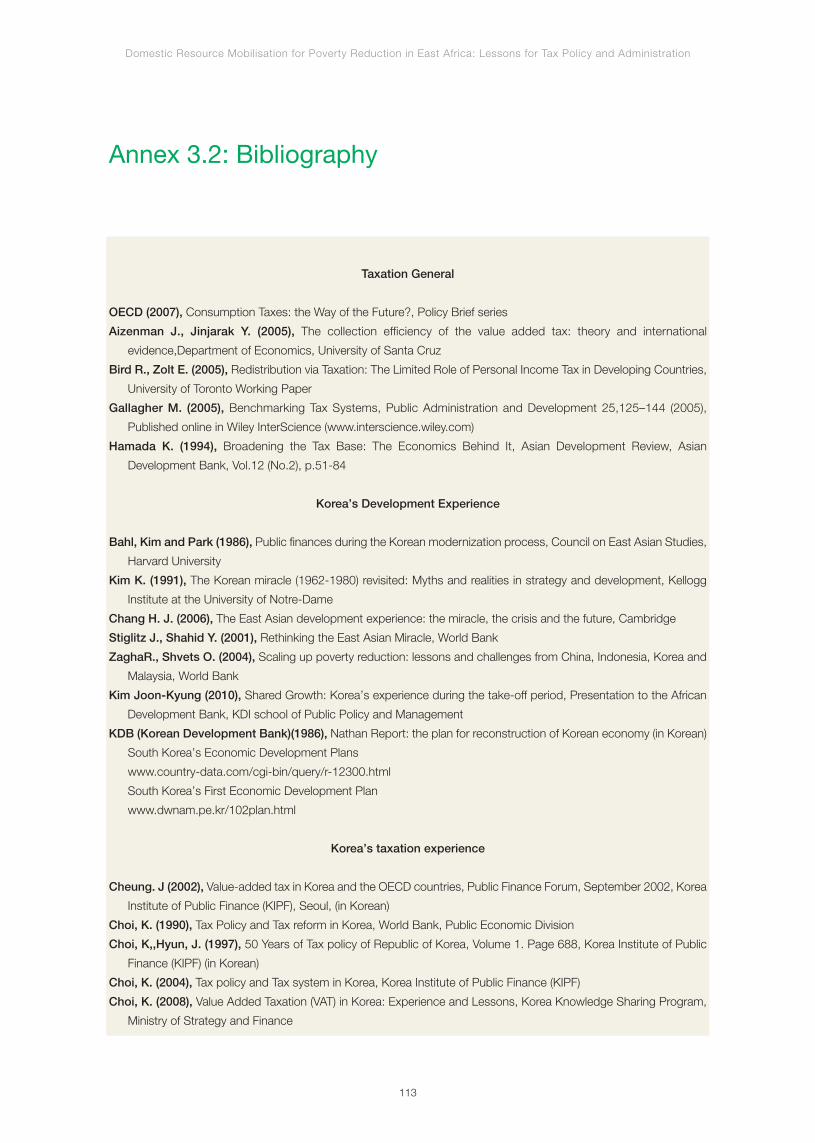
Domestic Resource Mobilisation for Poverty Reduction in East Africa: Lessons for Tax Policy and Administration
113
Taxation General
OECD (2007), Consumption Taxes: the Way of the Future?, Policy Brief series
Aizenman J., Jinjarak Y. (2005), The collection efficiency of the value added tax: theory and international
evidence,Department of Economics, University of Santa Cruz
Bird R., Zolt E. (2005), Redistribution via Taxation: The Limited Role of Personal Income Tax in Developing Countries,
University of Toronto Working Paper
Gallagher M. (2005), Benchmarking Tax Systems, Public Administration and Development 25,125–144 (2005),
Published online in Wiley InterScience (www.interscience.wiley.com)
Hamada K. (1994), Broadening the Tax Base: The Economics Behind It, Asian Development Review, Asian
Development Bank, Vol.12 (No.2), p.51-84
Korea’s Development Experience
Bahl, Kim and Park (1986), Public finances during the Korean modernization process, Council on East Asian Studies,
Harvard University
Kim K. (1991), The Korean miracle (1962-1980) revisited: Myths and realities in strategy and development, Kellogg
Institute at the University of Notre-Dame
Chang H. J. (2006), The East Asian development experience: the miracle, the crisis and the future, Cambridge
Stiglitz J., Shahid Y. (2001), Rethinking the East Asian Miracle, World Bank
ZaghaR., Shvets O. (2004), Scaling up poverty reduction: lessons and challenges from China, Indonesia, Korea and
Malaysia, World Bank
Kim Joon-Kyung (2010), Shared Growth: Korea’s experience during the take-off period, Presentation to the African
Development Bank, KDI school of Public Policy and Management
KDB (Korean Development Bank)(1986), Nathan Report: the plan for reconstruction of Korean economy (in Korean)
South Korea’s Economic Development Plans
www.country-data.com/cgi-bin/query/r-12300.html
South Korea’s First Economic Development Plan
www.dwnam.pe.kr/102plan.html
Korea’s taxation experience
Cheung. J (2002), Value-added tax in Korea and the OECD countries, Public Finance Forum, September 2002, Korea
Institute of Public Finance (KIPF), Seoul, (in Korean)
Choi, K. (1990), Tax Policy and Tax reform in Korea, World Bank, Public Economic Division
Choi, K,,Hyun, J. (1997), 50 Years of Tax policy of Republic of Korea, Volume 1. Page 688, Korea Institute of Public
Finance (KIPF) (in Korean)
Choi, K. (2004), Tax policy and Tax system in Korea, Korea Institute of Public Finance (KIPF)
Choi, K. (2008), Value Added Taxation (VAT) in Korea: Experience and Lessons, Korea Knowledge Sharing Program,
Ministry of Strategy and Finance
Annex 3.2: Bibliography
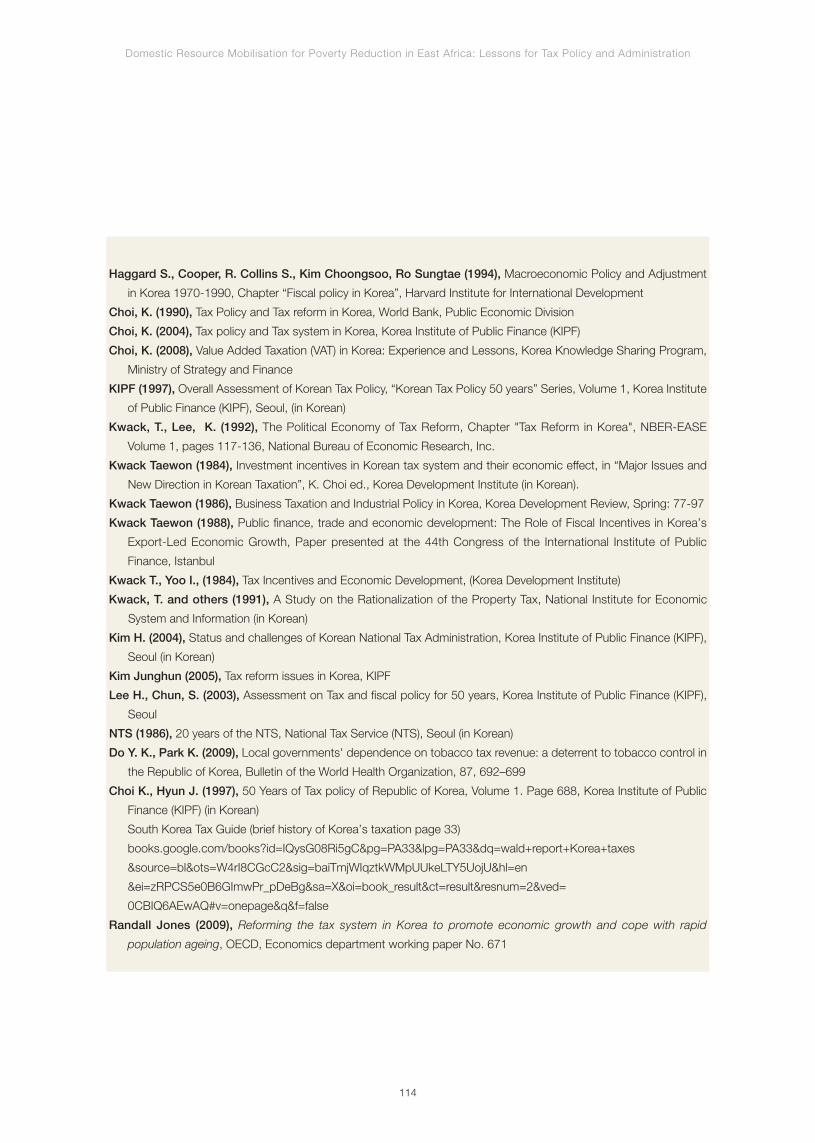
Domestic Resource Mobilisation for Poverty Reduction in East Africa: Lessons for Tax Policy and Administration
114
Haggard S., Cooper, R. Collins S., Kim Choongsoo, Ro Sungtae (1994), Macroeconomic Policy and Adjustment
in Korea 1970-1990, Chapter “Fiscal policy in Korea”, Harvard Institute for International Development
Choi, K. (1990), Tax Policy and Tax reform in Korea, World Bank, Public Economic Division
Choi, K. (2004), Tax policy and Tax system in Korea, Korea Institute of Public Finance (KIPF)
Choi, K. (2008), Value Added Taxation (VAT) in Korea: Experience and Lessons, Korea Knowledge Sharing Program,
Ministry of Strategy and Finance
KIPF (1997), Overall Assessment of Korean Tax Policy, “Korean Tax Policy 50 years” Series, Volume 1, Korea Institute
of Public Finance (KIPF), Seoul, (in Korean)
Kwack, T., Lee, K. (1992), The Political Economy of Tax Reform, Chapter "Tax Reform in Korea", NBER-EASE
Volume 1, pages 117-136, National Bureau of Economic Research, Inc.
Kwack Taewon (1984), Investment incentives in Korean tax system and their economic effect, in “Major Issues and
New Direction in Korean Taxation”, K. Choi ed., Korea Development Institute (in Korean).
Kwack Taewon (1986), Business Taxation and Industrial Policy in Korea, Korea Development Review, Spring: 77-97
Kwack Taewon (1988), Public finance, trade and economic development: The Role of Fiscal Incentives in Korea’s
Export-Led Economic Growth, Paper presented at the 44th Congress of the International Institute of Public
Finance, Istanbul
Kwack T., Yoo I., (1984), Tax Incentives and Economic Development, (Korea Development Institute)
Kwack, T. and others (1991), A Study on the Rationalization of the Property Tax, National Institute for Economic
System and Information (in Korean)
Kim H. (2004), Status and challenges of Korean National Tax Administration, Korea Institute of Public Finance (KIPF),
Seoul (in Korean)
Kim Junghun (2005), Tax reform issues in Korea, KIPF
Lee H., Chun, S. (2003), Assessment on Tax and fiscal policy for 50 years, Korea Institute of Public Finance (KIPF),
Seoul
NTS (1986), 20 years of the NTS, National Tax Service (NTS), Seoul (in Korean)
Do Y. K., Park K. (2009), Local governments' dependence on tobacco tax revenue: a deterrent to tobacco control in
the Republic of Korea, Bulletin of the World Health Organization, 87, 692–699
Choi K., Hyun J. (1997), 50 Years of Tax policy of Republic of Korea, Volume 1. Page 688, Korea Institute of Public
Finance (KIPF) (in Korean)
South Korea Tax Guide (brief history of Korea’s taxation page 33)
books.google.com/books?id=IQysG08Ri5gC&pg=PA33&lpg=PA33&dq=wald+report+Korea+taxes
&source=bl&ots=W4rI8CGcC2&sig=baiTmjWIqztkWMpUUkeLTY5UojU&hl=en
&ei=zRPCS5e0B6GImwPr_pDeBg&sa=X&oi=book_result&ct=result&resnum=2&ved=
0CBIQ6AEwAQ#v=onepage&q&f=false
Randall Jones (2009), Reforming the tax system in Korea to promote economic growth and cope with rapid
population ageing, OECD, Economics department working paper No. 671

Domestic Resource Mobilisation for Poverty Reduction in East Africa: Lessons for Tax Policy and Administration
115
Taxation in EAC and Africa
Matovu JM. (2008), Domestic Resource Mobilization in Uganda and Economic Performance, Country Presentation for
the North-South Institute Domestic Resources Mobilization in Sub-Saharan Africa Project, January 2008-January
2009
Fjeldstad OH. (2005), Corruption in Tax Administration: Lessons from Institutional Reforms in Uganda, CMI
Working Paper WP 2005: 10
Muriithi M.K., Moyi, E.D. (2003), Tax Reforms and Revenue Mobilization in Kenya, African Economic Research
Consortium, AERC Research Paper 131
Ghura D. (2002), Tax revenue in sub-Saharan Africa: effects of economic policies and corruption, Book chapter in
"Governance, Corruption, and Economic Performance", IMF
Nashashibi K., Bazzoni S. (1994), Exchange Rate Strategies and Fiscal Performance in Sub-Saharan Africa, Staff
Papers-International Monetary Fund Volume 41, page 76 - 122, IMF
Institute of Policy Research and Analysis (Uganda, 2008), Making Uganda’s Tax System More
Appropriate in Meeting National Objectives: What works, what doesn’t, and why, Final Draft
September 30, 2008
Part III
East Africa experienceand lessons

Chapter 4
Burundi
Summary of Key Findings
Context-Political economy
and fiscal legacies
Burundi’s economic recovery has been evident since
2005, but there are no signs that it will achieve high
economic growth in the short-to-medium term. For
instance, the IMF (2010) projects its real GDP growth
will be 4.5% and 4.8% in 2011 and 2012 respectively.
The projection indicates that, in the foreseeable future,
the economy will remain dominated by agriculture and
a large informal sector, which accounts “for 75% of
urban employment”, predominantly in the capital city of
Bujumbura (World Bank, 2010). This outlook suggests
an economy with severe binding constraints to DRM.
Until relative peace was restored in Burundi five years
ago, the country, with a population of about one
million, had been beset by ethnic conflict for many
years, thwarting its march towards political stability and
economic development. It is indeed a paradox that
successive military coups and prolonged civil war did
not seriously disrupt the tax administration system, or
even undermines the tax efforts that could result in low
tax-to-revenue GDP ratios. However, prolonged conflict
and instability associated with the war spawned
rampant corruption in all aspects of public sector
management, including tax administration. It is against
this background that the Government of Burundi (GoB)
has recently established the Office Burundais Des
Recettes (OBR – Revenue Authority of Burundi).
The demand for peace dividends by the people in
terms of rapid improvements in public service delivery
will probably be the primary fiscal driver in Burundi for
the foreseeable future. International development orga-
nisations (IDOs) have also been key drivers of fiscal
governance during periods of relative peace. Since
2005, Burundi has had an exceptionally high share of
external development assistance in its public expendi-
ture budget. On average, external assistance accoun-
ted for up to 62% of the budget a year, but in some
years it fluctuated. For instance, in 2007, it covered
50% of the budget). Also, GoB anticipated considera-
ble increase in the volume of external resources after
the elections of June 2010. But it did not materialise as
some donors cut their assistance due to the global re-
cession. Furthermore, in the medium term, building the
capacity of OBR is expected to result in improved tax
revenue collection. Therefore, from a historical pers-
pective, Burundi’s medium-to-long term fiscal gover-
nance trajectory holds promise.
Tax reforms: Sequencing,
implementation and results
OBR has barely been in existence for more than a few
months. Therefore, it is expected that with time, its
management will map out a comprehensive reform
strategy. In the mean time, GoB, with the support from
its development partners, has accomplished the follo-
wing:
• Promulgation of the Value Added Tax (VAT) law in
2009, which brings Burundi closer to ensuring that
its tax regime is aligned with international practices,
and its partner states in the EAC;
• Adoption of the EAC Customs Union protocol (and
thereby common external tariffs (CETs)), which
underscores Burundi’s commitment to regional
integration, as well as improvement of the doing
business environment within EAC; and
• Adoption of the new revenue authority digital data
exchange system (RADDEX), whose implementa-
tion is almost complete, and, is expected to stream-
line clearance processes as well as minimise theft
and fraud.
Domestic Resource Mobilisation for Poverty Reduction in East Africa: Lessons for Tax Policy and Administration
118
Domestic revenue performance
From 1998 to 2008, despite the legacy of prolonged
civil war, Burundi’s domestic resources on average
grew at 14.1% a year, contributing 19.1% of GDP. The
highest contributor to domestic tax revenue has consis-
tently been taxes on goods and services, whose share
in 2008 stood at 42.9%. During that 10-year period,
taxes on goods and services grew at an average an-
nual rate of 17.6%. The next highest contributor, in-
come taxes, which by 2008 also constituted 42.9% of
the total taxes collected, grew at an average annual rate
of 14.2%.
Revenue growth in future years is expected to improve
with the establishment of OBR, introduction of VAT, and
systems modernisation. However, in the medium term,
there will probably be acute limitations on Burundi’s
DRM growth for as long as the economy remains
predominantly agriculture based.
Challenges and issues
There are several challenges and issues that GoB
needs to tackle in the medium term, including the fol-
lowing:
• Managing the transition to an autonomous revenue
authority: OBR will need to develop a strategic plan
to guide its revenue mobilisation efforts, in particu-
lar to sustain, but also surpass previous revenue
collection targets;
• Retaining staff with skills and integrity: To ensure
that it can retain and motivate staff, OBR will be
challenged to offer competitive salaries on a sustai-
nable basis;
• Ensuring efficiency of tax incentives and exemp-
tions: Burundi is yet another country plagued with
the issue of tax incentives and exemptions, which
need to be rationalised in order to widen the tax re-
venue base;
• Widening tax base: Key informants and the litera-
ture on Burundi indicate that several informal sector
traders remain outside the tax net. So do several
informal businesses because of GoB’s “complex
and burdensome rules and regulations” (World
Bank, 2009);
• Combating corruption effectively: High levels of
corruption in Burundi constitutes a key challenge to
DRM; and
• Ensuring harmonised, systematic and policy-led
regional integration measures: For instance, it is
noteworthy that Burundi’s top marginal personal
and corporate income tax rates, at 60% and 35%
respectively, remain the highest in the EAC.
Lessons learned
The establishment of OBR heralds the start of an era
of reforms that other EAC countries have been
implementing over the past decade. Against that
backdrop and at this stage, there are only two lessons
that can be derived from the Burundi DRM case study.
They are:
• Inaccurate national statistics can translate into a
misleading measurement of tax effort: It has been
suggested that Burundi’s GDP figures may have
been consistently understated through the years,
which results in an exaggerated tax revenue-to-
GDP ratio. This underscores the need to improve
national statistics so as to enhance evidence-based
policy making; and
• Major policy initiatives should be backed by
rigorous assessment of outcomes: Burundi has de-
monstrated the benefits of rigorous assessments
as a basis for major policy development, in
Domestic Resource Mobilisation for Poverty Reduction in East Africa: Lessons for Tax Policy and Administration
119

particular, risk mitigation associated with policy
changes. For example, one of the key factors that
determined Burundi’s VAT rate was the need to
compensate for anticipated revenue losses from the
adoption of CETs. The rest of the chapter is organi-
sed as follows: The first section discusses the
political economy and fiscal legacies, the second
section covers trends in the tax system, the third
section explores domestic revenue performance,
the fourth section highlights the challenges to
increasing DRM, and the fifth section concludes
with lessons learned.
Domestic Resource Mobilisation for Poverty Reduction in East Africa: Lessons for Tax Policy and Administration
120
Context – Political economy and fiscal legacies
A legacy of prolonged civil war
and its impact on the economy
Almost from the time it attained independence in 1962,
Burundi experienced political instability and violence. In
1966, following a military coup, Michel Micombero
declared himself President after overthrowing King
Ntare V Ndizeye. Ten years later, President Micombero
was deposed by Pierre Buyoya in another coup. It was
not until 1993 that Burundi held its first multi-party
elections, which were won by President Melchior
Ndadaye. His assassination four months later plunged
Burundi into ethnic conflict, which resulted in the loss of
an estimated 300,000 lives. Thereafter, Parliament
appointed two Presidents in quick succession, Cyprien
Ntaryamira (who was killed when an airplane he was
travelling in was shot down in April 1994), and
Sylvestre Ntibantunganya who ruled for about two
years until he was overthrown in 1996 by President
Pierre Buyoya (BBC, 2010). In response to this coup,
the World Bank (1999) reports:
“Regional leaders imposed economic sanctions
covering trade and transportation, with dramatic effect
on growth, poverty, and social indicators. Many
bilateral donors observed these regional sanctions, and
aid levels fell from around US$300 million per year to
US$27 million”.
From 1999, leaders from other African countries
facilitated talks with the warring factions aimed at
brokering a peace deal. In particular, the late former
President Mwalimu Julius Nyerere of Tanzania initiated
the process. Following Mwalimu’s death in 1999,
former President Nelson Mandela of South Africa was
instrumental in the signing of the Arusha Peace
Agreement in 2000, which paved the way for the
establishment of a transitional government. However, it
was not until 26 August 2005 that President Pierre
Nkurunziza became Head of State when his party, the
National Council for the Defense of Democracy-Forces
for the Defense of Democracy (CNDD-FDD), won the
second ever democratic elections in Burundi
(Bigirimana, 2005). These elections were held following
a 2004 referendum in which voters endorsed a
power-sharing constitution.
The new government was faced with the formidable
challenge of rebuilding Burundi’s economy. In the
decade following 1975, the economy grew at a modest
rate of 0.5% a year. From the late 1970s to 1992,
economy grew at a faster annual rate of almost 4%,
largely due to a coffee boom. However:
“Economic prospects were significantly affected by
the civil war which occurred between 1993 and 2000,
during which the national capital stock depreciated by
44%, real GDP per capita fell by almost 27% (from
US$137 to US$100), and by 2002 the number of
people below the national poverty threshold increased
from 35% to 68%...[From 1993 to 2000], average real
GDP growth fell to -2.4% per annum” (IMF, 2006).
Peace and economic recovery
efforts since 2005
From 2005, the new Government began to implement
the “disarmament, demobilisation, and reintegration of
former combatants and the armed forces” (GoB, 2005).
With the support of the IMF and other development
partners, it also embarked on implementing macroe-
conomic and fiscal reforms, including: improving
governance and efficiency of the central bank; slowing
monetary growth by reducing levels of credit made
available to government; liberalising exchange rate
system; strengthening public financial management
systems; controlling public expenditure; reforming tax
administration; and introducing structural reforms in the
coffee sector. Furthermore, GoB “made good gover-
Domestic Resource Mobilisation for Poverty Reduction in East Africa: Lessons for Tax Policy and Administration
121
Domestic Resource Mobilisation for Poverty Reduction in East Africa: Lessons for Tax Policy and Administration
1 http://www.unctad.org/sections/ldc_dir/docs/ldcmisc20053_bdi_en.pdf [Accessed 2 April 2010].2 https://www.cia.gov/library/publications/the-world-factbook/geos/by.html [Accessed 2 April 2010].
122
nance and combating corruption a primary objective of
its administration” (IMF, 2006). To this end, it establi-
shed an audit function and drafted anti-money launde-
ring legislation.
To address poverty issues, following a consultative
process, in 2006, GoB prepared its first full Poverty
Reduction Strategy Paper (PRSP). The PRSP has four
strategic objectives: (i) improve governance andsecu-
rity; (ii) promote sustainable and equitable economic
growth; (iii) develop human capital; and (iv) combat
HIV/AIDS. By late 2006, Burundi’s macroeconomic
performance began to show signs of improvement:
Monetary policy was stronger; inflation was down to
single digit (but started to rise again thereafter due to
high commodity prices before declining again in
2008/09); and the economy started to grow. “Real GDP
growth increased to 4½% in 2008, up from 3.6% in
2007, mainly because of a good coffee harvest and
more donor-financed investment projects” (IMF,2009b).
As a result of the global crisis, economic growth decli-
ned to 3½% in 2009, but is expected to recover in the
medium term.
Agriculture, until a few years ago, was the predominant
contributor to Burundi’s economy. In 2003, according
to the United Nations Conference on Trade and Deve-
lopment (UNCTAD), agriculture, services and industry
contributed 42%, 32% and 19% respectively to
Burundi’s GDP.1. A report by the United States Agency
for International Development (USAID) in 2005 revea-
led that “agriculture employed 93% of the labour force”.
Nonetheless, estimates for 2009 indicate a substantial
shift in the composition of Burundi’s GDP with agricul-
ture, services and industry contributing 33.3%, 45.8%
and 21% respectively2.
Within a few years of achieving relative peace and
stability, Burundi’s social, political and economic pros-
pects now look promising. In its first progress report on
implementation of the PRSP, GoB (2008) reported the
following:
• As “of end-December 2007, some 20,330 persons
had been demobilised out of [a] total manpower of
55,000”;
• “A national decentralisation and development
policy letter [was] adopted and the law organising
the administration….revised”;
• Substantial expenditure on primary education by
GoB and development partners facilitated access
to free primary education for many Burundian
children. The IMF (2010) reported a significant rise
in net enrolment rates to 81% in 2008, up from 43%
in 2000;
• Immunisation coverage was vastly expanded. By
2008, 75% of children, aged between 12 and 23
months, had been immunised against measles (IMF,
2010). GoB also accorded high priority to preven-
tative and curative care to HIV/AIDS patients; and
• On 18th June 2007, at a ceremony in Kampala,
Burundi signed the treaties of accession into the
EAC.
Development financing mix and
challenges
Figure 4.1 shows trends in the overall development
financing mix for Burundi. Between 2000 and 2007, the
largest source of development financing was bilateral
aid, which averaged at 36.5% of GDP and grew at an
average rate of 26.9% a year. GoB also financed its
expenditures from domestic revenues, the second
source of development financing (see Section on
Domestic revenue performance).

Exports of goods and services between 2000 and 2008
contributed on average 8.6% of GDP, and were the
third largest source of development financing. Bu-
rundi’s exports are largely primary commodities – in
particular, “coffee exports have accounted for about
75% of export revenues in recent years” (Basdevant,
2009). As a result, foreign exchange earnings are vul-
nerable to fluctuations in the international commodity
prices. Burundi’s landlocked status and weak infra-
structure also undermine its export competitiveness.
Between 2000 and 2008, direct investment in Burundi
was negligible, at 0.2% of GDP. This happened despite
the fact that GoB is open to foreign direct investment
(FDI), especially in the mining, tourism and services
sectors. Burundi has deposits of nickel, gold, uranium,
cobalt, copper, platinum, among others, and “preliminary
works with two drills have shown possibilities of finding
oil resources in the depth of the base of Lake Tanga-
nyika” (Davenport, 2008). However, a 2010 UNCTAD re-
view indicates that “the challenge for Burundi to attract
significant FDI inflows is considerable” as the nation still
needs to strengthen its business environment, infra-
structure and human capital. Nevertheless, in recent
times, several international as well as African businesses
have invested in Burundi, including Ecobank of Nigeria,
and Diamond Trust and Bank of Africa from Kenya.
Compared to other EAC countries, Burundi’s total
public expenditure and net lending since 2001 has
been relatively high at 27.2% and 36.8% of GDP in
2001 and 2005 respectively. Military expenditure, ran-
ging between 6.2% and 8.0%, constituted a large part
of this expenditure. Burundi has financed a significant
proportion of its public expenditure by borrowing. By
2005, the country’s external debt had reached unsus-
tainable levels, at 189.3% of GDP (IMF, 2006). At that
point, the IMF and World Bank worked closely with
Domestic Resource Mobilisation for Poverty Reduction in East Africa: Lessons for Tax Policy and Administration
123
3 Data on ODA for 2008 is not available.
-20%2000 2002 2008200720062005200420032001
100%
80%
60%
40%
20%
0%
Total bilateral aid to all sectors Exports of goods & services
Total revnue excl. grantsDirect investment in reportingeconomy (FDI Inward)
Migrant remittance inflows
Figure 4.1: Trends in Burundi’s overall development financing mix (2000 to 2008)3
Source: Africa Economic Outlook (AEO) 2010 data
GoB to ensure that Burundi met the criteria required to
qualify for debt relief under the Heavily Indebted Poor
Countries (HIPC) initiative. In January 2009, Burundi
had reached the completion point under HIPC. As a re-
sult, it qualified for debt relief in the amount of US$833
million, and was also “eligible for further debt relief from
the IMF, IDA, and the African Development Fund (AfDF)
under the Multilateral Debt Relief Initiative (MDRI)”4:
Political economy dynamics
underpinning domestic
resource mobilisation
The synopsis of the political economy legacies that
have impacted DRM, as presented in the subsections
that following, is based on Brautigam’s (2008) analyti-
cal framework5. It consists of five facets: (i) level of
economic development and economic structure; (ii)
societal factors: culture, values, trust and ‘tax morale’;
(iii) war and taxes: bureaucratic modernisation as a
response to threat; (iv) political institutions and tax
systems; and (v) taxation and fiscal contract.
A small economy dominated
by agriculture and a large
informal sector
Burundi’s economy has always been predominantly
agriculture based. It is mainly subsistence, but there are
a few limited export commodities. Coffee and tea ac-
count for most of the foreign currency earnings6. Many
years of war ravaged the economy, but paradoxically, a
significant level of modern business activities continued.
In the years of war, economic performance was erratic
with an overall decline, but interspersed with some
years of positive growth.
Economic recovery has been evident since 2005, but
signs of particularly high economic growth are lacking
in the short-to-medium term. For instance, IMF (2010)
projects the real GDP growth will be 4.5% and 4.8% in
2011 and 2012 respectively. It indicates that, in the
foreseeable future, the economy will remain small, an-
continue to be dominated by agriculture and a large
informal sector, which accounts “for 75% of urban
employment” mainly in the capital city of Bujumbura
(World Bank, 2010). This reflects an economy with
severe binding constraints to DRM.
An evolving culture
of nationhood and social
solidarity, but high levels
of distrust remain and tax
morale is virtually non-existent 7
Until relative peace was restored in 2005, the pronoun-
ced socio-culture characteristic for many years was
conflict and fear among the population due to violence
and the “unequal distribution of economic resources
and political power” (Taabco, 2008). However, a sense
of nationhood, social cohesion, as well as individualism
is fast evolving. According to the USA’s Special Advi-
ser to the Great Lakes Region: “If you go to Burundi
today, though they still have many issues in front of
them, you will no longer hear the dialogue framed in
terms of Tutsi versus Hutu”8.
Domestic Resource Mobilisation for Poverty Reduction in East Africa: Lessons for Tax Policy and Administration
4 http://www.imf.org/external/np/sec/pr/2009/pr0918.htm [Accessed 2 April 2010].5 Brautigam’s framework is adopted because compared to others that were examined; it is judged to be more comprehensive and elegant. However,like most others, its historical perspective derives too much from the emergence of the modern European state to be linearly applied to states that arelegacies of colonial rule, such as Burundi.6 http://news.bbc.co.uk/2/hi/africa/country_profiles/1068873.stm [Accessed 2 April 2010].7 In a society where “tax morale” is high, there are low levels of tax evasion and avoidance. It is only in a social culture where citizens generally appre-ciate their responsibility for sustaining state services and where they have a trust in their state institutions and leaders that a “tax morale” evolves.8 http://allafrica.com/stories/200911090605.html [Accessed 2 April 2010].
124

Yet, a strong distrust of political leaders still persists. Ho-
wever, there is no questioning of the legitimacy of the go-
vernment in power – “The [2005] elections were…judged
to be free and transparent…[producing], a clear result
which…gave legitimacy to the new institutions” (Umoya,
2009). However, politicians’ role in instigating hostilities in
the past, coupled with public experience and perception
of widespread corruption, has sustained a high-level of
distrust of political leaders and government. In this envi-
ronment, tax morale is virtually non-existent.
Following cessation of hostilities, peaceful co-existence
is a treasured value all round. It appears that the vast
majority of Burundians will go to any length to ensure
that peace and stability prevail. They recognise “that
their economy has been destroyed,…society [is] fragile
and they can only manage with support from neigh-
bours, the region and the international community” (The
East African, 2010). This is an environment in which a
government, with a clear vision and strong strategy for
economic growth and poverty reduction, can propa-
gate tax morale.
No attempt at bureaucratic
modernisation until recently
Until the ongoing initiative to establish OBR, there has
been no attempt at bureaucratic modernisation in
Burundi. One of the paradoxes of the prolonged war in
Burundi is that the bureaucracy (public service) remai-
ned largely intact, albeit, demoralised and with dimini-
shing capacity. Thus, annual statements of central
government operations throughout the years of conflict
indicate that the public service bodies, including the
revenue collection departments in the Ministry of Fi-
nance, continued to collect taxes and regularly pay
both public servants and the military personnel. Accor-
ding to key informants to this case study, this compa-
ratively solid state of public administration is largely
attributed to the legacy of Belgian colonial administra-
tion. It is nonetheless paradoxical that, as the review of
tax revenue performance will show, the military coups
and prolonged civil war did not seriously disrupt the tax
administration system or even undermine the tax ef-
forts. It also explains why they didn’t result in low tax-
to-revenue GDP ratios. On the contrary, the ratios,
which ranged between 16% and 18% from 1998 and
2008 (see Section on Domestic revenue performance),
have consistently been higher than in all the EAC coun-
tries, except Kenya, for most years where comparative
statistics are available. Some key informants explained
this paradox on the basis of the distinct possibility that
there have been persistent measurement errors
through the years, in particular, a gross understatement
of the GDP. This perspective is backed by the fact that
in spite of high tax collection levels, Burundi is still hea-
vily dependent on international development assis-
tance. In any case, aside from the latter perspective,
there is no ready explanation as to why the tax and
other public administration systems did not collapse
under the disruptive effects of civil war. Therefore, al-
ternative hypotheses to explain the paradox are war-
ranted. Three are proffered here. First, successive elites
that captured power in Burundi over the years appre-
ciated the need for preserving the tax administration
institutions as instruments that could facilitate extrac-
tions from individuals as well as from the state. Accor-
ding to Nkurunziza and Ngaurko (2005), rent capture
by a small group was the overarching objective of suc-
cessive governments since the mid-1960s. The second
alternative hypothesis, and they are not mutually exclu-
sive, is that the public administrators were knowled-
geable enough to keep paying adequate royalties to the
ruling elite in return for preserving the system and retai-
ning their jobs and associated perks. Whatever the fac-
tors, it is noteworthy that a robust tax administration
system survived the wars in Burundi. The third pers-
pective is that the elites who captured power made an
effort to sustain the tax system because, until recently,
there has not been any strong local motivation to re-
create or reform the revenue collection institutions.
Domestic Resource Mobilisation for Poverty Reduction in East Africa: Lessons for Tax Policy and Administration
125

Limited political interference,
but bureaucracy and corruption
characterise public
administration
As indicated above, the colonial administration
bequeathed successive Burundi regimes a tax system
that was embedded in public administration structures
under conventional ministries. It would seem that
Burundi’s political institutions did not, on the whole,
interfere with either the public administrations or the tax
systems. However, prolonged conflict and instability
associated with the war spawned rampant corruption in
all aspects of public sector management, including tax
administration. A study commissioned by USAID (2006)
reported that “tax collection is clearly lower than its
potential; and customs duties are routinely evaded by
deliberate misclassification and abuse of exemptions”.
It would appear that the only restraint to total fraud in
the tax administration was public service managers’
concern to ensure the availability of resources for
salaries and rudimentary operating expenditures.
Another USAID (2008) report suggests that:
“The problem [of corruption] is exacerbated by Bu-
rundi’s unstable political situation; when ministers and
agency heads change frequently, there is little oversight
and a strong incentive for incumbents to grab what they
can while they can”.
The onset of peace does not seem to have abated
fraud and corruption. It is against this background that
the GoB has recently established OBR. The momen-
tum to establish the revenue authority was also driven
by Burundi’s accession to the EAC. The other four part-
ner states already have autonomous revenue authori-
ties (ARAs). The President of Burundi and other political
leaders have expressed that: (a) OBR will be modelled
along the lines of the best systems and practices of the
other EAC ARAs; and (b) OBR will overcome the
constraints around staff competence and morale,
bureaucracy and corruption that characterised the
legacy tax administration system.
A fiscal contract between
the state and its citizenry
was never a real prospect9
In the absence of democratic practice during much of
the period of Burundi’s post colonial existence, a
fiscal contract between the state and its citizenry was
never a real prospect. It could be argued that the
bureaucracy enforced the legacy tax system because
the associated revenue was critical to its own survi-
val. In these circumstances, the tax base remained
narrow, and focused on areas where enforcement was
easy. This situation has continued until today. Accor-
ding to key informants, about 200 large taxpayers
contribute 80% of total internally collected revenues,
and 1,500 small and medium taxpayers pay the rest.
“Indeed, one company—Brarudi, the brewery—contri-
butes over 20% of non-customs tax revenues”
(USAID, 2008).
The need for a fiscal contract has also been rendered
somewhat irrelevant by the availability of substantial
external resources to fund public service delivery and
development activities. The IMF (2010) reports that in
2007 and 2008, government financing from external
grants as a percentage of GDP was 20.9% and 24.9%
respectively. In addition, government financing from
external grants as a percentage of GDP was projected
to rise to 90.3% in 2009, mainly as a result of debt
relief through the HIPC initiative, but is expected to drop
to 25.0% in 2012 (IMF, 2010).
Domestic Resource Mobilisation for Poverty Reduction in East Africa: Lessons for Tax Policy and Administration
9 Fiscal contract has its genesis in agreements between European monarchies and the propertied class and merchants that the latter would contributeto state coffers, especially to fund war in return for specific benefits. In modern times, a fiscal contract would be characterised by government pledgesof specific socioeconomic benefits to justify taxation. This is a more realistic proposition in a democratic dispensation.
126
Fiscal governance drivers,
results and trajectory
Other than the public service sustaining the legacy
fiscal frameworks and the tax administration system,
there is some evidence of one other indigenous fiscal
governance driver in the past – i.e., rent capture by an
elite. As Nkurunziza and Ngaurko (2005) observed, rent
capture by a small group was the overarching objec-
tive of successive governments since the mid-1960s.
Nevertheless, it would appear that IDOs have also been
key drivers of fiscal governance in Burundi in periods
of relative peace. Since 2005, Burundi has had an
exceptionally high share of external development
assistance in its public expenditure budget. In aggre-
gate, development assistance is estimated to be bet-
ween 55% and 60% of total public expenditure.
However, prolonged war denied GoB and development
partners the opportunity to develop a systematic policy
dialogue. Following the 1996 coup, donor sanctions
were only lifted in 2000 when:
“International assistance resumed…, demonstrated
by the pledges of UD$440 million made at the interna-
tional donor conference held in Paris in December
2000, and the additional pledges at the Round Table
donors meeting in Geneva in December 6-7, 2001,
bringing the pledges to US$830 million” (World Bank,
2002).
Still, in the past four years, besides receiving
conventional assistance, GoB has engaged in policy
dialogue with IDOs, particularly the IMF and World
Bank, leading to the write-off of its debts under the
HIPC initiative. Concurrently, it has entered into a
Poverty Reduction Growth Facility (PRGF) with the IMF.
Both HIPC and PRGF commit GoB to macroeconomic
and fiscal performance benchmarks, as well as to a
more stringent fiscal discipline, including the reduction
of subventions to loss-making enterprises. On the heels
of HIPC and PRGF, GoB has also entered into
consultative policy dialogue with other IDOs under the
leadership of the World Bank. One significant benefit of
these developments is access to budget support from
five international development partners, including the
AfDB. If the GoB can sustainably deliver on its policy
commitments in the short term, it can expect to
benefit from substantial additional budget and project
support in the long run.
After five years, majority of Burundians are still waiting
for peace dividends. Furthermore, “socio-economic
instability has not been dealt with as a priority”, in
particular, through creation of employment and income-
generating activities for the redundant ex-combatants
and large numbers of idle youth (Specker et al, 2010).
In addition, the same authors state that “current
patterns of economic governance do not appear well
suited to a concerted, medium- to long-term project for
development”.
GoB anticipated a considerable increase in the volume
of external resources after the elections of June 2010.
Furthermore, in the medium term, building the capacity
of OBR is expected to result in improved tax revenue
collection. Therefore, from a historical perspective,
Burundi’s medium- to long-term fiscal governance
trajectory holds promise.
Domestic Resource Mobilisation for Poverty Reduction in East Africa: Lessons for Tax Policy and Administration
127

Trends in the tax system
Key tax policies since 2005
In the years of political instability and violence, there
was no proactive tax policy stance by successive
governments. In 2005, GoB initiated reform of its tax
systems with a focus on lowering and streamlining the
tax regime. It was aimed at “raising domestic revenue,
reducing smuggling, simplifying administration and
boosting trade” (IMF, 2005). This sub-section highlights
key developments with respect to the three major
categories of taxes collected in Burundi: taxes on
domestic goods and services; income tax; and taxes
on international trade.
On 1 July 2009, GoB introduced VAT at a standard rate
of 18%, except for exports which are zero rated, and
imports for diplomatic and certain international
organisations which are exempt. It replaced the
transaction tax (Decree Law No. 1/04 of 1989 and
1/005 of 1994), which was levied at a rate of 17%10.
The rationale for its introduction was twofold: “to raise
the efficiency of tax collection, and offset potential
losses on customs revenue due to [Burundi’s]
accession to the EAC” (IMF, 2008). GoB also prepared
an action plan to phase out the transaction tax.
The other tax levied on domestic goods and services is
excise, which is levied on beer, soft drinks and tobacco
in accordance with Decree Law No. 01/02. Products
destined for export are exempt from excise tax.
Income taxes are levied in accordance with Part II of
the General Tax Code, which was first enacted in 1963
and amended numerous times since then11. The
highest marginal income tax rate on companies is 35%.
The rate is levied on “all net profits received by
domestic and foreign companies from Burundi
sources” (IMF, 2004). Certain institutions are exempt
from corporate tax (e.g., firms covered under the
investment code, agriculture and livestock businesses).
It is also noteworthy that loss-making companies are
required to pay corporate tax equivalent to 1% of their
turnovers. There is also a tax on capital income (of 35%)
payable on dividends and equity ownership in
companies. Personal marginal income tax rates range
from 0% to 60%, However, exemptions are offered
again, for example, to any income covered by
international conventions (e.g., the Vienna convention).
In addition, a “rental income tax is [levied] based on…
progressive tax brackets, ranging from 20% to 60%”
(GTZ, 2009).
Burundi became a signatory to the EAC Customs
Union protocol in July 2009, prior to which: import
duties were levied in accordance with Preferential Trade
Area (PTA) tariffs for goods emanating from PTA
countries; customs duties were charged on goods from
outside the PTA area; an ad valorem tax was payable
on petroleum products; and a 6% services tax was
charged on cost, insurance and freight (CIF) values. The
Protocol is enshrined into the East African Community
Customs Management Act of 2004, which underpins
the establishment of CETs and elimination of internal
tariffs. It also brought about the: harmonisation of
customs principles and procedures; and removal of
suspended duty.
It is noteworthy that in 2008, Burundi’s National
Assembly promulgated a new investment code
simplifying “existing legislation and [harmonising it] with
frameworks applicable in the EAC” (De Backer and Bi-
nyingo, 2008). Under the code, an Investment
Promotion Agency is to be established. The code also
broadens eligibility criteria to allow existing firms as well
as those requiring rehabilitation to receive
incentives. In addition, the new legislation provides for
“tax advantages for investors [to be granted
automatically] rather than… [through] prior authoriza-
tion” (USAID, 2008). However, implementation of the in-
Domestic Resource Mobilisation for Poverty Reduction in East Africa: Lessons for Tax Policy and Administration
10 Previously there were three different transaction tax rates levied: (1) 7% (e.g., for agriculture, fishery and livestock products; meat and real estate sales);(2) 17% (e.g., on imports, manufacturers, services); and (3) 20% (e.g., on telecommunications, sales of cigarettes).11 However, GoB has issued “additional laws as well as orders…and rules” (GTZ, 2009)
128

vestment code has been on hold as “provisions
concerning tax incentives make reference to the tax
code”, which has only recently been drafted (World
Bank, 2009).
In an effort to streamline the tax system (particularly
indirect taxes) and remove exemptions, the National
Assembly, in its 2008 budget, promulgated a new tax
on cable television, hotel and tourism. It also elimina-
ted “the transaction tax on real property transfers; and
[reduced] transfer tax [rate] on…property sales from 6%
to 3%” (GoB, 2008).
Other institutional changes
In 2009, Parliament passed the OBR Law, which came
into force on 14 July of the same year (IMF, 2010). OBR
aims to: widen tax base and mobilise more revenue;
narrow communication gap between taxpayers and the
fiscal administration and, thereby improve relationships;
provide better services to
taxpayers including education; simplify tax administra-
tion procedures; and promote improved staff
performance.
The authority did not become operational until 1 April
2010. Since then, the implementation momentum has
picked up with the support of the Department for
International Development (DFID). It appears that the
establishment of the OBR is significantly influenced by
the models and experiences of the other EAC ARAs,
especially the Rwanda Revenue Authority.
At the time of writing this paper, OBR intended to hire
600 people through an open-recruitment process. The
first two phases of recruitment for 21 executive and se-
nior management team positions had been completed.
Then a Commissioner General (CG),
Deputy Commissioner General (DCG), Commissioners
and Directors were recruited following: the screening
and short-listing of over 400 applications; further can-
didate screening through assessment
centres; and selection by the Board following
assessment centres.
A Board of Directors, comprising eight members from
the private and public sectors, and accountable to the
Ministry of Finance, had been appointed. The Board is
required by legislation to meet on a monthly basis.
However, in the initial stages of OBR’s launch, it met
every week.
Three Commissioners report to the CG: Customs and
Excise; Domestic Tax and Non-Tax Revenue; and
Investigations and Anti-corruption. In addition, CG is in-
charge of various technical support functions such as:
appeals; research and performance; taxpayer
information; risk analysis; internal audit and assurance;
and EAC matters. The DCG is responsible for functions
such as finance, human resources, and ICT and
electronic business.
Changes in administrative
systems
The systems supporting the administration of inland
revenues are largely manual. The study team was
informed that in 2005, GoB procured a computer-
based system, NIF, to generate and maintain tax
identification numbers (TINs). However, the system has
not been effective due to some technical defects. The-
refore, GoB is looking to install a more reliable
automated TIN system.
“A new customs code was promulgated in 2007 to
make customs procedures more efficient [and to
comply with the Kyoto protocol]” (IMF, 2008). This
customs code has been incorporated in Automated
System for Customs Data ++ (ASYCUDA++). This
version of ASYCUDA allows for direct trader input so
that importers can lodge declarations from their bases,
Domestic Resource Mobilisation for Poverty Reduction in East Africa: Lessons for Tax Policy and Administration
129
thereby facilitating a reduction in clearance times. OBR
also uses ASYCUDA++ to generate trade statistics,
which are exported to an ORACLE database that is
used to convert data into formats, such as Excel and
Access. At the time of writing this report, OBR was
pilot testing the RADDEX system. It is also operational
in Kenya, Rwanda, Tanzania and Uganda.
OBR recently launched a French language website
http://obr-gouv.org/ . Understandably, this website is
still at the ‘bill-board stage’ – it currently provides news,
information (e.g., on organisational arrangements, se-
nior executives, vacancies etc.) and downloads (e.g.,
legislation). With time, OBR will presumably develop its
website to provide various taxpayer services. Further-
more, given that Burundi is part of the EAC, the web-
site will hopefully offer information and services in other
languages, such as English and Kiswahili.
Fiscal decentralisation and
taxation by local governments
Public administration in Burundi is, on the whole,
characterised by weak capacity at the central and local
government levels, including paltry local revenue
collections. Decentralisation and the local finance
system are in their infancy. Although the decentralisa-
tion process was started in 2005, it is still being dis-
cussed at Cabinet level and major progress is not
expected before the completion of central and local
elections in 2010 (Specker and Briscoe 2010).
Reform sequencing,
implementation and results
OBR has barely been in existence for more than a few
months. Therefore, it is expected that, with time, the
agency’s management will map out a comprehensive
reform strategy to support attainment of its objectives
as outlined in Section on “Other institutional
changes”.
However, it is worth drawing attention to the fact that
some of the tax policy measures and planned systems
described earlier, constituted part of GoB’s immediate
reforms under the PRGF. For example, the French
Development Agency assisted GoB in the development
of the new customs code. Furthermore, OBR is recei-
ving financial and/or technical assistance support from:
the IMF in the area of VAT; DFID through Trademark
East Africa in establishing OBR; and the World Bank’s
Financial and Private Sector Development, and Econo-
mic Management Support Projects in simplifying tax
procdures.
At this stage, it is premature to gauge the impact of tax
and administrative reforms on DRM. However, GoB
with the support of its development partners, has
accomplished the following:
• GoB undertook a “budgetary and economic impact
study on Burundi’s entry into the EAC” (GoB, 2008).
It also assessed the impact of introducing the VAT.
In the medium term, both policy measures are
expected to have a “positive impact on revenue...
[however the], studies show that they could result in
a loss of revenue amounting to about 0.4% of GDP
in 2009” (IMF, 2009a);
• The VAT law which brings Burundi closer to
ensuring that its tax regime is better aligned with
international practices, and Burundi’s partner states
in the EAC;
• By adopting the EAC Customs Union protocol (and
thereby CETs), Burundi has contributed to simpli-
fying the trading environment within East Africa. To
cushion Burundi from initial revenue losses as a
result of adopting the CET regime, it received
Domestic Resource Mobilisation for Poverty Reduction in East Africa: Lessons for Tax Policy and Administration
130

US$6.5 million from the Common Market for East
and Southern Africa’s Compensation Fund12. By
adopting CETs, Burundi expects to lose Burundi
Francs2.7 to 3.1 billion (about US$2.2 million to
US$2.5 million) a year. However, it anticipates that
by widening the tax base and through increased
production, any losses will be recouped13;
• A new authority (OBR) is operational and offers
significant promise in enabling GoB to increase and
better administer domestic resources;
• The new RADDEX system is almost fully
operational and should help to streamline
clearance processes as well as reduce theft and
fraud; and
• GoB has made a commitment to realign its fiscal
year, which runs from 1 July to 30 June. This
change will enable all five EAC member states to
formulate policy, read their budgets and implement
policy measures concurrently.
In addition to the above, initial reports from GoB sug-
gest that the VAT performed well in the first quarter of
its implementation. According to a source from the Mi-
nistry of Finance, “fiscal revenues grew 38% in the third
quarter of 2009 compared with the same period…
[in 2008] due to higher” VAT collections (Reuters, 2009).
Domestic Resource Mobilisation for Poverty Reduction in East Africa: Lessons for Tax Policy and Administration
12 http://about.comesa.int/lang-en/publications/other-press-coverage/243-rwanda-burundi-get-22m-lost-revenue [Accessed 6 April 2010].13 http://www.senat.bi/spip.php?article1375 [Accessed 6 July 2010].
131
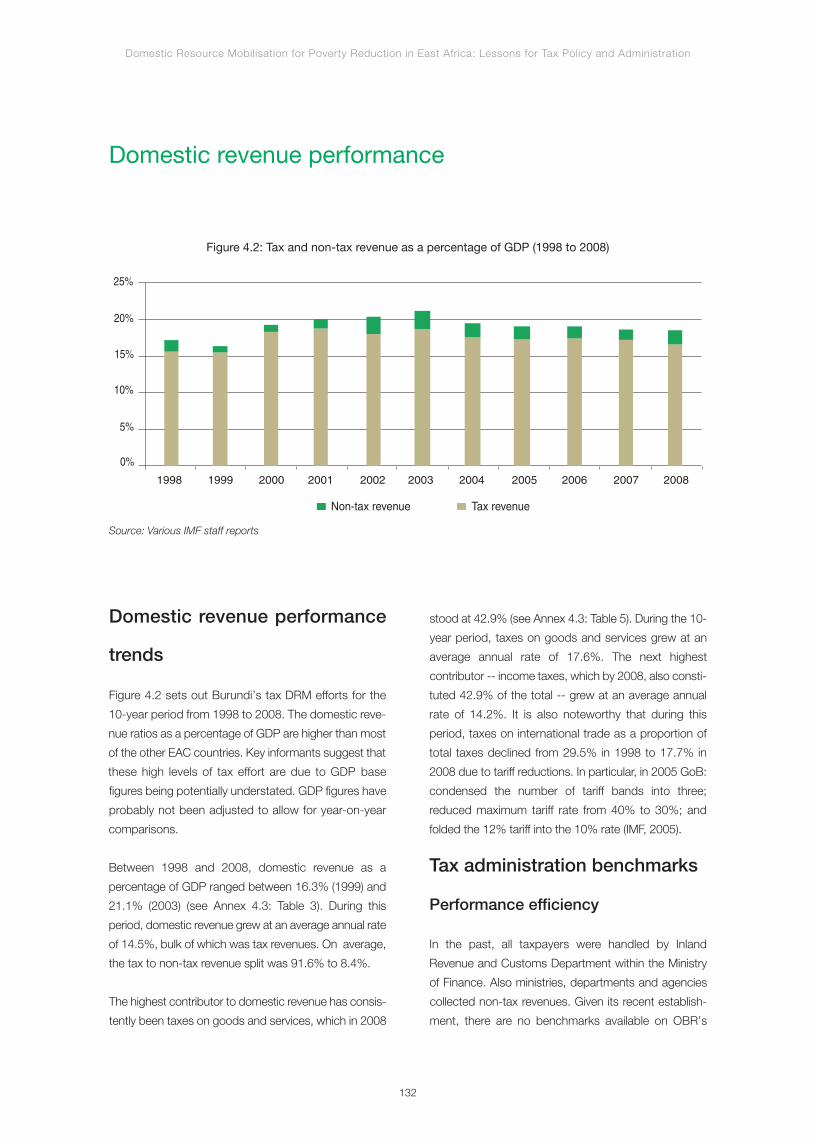
Domestic revenue performance
Domestic Resource Mobilisation for Poverty Reduction in East Africa: Lessons for Tax Policy and Administration
132
20082007200620052004200320022001200019991998
25%
20%
Non-tax revenue Tax revenue
15%
10%
5%
0%
Figure 4.2: Tax and non-tax revenue as a percentage of GDP (1998 to 2008)
Source: Various IMF staff reports
Domestic revenue performance
trends
Figure 4.2 sets out Burundi’s tax DRM efforts for the
10-year period from 1998 to 2008. The domestic reve-
nue ratios as a percentage of GDP are higher than most
of the other EAC countries. Key informants suggest that
these high levels of tax effort are due to GDP base
figures being potentially understated. GDP figures have
probably not been adjusted to allow for year-on-year
comparisons.
Between 1998 and 2008, domestic revenue as a
percentage of GDP ranged between 16.3% (1999) and
21.1% (2003) (see Annex 4.3: Table 3). During this
period, domestic revenue grew at an average annual rate
of 14.5%, bulk of which was tax revenues. On average,
the tax to non-tax revenue split was 91.6% to 8.4%.
The highest contributor to domestic revenue has consis-
tently been taxes on goods and services, which in 2008
stood at 42.9% (see Annex 4.3: Table 5). During the 10-
year period, taxes on goods and services grew at an
average annual rate of 17.6%. The next highest
contributor -- income taxes, which by 2008, also consti-
tuted 42.9% of the total -- grew at an average annual
rate of 14.2%. It is also noteworthy that during this
period, taxes on international trade as a proportion of
total taxes declined from 29.5% in 1998 to 17.7% in
2008 due to tariff reductions. In particular, in 2005 GoB:
condensed the number of tariff bands into three;
reduced maximum tariff rate from 40% to 30%; and
folded the 12% tariff into the 10% rate (IMF, 2005).
Tax administration benchmarks
Performance efficiency
In the past, all taxpayers were handled by Inland
Revenue and Customs Department within the Ministry
of Finance. Also ministries, departments and agencies
collected non-tax revenues. Given its recent establish-
ment, there are no benchmarks available on OBR’s

operating costs as a percentage of total tax collected.
Moreover, its management is yet to determine revenue
collection targets from fiscal year 2011 onwards. Still, we
are aware that the OBR plans to service the top 100
largest taxpayers through a large taxpayers department.
It is also noteworthy that going forward, OBR has
responsibility for collecting all non-tax revenues.
Again, unlike other ARAs in the EAC, there are no bench-
marks available from secondary sources on: VAT gross
compliance ratio (VATCGR); corporate income tax
productivity (CITPROD); and personal income tax
productivity (PITPROD). However, there are two available
measures of performance efficiency. First, the World
Bank’s Doing Business Survey of 2010 ranks Burundi
116th out of 183 countries in terms of ease of paying
taxes (see Annex 4.3: Table 7)14. Second, the World
Bank’s 2010 Paying Taxes report indicates that a com-
pany is required to make 32 payments a year, which are
respectively less and more than the Sub Saharan Africa
(SSA) and Organisation for Economic Cooperation and
Development (OECD) averages of 37.7 and 12.8 a year.
Allocative efficiency
According to Ndukimana (2001), a decade ago the
authorities appeared to “be excessively lenient, granting
widespread tax exemptions…often on questionable
grounds”. A few years later, Nkurunziza and Ngaruko
(2005) observed that “large firms are more likely to
benefit from tax and duty exemptions provided for in the
Investment Code than small firms”. It is also noteworthy
that a study by Chambas and Laporte (2007)
estimate that in 2006, 60% of imports were exempted
from transaction tax, which contributed to a revenue loss
of 103.7 billion Burundi Francs (about US$84 million), or
10.7% of GDP. In addition, “they are the root cause of
the spread in fraud and corruption and thus contribute to
distortions in the national economy” (IMF, 2007).
Moreover, Burundi has one of the least conducive
business environments in the world, with an ease of
doing business ranking of 176th out of 183 countries
(World Bank, 2010). This is largely because of the poor
infrastructure in the country that discourages foreign
investors, although it provides certain incentives like tax
exemptions. Therefore, tax exemptions to attract
investments are not only likely to be ineffective but also
distortionary and allocatively inefficient15.
Performance equity
Personal income tax rates are progressive. However, it is
difficult to reliably assess the degree of progressivity
because data on the distribution of taxpayers by tax
brackets is not available. Nonetheless, there is a basis for
observing that Burundi’s income tax regime is
probably the most regressive among the EAC member
states. For example, the minimum monthly taxable
income, which is applicable to the lowest marginal tax rate
of 27%, is for earnings over 40,000 Burundi Francs
(US$33). Furthermore, the highest marginal income tax
rate is 60% for a monthly taxable income over 331,667
Burundi Francs (US$270) (GTZ, 2009). “Income taxes and
duties for Burundi are higher than those in neighbouring
countries, putting Burundian businesses at a relative di-
sadvantage” (USAID, 2008). In this regard, the World
Bank’s Doing Business Survey of 2010 reveals that Bu-
rundi’s corporate tax rate as a percentage of profit totals
a staggering 278.6% (see Annex 4.3, Table 9). As a mat-
ter of fact, its ‘total tax rate’ as a percentage of profit is
substantially higher than the OECD average of 44.5%, and
the SSA average of 67.5%. Until 2009, the transaction tax
(of 250.4%) was the major contributor to this substantial
Domestic Resource Mobilisation for Poverty Reduction in East Africa: Lessons for Tax Policy and Administration
14 http://www.senat.bi/spip.php?article1375 [Accessed 6 July 2010]. 15 www.estandardsforum.org/system/briefs/240/.../brief-Burundi.pdf [Accessed 6 July 2010].
133

tax burden, largely because it was levied on a cascading
sales tax basis. Following introduction of VAT, “the tax bur-
den as measured by Doing Business is expected to fall
substantially in future years” (World Bank, 2010).
Performance effectiveness
There were no readily available data on Burundi’s tax
effort and gap. However, there are indications that
corruption, tax evasion and the tax exemption regime
are serious problems. For example, the East African
Business Council’s (EABC’s) Business Climate Index
survey of 2008 reports that out of the five EAC states,
“the number of business leaders who stated that
bribery at customs was a major obstacle in business
was highest in Burundi at 68%”.
It can therefore be inferred that there is probably signi-
ficant scope for Burundi to reduce its tax gap and in-
crease tax effort, and thereby its performance
effectiveness.
Summary of overall trends
In the 10 years, from 1998 to 2008, in spite of pro-
longed civil war, Burundi’s domestic resources on
average grew at 14.5% a year, contributing 19.1% to
GDP annually. There are no ready explanations for the
paradox that the civil war did not result in the collapse
of the tax administration. But some hypotheses to ex-
plain this have been offered in sub-section on “Politi-
cal economy dynamics underpinning domestic
resource mobilization”. OBR inherited a comparati-
vely well-performing tax administration system.
Growth in future years is expected to improve with
the introduction of VAT, establishment of OBR, and
systems modernisation. However, Burundi simulta-
neously needs to widen its tax base, further simplify
tax regime, curb corruption and tax evasion, as well
as manage tax exemptions/incentives more effecti-
vely. Still, in the medium term, there will probably be
acute limitations on Burundi’s DRM growth for as
long as the economy remains small.
Domestic Resource Mobilisation for Poverty Reduction in East Africa: Lessons for Tax Policy and Administration
134
Challenges and issues
According to our literature review and interviews with
key informants, the potential for enhanced DRM is high
in Burundi provided peace holds. However, there are
several challenges and issues that GoB needs to tackle
in the medium term.
Managing the transition
to an ARA
Any major organisational restructuring and transforma-
tion initiative can be disruptive. In this context,
setting up OBR, recruiting tax administration staff from
scratch, and transforming ways of working all
represent a significant departure from the past. OBR
will therefore need to ensure that its tax collection
efforts are fully implemented, and any targets agreed
with the Ministry of Finance receive due attention.
Retaining staff with skills
and integrity
Significant investments have been made, and are still
underway, aimed at attracting honest and capable
personnel into OBR. For some positions, GoB has even
sought to recruit resources internationally. To
ensure that it can retain and motivate them, OBR will
be challenged to offer competitive salaries on a
sustainable basis. A commensurate remuneration
policy may also assist in reducing corruption. In this res-
pect, a USAID (2006) report suggests that “a bonus
system linked to actual customs duties collected might
perhaps be considered”.
Ensuring efficiency of tax
incentives and exemptions
Burundi is yet another country plagued with the issues
of tax incentives and exemptions. This regime seems
inequitable when one reviews the hefty overall tax
burden placed on companies that are not eligible for
any tax dispensations (see Section on “Domestic
revenue performance”). This inequity “may ultimately be
cause for tax evasion” (World Bank, 2009). Both these
scenarios inevitably lead to loss of domestic
resources. To this end, the IMF (2010) recently urged
GoB to “continue efforts to broaden the revenue base
by reducing exemptions”. These efforts will require firm-
ness and resolve of the political leadership.
Widening the tax base
Key informants maintain that several informal sector
traders operate businesses with significant turnovers
but remain outside the tax net. Others pay minimal
taxes through a single business, even when, they ope-
rate many more. In addition, according to one literature
source, “small Burundian businesses often have a foot
in the informal economy and are usually trying to mini-
mize their exposure to scrutiny from the state” (USAID,
2008). Another source suggests that there are also in-
formal businesses that are not able to comply with
GoB’s “complex and burdensome rules and regula-
tions” (World Bank, 2009). Therefore, there is a need
to: (i) forge ahead with simplifying the tax system for the
informal sector through the Financial and Private Sec-
tor Development project, which will help widen the tax
Domestic Resource Mobilisation for Poverty Reduction in East Africa: Lessons for Tax Policy and Administration
135
base and encourage formalisation of businesses; (ii) ap-
praise the informal sector to establish its size, and the
potential revenue that could be raised through taxes;
and (iii) offer taxpayer education to the informal sector.
There is legislation in place to collect property tax.
However, there are challenges around its efficient
collection. The Registrar of Property Deeds operates a
manual system. However, “computerization is under
consideration” (USAID, 2008). It may well be that pro-
perty tax revenues will never be significant, but a well-
functioning land registry system is a potentially useful
source of third partyinformation for OBR.
Combating corruption
effectively
As a nation, Burundi is flagged as having high levels
of corruption. Specifically, its place in world corrup-
tion rankings has been on a decline, indicating that
corruption is a worsening problem. In 2009, 2008 and
2007, Burundi ranked 168th (out of 180), 158th (out of
180) and 131st (out of 179) countries respectively in
the Transparency International’s corruption percep-
tion index.
Furthermore, direct taxation is considered to be one of
the main areas susceptible to corrupt practices as
“paying taxes…is cumbersome and complicated by the
multiplicity of taxes…[which] leaves room for uncer-
tainty and corruption” (World Bank, 2009).
Ensuring harmonised,
systematic and policy-led
regional integration measures
Over and above the need to address non-trade
barriers (e.g., corruption), there has been a proposal for
a comprehensive survey and analysis of the tax
systems (both direct and indirect) in the EAC partner
states. It is aimed at ascertaining the need, extent and
form of tax coordination required if the Common
Market is to function properly. Once such a study is
carried out, it would be easier to identify priorities in
terms of key issues to address. However, at this stage,
it is noteworthy that Burundi’s top marginal personal
and corporate income tax rates, at 60% and 35%
respectively, remain the highest in the EAC.
Domestic Resource Mobilisation for Poverty Reduction in East Africa: Lessons for Tax Policy and Administration
136
Lessons learned
Burundi has no significant history of tax reforms,
although it paradoxically sustained a fairly resilient tax
administration system through the civil war years. The
ongoing establishment of OBR heralds the start of an
era of reforms that other EAC countries have been
implementing over the past decade. Against that back-
drop and at this stage, there are only two lessons that
can be derived from the Burundi DRM case study.
Inaccurate national statistics
can translate into a misleading
measurement of tax effort
On the basis of statistics compiled by the IMF,
Burundi’s tax effort seems high by EAC as well as SSA
standards, even during the years of conflict and war.
Going by the tax revenue to GDP indicator (which
hovered around 16% to 18% between 1998 and 2008),
Burundi has consistently outperformed all other EAC
countries, except Kenya, for most years where
comparative statistics are available. It has been
suggested by some informants that Burundi’s GDP
figures may have been consistently understated
through the years, which results in an exaggerated
tax-to-GDP ratio. If this is the case, then statistics are
erroneous for planning purposes. Also, it is difficult to
realistically benchmark DRM performance with other
countries. This underscores the need to be cautious in
the use of statistics generated from secondary national
data to compare performance in tax administration, or
indeed other national development outcomes between
countries and their institutions.
Major policy initiatives should
be backed by rigorous
and systematic study
Burundi has demonstrated the benefits of rigorous and
systematic study as a basis for major policy develop-
ment in two instances. First, there was depth and rigor
in the study of the implications of Burundi joining the
EAC Customs Union. Second, a similar quality of
analytical effort and results are reflected in the study of
the transition from sales tax to VAT. Consequently, the
policy decisions made catered for mitigation of the risks
entailed as a result of policy changes. For example, VAT
rate was set to compensate for anticipated revenue
losses from the adoption of CETs.
Domestic Resource Mobilisation for Poverty Reduction in East Africa: Lessons for Tax Policy and Administration
137


Domestic Resource Mobilisation for Poverty Reduction in East Africa: Lessons for Tax Policy and Administration
140
Agathe Nsengiyumva (Ms), Director, Non Fiscal Revenue, OBR
Beatrice Hamenyayo (Ms), Director, Budget, Ministry of Finance
Dave Beer (Mr), Head of Office, DFID Burundi
Emile Simzumisi (Mr), Acting Commissioner General, OBR
Eric Mabushi (Mr), Resident Economist, World Bank
Hermenegilde Ndikumasabo (Mr), President, Federal Chamber of Commerce and Industry of Burundi
Joas Katanga (Mr), Director, Large taxpayers, OBR
Joseph Ndarishikanye (Mr), Commissioner of Customs, OBR
Annex 4.1: Key informants
Domestic Resource Mobilisation for Poverty Reduction in East Africa: Lessons for Tax Policy and Administration
141
Basdevant, O. (2009). How Can Burundi Raise Its Growth Rate? The Impact of Civil Conflict and State Intervention
on Burundi’s Growth Performance. IMF, 2009. WP/09/11
BBC (2010). Timeline: Burundi BBC News 25/02/10, [online].
BBC World Service Trust and Search for Common Ground (2008). Ready to Talk About the Past: A Survey of
Knowledge and Attitudes toward Transitional Justice in Burundi. BBC World Service Trust and Search for Common
Ground, 2008.
Bigirimana, C. (2005). Burundi’s Born-Again Ex-Rebel Leader BBC News 26/08/05 [online].
Brautigam, D.A. (2008). Introduction: Taxation and State Building in Developing Countries. In D.A Brautigam.,
O-H. Fjeldstad and M. Moore (eds) Taxation and State Building in Developing Countries Cambridge University
Press: Cambridge, pp. 1-33.
Chambas, G. and Laporte, B. (2007). Introduction de la TVA au Burundi Etude préalable de l’impact Budgétaire,
économique et social. CERI, November 2007.
Davenport, J. (2008). Burundi Hopes to Attract Mining Investment. Mining Weekly 22/02/08, [online].
De Backer, S. and Binyingo, O. (2008). A New Investment Code for Burundi. Published in IFLR – edition 2008.
EABC (2008). Business Climate Index Survey 2008. Prepared by the Steadman Group, October 2008.
GoB (2005). Republic of Burundi: Memorandum of Economic and Financial Policies for 2006. GoB, 2005.
GoB (2008). PRSP: First Annual Progress Report. GoB, 2007.
GTZ (2009). Tax Systems and Tax Harmonisation in the East African Community. GTZ, 2009.
IMF (2005). Burundi: First Review Under the Three-Year Arrangement Under the Poverty Reduction and Growth
Facility and Request for Waiver of Performance Criteria— Staff Report. IMF, 2005. Report no. 05/55.
IMF (2006). Burundi: Selected Issues and Statistical Appendix. IMF, 2006. Report no 06/307.
IMF (2007). Burundi: Poverty Reduction Strategy Paper. IMF, 2007. Report no 07/46.
IMF (2008). Burundi: 2008 Article IV Consultation and Request for Three-Year Arrangement Under the Poverty
Reduction and Growth Facility—Staff Report. IMF, 2008. Report no. 08/282.
IMF (2009a). Burundi: First Review Under the Three-Year Arrangement Under the Poverty Reduction and Growth
Facility and Request for Modification of Performance Criteria—Staff Report. IMF, 2009. Report no 09/93.
IMF (2009b). Burundi: Second Review Under the Three-Year Arrangement Under the Poverty Reduction and Growth
Facility and Request for Modification of Performance Criteria—Staff Report. IMF, 2009. Report no 09/242.
IMF (2010). Burundi: Third Review Under the Three-Year Arrangement Under the Extended Credit Facility—Staff
Report and Press Release. IMF, 2010. Report no 10/75.
Kezio-Musoke, D. (2009). Rwanda, Burundi to wait 3 Months for Seacom Cable Link The East African 17/08/2009,
online.
Ndukimana, L. (2001). Fiscal Policy, Conflict, and Reconstruction in Burundi and Rwanda. World Institute for
Development and Economic Research, 2001. Discussion Paper 2001/62.
Nkurunziza,J.D. and Ngaurko,F. (2005). Why has Burundi Grown so Slowly?
Reuters (2009). Burundi says Q3 fiscal revenues up 38 pct – finmin Thomson Reuters 25/11/09, [online].
Specker, L., Briscoe, I., Gasana, J.M. (2010). Early Economic Recovery in Fragile States – Case Study Burundi:
Operational Challenges. The Hague, Clingendael Institute, 2010.
Annex 4.2: Bibliography
Domestic Resource Mobilisation for Poverty Reduction in East Africa: Lessons for Tax Policy and Administration
142
Taabco (2008). Phase II Project on Reconciliation, Peace and Good Governance in Burundi 2005-2009: Mid-Term
Evaluation Report. Taabco Research Consultancy, 2008.
The East African (2010). Burundi: EAC must help out in Elections (editorial). The East African 18/01/10, [online].
Umoya (2009). Burundi: Preparing for Free and Fair Elections in 2010. Umoya 04/03/09 [online].
UNCTAD (2010). Investment Policy Review, Burundi: Main Conclusions and Recommendations. UNCTAD, 2010.
USAID (2005). Burundi: Economic Performance Assessment. USAID, 2005.
USAID (2006). Fighting Corruption and Restoring Accountability in Burundi. USAID, 2006. Prepared by Nathan
Associates.
USAID (2008). Burundi’s Agenda for Action. USAID – Business Climate Legal and Institutional Reform Project:
Burundi’s Agenda for Action, 2008.
World Bank (1999). Burundi: An Interim Strategy 1999-2001. World Bank, 1999. Report no. 19592-B.
World Bank (2002). Memorandum of the President of the International Development Association to the
Executive Directors on a Transitional Support Strategy for the Republic of Burundi. World Bank, 2002. Report no.
23635-BU.
World Bank (2009). Project Appraisal Document on a Proposed Grant in the Amount of SDR 12 million (US$19
million) to the Republic of Burundi for a Financial and Private Sector Development Project. World Bank, 2009.
Report no. 51657-BI.
World Bank (2010). Doing Business in the East African Community 2010 World Bank Group: Washington.

Annex 4.3: Selected Indicators
Domestic Resource Mobilisation for Poverty Reduction in East Africa: Lessons for Tax Policy and Administration
143
Fiscal year PAYE Corporate tax VAT
2006 60% 35% -
2007 60% 35% -
2008 60% 35% -
2009 60% 35% 18%
Table 1: Tax policy – Maximum marginal tax rates (2006 to 2009)
Source: IMF (2004), Doing Businesses and GTZ (2009)
Indicator Burundi’s measure World’s measure SSA’s measureLow income economies’
measure
TAXSTAFF - 0.82 0.37 0.20
Table 2: Ratio of tax staff per population (TAXSTAFF)
Source: http://www.fiscalreform.net/index.php?option=com_wrapper&Itemid=132 [Accessed 2 February 2010].
Fiscal year Revenue (tax and non-tax revenue) Fiscal deficit excluding grants
1998 17.1% -6.6%
1999 16.3% -9.1%
2000 19.2% -4.9%
2001 20.0% -7.2%
2002 20.3% -5.7%
2003 21.1% -14.2%
2004 19.4% -22.8%
2005 19.0% -24.3%
2006 19.0% -19.4%
2007 18.6% -19.85
2008 18.5% -23.5%
Table 3: National government revenue and fiscal deficit as a percentage of GDP
Source: Various IMF staff reports
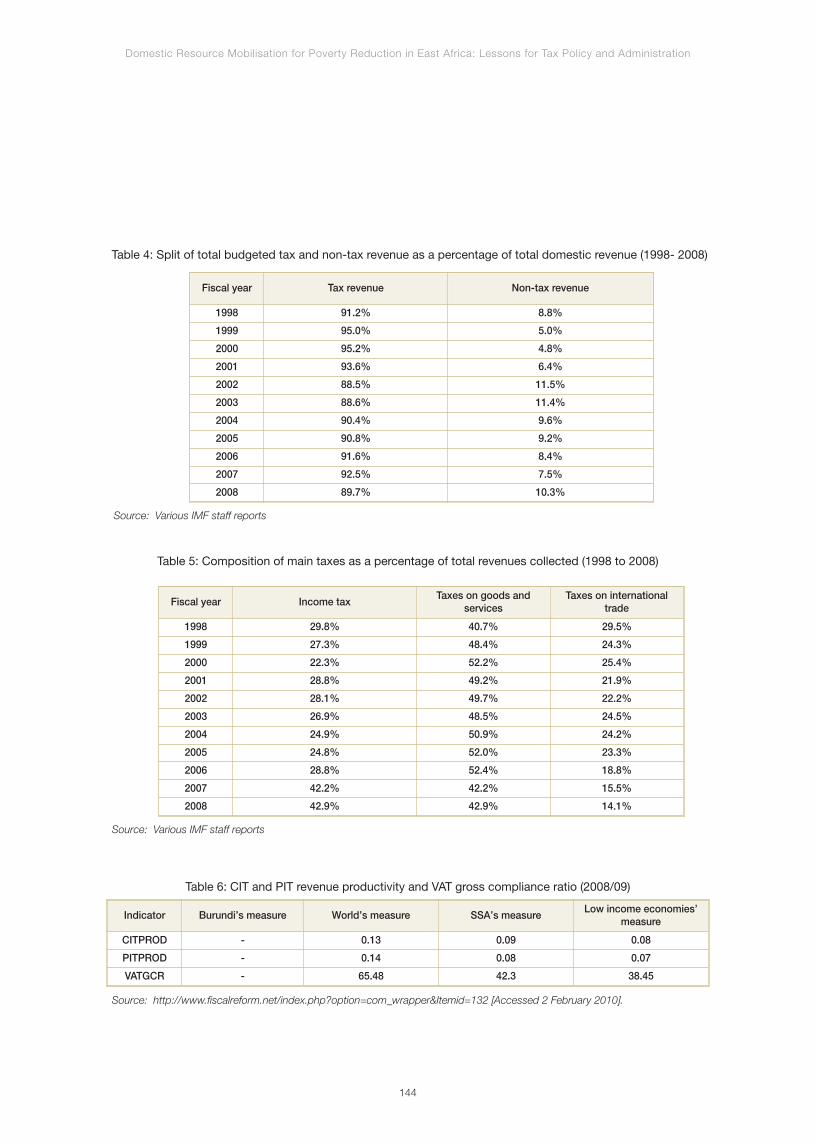
Domestic Resource Mobilisation for Poverty Reduction in East Africa: Lessons for Tax Policy and Administration
144
Fiscal year Tax revenue Non-tax revenue
1998 91.2% 8.8%
1999 95.0% 5.0%
2000 95.2% 4.8%
2001 93.6% 6.4%
2002 88.5% 11.5%
2003 88.6% 11.4%
2004 90.4% 9.6%
2005 90.8% 9.2%
2006 91.6% 8.4%
2007 92.5% 7.5%
2008 89.7% 10.3%
Table 4: Split of total budgeted tax and non-tax revenue as a percentage of total domestic revenue (1998- 2008)
Source: Various IMF staff reports
Fiscal year Income taxTaxes on goods and
servicesTaxes on international
trade
1998 29.8% 40.7% 29.5%
1999 27.3% 48.4% 24.3%
2000 22.3% 52.2% 25.4%
2001 28.8% 49.2% 21.9%
2002 28.1% 49.7% 22.2%
2003 26.9% 48.5% 24.5%
2004 24.9% 50.9% 24.2%
2005 24.8% 52.0% 23.3%
2006 28.8% 52.4% 18.8%
2007 42.2% 42.2% 15.5%
2008 42.9% 42.9% 14.1%
Table 5: Composition of main taxes as a percentage of total revenues collected (1998 to 2008)
Source: Various IMF staff reports
Indicator Burundi’s measure World’s measure SSA’s measureLow income economies’
measure
CITPROD - 0.13 0.09 0.08
PITPROD - 0.14 0.08 0.07
VATGCR - 65.48 42.3 38.45
Table 6: CIT and PIT revenue productivity and VAT gross compliance ratio (2008/09)
Source: http://www.fiscalreform.net/index.php?option=com_wrapper&Itemid=132 [Accessed 2 February 2010].

Domestic Resource Mobilisation for Poverty Reduction in East Africa: Lessons for Tax Policy and Administration
145
IndicatorYear
2008 2009 2010
Burundi’s globalranking
- 117 116
Number of taxpayments a year
32 32 32
Time taken to complywith the major tax
types140 140 140
Table 7: World Bank Doing Business indicators on the tax burden (Burundi only)
Source: http://www.doingbusiness.org/ExploreEconomies/?economyid=32 [Accessed 10 March 2010]
IndicatorRegion
Burundi OECD SSA
Number of taxpayments a year
32 12.8 37.7
Time taken to complywith the major tax
types140 194.1 306.0
Total tax rate as % ofprofit
278.6% 44.5% 67.5%
Table 8: World Bank Doing Business indicators (2010) on the tax burden (Burundi vis-à-vis the OECD and SSA)
Source: http://www.doingbusiness.org/ExploreEconomies/?economyid=32 [Accessed 10 March 2010]
Tax or mandatorycontribution
Statutory tax rate Tax base Total tax rate as a % of profit
Sales tax 17.0% Purchase 250.4
Corporate income tax 35% (1%) Taxable profits (turnover) 17.7
Social securitycontributions
3.9% Gross salaries 4.4
Health insurancecontribution
3.0% Gross salaries 3.4
Capital gains tax 35% Capital gains 1.8
Building tax BIF 36 Per square metre of developed land 0.5
Vehicle tax 3900 BIF per trimester Per truck operated 0.5
Land tax BIF 3Per square metre of undeveloped
land0
Total 278.6
Table 9: Breakdown of taxes as a percentage of profit
Source: http://www.doingbusiness.org/ExploreTopics/PayingTaxes/Details.aspx?economyid=32

Chapter 5
Kenya

Summary of Key Findings
Political economy and fiscal
legacies
The pragmatic post-independence political economy
choices of the Government of Kenya (GoK) worked quite
well for much of the first one and half decades after
independence. However, a series of adverse political and
economic events in the second half of the 1970s, and
first half of the 1980s, served to disrupt both political and
economic trends. To offset the negative consequences,
the Government introduced wide-ranging reforms by
way of “Sessional Paper No. 1 of 1986 on Economic
Management for Renewed Growth” in concert with an
IMF-pushed Structural Adjustment Programme.
However, the macro-economic and fiscal performance
continued to deteriorate throughout the late 1980s and
1990s. The average economic growth rate between
1992 and 2001 was -0.3% (IMF, 2002).
The Economic Recovery Strategy for Wealth and
Employment Creation, which was implemented by the
new regime from 2003 to 2007, was successful in
reversing the economic decline of the past two decades.
In 2007, for the first time since the 1970s, the annual rate
of real GDP growth reached 7%. While the post-2007
election violence and onset of the global financial crisis
resulted in a slump in real GDP growth in 2008, to 1¾%
(IMF, 2010), it is projected to reach about 5% in 2010.
In the short-to-medium term, the authors suggest that
there are four key fiscal governance drivers. First, an
expensive bureaucracy, as reflected in Kenya’s wage
bill to GDP ratio compared to other countries in the
region, needs to be sustained. In 2007/08 the wage bill
to GDP ratio was estimated to be 7.4% (IMF, 2010),
which was the highest amongst EAC countries.
Second, there are ambitious social welfare goals that
are reinforced in the Bill of Rights in Kenya’s new (2010)
Constitution. Third, elite capture of fiscal governance,
as depicted by two initiatives by Members of Parliament
(MPs) in recent years – in terms of introduction of the
Constituency Development Fund, which is under the
control of individual MPs, and the arbitrarily high
self-pay awarded to MPs. Fourth, the ambitious
development goals for the country as aptly captured in
Kenya’s Vision 2030. This underlies the recourse to
using infrastructure bonds, amounting to about KShs
52 billion in 2009 and 2010 (equivalent to about
US$650 million). Nonetheless, given the comparative
resilience of DRM in Kenya over the years, barring any
unforeseen adverse political or socio-economic deve-
lopments, its fiscal governance trajectory is fairly solid.
Tax reforms: Sequencing,
implementation and results
According to the authors, there are two main epochs in
the reform of tax policies and administration in Kenya.
The first one generally corresponds to the Tax Moderni-
sation Programme (TMP) that was launched in 1986 and
was under implementation until the new government
took office in 2003. The main elements of the policy
thrust under the first phase of the TMP included: raising
and maintaining revenue as a ratio of GDP at 24% by
1999/2000; expanding the tax base; rationalising the tax
structure to make it more equitable; reducing and ratio-
nalising tax rates and tariffs; reducing trade taxes and
increasing them on consumption to support investment;
and plugging leakage loopholes (Moyi and Ronge, 2006).
During this epoch, VAT was introduced in 1990, followed
by the establishment of KRA in 1995.
It is noteworthy that during the TMP epoch, in terms of
fiscal decentralisation, the Single Business Permit (SBP)
is arguably the most progressive feature of Kenya’s local
government system. It was introduced in 1999 to replace
a number of local licenses and revenue-raising permits
on local businesses. The other local tax is property rates.
Local governments also receive a significant block grant
(local authority transfer fund) and limited earmarked
Domestic Resource Mobilisation for Poverty Reduction in East Africa: Lessons for Tax Policy and Administration
148
funds for maintenance of rural and urban roads from the
central government. Nonetheless, public services are
predominantly provided through a decentralized system.
The second epoch is the ongoing Revenue Administra-
tion Reform and Modernisation Programme (RARMP),
which was launched in FY2004/05 by the new KRA top
management appointed by the NARC government
(2003-2007). The goal is to transform “KRA into a
modern, fully integrated and client-focused organiza-
tion”. The strategic thrust is to harness Information and
Communication Technology (ICT) applications for
modernising the tax administration. In this regard, it is
worth noting that the eFiling system and Simba 2005
online system in customs are working. Key changes to
tax policy have revolved around: pursuit of equity; further
widening the tax base; promoting increased investment;
and reducing tax compliance burden.
The reforms under the RARMP epoch were not specifi-
cally anticipated in the TMP. In other words, there was no
specific initiative to sequence between the two pro-
grammes. Furthermore, there are aspects of certain tax
policy initiatives that transverse the two programmes,
and elements of which can also be found in the pre-TMP
period. In the latter context, two observations are
pertinent. First, certain policy initiatives are not particular
to any reform epoch. In this regard, it is noted that some
tax policies cannot be located as once-off changes in a
long-term strategic trajectory. Rather, they need to be
monitored, evaluated and changes effected, where
appropriate, on a regular basis. Thus, the issue of
sequencing does not arise with respect to, for example:
(i) widening the tax base; and (ii) aligning tax policies with
the national development strategies and policies.
Domestic revenue performance
According to the IMF (2003), Kenya’s tax system has
performed better than African average in the past three
decades. In 1989/90, its tax revenue collection was
23.3% of GDP. Revenue collection peaked in 1995/96
at 30.4%, as a result of economic liberalisation. It,
however, declined to 20.5% in 2002/03, before increa-
sing to 22.0% in 2007/08. This uptick was attributed to
a stronger tax administration system and a relatively large
formal sector. The reforms of the 1970s and early 1980s,
as well as the introduction of VAT in 1990, which wide-
ned the tax base, enabled GoK to cut revenue losses
resulting from the reduction in -- and removal of-- import
and export tariffs, which were imposed by WTO conven-
tions, as well as by structural economic adjustment
measures. Empirical analysis by Muriithi and Moyi (2003)
suggests that tax reforms in Kenya under the TMP have
led to improved productivity of direct taxes. In particular,
through administrative reforms (e.g., lower tax rates, PIN)
aimed at eliminating "avenues for evasion and corrup-
tion”. However, Kenya’s performance effectiveness
indicators suggest that whilst the tax collection effort is
high, there is potential to increase tax revenue as a
percentage of GDP by reducing the tax gap.
Challenges and issues
Going forward, Kenya’s tax system faces major
challenges in the following aspects:
• KRA has to cope with less than ideal policy, legal
and other institutional environments: One illustration
of this challenge is underscored by significant gaps
that exist between revenue targets set by Ministry of
Finance and the KRA. The other is that KRA does
not have a free hand to properly remunerate and
motivate its staff;
• Achieving an acceptable degree of tax compliance
from a fast-growing and profitable, but, increasingly
complex informal sector: It is a fast-growing
segment of Kenya’s economy, but tax evasion by
the sector remains particularly high. The structural
challenges of accessing the sector are exacerba-
ted by populist politics, which seeks to shield some
Domestic Resource Mobilisation for Poverty Reduction in East Africa: Lessons for Tax Policy and Administration
149

constituencies of potential taxpayers from their tax
obligations;
• Rationalising tax exemptions: There is an array of
tax exemptions given by GoK. Yet, many studies
on tax exemptions and incentives confirm the
conclusion of a 2008 IMF assessment of the
investment incentive regimes offered in Kenya and
Tanzania, that they are not important in attracting
foreign investment. Rather, such incentives create
distortions and result in the loss of tax revenues;
• Achieving enhanced equity and efficiency:
Indicators of Kenya’s tax revenue performance
show there is considerable scope to improve in the
areas of equity and efficiency;
• Porous borders with a failed state – Somalia: The
combined effect of smuggling and insecurity in the
region, arising from the dysfunctional Somali state,
will remain obstacles to tax administration for quite
some time;
• Cultivating tax morale: It is a daunting challenge and
must begin with political leaders tackling the issue
head on;
• Effectively and sustainably combating corruption:
According to a researcher, corruption is a major
factor that hindered KRA from meeting its collection
targets in, for example, FY 2008/09. Yet, the problem
is not exactly internal to KRA because businessmen
seeking to evade tax are the primary culprits; and
• Regional common markets pose challenges: Kenya
is a member of two regional blocks, the EAC and
COMESA, which have not harmonised their tax
regimes. An added problem is the comparability and
ability of revenue authorities in member countries,
and their capacity to enforce compliance. There is
also the issue of exemptions granted under the EAC
Customs Management Act to promote infant indus-
tries, which are not effectively monitored.
Lessons learned
The following lessons can be drawn from the Kenya
case study:
• Stability of leadership and management enhances
capacity development: The decade of the TM imple-
mentation was characterised by highly unstable
management at both the Treasury and KRA. This
instability is partly attributed to the failure in sustai-
ning high domestic revenue performance, especially
compared to results in the period from 2004 to 2009;
• Tax exemptions and incentives may undermine
equity and fairness: In the past, GoK extended tax
exemptions and incentives, especially on import
duties to various taxpayers. Since there were no
open criteria for these exemptions and incentives,
they mostly favoured the well connected. This
practice undermined equity and fairness of the tax
system and revenue potential;
• Enforcement with facilitation of paying taxes
through modernised systems can be a win-win
solution: Introduction of Electronic Tax Registers
(ETRs) in Kenya was initially controversial and faced
strong resistance from the business people. But the
KRA implementation strategy succeeded in under-
cutting their resistance, and ultimately, many traders
acknowledged that ETRs are also useful in sales
control in their businesses. Therefore, both KRA
and the business community have emerged as
winners;
• Implementation of major ICT systems can, howe-
ver, seriously disrupt revenue collection: In 2005/06,
there was a decline in the tax-to-GDP ratio in
Kenya, which has been attributed to teething tech-
Domestic Resource Mobilisation for Poverty Reduction in East Africa: Lessons for Tax Policy and Administration
150
nical problems when implementing the Simba 2005
system, as well as resistance from some importers
and customs clearing agents; and
• Revenue authorities may be best placed to prose-
cute cases of tax evasion: In 2009, KRA was
allowed by the Attorney General, who is the Director
of Public Prosecutions, to install six of its officers,
who are legal professionals, as prosecutors in tax
evasion cases. According to the authority, this
Domestic Resource Mobilisation for Poverty Reduction in East Africa: Lessons for Tax Policy and Administration
151
arrangement has enabled more timely, effective and
successful prosecutions.
The rest of the chapter is organised as follows: the first
section discusses the political economy and fiscal
legacies, the second section covers trends in the tax
system, the third section explores domestic revenue
performance, the fourth section highlights the chal-
lenges to increasing DRM, and the fifth section
concludes with lessons learned.
Context – political economy and fiscal legacies
Economic legacies of the four
decades following
independence
After independence in 1963, Kenya chose a ‘mixed
economy’ development strategy in which the Govern-
ment would partner with the private sector, including
not-for-profit organisations in both development and
future service delivery. The national political economy
vision and ideology was expounded in ‘Sessional Paper
No: 10 of 1965 on African Socialism and its Application
to Planning in Kenya’. That Paper emphasised the
“diffusion of ownership to avoid concentration of eco-
nomic power…; [and] progressive taxes to ensure equi-
table distribution” (Grillo, 1993).
The pragmatic post-independence political economy
choices of the Government encouraged investment by
multinational corporations while, at the same time,
actively establishing public enterprises (parastatals) in
virtually every productive sector of the economy.
Furthermore, in order to deliver the “fruits of indepen-
dence” to the indigenous population, GoK proactively
implemented policies on: one prong, agrarian reform
which facilitated rapid expansion of peasants’ entry into
cash crops (mainly coffee, tea, pyrethrum, sugar and
cotton) farming; and redistributing large tracks of farm-
lands that were owned exclusively by colonial settlers
(‘white highlands’) to both landless peasants and the
emerging “African” elite (most of them public servants).
On the other prong, Government pushed for the trans-
fer to black race (African) Kenyans of retail businesses
because “‘Africanisation’ was one of the most emotive
political slogans in the tumult before [Kenya’s] inde-
pendence” (Ochieng, 1992). Moreover, by the end of
the decade, GoK was so impatient to create a
sizeable “African” elite that, on the basis of recommen-
dations by a 1971 Commission (headed by a former
Head of Public Service and then Central Bank
Governor, Duncan Ndegwa), it lifted restrictions on
publicservants’ involvement in private business
(Mohiddin, 1981).
Those policies worked quite impressively for much of
the first two decades after independence. In a period of
considerable socio-political and economic turmoil in
most African countries, Kenya enjoyed peace and rapid
economic development. As a result, its GDP grew “at
an annual average rate of 7%, and substantial impro-
vements in living standards were achieved” (IMF, 1995).
While some fiscal imbalances, arising out of excessive
expansion of public expenditures, were evident by
mid-1970s, a coffee exports boom in 1976-78 sustai-
ned aggregate economic performance.
Nonetheless, a series of adverse political and econo-
mic events, in the second half of the 1970s and first half
of the 1980s, disrupted Kenya’s development. First, the
break-up of the EAC as a regional economic block in
1977 dealt a big blow to its economy. At that point,
Uganda and Tanzania were absorbing about 30% of its
total exports, and the collapse of the economic block
cut those exports to just 10%. Second, the death of
the country’s first president, Jomo Kenyatta in August
1978, shook investor confidence for a season or two.
The adverse economic impact of these two develop-
ments was exacerbated by the 1979 global oil crisis.
By 1980, the real GDP growth registered only 2.4%. Yet
a third ominous development, an attempted military
coup in 1982, further dampened investor confidence.
Though the economy regained some momentum in
1983 to reach a real GDP growth of 3.6%, a severe
drought in 1984 reduced the growth to less than 1%,
further deepening the economic woes.
By mid-1980s, the imperative for major shifts in ma-
croeconomic and fiscal policies were acknowledged by
the GoK even as its major development partners, led
by the IMF, pushed for a Structural Adjustment Pro-
gramme (SAP). Government promulgated wide-ranging
Domestic Resource Mobilisation for Poverty Reduction in East Africa: Lessons for Tax Policy and Administration
152
reforms by way of “Sessional Paper No. 1 of 1986 on
Economic Management for Renewed Growth”. Howe-
ver, economic recovery was never restored to the level
of the 1960s and 1970s performance. Real GDP
growth was an average of 5% between 1986 and
1990, and there was a marked deterioration in social
indicators (IMF, 1995).
The Government’s initiatives in macroeconomic and
fiscal reforms of late 1980s and 1990s were not
successful either. In the 1991-1993 period, the
economy slid further, from a real GDP growth of 2.1%
to 0.2%, and from there it continued to plunge until a
new government was elected in 2002. The average
growth between 1992 and 2001 was -0.3% (IMF,
2002). Kenya’s economic performance not only slipped
behind neighbouring Tanzania and Uganda, it is also
performed worse “than most other developing
countries” (IMF, 2009a).
Measures taken to enhance macroeconomic and fiscal
policies did not bear fruit. These measures included:
abolishing import controls (in 1993); repeal of the
Exchange Control Act (in 1995); and tighter restriction
over public expenditure by instituting budget ceilings
and cash controls (in 1994/95 and 1997/98 respecti-
vely). Several factors combined to undermine the
reform measures: (i) the nation suffered exogenous
supply shocks such as droughts and floods; (ii) discord
and intercommunity violence, following the reintroduc-
tion of multi-party elections in 1992, and again in 1997,
undermined investor confidence; and (iii) Government’s
“failure to implement [governance] reforms…led to the
interruption of several” IMF programs (IMF, 2009c).
Moreover, it is in this period that endemic corruption
reached epic levels. “Most upsetting to donors was the
Goldenberg International scandal” (Klopp, 2001), which
resulted in loss of considerable external support.
Recent economic trends
(post-2002)
Economic recovery was the top priority of the National
Rainbow Coalition (NARC) government, elected in
December 2002. The Economic Recovery Strategy for
Wealth and Employment Creation (ERS), which was
implemented from 2003 to 2007, targeted: (i) maintai-
ning a stable macroeconomic framework; (ii) reforming
the financial sector and strengthening its regulation to
increase savings and investment; (iii) implementing
mechanisms for private sector participation in the pro-
vision of infrastructure services; and (iv) establishing a
competitive environment for attracting increased private
investment in tourism, trade and industry. In 2007, as
a result of these efforts, real GDP growth reached 7%
for the first time since the 1970s.
However, the post-2007 election violence, which was
accompanied by fuel and food shortages, and the
onset of the global financial crisis in 2008, resulted in a
slump in real GDP in 2008, to 1¾% (IMF, 2010). Ho-
wever, the economy appears to be recovering since
then. Real GDP growth, for instance, was 2.6% in
2009, and it was projected to grow at 5% in 2010.
Development financing mix
and challenges
Figure 5.1 shows trends in the overall development
financing mix for Kenya between 1996 and 2008.
Gross private savings (averaging at 13.6% of GDP bet-
ween 2002 and 2008) were fairly low, which was below
the Africa benchmark for the post-Monterrey period of
22.1%. Still, between 2002 and 2008, gross private sa-
vings grew at an annual average rate of 8.9%. Foreign
Domestic Resource Mobilisation for Poverty Reduction in East Africa: Lessons for Tax Policy and Administration
153

Domestic Resource Mobilisation for Poverty Reduction in East Africa: Lessons for Tax Policy and Administration
1 Brautigam’s framework is adopted because compared to others that were examined; it is judged to be more comprehensive and elegant. However,like most others, its historical perspective derives too much from the emergence of the modern European state to be linearly applied to states that arelegacies of colonial rule, such as Kenya.
154
100%
Total bilateral aid to all sectors Migrant remittance inflows
Total revenue excl.grants Gross private savings, current pricesDirect investment in reporting economy(FDI Inward)
Exports of goods & services
80%70%
90%
60%
40%50%
10%0%
20%30%
19961998
19992000
200120
0220
0320
0420
0520
0620
0720
081997
Figure 5.1: Trends in Kenya’s overall development financing mix (1996 to 2008)
Source: Africa Economic Outlook (AEO) 2010 data
direct investment between 1996 and 2008 was also
low, averaging at 0.5% of GDP. According to UNCTAD
(2005):
“Deteriorating infrastructure and a poor track record of
policies in the 1980s and 1990s discouraged inflows of
FDI…FDI inflows have nevertheless had a crucial
impact on the development of the country’s export-
oriented horticulture industry, contributed to the revival
of Kenya Airways and accelerated the development of
the mobile telecommunications network”.
From 1996 to 2008, domestic revenue (21%) and
exports (24.1%), on average, constituted the largest
share of financing as a percentage of GDP. In
2002-2008, domestic revenue and exports grew at an
annual average rate of 17.4% and 15.6% respectively.
Exports, over the decade, have benefited from easier
access to the member states of the EAC and
COMESA (see Annex 5.4). Remittances from the
diaspora have been another major source of financing.
It is estimated that in 2008 alone, the 1.8 million or so
Kenyans, living and working abroad, remitted a total of
about US$1,692 million (constituting about 5% of GDP).
From the early 1990s to 2008/09, Kenya’s public
expenditure ranged between 23% and 36% of GDP.
They were financed primarily from domestic revenues,
and from both local and foreign debt. Over the past 20
years, Kenya’s reliance on international development
assistance, by way of grants, has been minimal. Grants
as a percentage of GDP provided to GoK to fund its
fiscal operations between 1989/90 and 2007/08,
ranged from a low of 0.6% to a high of 2.9%.
Public finance deficits have been funded largely through
considerable borrowing. By 2006, Kenya’s domestic
and external debts were estimated to be 17.9% and
21.9% of GDP respectively. It is also noteworthy that
from 2001, GoK has “pursued a deliberate policy action
to restructure domestic debt, with a view to developing
a vibrant bond market for generating long-term finance”
(Ndung’u, 2009). Although Kenya had to reschedule its
debt servicing in certain years, a joint World Bank-IMF
assessment recently concluded that Government’s
“debt sustainability does not appear to be an imme-
diate concern provided it maintains a prudent approach
to borrowing” (IMF, 2009b). This position is also upheld
by the AfDB.
Political economy dynamics
underpinning DRM
The synopsis of the political economy legacies that
have impacted DRM, as presented in the sections
below, is based on Brautigam’s (2008) analytical
framework1. It consists of the following five facets: (i)
level of economic development and economic struc-
ture; (ii) societal factors: culture, values, trust and ‘tax
morale’; (iii) war and taxes: bureaucratic modernization
as a response to threat; (iv) political institutions and tax
systems; and (v) taxation and the fiscal contract.
A comparatively large modern anddiversified economic structure
Compared to other EAC countries, Kenya has a large
modern and diversified economy. The composition of
GDP in 2009 was: agriculture (21.4%); industry
(16.3%); and services (62.3%)2. The modernisation of
the economy is on track as exemplified by the
significant decline in agriculture’s share of GDP, which
stood at 31% in 1984 (IMF, 1995).
The country has, by regional standards, a well-establi-
shed middle class. “A Kenyan economist estimates
that… about four million are in the middle class,
making between $2,500 and $40,000 a year” (Gettle-
man, 2008). Moreover, Kenya has a vibrant private
sector with many formalised enterprises. However,
“strong economic growth [has] done little to reduce the
country’s widespread poverty because distribution [is]
skewed in favour of the already affluent. Between 1998
and 2002, the poorest 20 % of the population received
only 6 % of the national income, while the richest 20 %
took 49 %” (Sundet and Moen, 2009). This high income
disparity explains the comparatively narrow tax base
and possibly the difficulties in cultivating and sustaining
compliance among the low-income groups, including
the informal sector (Moyi and Ronge, 2006). Thus, the
tax base remains narrow – “830 taxpayers contribute
about 75% of all domestic tax revenue” (USAID, 2009).
It is also worth noting that in a population of close to
40 million, the total number of registered taxpayers at
the end of 2007 was just about 860,000.
Building enabling social culture,values, trust and ‘tax morale’ hasbeen elusive 3
Jomo Kenyatta, Kenya’s founder, sought to cultivate a
social culture of self-reliance and responsibility for
development among its citizens by popularising the
national motto ‘Harambee’ (‘let us pull together)4. On 1
June 1963, when Kenya gained self-rule, “he gave the
term currency and declared” – ‘I give you the call:
Harambee!’ (Orora and Spiegel, 1981). Thereafter, a key
message to Kenyans in his independence speech was:
"You and I must work together to develop our country,
to get education for our children, to have doctors, to
build roads, to improve or provide all day-to-day
essentials"5.
The “Harambee” culture, to a degree, was a success in
significant sections of Kenyan society. By 1976,
Harambee projects “accounted for forty percent of
capital development in rural areas and voluntary cash
contributions” (Orora and Spiegel, 1981).
However, Harambee initiatives fell victim of elite capture
in the 1980s and 1990s, and the movement’s “social
value… was relegated to the side” (Transparency Inter-
Domestic Resource Mobilisation for Poverty Reduction in East Africa: Lessons for Tax Policy and Administration
2 https://www.cia.gov/library/publications/the-world-factbook/geos/ke.html [Accessed 7 April 2010].3 In a society where “tax morale” is high, there are low levels of tax evasion and avoidance. It is only in a social culture where citizens generally appre-ciate their responsibility for sustaining state services and where they have a trust in their state institutions and leaders that a “tax morale” evolves.4 http://boleswa97.tripod.com/chieni.htm [Accessed 7 April 2010].5 http://africanhistory.about.com/od/people/a/qts-Kenyatta01.htm [Accessed 7 April 2010].
156

national, 2003). Also, pervasive corruption in the 1980s
and 1990s deeply undermined tax morale. Moreover,
the “weakening of state institutions, which were
increasingly seen as serving the country’s elite rather
than the people” is thought to have reduced the
legitimacy of the state (Sundet and Moen, 2009). In this
situation, citizens’ trust in the Government was under-
mined and tax morale eroded. There was, however, a
temporary respite to this trend following the election of
NARC in 2002. “Kenyans' sense of patriotism was at
its peak, fuelled by the euphoria of a new regime”
(Ondari, 2009). It is suggested that as a result, “a total
of 33,923 taxpayers and 33,141taxpayers were
recruited in 2003/04 and 2004/05, respectively” (Moyi
and Ronge, 2006). However, the subsequent much-pu-
blicised grand corruption scandals of the new regime
served to reverse the trend.
The goal of regime survival hasensured support for the taxadministration bureaucracyand its modernisation
In Brautigam’s (2008) framework, historically, the threat
of (conventional) war has been the common driver of
bureaucratic modernisation for tax revenue mobilisation.
Two complementary theoretical perspectives are prof-
fered: first, a national political leadership can place a
country on a non-conventional “war footing” to the
same effect. Thus for example, when Kenya’s founding
fathers proclaimed war against poverty, disease and
ignorance on attainment of independence, the impera-
tive to extensively mobilise domestic resources was
clear. Consequently, for nearly two decades, the politi-
cal leadership did not tinker with the bureaucracy that
was inherited from the colonial East African Common
Services Organisation and turned over to the EAC
revenue administration. Second, in a competitive plura-
listic environment, the threat of regime survival will
persuade the political leadership to support bureaucra-
tic modernisation. In this way, we may explain why Moi’s
regime delayed the establishment of KRA until 1995
(three years following multiparty democracy), although
it was proposed as early as 1986, when Government
launched the Tax Modernisation Programme (TMP).
Patronage politics destabilised thetax system in the 1980s and 1990s
The patronage, and ultimately corruption, that became
the hallmarks of Kenya’s political institutions in the
1980s, inevitably infected the tax system in the form of
undue exemptions and tax evasion. In the late 1980s
and early 1990s, for example, the ruling elite conspired
to siphon billions of shillings of public resources through
tax exemptions as well as through a scheme, famously
known as the Goldenberg scandal, by which pre-export
financing and export compensation were paid for fake
exports. Consequently, as fiscal deficits became un-
sustainable, the need for measures to tighten tax admi-
nistration was acknowledged. Also, the establishment
of KRA in 1995 was, to a significant extent, expected to
rid the tax system of the rampant corruption, which then
pervaded the public administration system. However,
competition among political constituencies for control of
the tax system as an instrument for patronage conti-
nued. Consequently, for example, in the first decade
after its launch, KRA experienced frequent changes to
its leadership. The first two Commissioners General did
not complete their three-year terms.
This problem was not confined to KRA only, but rather
to all institutions dealing with significant public
resources. Thus, for example, between 1988 and 2002,
a total of 11 permanent secretaries had been appoin-
ted to the Treasury, with two of them serving less than
two months each. During the same period, the Minis-
try of Finance had six ministers. It is under such
circumstances that one of the conditionalities for the
resumption of financing placed on Kenya by the IMF,
was for KRA to be allowed to operate independently
(Klopp, 2001). Its relative success in rapid and
Domestic Resource Mobilisation for Poverty Reduction in East Africa: Lessons for Tax Policy and Administration
157
successful implementation of reforms of the tax system
since 2003/04 could not have been possible if the
politics of patronage and corruption were still rampant.
In this regard, it is noteworthy that KRA enjoyed relative
leadership stability and autonomy during this period.
The current Commissioner General, Michael G.
Waweru, is in his third term, and it has been observed
that, unlike his predecessors, the incumbent:
“No longer waits for …[a] phone call [through the direct
line to State House] to know what the President
expects of him and the Authority…[rather] the Head of
State facilitates his work by urging Kenyans to
honour their dues” (Ondari, 2009).
Political leaders have failedto sustain a fiscal contract withthe citizens6
It can be credibly argued that in the first decade
following independence, a fiscal contract was evolving
in Kenya. However, corruption, socioeconomic malaise,
and the overall deterioration in public services and
institutions in the intervening three decades, until the
NARC regime of 2003, shredded that initial contract. In
addition to the above, “most Kenyans seem to have
lost trust in government institutions as impartial public
service providers” (Miruka, 2010). Moreover, this trust is
further undermined by public perception that GoK is not
committed to the fight against graft as “corruption
cases are dragging in court with those charged
continuing to hold public offices” (Kanyongo, 2010).
Therefore, the fiscal contract, which appears to have
been built in 2002, seems to have lapsed.
Fiscal governance drivers,
results and trajectory
There are four key fiscal governance drivers. First, an
expensive bureaucracy-- as reflected in Kenya’s wage
bill to GDP ratio-- compared to other countries in the
region needs to be sustained. In 2007/08, the ratio was
estimated to be 7.4% (IMF, 2010), which was the
highest among the EAC countries. While the reformist
NARC Government was expected by many economists
to downsize the public service, it did not, as such a
measure would have negated GoK’s policy objective of
rapid employment creation. In fact, public sector em-
ployment has continued to grow, even in recent years.
More significantly, the sustenance of this bloated bu-
reaucracy may explain why even in the years of econo-
mic decline, the tax to GDP ratio remained at relatively
high levels. There is no evidence of a reversal of this
trend in the near future.
Second, ambitious goals for expanded services
delivery and poverty reduction are best epitomised by
the unplanned launch of an expensive free primary
education programme in 2003. There is a significant
constituency of the nation’s political class that seeks to
achieve a welfare state. Such ambitions are reflected in
the Bill of Rights in Kenya’s proposed new Constitution.
Third, elite capture of fiscal governance is reflected in
two initiatives by Members of Parliament (MPs) in
recent years. A case in point is the introduction of the
Constituency Development Fund (CDF), which is under
the control of individual MPs. It was done ostensibly
as an element of fiscal decentralisation. But in practice,
it became a vehicle for them to award themselves very
high pay, making them amongst the best paid MPs in
the world. Inescapably, other elite constituencies
continue to fight for their ‘share of the cake’.
Fourth, the national elite shares ambitious goals for
the country. They are aptly captured in Kenya’s Vision
2030 – Working together on the Path to Prosperity.
While there are sections of the community who are
sceptical of the vision and goals, there is evidence
that a large and strong constituency is committed to
the same. The ongoing high cost infrastructure initia-
Domestic Resource Mobilisation for Poverty Reduction in East Africa: Lessons for Tax Policy and Administration
6 Fiscal contract has its genesis in agreements between European monarchies and the propertied class and merchants that the latter would contributeto state coffers, especially to fund war in return for specific benefits. In modern times, a fiscal contract would be characterised by government pledgesof specific socioeconomic benefits to justify taxation. This is a more realistic proposition in a democratic dispensation.
158

tives underline that commitment. In 2008, “President
Kibaki told…[a] meeting that [GoK] will spend more
than…US$5 billion to finance infrastructure develop-
ment projects in the country over the next five years”
(Kapchanga, 2008). This explains the decision to float
a series of infrastructure bonds, which resulted in the
floatation of two bonds in 2009. For the first bond
issue of KShs 18.5 billion, GoK received offers worth
KShs 27 billion (Irungu, 2010). In the second bond
issue, GoK “accepted 18.42 billion shillings worth of
bids for the 12-year securities with a coupon of 12 %,
and will use the proceeds to fund road, energy and
water projects” (McGregor, 2009). In February 2010,
the Central Bank of Kenya issued a third infrastruc-
ture bond offer worth KShs14.5 billion with an eight-
year maturity date.
The role and influence of international development
organisations (IDOs), in terms of fiscal governance, is
minimal in Kenya. In the 1990s, they largely disengaged
from supporting GoK except for a brief two-year
interlude, when the World Bank and IMF entered into an
agreement for a technocrat team, popularly known as the
‘dream team’, to take charge of Kenya’s governance. In
that interval, Kenya secured a structural adjustment cre-
dit from the IMF and World Bank. But these credits lapsed
before full maturity. Neither did the much anticipated en-
gagement between the 2003 NARC Government and
IDOs materialise for four reasons: (i) the outbreak of the
Anglo-leasing scandal stifled dialogue; (ii) a significant
constituency in the echelons of government continue to
harbour a distrust of the intentions of Western govern-
ments and ‘their institutions’; (iii) the exemplary perfor-
mance of KRA in revenue collection has strengthened the
voice of this latter constituency; and (iv) Kenya’s access
to international credit, especially from the rapidly growing
Asian countries (India and China), provides an alternative
source of development financing to grants from the West.
Kenya’s fiscal governance trajectory is basically
predicated on three variables. First, can the tempo of
DRM growth experienced in recent years be sustained?
Second, will fiscal discipline prevail in spite of intense
pressures from different directions to stretch the fiscal
space? Third, what are the prospects for GoK to
mobilise more external resources to bridge the gap
between DRM and ambitious public expenditure plans?
There are strong indications that the answers to all
three questions are positive.
The resilience of DRM in Kenya over the years is well
illustrated by comparatively good performance even
when poor governance and weak economic condition
prevailed. With regard to fiscal discipline, since the
macroeconomic crisis of the early 1990s, political
leaders have eschewed fiscal excesses. The proposed
new Constitution will reinforce aggregate fiscal
discipline. Already, the relative robustness of Kenya’s
economy and sophistication of its capital market are
enabling GoK to mobilise substantial debt financing to
augment domestic resources. Furthermore, the
performance outturns in recent times make it evident
that revenue collection is resilient (IMF, 2010). In short,
barring any unforeseen adverse political or socioeco-
nomic developments, Kenya’s fiscal governance
trajectory is fairly solid.
Domestic Resource Mobilisation for Poverty Reduction in East Africa: Lessons for Tax Policy and Administration
159
Trends in the tax system
Changes in tax policies over
the years
Kenya relied on unified tax policies and an administra-
tive system jointly administered by the initial three
members of the EAC. This was a legacy of British
colonial administration that all the three countries
inherited at independence. At that point, the Govern-
ment’s three main sources of tax revenue were: income
tax; customs and excise duties; and Inland Revenue.
Changes in both policies and administration had been
minimal and were collaboratively determined until early
1970s. Following a decision to assign responsibility for
income tax to each EAC member state, Kenya adopted
the community legislation and enacted the Income Tax
Act of 1973. Thereafter, three distinct phases of major
initiatives in tax policy reforms can be discerned for
Kenya, and they are outlined below.
Initial efforts at widening the tax base
Following independence, the first major change to the
tax system came through the introduction of a consump-
tion tax - the sales tax in 1973. The impetus for this
change derived from adverse effects on customs duty
revenue receipts brought about by restrictions on im-
ports associated with an import substitution industriali-
sation policy. Another measure to widen the tax base
was the introduction of capital gains tax (CGT) in 1975 to
cash in on high property prices fuelled by a coffee boom.
But, in 1984, in an effort to jumpstart economic growth
through the construction industry, GoK suspended the
CGT and formed a commission to examine economic
management and extend advice on possible changes.
Tax policies introduced underthe TMP (1986 to 2002)
The policy thrust under the TMP (1986 to 1996) was
to: raise and maintain revenue as ratio of GDP at
24% by 1999/2000; expand tax base; rationalise tax
structure to make it more equitable; reduce and ratio-
nalise tax rates and tariffs; reduce trade taxes and
increase them on consumption to support investment;
and plug leakage loopholes (Moyi and Ronge, 2006).
With respect to income taxes, Government reduced the
top marginal rates for: personal income tax from 65%
in 1986/87 to 45% in 1993 to 35% in 1995/96 – by
1999/00 the top rate was 30%; and corporate income
tax from 45% in 1987/88 to 30% in 1999/00.
Government launched the VAT in 1990 to increase
“revenue through expansion of the tax base, which
hitherto was confined to sale of goods at manufacturing
and importation level under the sales tax system”7.
Following its introduction, GoK undertook several
measures to expand VAT coverage, gradually moving
the tax point:
“From the manufacturer to the retail level, and as a
result, the coverage of VAT on goods supplied at retail
level expanded ‘tremendously’ from 1990 to 1995.
From 1991 onwards, the coverage of the services
sector was expanded to include: business services;
hotel and restaurant services; entertainment; confe-
rences; advertising; telecommunications; construction
and transportation. The imposition of VAT [was] also
simplified and improved with 15 bands being reduced
to three, and the introduction of penalties for avoiders,
those who did not maintain proper books of account
and defaulters” (Cheeseman and Griffiths, 2005). When
first introduced, VAT was levied at a standard rate of
17% which then rose to 18% before eventually
declining to 15%, and then stabilising at 16%, and a
0% rate for the exempted items. However, there were
also low and high rates for electricity and luxury goods
respectively. Moreover, Schedule 8 of the Act provides
for certain public bodies, privileged persons and
institutions to be zero rated for VAT (e.g., the President
of the Republic, the armed forces, diplomats, aid
agencies, charitable organisations).
Domestic Resource Mobilisation for Poverty Reduction in East Africa: Lessons for Tax Policy and Administration
7 http://www.kra.go.ke/vat/aboutvat.html [Accessed 10 April 2010].
160
“Prior to the TMP, excise taxes were specific. However,
[from] 1991/92, excise taxes were made ad valorem.
Since 1991, the scope of excise duties was expanded
from domestic production to include imports, thus chan-
ging its scope from being a tax on domestic production to
a tax on consumption” (Moyi and Ronge, 2006). Luxury
goods also became subject to excise duties.
GoK also reduced tariffs to encourage local industries
to be more efficient and competitive both in domestic
and export markets and, to ensure consistency with
international trade obligations such as compliance with
World Trade Organisation (WTO) commitments. In
particular, import duty was reduced from 170% to 35%;
rate bands reduced from 24 to 5; and simple tariff
average dropped from 40% to 16% (Cheeseman and
Griffiths, 2005). Furthermore, with respect to import
duties, the Government:
• From 1991, legislated for the elimination of a wide
range of import duty exemptions;
• From 1992, removed discretionary duty waivers,
only leaving those relating to programme-based
donor funding; and
• From 1995, abolished NGO exemptions, which
played a key role, especially in election years.
Thereafter, an NGO could only get exemption when
donor funded.
To promote investment, GoK introduced export
processing zones (EPZs) in 19908. Firms operating in
EPZs benefit from a 10-year corporate tax holiday,
exemptions on imports of inputs and capital equipment
and a waiver on stamp duty on legal instruments. In
return, a firm must export 80% of its produce (IMF,
2008).
Meanwhile, with a view to improving future revenue
streams, GoK, in 1995, extended an amnesty which
covered income taxes, PAYE and penalties and
interest. A second amnesty in 1998 covered: penalties
and interest in respect of VAT; and tax, penalties and
interest relating to income tax.
Tax policies introduced during thethird phase: 2003/04 to 2008/09
Key changes to tax policy made by the NARC
Government (2003-2008) and coalition Government
(2008-2009) have so far evolved around: ensuring
equity; further widening the tax base; promoting
increased investment; and reducing tax compliance
burden. To promote equity:
• GoK widened income tax bands by 5% in 2004/05.
Tax bands had remained unchanged since 2002. In
the same year, it also increased personal relief by
10%;
• From 16 June 2006, GoK increased the threshold
turnover for VAT from KShs 3 million p.a. to KShs5
million with a view to reducing the compliance
burden for three quarters of registered taxpayers
who: either file nil returns, or whose turnover is not
substantial. GoK also zero rated certain supplies
(e.g., wheat flour, nappies, agricultural tractors,
treatment and supply of water by local authorities,
computer equipment and parts).
In addition, as a means of widening the tax base, GoK
introduced the following measures:
• An amnesty in 2004/05, covering fines, penalties
and interest on: import duty (prior to 11 June 2004);
excise duty on goods manufactured and sold
(before 11 June 2004); VAT (where tax was due
before 11 June 2004); and income taxes (for 2003
and prior years). Taxpayers were required to
disclose and pay under-paid duties and taxes by 31
December 2004;
Domestic Resource Mobilisation for Poverty Reduction in East Africa: Lessons for Tax Policy and Administration
8 See: http://www.epzakenya.com/
161
• From 2004/05, employees of not for-profit
organisations became liable to pay tax on any
retirement contributions made by their employers
to schemes where contributions exceed the
allowable limits;
• Transfer pricing guidelines with effect from 1 July
2006, which specify a wide range of transactions
and may be subject to adjustment, including: sale,
purchase and leasing of goods; other tangible and
intangible assets; provision of services; and interest
on loans. Taxpayers who engage in cross-border
trade with related parties are required to document
their policies and methodologies, and make them
available to KRA;
• In 2006/07, in a further attempt to reach the
informal sector income earners, GoK introduced an
advanced tax payable for drivers and conductors
of passenger service and commercial vehicles;
• A new turnover tax for small businesses with effect
from 1 January 2008, intended to make it easier for
them to comply with their tax obligations. The
turnover tax is applicable for businesses with an
annual turnover of below KShs 5 million9. The rate
of tax is 3% of gross receipts. In 2008/09, the VAT
Act was amended to exempt taxpayers who are
subject to the turnover tax;
• From 1 January 2008, GoK introduced VAT on rent
charged on non-residential property. When it was
initially introduced in the year 2001, it faced resis-
tance from taxpayers and thus was not passed by
Parliament; and
• From 13 June 2008, dividends earned by financial
institutions became taxable10. With this change, the
withholding tax suffered by financial institutions is
henceforth treated as an advance tax to be offset
against its tax liability.
Some key policy measures aimed at fostering increased
investment included the following:
• Introduction of tax incentives in 2005/06 to encou-
rage firms to be listed on the NSE. Specifically,
corporate tax for newly listed firms was reduced from
25% to 20%, on condition that they offer at least 40%
of their issued share capital to the Kenyan public;
• Adjustment to tax incentives in 2006/07 to encou-
rage private sector participation. Incentives include,
for example: industrial building allowances for
hostels and buildings used for educational
purposes at an enhanced rate of 10%; and an
income tax exemption on interest;
• “In the 2008/9 budget, the government removed
the 15% withholding tax for investment in govern-
ment bonds” (Irungu, 2010).
Meanwhile, following introduction of common external
tariffs (CETs) under the East African Community
Customs Management Act of 2004, GoK no longer has
scope to independently amend customs duties. In
contrast, Government has considerable room to
change excise duty rates. The protocol also brought
about the following changes:
• elimination/phased elimination of customs duty
originating from partner states;
• harmonisation of customs principles and proce-
dures; and
• removal of suspended duty (see Annex 5.4 for
details).
Institutional changes
The 1995 KRA Act (Chapter 469 of the Laws of Kenya)
overhauled the legislative framework that had essen-
Domestic Resource Mobilisation for Poverty Reduction in East Africa: Lessons for Tax Policy and Administration
9 However, from 2008/09 persons who would have been subject to the turnover tax regime were allowed to apply to KRA to be exempted.10 Excludes dividends earned by financial institutions, which hold more than 12.5% of the voting power.
162
tially remained intact since independence, and under
which the revenue departments of Customs and
Excise, Income Tax, and Inland Revenue, operated as
distinct entities. Still, it was necessary to amend the
KRA Act in 1997 in order to clarify to the Commissio-
ners in charge of revenue departments that they were
directly under the authority of the Commissioner Gene-
ral (CG) as the top executive of a unitary organisation.
The CG enjoys considerable executive authority, but the
Commissioners of the respective revenue departments
retain legal authority for the operational decisions.
The 1997 amendment to the KRA Act also served to
spell out the non-executive but oversight role and
functions of the KRA Board of Directors. However, like
other parastatal organisations in Kenya, since 2006,
the Commissioner General and other members of
Board of Directors are joint signatories to a perfor-
mance contract with the Ministry of Finance. More si-
gnificantly, this contract is taken seriously by the KRA
Board members.
Changes in administrative
systems
The rationale for forming KRA is articulated under TMP,
which revolves around: improving tax administration
and “implementing organisational reforms that would
modernise tax administration” (Cheeseman and Grif-
fiths, 2005). It was done with the expectation that the
new authority would institute efficient and effective sys-
tems “to seal the widespread loopholes in the tax sys-
tem, bring down the vice of tax evasion, and enlist as
many eligible taxpayers into the tax net as possible”
(Muriithi and Moyi, 2003). To this end, “in the years
since its inception, the KRA, through a series of cor-
porate strategic plans, has laid out and followed a fo-
cused course for reform and modernization”11. It is
significant that KRA uses the state-of- the-art balan-
ced scorecard (BSC) “as a performance measurement
strategy [measuring] financial (to surpass revenue tar-
gets), internal processes (increasing efficiency), stake-
holder (high quality service) and people (develop a
highly motivated and professional work force)” targets
(Cheeseman and Griffiths, 2005). In addition, KRA pre-
pares and disseminates quarterly progress and annual
reports.
However, the focus of KRA administrative reforms in the
first 10 years of its existence was centred on achieving
rationalisation and stabilisation of its organizational
structure and general administrative systems, and
coping with changes in tax policies. During that period
KRA moved all its headquarters and Nairobi operations
(other than border-related ones) to its new 30-storey
headquarters, which was “donated” by the Central
Bank. In addition, it also fully computerised its basic
management support services (payroll, financial mana-
gement, etc), and made initial attempts at computeri-
sing the tax administration.
Today, KRA employs about 4,300 staff. Of them, 56%
of KRA staff are directly involved in revenue administra-
tion (KRA, 2009). The percentage is low compared to
other countries. For instance, the number of staff
directly involved in revenue administration in OECD
countries range from 85% to 90% (OECD, 2009). KRA
has invested heavily in building capacity of its staff. It
operates the Kenya Revenue Authority Training Institute
(KRATI) in Mombasa, which in partnership with institu-
tions such as the Centre for Customs and Excise
Studies at the University of Canberra, delivers speciali-
sed training to its staff. KRATI is also the World
Customs Organisation’s (WCO’s) Regional Training and
Capacity Building Coordinator for 21 countries in East
and Southern Africa12– it “serves as a focal point for
developing and implementing programmes to enhance
the capability of customs”13. KRA also sponsors its staff
to attend international training courses.
Domestic Resource Mobilisation for Poverty Reduction in East Africa: Lessons for Tax Policy and Administration
11 www.bizclir.com/galleries/.../01.128.08BP12_Kenya.pdf [Accessed 11 April 2010].12 www.customscentre.canberra.edu.au/.../libs/.../MOU_signing_in_Canberra.pdf [Accessed 11 April 2010].13 www.revenue.go.ke/.../CG%20SPEECH%20-%20KIM%20DINNER.pdf [Accessed 11 April 2010].
163

Under the Revenue Administration Reform and Moder-
nisation Programme (RARMP), launched in FY 2004/05,
whose goal is to transform “KRA into a modern, fully in-
tegrated and client-focused organization”, the authority
has in effect launched an ICT-driven strategy for the mo-
dernisation of the tax administration14. The salient fea-
tures of the strategy are presented in Annex 5.5.
However, three of them deserve to be highlighted:
• First, the Integrated Tax Management System
(ITMS) for domestic revenue. As part of the ITMS,
“E-registration is fully operational and cumulatively,
60,310 new taxpayers had registered online by the
end of May 2009” (KRA, 2009);
• Second, the electronic tax registers (ETRs) for
VAT-registered taxpayers, which KRA introduced
from 1 January 2005; and
• Third, the Simba 2005 system (S2005S) for
customs operations. The S2005S “has enabled the
automation of about 90% of customs operations”15.
S2005S is able to obtain third party
information from the Kenya Ports Authority systems
and it is interfaced with the electronic cargo tracking
system, and the Revenue Authority Digital Data
Exchange (RADDEX), which is collaboratively
operated by the EAC countries.
It is noteworthy that there was serious resistance from
freight forwarders and customs clearing agents to the
implementation of the both ETRs and the S2005s. In
the case of the ETRs, businesses mobilised conside-
rable support against the new system, even from MPs.
In the case of the S2005S, “the Kenya International
Freight and Warehousing Association initiated a court
action because members felt that [modernisation] im-
posed unfair and costly requirements”16. However, with
the support of the Government, and use of experienced
legal counsels, KRAs position prevailed and the sys-
tems have been implemented. The successful imple-
mentation of the above initiatives, which is well on track,
will enable the KRA to realise its vision. In this regard,
the consolidation of these gains is integral to KRA’s
fourth corporate plan covering the three years from
2009/10 to 2011/12. The plan specifies six goals and
a number of strategic objectives under them. The plan
also details a framework for monitoring and evaluating
implementation progress.
Fiscal decentralisation and
taxation by local governments
Delivery of virtually all basic social public services in
Kenya (including primary education, health and agricul-
tural extension) have never been decentralised since
they reverted to central government in the early 1970s.
To finance the limited services under their jurisdiction,
local authorities rely heavily on own local revenues but
the Ministry of Local Government must approve most
changes to local fees, taxes and other charges.
Between 2003/04 and 2007/08, local government
revenue as a proportion of tax and non-tax revenue
collected by central government was comparatively
low, at an average of 3.2% p.a. (see Table 14 in Annex
5.3). The two main local own revenue sources in Kenya
are property rates and the Single Business Permit (SBP)
(Kelly 2000; Grava 2009; Hugounenq, Rocaboy and
Vaillancourt 2010). The central authority also provides
local governments with a significant block grant (local
authority transfer fund) and limited earmarked funds for
maintenance of rural and urban roads.
Arguably, the most progressive feature of Kenya’s local
government system is the SBP, which was introduced
in 1999 to replace a number of local licenses and
revenues-raising permits on local businesses. Under
Domestic Resource Mobilisation for Poverty Reduction in East Africa: Lessons for Tax Policy and Administration
14 http://www.kra.go.ke/rarmp/rarmp.html [Accessed 11 April 2010].15 International Tax Dialogue Survey – 2009.16 www.bizclir.com/galleries/.../01.128.08BP12_Kenya.pdf [Accessed 11 April 2010]
164
the SBP, local authorities are provided a range of
pre-approved tariff schedules. The SBP serves the dual
purpose of a regulatory instrument as well as a local tax
on business activity (with the permit serving as an
effective tax handle). Although the SBP has proven to
be a sound revenue instrument with substantial
revenue-raising power, there is considerable objection
to using the issuance of a local business permit as a
tax handle for local revenue-raising purposes, resulting
in sustained pressure to eliminate the SBP.
Reform sequencing,
implementation and results
Overview
There is no history of long-term planning for tax re-
forms before the TMP, which was launched in 1986.
However, as discussed above, significant tax policy
and administrative changes can be identified in the
one and half decades preceding the TMP. Neverthe-
less, these changes were essentially reactive, and
cannot qualify as reforms. In this regard, there are two
epochs in the reform of tax policies and administra-
tion in Kenya, which generally correspond to the TMP
and Revenue Administration Reform and Modernisa-
tion Programme (RARMP) periods (see earlier discus-
sion). Yet, reforms under the RARMP were not
specifically anticipated in the TMP. In other words,
there was no specific initiative to sequence between
the two programmes. Furthermore, there are aspects
of tax policy initiatives that transverse the two pro-
grammes, and elements of which can also be found in
the pre-TMP policy changes. Considering the latter
observations, what follows below is: (a) a highlight of
tax policies amenable to regular monitoring, evalua-
tion and possible change; and (b) a discussion of se-
quencing of reforms and results of implementation
through the TMP and the RARMP.
Sequencing does not arise for taxpolicies
Through the three distinct phases of tax policy changes
as discussed above, it is clear that certain policy
initiatives were not particular to any reform epoch.
Rather, they were subject to periodic changes. Such
tax policies cannot therefore be located as one-off
changes in a long-term strategic trajectory. Rather, they
need to be monitored, evaluated and changes effec-
ted, where appropriate, on a regular basis. In this re-
gard, the issue of sequencing does not arise, with
respect to: (i) widening the tax base; and (ii) aligning the
tax policies with the national development strategies
and policies.
Sequencing and implementation ofreforms under the TMP
The initial reforms under TMP (1986 to early 1990s)
focused on tax policy. On one hand, the policy reforms
and strategies were driven by two main factors, the
need to: (i) comply with Kenya’s obligations to rationa-
lise tariffs under the WTO agreement; and (ii) introduce
tax incentives to promote exports and attract foreign
direct investment. These measures were to increase re-
venue losses, while the Government still aimed to raise
tax collections as a percentage of GDP. Therefore, the
policy reforms were accompanied by the introduction of
measures to raise revenue. Specifically, GoK began to
levy excise duty on items formally subject to high duties
and sales tax-- alcoholic beverages, soft drinks, to-
bacco and tobacco products, luxury cars, and petro-
leum products.
In 1992/93 the scope of reforms was extended and
deepened to encompass structural adjustment
measures that not only reduced protection of local
industries, but also lowered their production costs. The
structural adjustment measures also covered policies
Domestic Resource Mobilisation for Poverty Reduction in East Africa: Lessons for Tax Policy and Administration
165

to promote capital mobilisation, including credit for
private sector investments and to improve competiti-
veness in a liberalised economy. The combination of
these measures, policy adjustments under TMP and
the virtual stagnation in economic growth led to a
steady decline in the tax to GDP ratio in the 1990s and
early 2000s (see discussion below).
The establishment of KRA and the rationalisation of
staffing that followed were the hallmark reforms under
the TMP. By 2000, KRA had reduced staff by 30%. It
has been independently observed that the new organi-
sational arrangements have “increased the professio-
nalism of the tax agency’s staff and reduced, though
not eliminated, the level of corruption” (Taliercio, 2004).
KRA also then embarked on building capacity to en-
force compliance, through: taxpayer awareness and
education; and more targeted audits and detailed
examinations. At the same time, it introduced self-as-
sessment in filing income tax return to reduce burden of
tax administration and facilitate early payment.
In second half of the period when the TMP was
implemented (between 1993/94-2000/01), the tax to
GDP ratio was comparatively high (in the range of
20%+), but this must be qualified in three respects (see
Figure 5.2). One, the ratio was on a steady decline.
Two, the economy (GDP) was in decline. Three, by
2001/02, the tax to GDP ratio was at its lowest for the
two decades of 1980s and 2000s. Therefore, while
TMP introduced extensive policy, institutional and
administrative changes, it did not, in terms real growth
in tax revenues, lead to an increase in the tax/GDP
ratio. Instead, this ratio actually fell during the period
that the TMP was being implemented. However, it must
be emphasised that it is not necessarily the failure of
either the TMP or KRA, but rather that of the wider
governance systems. These were the days of rampant
corruption, political tensions and unstable economic
management (see first section).
Nevertheless, empirical analysis by Muriithi and Moyi
(2003) suggests that tax reforms in Kenya under the
TMP have led to improved productivity of direct taxes,
and as a result, comparatively higher ratios for both
Personal Income Tax Productivity (PITPROD) and
Corporate Income Tax Productivity (CITPROD); in
particular, administrative reforms (e.g., lower tax rates,
PIN etc.) aimed at eliminating "avenues for evasion and
corruption”. At the same time, Muriithi and Moyi (2003)
suggest that there was considerable revenue leakage in
the administration of VAT.
Sequencing and implementationof reforms under the RARMP
As earlier indicated, the strategic thrust of the RARMP
is to exploit ICT to modernise, and thereby enhance
efficiency and effectiveness of KRA’s operations.
However, streamlining the organisation structure and
administrative systems were fast tracked. The
measures included:
• Reorganisation and capacity building of KRA’s tax
assessment and collection functions to better align
them with the three main segments. To this end, for
example: (i) KRA merged the various tax depart-
ments into the Domestic Tax Department and the
LTO; and (ii) it embarked on the “continuous
recruitment of management trainees, [and] up-sca-
ling” of facilities at KRATI (KRA, 2009);
• The tax amnesty of 2004, which to a degree, was a
success. KRA reports that it raked in “KShs 4.41
billion from 4,483 applications in the period to 31st
December 2004 when it was in force”17;
• Educating and guiding taxpayers to settle taxes
through banks and not KRA counters. Now, over
90% of taxes are paid through banks, and this
arrangement has contributed to reducing “revenue
leakages arising from handling of cash and
cheques. Tax frauds involving incidents such as the
Domestic Resource Mobilisation for Poverty Reduction in East Africa: Lessons for Tax Policy and Administration
17 http://www.kra.go.ke/news/newsamnestysuccess270105.html [Accessed 11 April 2010].
166

multiple usage of revenue cheques are now a thing
of the past”18;
• Introduction of scanning of imported goods and
goods destined for export. This process has
significantly improved security of cargo and missed
mis-declarations for tax purposes; and
• Getting KRA to be ISO 9001 certified, as a means
for improving services to taxpayers. To maintain this
certification, KRA has instituted regular quality
management system audits and reviews (KRA,
2009).
Implementation of the ICT-driven modernisation stra-
tegy is a long-term pursuit. Nonetheless, there has
been fast-tracking of some “quick wins”. The initiatives
and successes already achieved in the key results areas
of ICT applications have been outlined above. In terms
of specific outcomes, the following are discernible
indicators:
• The e-filing system is working. Returns, filed online,
are processed in 30 minutes rather than 2 weeks19.
This is no mean feat given the large and increasing
volume of transactions it receives: 10,000 self-as-
sessment, 1,000 VAT and 1,500 PAYE returns per
month;
• “Simba 2005 online system which [is] interfaced
with KWATOS…For the first time, KRA, through the
Attorney-General's office, has began prosecuting
tax evasion cases through the Anti-Corruption and
Economic Crimes Act, 2003, which entails hefty
fines and harsh bail terms” (Daily Nation, 2010).
In the implementation of the RARMP, KRA manage-
ment has also demonstrated that it can be proactive
and creative - for example:
“KRA has put in place an elaborate plan to train cyber
cafes in an endeavour to build their capacity to handle
online services. The first training programmes brought
together participants from across the country, repre-
senting over 400 cyber cafes”20;
Moreover, two years following the launch of the RARMP’s
implementation in 2006/07, there was the onset of a sus-
tained reversal of the decade-long decline in the tax to
GDP ratio (see Annex 5.3 – Table 6 or Figure 5.2). It is also
noteworthy that this was taking place when GDP growth
was at its highest since 1970s.
Domestic Resource Mobilisation for Poverty Reduction in East Africa: Lessons for Tax Policy and Administration
18 www.revenue.go.ke/.../CG%20SPEECH%20-%20KIM%20DINNER.pdf [Accessed 11 April 2010].19 Ibid.20 http://www.kra.go.ke/notices/cyber_cafes.html [Accessed 6 April 2010].
167

Domestic revenue performance
Domestic Resource Mobilisation for Poverty Reduction in East Africa: Lessons for Tax Policy and Administration
168
30%
35%
25%
20%
Non-tax revenueTax revenue
15%
10%
5%
0%
1994
/95
1992
/93
1989
/90
1990
/91
1991
/92
1993
/94
1996
/97
1998
/99
1999
/00
2000
/01
2001
/02
2002
/03
2003
/04
2004
/05
2005
/06
2006
/07
2007
/08
1997
/98
1995
/96
Figure 5.2: Tax and non-tax revenue as a percentage of GDP (1989/90 to 2007/08)
Source: Various IMF staff reports. Also see Table 6 in Annex 5.3
Domestic revenue performance
trends
Figure 5.2 presents domestic revenue collections for
the period from 1989/90 to 2007/08. In 1989/90,
Kenya’s domestic revenue collection was 23.3% of
GDP. Revenue collection peaked in 1995/96 at 30.4%
of GDP as a result of economic liberalisation, and
thereafter, declined to 20.5% in 2002/03, before
increasing to 22.0% in 2007/08. However, as earlier
observed (see earlier discussion), for many of these
years, the high tax to GDP ratio did not deliver any real
increase in tax revenues because this was a period of
steady decline and ultimately negative growth of GDP.
This stagnation or real decline in revenues may also be
partly attributable to a reduction in tax rates and tariffs
(see earlier discussion). In addition, Ndulu et al (2007)
indicate that structural weaknesses of the
economy were another contributory factor – in
particular, the narrow scope to expand the coverage of
income taxes due to limited potential to increase the
number of Kenya’s workforce in formal employment.
Nonetheless, on the whole, Kenya’s “tax system
performed better than average for Africa. This is mainly
attributable to a stronger tax administration system and
a relatively large formal sector” (IMF, 2003). It is also
noteworthy that, relative to other EAC countries,
non-tax revenue contributions during the same period
were fairly significant – averaging at 3.7% of GDP.
In recent years, the top revenue sources in order of their
contribution are: taxes on income and profits; VAT;
excise duties; and import duties (see Table 6 in Annex 5.3).
Except in certain years, taxes on income and profits as a
share of total revenue remained fairly constant throughout
the 18-year period to 2007/08, but grew at an average
rate of 16.9% in nominal terms. It is worth noting that as
the economy went into recession, income tax revenues

declined from a high of 9.8% of GDP in 1993/94 to 7% in
1998/99, and then dropping further to around 6% for the
period 2000/01 to 2003/04.
In the first two or three years following its introduction,
VAT was the largest contributor of tax revenue – with a
peak contribution of 39.4% in 1991/92. By 1994/95,
revenues from VAT had declined to 22.5% of total tax
revenues, but thereafter rose to 30% in 2000/01 before
dropping to 25.9% in 2007/08. According to the
literature, VAT’s share of tax revenue initially increased
as a result of the move by GoK to widen its coverage,
but thereafter, reached a plateau (Cheeseman and
Griffiths, 2005). In addition, the decline in collections
can also be explained by VAT waivers given by GoK in
years of drought, famine and other natural disasters,
and revenue lost from incentives and exemptions
offered to firms operating in Kenya’s EPZ.
As a result of GoK’s policy initiatives to reduce tariffs,
there was a significant decline in the proportion of
revenue generated from import duties, which fell from
16.8% in 1989/90 to 7.6% in 2007/08. According to
literature sources, this measure enabled Kenya to
enhance its “trade openness by moving away from the
restrictive import substitution strategy towards export-
oriented industrialization” (Moyi and Ronge, 2006). But
it also spawned another problem: smuggling and illicit
trade at Kenya’s borders contributed to revenue
leakages.
Tax administration performance
benchmarks
Performance efficiency
As one measure of performance efficiency, KRA’s
administrative costs for the period from 1998/99 to
2007/08 averaged at 1.5% (see Table 3 in Annex 5.3),
which is low compared to other EAC countries. Howe-
ver, administrative costs during the period grew at an
average annual rate of 14.9% - but still remained within
the 2% ceiling of operating costs as a percentage of
total revenue collected, as specified by law. It is also
noteworthy that the number of tax staff available for
every 1,000 persons in Kenya is 0.12. This ‘tax staff per
population ratio’ is very low compared to World and
Sub-Saharan African averages, which are 0.82 and
0.37 respectively21. However, this ratio does not take
into account the narrow taxable base. The size of the
labour force in 2008 was 1.94 million people (around
5% of the nation’s population) (Kenya National Bureau
of Statistics, 2009). In other words, there were 452
wage employees per full-time revenue authority staff,
which is much lower than the corresponding ratios for
South Korea and South Africa of 1,396 and 1,901 res-
pectively.
Another disquieting feature is that the World Bank’s
2010 Doing Business survey ranks Kenya 164 h out of
183 countries in terms of ease of paying taxes (see
Annex 5.3: Table 10). On this benchmark, Kenya has
the lowest score of all the five EAC member states. One
contributory factor to this dismal ranking is the number
of payments that a company is required to make in a
given year. For instance, in 2010, cumulative payments
totalled 41 against Sub-Saharan Africa (SSA) and
OECD averages of 37.7 and 12.8 a year respectively.
This number is particularly high in comparison to Mau-
ritius, where a company only makes 7 payments a year
(PwC, 2010). A separate survey cited “difficulties in filing
and paying …as enormous” (USAID, 2009).
Kenya tax administration system is also comparatively
inefficient in administration of refunds, especially of the
VAT. Informants indicate that the elapsed number of
business days for VAT refunds is 60 days. The time
taken to pay refunds is relatively longer when compared
to South Africa (21 days).
Domestic Resource Mobilisation for Poverty Reduction in East Africa: Lessons for Tax Policy and Administration
21 http://www.fiscalreform.net/index.php?option=com_wrapper&Itemid=132 [Accessed 2 February 2010].
169
Kenya also has a low VAT gross compliance ratio
(VATGCR) of 40.5 compared to World average of 65.48
(see Annex 5.3: Table 9). But its VATGCR is higher than
SSA average of 38.4522. Measures from the same
source compute corporate income tax productivity
(CITPROD) and personal income tax productivity (PITP-
TOD) of 0.15 and 0.11, which indicate that Kenya uses
the taxes fairly efficiently in generating revenue when
compared to World averages of 0.13 and 0.14 for
CITPROD and PITPROD respectively. It is noteworthy
that Kenya fares better than other EAC countries on all
three measures. Still, a study by Anassi (2004) suggests
that there are significant levels of tax evasion – in
particular: under declarations are prevalent; and “many
businesses in the informal sector that should be in the
tax bracket…are not because of corruption”.
Allocative efficiency
As earlier pointed out earlier, researchers have
suggested that tax reforms in Kenya under the TMP led
to improved productivity of direct taxes. On the other
hand, tax exemptions and incentives were considerable,
and they would have undermined the allocative
efficiency of the tax regime. So, for example, while EPZs
have generated employment, especially in the area of
garment manufacturing, Omolo (2006) contends that "the
importance of EPZ exports to the national
economy has remained dismal". Furthermore, there are
informants’ claims that: produce intended for export finds
its way back into the local market; and benefits are not
sustained because once EPZ investors exhaust their tax
incentives, they relocate from Kenya to other destinations.
This is consistent with a broader literature conclusion that
tax holidays and other select incentives do not deliver in
terms of sustainable investments (IMF, 2008).
Performance equity
One is inclined to agree with Moyi and Ronge (2006)
that “Kenya has relied heavily on income tax [for] ease
of collection rather than on the…principles of equity”. In
this latter perspective, it is also significant that large
corporations contribute about 75% of domestic tax
revenue 23. Moreover, the literature suggests that “the
tax burden in Kenya remains higher than in most
comparator countries…in Kenya complaints about the
tax rates top all other constraints” (Larossi, 2009). Also,
the ‘total tax rate’ as a percentage of profit of 49.7% is
higher than those of Tanzania (45.2%), Uganda (35.7%)
and South Africa (30.2%).
Kenya’s tax rate is also higher than the OECD ave-
rage of 44.5%, but significantly lower than the SSA
average of 67.5%24. According to the World Bank
(2010), depreciation allowances offered to corpora-
tions in Kenya are lower than those available in
Rwanda and Tanzania – “not surprisingly, with lower
depreciation rates, the share of Kenya’s corporate tax
in the total tax rate (33.1%) is higher than Tanzania’s
(19.9%), for example”.
For corporate taxpayers, Kenya’s tax system has a high
tax burden, which negates equity. In this regard, the
2010 World Bank paying taxes survey indicates that
Kenyan companies spend 417 hours a year on this
task, as opposed to 432 hours in 200825. This result is
significantly higher than the OCED average of 194.1
hours. Furthermore, interviews with key informants
suggest that there are times when tax officers harass
business operators, especially during post-clearance
customs audits.
Domestic Resource Mobilisation for Poverty Reduction in East Africa: Lessons for Tax Policy and Administration
22 http://www.fiscalreform.net/index.php?option=com_wrapper&Itemid=132 [Accessed 2 February 2010].23 http://www.revenue.go.ke/lto/lto.html [Accessed 11 April 2010].24 http://www.doingbusiness.org/ExploreEconomies/?economyid=172#PayingTaxes [Accessed 10 March 2010].25 Ibid.
170

However, generally equity considerations are in-built in
the Kenyan tax system. Some taxes are more progres-
sive than others, but it is difficult to comparatively gauge
equity between the different taxes. Direct taxes are
definitely progressive to a degree. With respect to PIT,
earnings below KShs 10,165 (US$124) a month are tax
free. Furthermore, for low-income earners, GoK intro-
duced welcome incentives such as tax-free canteen
staff meals (in 2007/08). The tax rates by bracket
(beginning at 10%) are progressive up to a relatively
low-income threshold of KShs 38,893 (US$477) per
month (after which income tax is at a flat rate of 30%)
(see Annex 5.3 – Table 2). However, the limited
progressivity of the system has been dented by the
failure to change tax bands and personal relief since
2004/05. It resulted in a comparatively higher tax
burden over the years for the low-income groups,
especially as their purchasing power falls. The latter
effect is compounded by the burden of consumption
taxes, which have not been adjusted downwards.
Kenya’s VAT system also enjoys a degree of progressi-
vity in terms of zero rating and exemptions of basic
social goods and services. Similarly, excise and import
duties are generally levied on goods and services
considered to be luxurious or in demand by high-in-
come groups. On the other hand, excise duty is high
on alcohol and tobacco, not only because it is readily
collectable, but also to compensate for the negative
public health issues arising from their consumption. In
the latter perspective, it has been argued that the
scope and socioeconomic merit of additional
consumption tax revenue from these goods is consi-
derable.
Performance effectiveness
KRA’s performance effectiveness is comparatively high
in terms of both tax effort and tax gap (see Annex 5.3:
Table 13). At 90.5%, in 2005, Kenya’s tax effort was far
above levels prevailing in neighbouring countries, with
the closest performance by Tanzania at 54.4%. It is also
noteworthy that Kenya’s performance in 2005 repre-
sented a significant improvement from 2001 when its
tax effort was 85.5%. Still, it was significantly below that
of South Africa, which recorded an exceptionally high
tax effort of 104% in 2005. In that year, Kenya’s tax gap
stood at 2%, which was well below those of Rwanda,
Tanzania and Uganda, which were 8.5%, 5.9% and
7.8% respectively. But yet again, compared to South
Africa, which had -0.4%, there is still scope to reduce
the tax gap.
At an operational level, to enhance its performance
effectiveness and in particular raise levels of com-
pliance, KRA has adopted a three-pronged approach.
First, the ‘National Business Agenda’ constituted in
2008, is a consultative forum in which GoK interacts
with the private sector on the business environment,
which covers the tax system. Second, KRA commis-
sions regular surveys. In this regard, “KRA reports an
improvement in the service satisfaction rating from 40%
in 2003/04 to 69% in 2004/05 (KRA, 2006). This re-
flects a shift in KRA’s approach towards service orien-
tation. Third, KRA also champions studies to establish
the efficacy of key processes. It is in this context that in
2004 and 2007, KRA charged teams to undertake a
time release study in the area of customs.
Summary of the overall trends
Kenya’ domestic revenue collection is higher than the tax
level in a representative sample of developing countries
of 18% (Tanzi and Zee, 2001). Also its performance
effectiveness indicators suggest that whilst the tax effort
is high, there is potential to increase tax revenue collec-
tion as a percentage of GDP by reducing the tax gap.
The early reforms of the 1970s and early 1980s, as well as
introduction of VAT in 1990, which widened the tax base,
enabled GoK to cut revenue losses, resulting from the re-
duction in --and removal of-- import and export tariffs,
Domestic Resource Mobilisation for Poverty Reduction in East Africa: Lessons for Tax Policy and Administration
171

which were imposed both by WTO conventions as well
as the structural economic adjustment measures.
The extensive tax policy and administrative reforms
under the TMP (1986-2002), including the establish-
ment of the KRA, may not have delivered the desired
outcome in terms of real growth in tax revenues for
most of the years, especially because the macro eco-
nomy was generally on the decline. Nonetheless,
among other benefits, these reforms built a solid policy,
and institutional and administrative platform on which
the RARMP could yield quick and significant gains in
tax revenue generation in subsequent years.
Implementation of the RARMP, which prioritised rapid
and significant tax revenues increase (in real terms),
has produced considerable results, including the
reversal, in a period of real GDP growth (2004-2007), of
the decade-long decline in tax to GDP ratio. The
programme has already accomplished significant
outputs and outcomes in such areas of ICT applica-
tions as eFiling and full computerisation of the customs
operations, placing KRA on a firm modernisation
trajectory. However, as pointed out in the assessment
of performance benchmarks above, and synthesised
hereafter, significant challenges still lie ahead for
Kenya’s taxation system.
Domestic Resource Mobilisation for Poverty Reduction in East Africa: Lessons for Tax Policy and Administration
172
Challenges and issues
Compared to most countries in SSA, especially those
whose economies are not predominantly mineral-ex-
port dependent, Kenya’s tax administration has done
fairly well, for its tax to GDP ratio has never been below
18% for the past three decades. However, going for-
ward, the tax administration faces major challenges on
two fronts. First, the need to raise its tax to GDP ratio
towards the target set way back in 1992 of 28%. There
was no subsequent policy decision to revise this target
downwards. Second, the analysis of performance indi-
cators in the last section shows a number of important
areas-- in terms of efficiency, effectiveness, and equity-
- on which scope for significant improvements exists.
The significant challenges and surrounding issues are
highlighted in this section.
Coping with less than ideal
policy, legal and other
institutional environments
In Kenya, as indeed in most African countries, there is
a disconnect between fiscal policy-making and deve-
lopment of realistic targets and strategies for revenue
collection. So, it is not uncommon to see a significant
gap between revenue targets set by the Ministry of
Finance and KRA. For example, according to the
Commissioner General, in 2006/07 the Ministry of
Finance set a revenue growth target of 19.6%, which
KRA considered to be ambitious given its own target
of 17% (Waweru, 2007). In the same presentation, the
Commissioner General pointed out some other dise-
nabling institutional constraints, which include:
• The ministry still determines the level of VAT refunds,
although the demand for refunds will change with
economic circumstances;
• The ministry may provide incentives, waivers, etc.
without factoring these into the revenue targets,
which undermines the ability of the authority to
meet these targets;
• Varying policy objectives - the need to facilitate
trade for example - may run counter to the need to
meet Customs revenue targets;
• The ministry fails to take into account the role of
other parties whose actions and efficiency impacts
on KRA performance results - e.g., the Kenya
Bureau of Standards; and
• KRA does not have a free hand to properly
remunerate and motivate its staff. At the time of
compiling this paper, there were salary arrears for
some years due to KRA staff, following adjustments
to pay made by the KRA’s Board of Directors, but
for which the necessary additional resources have
not been released by the Treasury.
Achieving an acceptable degree
of tax compliance from
a fast-growing and profitable,
but increasingly complex
informal sector
The informal sector is a fast-growing segment of Ke-
nya’s economy, but tax evasion remains particularly
high. “According to the 2006 Kenya economic survey,
the informal sector constitutes 72% of the working po-
pulation. The sector has grown by 32.7% during the
past four years to 6.5 million workers” (Iarossi, 2009).
The informal segment of the agricultural sector consti-
tutes the bulk of the economy, and employs the largest
number of people. However, it presents unique chal-
lenges to tax administration for several reasons. First, it
is a high risk and uneven source of income for its ope-
rators. As a consequence, for example, past efforts to
Domestic Resource Mobilisation for Poverty Reduction in East Africa: Lessons for Tax Policy and Administration
173

tax it through presumptive income tax failed due to:
many unrecorded open air markets; delays and a failure
to make payments to producers by many government-
controlled marketing boards; unpredictable profit and
cash flows for growers of export crops arising from glo-
bal market variations; and a high reliance on rain-fed
agriculture, which exacerbates the unpredictability of
farmers’ incomes. Second, most of the labour is provi-
ded by the family and therefore it is hard to audit reve-
nue streams and costs. Third, it attracts much politics
which often blurs the real issues, and results in resis-
tance to required policy and legislative changes.
The trade segment of the informal sector has also been
booming. But again, there are particular challenges to
bring this segment into the tax net. In one respect,
informal trading businesses increasingly operate through
small scale outlets, popularly called Buzaars (i.e., many
operators trading in a big store), where the identity of in-
dividual operators is difficult to confirm. In another but re-
lated respect, many such outlets may be operated by an
individual using different PINs. This way, for example, it is
easy for the individual to avoid paying even turnover tax.
Rationalising tax exemptions
There is an array of tax exemptions given by GoK. The
more prominent ones are around the EPZ; once-off
capital investment deductions; the 150% capital de-
duction, exemptions given on withholding tax; and the
zero rating of VAT payable for goods and services pro-
cured by public bodies, privileged persons and institu-
tions. Many studies on tax exemptions and incentives
confirm the conclusions of a 2008 IMF assessment of
the investment incentive regimes offered in Kenya and
Tanzania, that these are not important in attracting
foreign investment. Rather, such incentives create
distortions and result in the loss of tax revenues.
In addition, the socioeconomic rationale for VAT zero
rating is questioned, because in most instances, it does
not result in lowering consumer prices for the targeted
beneficiaries. In the latter perspective, it has been
argued that zero rating of local products may benefit
business people as windfall profits. Nonetheless, it can
be expected that, at least politically and diplomatically,
cases of tax exemptions and incentives will arise.
Therefore, a key challenge is in rationalising them.
Achieving enhanced equity and
efficiency in tax administration
As expounded earlier, Kenya’s indicators of perfor-
mance efficiency, equity and effectiveness can be
significantly improved. Examples of major flaws in
equity and efficiency include: a failure to regularly review
tax brackets; and an excessive number of tax pay-
ments in Kenya vis-a vis the neighbouring countries.
There is also the issue of comparatively inordinate de-
lays in making VAT refunds. All this needs to be ad-
dressed and there is considerable scope to improve
performance equity and efficiency.
Porous borders with a failed
state - Somalia
Kenya has an unstable porous eastern border with
Somalia, where no government has been in control for
over 20 years. The region poses problems with respect
to smuggling of non-taxed imports such as sugar and
other merchandise, as well as small arms. The combi-
ned effect of smuggling and insecurity in the region will
remain as major obstacles to tax administration for
quite some time.
Cultivating tax morale
beginning with political leaders
“Tax morale” must be presumed to be low in Kenya.
Cultivating it is a daunting challenge, because a series
Domestic Resource Mobilisation for Poverty Reduction in East Africa: Lessons for Tax Policy and Administration
174
of events have indicated MPs’ tendency to take popu-
list positions when they are required to support new po-
licies to enforce tax compliance. For example, MPs
have actively resisted the following key tax policy pro-
posals: (i) reintroduction of CGT in 2008; (ii) introduc-
tion of ETRs. Some MPs joined business people in
public
demonstrations against the enforcement of ETRs, but
the resistance was overcome; (iii) taxation of MPs’
allowances; and (iv) taxation and restriction of the use
of plastic papers.
Effectively and sustainably
combating corruption in tax
administration
Onyango (2009) suggests that “corruption still tops
the list of impediments that hindered KRA from mee-
ting its targets during the 2008/2009 financial year”.
Yet, the problem is not exactly internal to KRA. As
one of its officers observes: “You know that we have
never shied away from admitting that we have a pro-
blem… We have sacked people at KRA, we have
changed management but the vice is still with us.
Therefore, what is it that is the problem? It is those
business people and they need to begin changing.
These people will foster corruption as long as they
are not arrested. Therefore, we all need to work to-
gether to eradicate this costly vice” (Wambui, 2009).
Regional common markets
pose challenges
Kenya is a member of two regional blocks, the EAC and
COMESA, but the two trading blocs have not harmonised
their tax regimes. This poses a serious challenge to the de-
termination of origin of goods for tax purposes. With CETs
between EAC member states, it will be particularly difficult
to control leakage of goods which originate from non-EAC
countries entering Kenya through other countries of
EAC.There is also the issue of exemptions. Kenya is eligi-
ble under the EAC Customs Management Act to grant
exemptions of import duty to promote infant industries. The
value of goods that qualified for such exemptions increa-
sed in 2006 by 71.2% to US$1,370.8 million, resulting in
revenue loss of US$289.5 million, which was about
14.20% of total trade taxes. In this regard, no monitoring
mechanism is in place “to ensure that goods benefiting
from exemptions are not exported” or that duty is paid in
full (Mugisa et al, 2009). An added problem is the compa-
rability and ability of the revenue authorities in member
countries, and their capacity to enforce compliance. With
a common market and free movement of goods, there are
increased risks that goods will be channelled through the
country with weaker revenue enforcement tax administra-
tion to countries with more efficient administrations. This is
especially possible when consumption taxes are different.
Kenya, for example, has a lower VAT rate than Burundi,
Rwanda, Uganda and Tanzania and may experience in-
creased volume of transit goods, some of which may be
diverted into the domestic market.
Domestic Resource Mobilisation for Poverty Reduction in East Africa: Lessons for Tax Policy and Administration
175
Lessons of experience
This section highlights the lessons learned in dealing
with the tax issues in Kenya.
Stability of leadership and
management enhances
capacity development
As discussed earlier, the TMP was characterised by
highly unstable management at the Treasury, which was
extended to KRA. Consequently, although
revenues as a ratio of GDP rose to exceed the target of
24% set by Sessional Paper No.1 of 1986, this could
not be sustained, and ultimately in real terms tax reve-
nues were in the decline for most of the 2000s. It has
been observed that stability of leadership has enabled
effective implementation of the RARMP. It also led to
the achievement of the positive results in terms of re-
form outputs and outcomes, and especially with regard
to real growth in tax revenues since 2003/04.
Tax exemptions and incentives
may undermine equity
and fairness
In the past, GoK extended tax exemptions and
incentives, especially on import duties, to various
taxpayers. Since there were no open criteria for these
exemptions and incentives, they translated into
favours for the well connected. This practice
undermined equity and fairness of the tax system and
revenue potential. At the same time, evidence from
independent studies generally shows that these exemp-
tions and incentives have minimal economic benefits.
The EAC Customs Management Act of 2004 has
restricted the range and quantum of tax exemptions
and incentives by member states. However, GoK has
circumvented this restriction by paying duties on behalf
of select institutions, such as faith groups and other
charities that provide public services. Furthermore,
exemptions from domestic taxes remain, but are
subject to an internal criterion, which guides proces-
sing and approval of such requests. Still, there is no
guarantee of equity and fairness in the distribution of
these exemptions.
Enforcement with facilitation
of taxpayers to modernise
systems can be a win-win
solution
The introduction of ETRs in Kenya was initially controver-
sial and strongly resisted by business people.
Traders had argued that: (a) ETRs are an extra burden on
the taxpayer – especially for those with other
systems to account for sales and VAT; (b) others argue
that implementation costs are high and not recoverable
for tax purposes; and (c) some ETRs malfunction and sup-
pliers are not responsive. KRA responded with determi-
nation, but also with an aggressive information, education
and communication campaign to promote ETR use, and
a facilitation scheme under which taxpayers acquired
ETRs, and then obtained refunds through the VAT sys-
tem. Today, many traders acknowledge that ETRs are
useful in their businesses. Therefore, both KRA and the
business community have emerged as winners.
Implementation of major ICT
systems can seriously disrupt
revenue collection
In 2005/06, there was a decline in the tax to GDP ratio
in Kenya, which has been attributed to teething
vDomestic Resource Mobilisation for Poverty Reduction in East Africa: Lessons for Tax Policy and Administration
176

problems with S2005S. In addition, “when the S2005S
system was introduced… and did not immediately ease
the backlog and hasten clearance procedures at the
port, it encountered opposition from some stakehol-
ders”26. Therefore, possible resistance should be anti-
cipated in the implementation of major changes in tax
administration systems, and consequent disruptions in
revenue collection.
Revenue authorities may be best
placed to prosecute cases of tax
evasion
Over the past year, KRA has been allowed by the
Attorney General, who is the defacto Director of Public
Prosecutions, to appoint six of his officers, who are
legal professionals as prosecutors in tax evasion cases.
According to the authority, this arrangement has
enabled more timely, effective and successful prosecu-
tions. Furthermore, KRA’s prosecutors are in a position
to apply the legislative framework, knowledge and other
capacities for combating corruption and other crimes,
to “register substantial wins in court cases”27.
Domestic Resource Mobilisation for Poverty Reduction in East Africa: Lessons for Tax Policy and Administration
26 www.bizclir.com/galleries/.../01.128.08BP12_Kenya.pdf [Accessed 11 April 2010].27 http://www.kra.go.ke/notices/court_cases.html [Accessed 11 April 2010].
177


Domestic Resource Mobilisation for Poverty Reduction in East Africa: Lessons for Tax Policy and Administration
180
Betty Maina (Ms), Chief Executive Officer, Kenya Association of Manufacturers (KAM)
J. S. Ogai (Mr), Senior Deputy Commissioner, Research and Corporate Planning, Kenya Revenue Authority
Justus Nyamunga (Mr), Director, Department of Economic Affairs, Treasury
Karen Nginda (Ms), Deputy Commissioner, Research and Corporate Planning ,Kenya Revenue Authority
Kubai Khasiani (Mr), Director, Public Financial Management Reform Secretariat
Phyllis N. Makau (Ms), Principal Budget Officer, Parliament (Kenya National Assembly) Budget Office
Stephen Wainaina (Mr), Economic Planning Secretary, Ministry of State For Planning, National Development And
Vision 2030
Wa Nyambura Mwambia (Mr), Deputy Director, Economics Affairs, Treasury
Annex 5.1: Key informants

Domestic Resource Mobilisation for Poverty Reduction in East Africa: Lessons for Tax Policy and Administration
181
Anassi, P. (2004); Corruption in Africa: The Kenyan Experience Trafford Publishing: Victoria.
Brautigam, D.A. (2008); Introduction: Taxation and State Building in Developing Countries. In D.A. Brautigam, O-H.
Fjeldstad and M. Moore Taxation and State Building in Developing Countries Cambridge University Press:
Cambridge, pp. 1-33.
Cheeseman, N. and Griffiths, R. (2005); Increasing Tax Revenue in sub-Saharan Africa: The Case of Kenya. The
Oxford Council on Good Governance, 2005. Report no. 6.
Daily Nation (2009); Investment in Tanzania Now at Sh160 Billion. Daily Nation 02/09/09, [online].
Daily Nation (2010); KRA Probe Confirms 22 Containers Sneaked From Port. Daily Nation 13/03/10, [online].
Gettleman, J. (2008); Kenya’s Middle Class Feeling Sting of Violence. The New York Times 11/02/08, [online].
Gikunju, W. (2010); Political Spat Sparks Jitters over Kenya’s Growth Outlook. Business Daily 18/02/2010, [online].
GoK (1986); Sessional Paper No. 1 of 1986 on Economic Management for Renewed Growth. GoK, 1986.
GoK (1993); Economic Survey 1993. GoK, 1993.
GoK (1996); Economic Survey 1993. GoK, 1996.
GoK (1998); The Constitution of Kenya. GoK, 1998.
GoK (2001); Poverty Reduction Strategy Paper 2001–2004. GoK, 2004.
GoK (2003); Economic Strategy for Wealth and Employment Creation 2003-2007. GoK, 2003.
GoK (2007); Economic Survey 1993. GoK, 2007.
GoK (2007); Vision 2030: A Globally Competitive and Prosperous Kenya. GoK, 2007
GoK (2009); Budget Outlook Paper 2009/10- 2011/12. GoK,2009.
GoK (2009); Budget Strategy Paper 2009/10- 2011/12. GoK,2009.
GoK (2009); Medium Term Debt Management Strategy 2009/10- 2011/12. GoK,2009.
GoK (2009); Medium Term Expenditure Framework –Agriculture and Rural Development Sector 2009/10 – 2011/12.
GoK, 2009.
Grava, L. (2009); Raising Taxes Through Regulation? The case of the Single Business - Permit in Kenya. Presented at
the World Bank FIAS Workshop on Business Regulation and Local Revenue Mobilisation Washington, USA, 25
February 2009.
Grillo, R. (1993); The construct of ‘Africa’ in African Socialism. In CM Hann (ed) Socialism: Ideas, Ideologies and Local
Practice Routledge: Oxon.
Hugounenq, R., Rocaboy, Y. and Vaillancourt, F. (2010); Les Finances Publiques Locales des Collectivités
Territoriales au Kenya. Report, 23 March 2010.
Iarossi, G. (2009); An Assessment of the Investment Climate in Kenya. World Bank, 2009.
IEA (2002); The Citizen’s Handbook to the Budget: A Guide to the Budget Process in Kenya. IEA, 2002.
IMF (1995); Kenya – Recent Economic Developments. IMF, 1995. Report no. 95/133.
IMF (2002); Kenya: Selected Issues and Statistical Appendix. IMF, 2002. Report no. 02/84.
IMF (2003); Kenya: Selected Issues and Statistical Appendix. IMF, 2003. Report no. 03/200.
IMF (2008); Kenya, Uganda, and the United Republic of Tanzania: Selected Issues. IMF, 2008. Report no. 08/353.
IMF (2009a); Kenya: Selected Issues and Statistical Appendix. IMF, 2009. Report no. 09/192.
Annex 5.2: Bibliography
Domestic Resource Mobilisation for Poverty Reduction in East Africa: Lessons for Tax Policy and Administration
182
IMF (2009b); Kenya: 2006 Article IV Consultation and Second Review Under the Three-Year Arrangement Under the
Poverty Reduction and Growth Facility, and Requests for Extension and Rephasing of the Arrangement, Reduction
in Access, and Waiver of Performance Criteria—Staff Report; Staff Supplement and Statement. IMF, 2009. Report
no. 09/137.
IMF (2009c); Kenya: 2004 Article IV Consultation, First Review Under the Poverty Reduction and Growth Facility, and
Requests for Augmentation of Access, Rephasing of the Arrangement, and Waiver of Performance Criteria—Staff
Report. IMF, 2009. Report no. 09/225.
IMF (2009d); Impact of the Global Financial Crisis on Sub-Saharan Africa. IMF, 2009.
IMF (2009e); Some Observations on Domestic Revenue Mobilization. Presentation made during IMF Staff Visit to
Rwanda, Oct-November 2009.
IMF (2010); Kenya: Staff Report for the 2009 Article IV Consultation. IMF, 2010. Report no. 10/26.
Irungu, G. (2010); State Set to Launch Eight-Year Infrastructure Bond. Business Daily 10/02/2010, online.
Kang’aru (2009); Silent Taxes in Kenya's Budget Daily Nation 15/06/2009, online.
Kanyongo, W. (2010); Govt to expedite hearing of corruption cases. Kenya News Agency 11/03/2010, online.
Kapchanga, M. (2008); Kenya to Issue Infrastructure Bonds. The East African 02/11/2008, [online].
Karingi, S. (2000); Macro models of the Kenyan economy. KIPPRA, 2000. Discussion paper no. 2
Karingi,S.N., Wanjala, B., Kamau, A., Mwangi, E. (2004); Fiscal Architecture and Revenue Capacity in Kenya.
KIPPRA, 2004. Discussion paper No. 45.
Kefela, G.T. (2009); Reforming Tax Policies and Revenue Mobilization Promotes a Fiscal Responsibility: A Study of East
and West African States Journal of Law and Conflict Resolution 1(5): 98-106.
Kelly, R. (2000); Property Taxation in East Africa: The Tale of Three Reforms. Lincoln Institute of Land Policy, 2000.
Working Paper.
Kenya National Bureau of Statistics (2009); Economic Survey 2009. Republic of Kenya, 2009.
Kinyanjui, K (2010); Mobile Money turns Kenya into Global Transfers Hub Business Daily 10/01/10, [online].
Klopp, J.M. (2001); Electoral Despotism in Kenya: Land, Patronage and Resistance in the Multi-Party Context
Unpublished PhD Thesis, Department of Political Science, McGill University.
KRA (2004); Time Release Study Report: Kenya. KRA, 2004.
KRA (2005); Introduction of Electronic Tax Registers Taxpayer Seminar at KICC Nairobi, Kenya, 20 January 2005.
KRA (2006); Transfer Pricing Guidelines. KRA, 2006.
KRA (2009); Fourth Corporate Plan 2009/10 – 20011/12. KRA, 2009.
Lewis, S.R. (1984); Taxation for Development: Principles and Applications. Oxford University Press: New York.
Mankiw, N.G. (1994); Macroeconomics Worth Publishers Inc.
McCormick, D. and Pedersen, P.O. (1999); Globalization and Regionalization of Kenya’s Foreign Trade and
Production. Centre for Development Research, 2009. Working paper no. 99.8.
McGregor, S. (2009); Kenya Infrastructure Bond Draws $589 Million in Bids Bloomberg 3/12/2009, [online].
Meier, G.M. and Rauch, J.E. (1970); Leading Issues in Economic Development Oxford University Press: New York.
Miruka, C.O. (2010); Building Trust in Kenyan Rural Public Health Facilities. The Journal of Pan African Studies 3(6):
190-206.
Mohiddin, A. (1981); African Socialism in Two Countries Barnes & Noble: New Jersey.

Domestic Resource Mobilisation for Poverty Reduction in East Africa: Lessons for Tax Policy and Administration
183
Moyi, E. and Ronge, E (2006); Taxation and Tax Modernization in Kenya: A Diagnosis of Performance and Options
for Further Reform. IEA, 2006.
Mugambi, K. (2010); Horticulture Earns Kenya Sh71.6 Billion. Daily Nation 18/03/2010, [online].
Mugisa, E., Onyango, C., Mugoya, P. (2009); An Evaluation of the Implementation and Impact of the East African
Community Customs Union. EAC, March 2009.
Muriithi, M.K. and Moyi, E.D. (2003); Tax Reforms and Revenue Mobilization in Kenya. African Economic Research
Consortium, 2003. AERC Research Paper 131.
Mwega, F.M. (2009); A Case Study of Aid Effectiveness in Kenya: Volatility and Fragmentation of Foreign Aid, with a
Focus on Health. Wolfensohn Center for Development, 2009. Working paper 8.
Ndulu, B.J., Chakraborti, L., Lijane, L., Ramachandran, V., Wolgin, J. (2007); Challenges of African Growth:
Opportunities, Constraints, and Strategic Directions IBRD/World Bank: Washington, 1st edtn.
Ndung’u, N. (2009); Kenya’s Ksh. 18.5 billion Infrastructure Bond. Address by the Governor of the Central Bank of
Kenya during the Launch of the Ksh. 18.5 billion Infrastructure Bond Issue Nairobi, Kenya, 28 January 2009.
Nyerere, J. (1964); Ujamaa: the Basis of African Socialism. In W.H. Friedland and C.G. Roseberg (eds) African
Socialism Stanford University Press: California.
Ochieng’ W.R. (1992); The Post-Colonial State and Kenya’s Economic Inheritance. In W.R. Ochieng and R.M. Maxon
(eds), An Economic History of Kenya English Press: Nairobi.
OECD (1995); Transfer Pricing Guidelines for Multinational Enterprises and Tax Administrations. OECD, 1995.
OECD (2009); Tax Administration in OECD and Selected Non-OECD Countries: Comparative Information Series (2008).
Forum on Tax Administration, 2009.
Omolo, J.O. (2006); The Textiles and Clothing Industry in Kenya. In H. Jauch and R.Traub-Merz (Eds), The Future of
the Textile and Clothing Industry in Sub-Saharan Africa.
Ondari, J. (2009); For Taxman, Every Kenyan is KRA's Client. Daily Nation 30/12/2009, [online].
Onyango, J. (2009); Corrupt workers frustrate KRA tax collection efforts. Business Daily 23/12/09, [online].
Orora, J.H. and Spiegel, H.B.C. (1981); Harambee: Self-Help Development Projects in Kenya. In D.H. Smith and F.
Elkin (eds) Volunteers Voluntary Associations and Development E.J. Brill: Leiden, pp. 93-103.
PwC (2010); Paying Taxes 2010: An African Perspective. PwC, 2010.
Rosen, H.S. (1995); Public Finance McGraw-Hill/Irwin.
Sharpley, J. (1993); Supply Oriented Sequencing of Adjustment Policies, Study of Mozambique, Sierra Leone, Uganda
and Kenya. EU, 1993.
Shende, S.N. (2002); Improving Financial Resource Mobilization in Developing Countries in Transition. UN, 2002.
Stotsky, J.G. and WoldeMariam, A. (1997); Tax Effort in Sub-Saharan Africa. IMF, 1997. WP/97/107.
Sundet, G. and Moen, E. (2009); Political Economy Analysis of Kenya. NORAD, 2009. Report no. 19/2009.
Taliercio, R. (Jr) (2004); Designing performance: the semi-autonomous revenue authority model in Africa and Latin
America. World Bank, 2004. Working Paper 3423.
Tanzi,V. and Zee, H. (2001); Tax Policy for Developing Countries Economic Issues 27.
The Standard (2009); Kenya Should Speed Up Tax Reforms. The Standard 08/12/2009, online.
Transparency International (2003); Harambee: The Spirit of Giving or Reaping? Adili 02/06/03, p.1-2.
UNCTAD (2005); World Investment Report: Transnational Corporations and the Industrialization of R&D. UN, 2005.
Domestic Resource Mobilisation for Poverty Reduction in East Africa: Lessons for Tax Policy and Administration
184
USAID (2008); Kenya’s Agenda for Action: Commercial Legal and Institutional Reform Diagnostic of Kenya’s Business
Environment. USAID, 2008.
Von Hargen, J. and Harden, I. (1996); Budget Process and Commitment to Fiscal Discipline. IMF, 1996. WP 96/78.
Wambui, S. (2009); Corruption is Rife at KRA, says Taxman. Capital Business 28/1109, online.
Wanjohi, N.G. (1993); Challenges of Democratic Governance: Parliament, Executive, and the Citizen in Kenya
National Council of Churches of Kenya: Nairobi, 1st edtn.
Waweru, M.G. (2007); Tax Policy and Tax Administration: Is there a Disconnect. Presentation at the Conference on Tax
and Investment Climate in Africa, Livingstone, Zambia, 26-27 February 2010.
World Bank (2010); Doing Business in the East African Community 2010. World Bank Group: Washington.
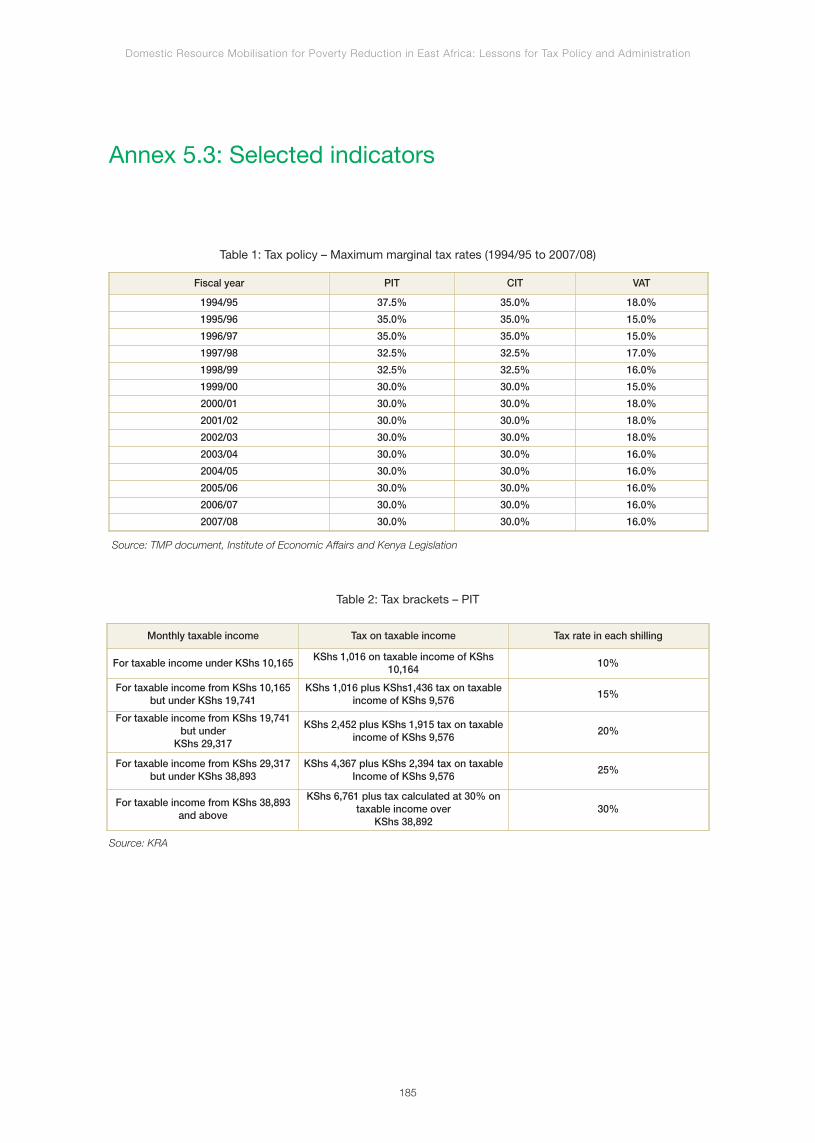
Annex 5.3: Selected indicators
Domestic Resource Mobilisation for Poverty Reduction in East Africa: Lessons for Tax Policy and Administration
185
Fiscal year PIT CIT VAT
1994/95 37.5% 35.0% 18.0%
1995/96 35.0% 35.0% 15.0%
1996/97 35.0% 35.0% 15.0%
1997/98 32.5% 32.5% 17.0%
1998/99 32.5% 32.5% 16.0%
1999/00 30.0% 30.0% 15.0%
2000/01 30.0% 30.0% 18.0%
2001/02 30.0% 30.0% 18.0%
2002/03 30.0% 30.0% 18.0%
2003/04 30.0% 30.0% 16.0%
2004/05 30.0% 30.0% 16.0%
2005/06 30.0% 30.0% 16.0%
2006/07 30.0% 30.0% 16.0%
2007/08 30.0% 30.0% 16.0%
Table 1: Tax policy – Maximum marginal tax rates (1994/95 to 2007/08)
Source: TMP document, Institute of Economic Affairs and Kenya Legislation
Monthly taxable income Tax on taxable income Tax rate in each shilling
For taxable income under KShs 10,165KShs 1,016 on taxable income of KShs
10,16410%
For taxable income from KShs 10,165but under KShs 19,741
KShs 1,016 plus KShs1,436 tax on taxableincome of KShs 9,576
15%
For taxable income from KShs 19,741but under
KShs 29,317
KShs 2,452 plus KShs 1,915 tax on taxableincome of KShs 9,576
20%
For taxable income from KShs 29,317but under KShs 38,893
KShs 4,367 plus KShs 2,394 tax on taxableIncome of KShs 9,576
25%
For taxable income from KShs 38,893and above
KShs 6,761 plus tax calculated at 30% ontaxable income over
KShs 38,89230%
Table 2: Tax brackets – PIT
Source: KRA
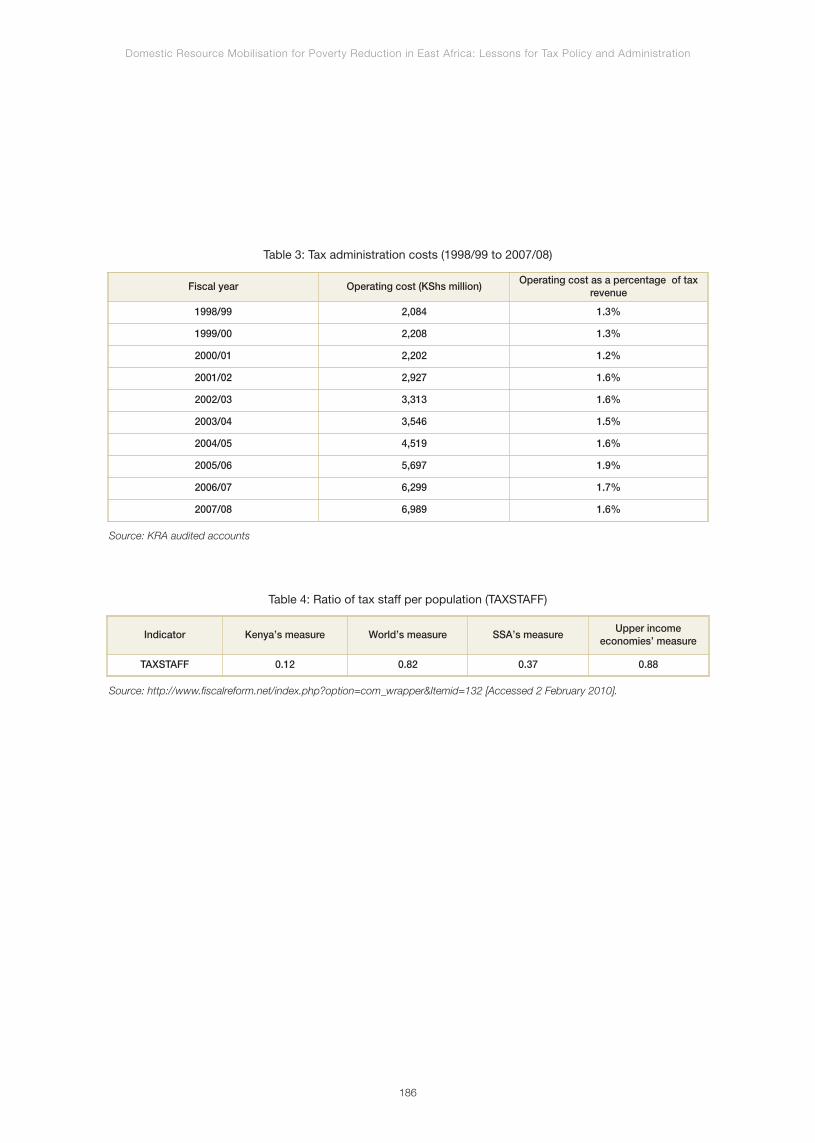
Domestic Resource Mobilisation for Poverty Reduction in East Africa: Lessons for Tax Policy and Administration
186
Fiscal year Operating cost (KShs million)Operating cost as a percentage of tax
revenue
1998/99 2,084 1.3%
1999/00 2,208 1.3%
2000/01 2,202 1.2%
2001/02 2,927 1.6%
2002/03 3,313 1.6%
2003/04 3,546 1.5%
2004/05 4,519 1.6%
2005/06 5,697 1.9%
2006/07 6,299 1.7%
2007/08 6,989 1.6%
Table 3: Tax administration costs (1998/99 to 2007/08)
Source: KRA audited accounts
Indicator Kenya’s measure World’s measure SSA’s measureUpper income
economies’ measure
TAXSTAFF 0.12 0.82 0.37 0.88
Table 4: Ratio of tax staff per population (TAXSTAFF)
Source: http://www.fiscalreform.net/index.php?option=com_wrapper&Itemid=132 [Accessed 2 February 2010].
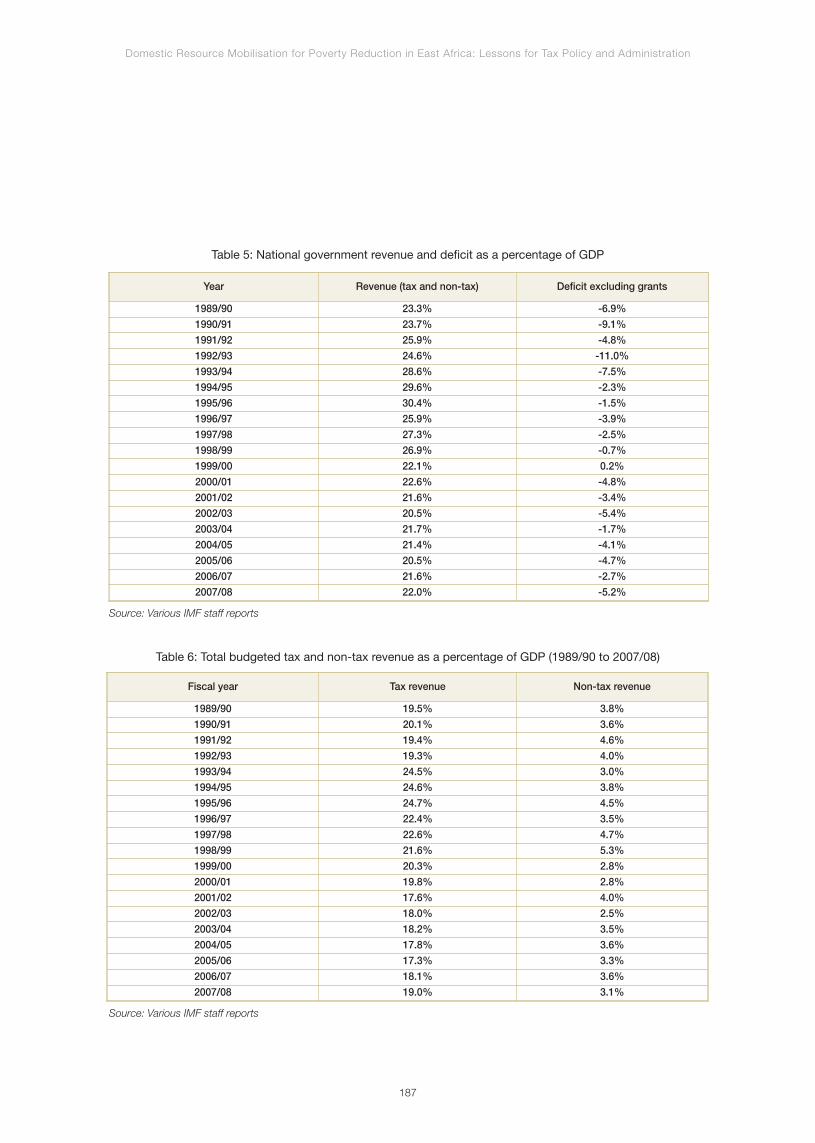
Domestic Resource Mobilisation for Poverty Reduction in East Africa: Lessons for Tax Policy and Administration
187
Year Revenue (tax and non-tax) Deficit excluding grants
1989/90 23.3% -6.9%
1990/91 23.7% -9.1%
1991/92 25.9% -4.8%
1992/93 24.6% -11.0%
1993/94 28.6% -7.5%
1994/95 29.6% -2.3%
1995/96 30.4% -1.5%
1996/97 25.9% -3.9%
1997/98 27.3% -2.5%
1998/99 26.9% -0.7%
1999/00 22.1% 0.2%
2000/01 22.6% -4.8%
2001/02 21.6% -3.4%
2002/03 20.5% -5.4%
2003/04 21.7% -1.7%
2004/05 21.4% -4.1%
2005/06 20.5% -4.7%
2006/07 21.6% -2.7%
2007/08 22.0% -5.2%
Table 5: National government revenue and deficit as a percentage of GDP
Source: Various IMF staff reports
Fiscal year Tax revenue Non-tax revenue
1989/90 19.5% 3.8%
1990/91 20.1% 3.6%
1991/92 19.4% 4.6%
1992/93 19.3% 4.0%
1993/94 24.5% 3.0%
1994/95 24.6% 3.8%
1995/96 24.7% 4.5%
1996/97 22.4% 3.5%
1997/98 22.6% 4.7%
1998/99 21.6% 5.3%
1999/00 20.3% 2.8%
2000/01 19.8% 2.8%
2001/02 17.6% 4.0%
2002/03 18.0% 2.5%
2003/04 18.2% 3.5%
2004/05 17.8% 3.6%
2005/06 17.3% 3.3%
2006/07 18.1% 3.6%
2007/08 19.0% 3.1%
Table 6: Total budgeted tax and non-tax revenue as a percentage of GDP (1989/90 to 2007/08)
Source: Various IMF staff reports
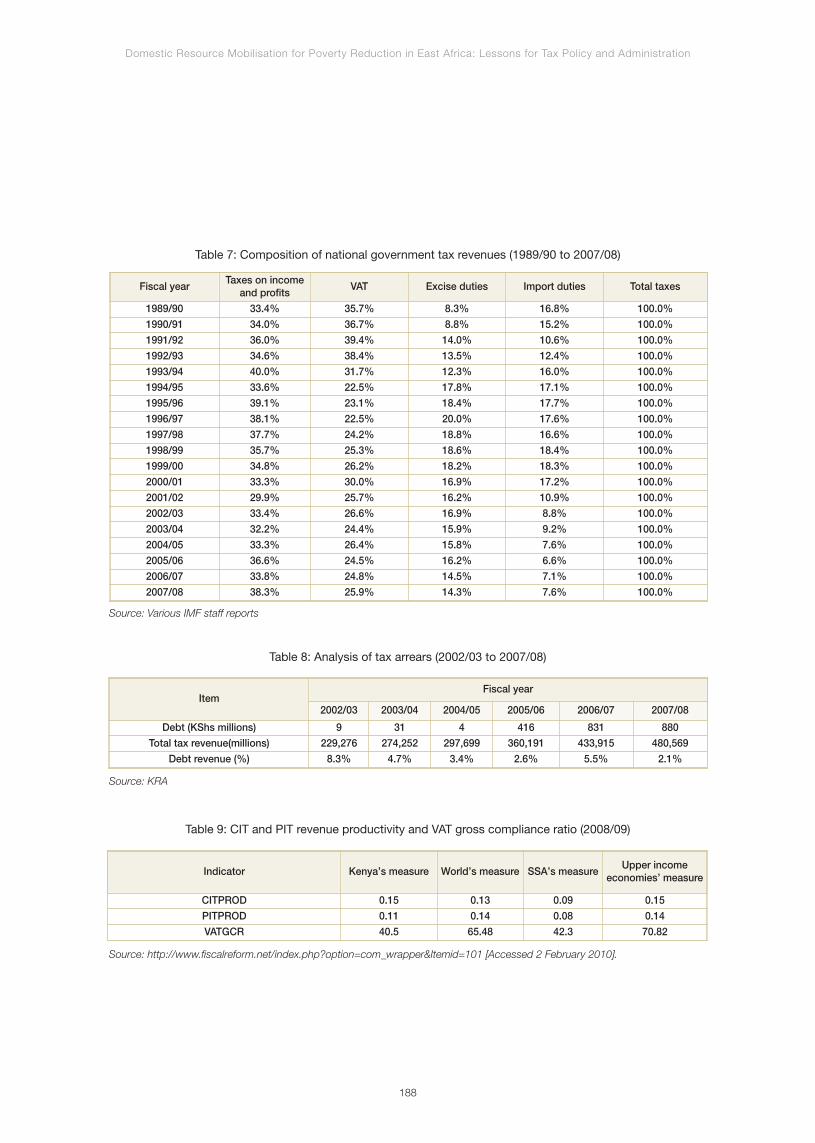
Domestic Resource Mobilisation for Poverty Reduction in East Africa: Lessons for Tax Policy and Administration
188
Fiscal yearTaxes on income
and profitsVAT Excise duties Import duties Total taxes
1989/90 33.4% 35.7% 8.3% 16.8% 100.0%
1990/91 34.0% 36.7% 8.8% 15.2% 100.0%
1991/92 36.0% 39.4% 14.0% 10.6% 100.0%
1992/93 34.6% 38.4% 13.5% 12.4% 100.0%
1993/94 40.0% 31.7% 12.3% 16.0% 100.0%
1994/95 33.6% 22.5% 17.8% 17.1% 100.0%
1995/96 39.1% 23.1% 18.4% 17.7% 100.0%
1996/97 38.1% 22.5% 20.0% 17.6% 100.0%
1997/98 37.7% 24.2% 18.8% 16.6% 100.0%
1998/99 35.7% 25.3% 18.6% 18.4% 100.0%
1999/00 34.8% 26.2% 18.2% 18.3% 100.0%
2000/01 33.3% 30.0% 16.9% 17.2% 100.0%
2001/02 29.9% 25.7% 16.2% 10.9% 100.0%
2002/03 33.4% 26.6% 16.9% 8.8% 100.0%
2003/04 32.2% 24.4% 15.9% 9.2% 100.0%
2004/05 33.3% 26.4% 15.8% 7.6% 100.0%
2005/06 36.6% 24.5% 16.2% 6.6% 100.0%
2006/07 33.8% 24.8% 14.5% 7.1% 100.0%
2007/08 38.3% 25.9% 14.3% 7.6% 100.0%
Table 7: Composition of national government tax revenues (1989/90 to 2007/08)
Source: Various IMF staff reports
ItemFiscal year
2002/03 2003/04 2004/05 2005/06 2006/07 2007/08
Debt (KShs millions) 9 31 4 416 831 880
Total tax revenue(millions) 229,276 274,252 297,699 360,191 433,915 480,569
Debt revenue (%) 8.3% 4.7% 3.4% 2.6% 5.5% 2.1%
Table 8: Analysis of tax arrears (2002/03 to 2007/08)
Source: KRA
Indicator Kenya’s measure World’s measure SSA’s measureUpper income
economies’ measure
CITPROD 0.15 0.13 0.09 0.15
PITPROD 0.11 0.14 0.08 0.14
VATGCR 40.5 65.48 42.3 70.82
Table 9: CIT and PIT revenue productivity and VAT gross compliance ratio (2008/09)
Source: http://www.fiscalreform.net/index.php?option=com_wrapper&Itemid=101 [Accessed 2 February 2010].
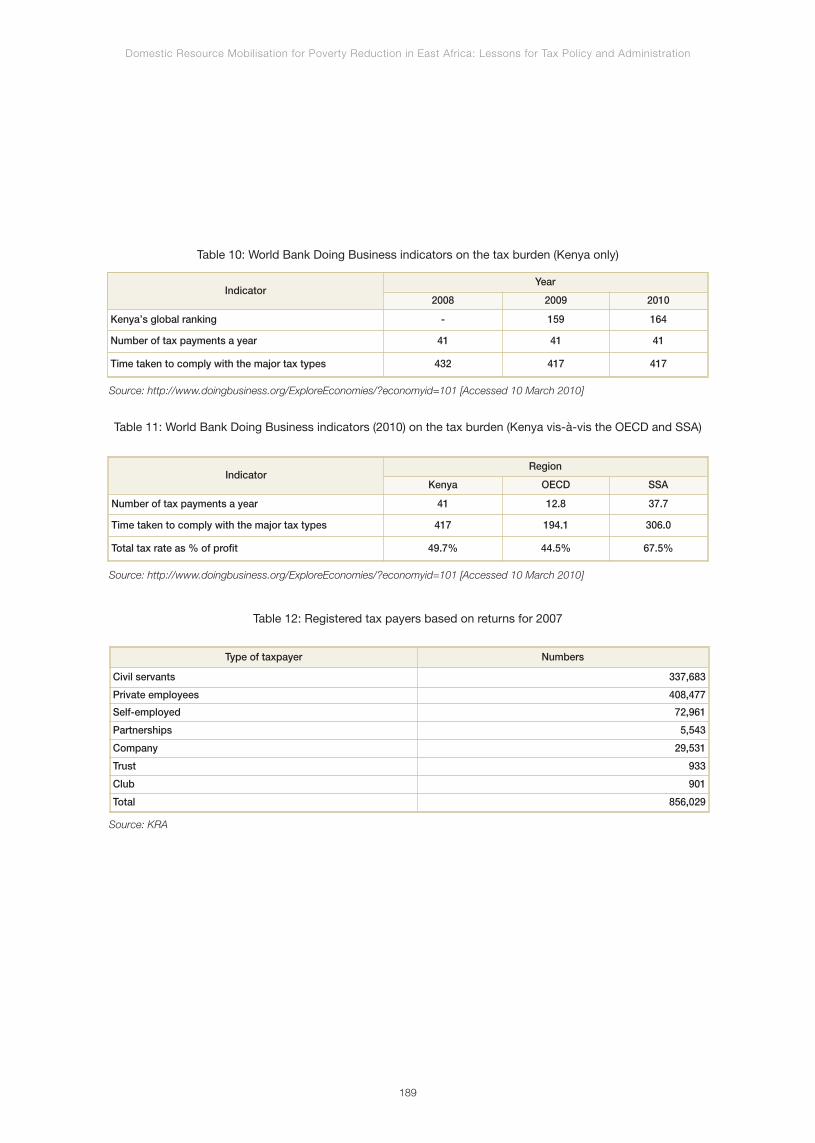
Domestic Resource Mobilisation for Poverty Reduction in East Africa: Lessons for Tax Policy and Administration
189
IndicatorYear
2008 2009 2010
Kenya’s global ranking - 159 164
Number of tax payments a year 41 41 41
Time taken to comply with the major tax types 432 417 417
Table 10: World Bank Doing Business indicators on the tax burden (Kenya only)
Source: http://www.doingbusiness.org/ExploreEconomies/?economyid=101 [Accessed 10 March 2010]
IndicatorRegion
Kenya OECD SSA
Number of tax payments a year 41 12.8 37.7
Time taken to comply with the major tax types 417 194.1 306.0
Total tax rate as % of profit 49.7% 44.5% 67.5%
Table 11: World Bank Doing Business indicators (2010) on the tax burden (Kenya vis-à-vis the OECD and SSA)
Source: http://www.doingbusiness.org/ExploreEconomies/?economyid=101 [Accessed 10 March 2010]
Type of taxpayer Numbers
Civil servants 337,683
Private employees 408,477
Self-employed 72,961
Partnerships 5,543
Company 29,531
Trust 933
Club 901
Total 856,029
Table 12: Registered tax payers based on returns for 2007
Source: KRA
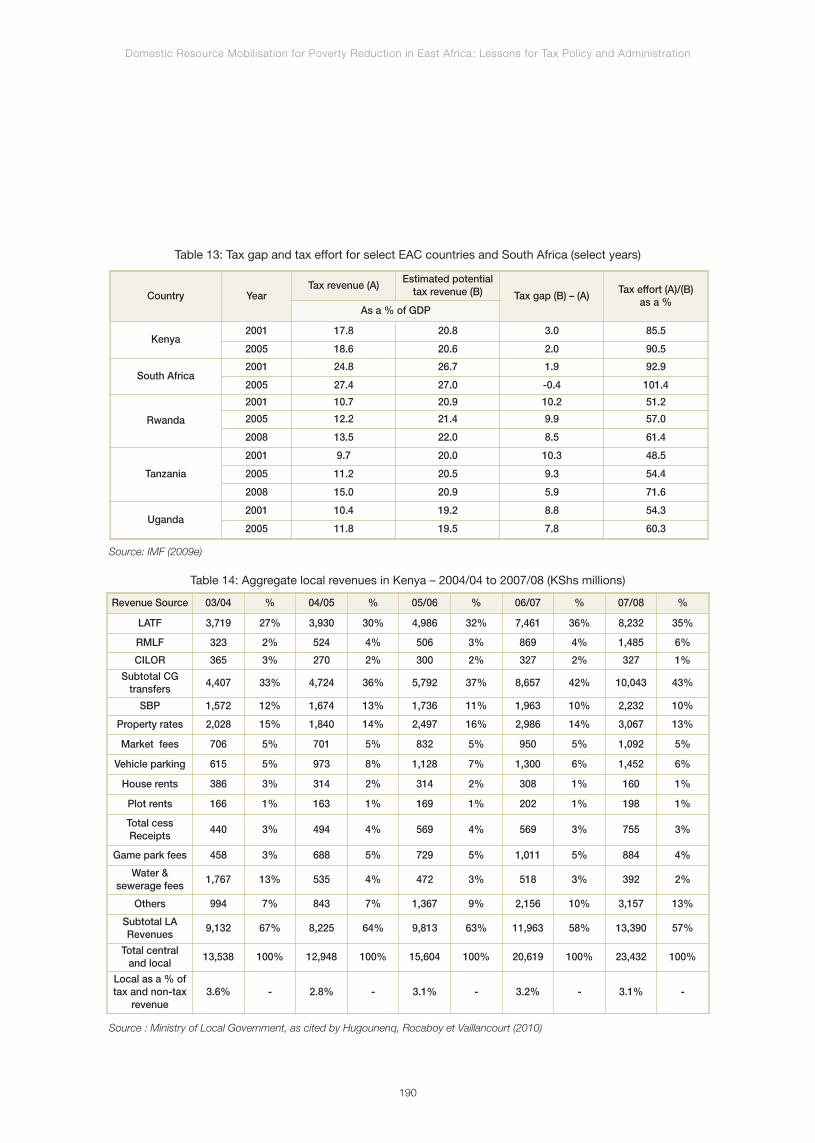
Domestic Resource Mobilisation for Poverty Reduction in East Africa: Lessons for Tax Policy and Administration
190
Country YearTax revenue (A)
Estimated potentialtax revenue (B) Tax gap (B) – (A)
Tax effort (A)/(B)as a %
As a % of GDP
Kenya2001 17.8 20.8 3.0 85.5
2005 18.6 20.6 2.0 90.5
South Africa2001 24.8 26.7 1.9 92.9
2005 27.4 27.0 -0.4 101.4
Rwanda
2001 10.7 20.9 10.2 51.2
2005 12.2 21.4 9.9 57.0
2008 13.5 22.0 8.5 61.4
Tanzania
2001 9.7 20.0 10.3 48.5
2005 11.2 20.5 9.3 54.4
2008 15.0 20.9 5.9 71.6
Uganda2001 10.4 19.2 8.8 54.3
2005 11.8 19.5 7.8 60.3
Table 13: Tax gap and tax effort for select EAC countries and South Africa (select years)
Source: IMF (2009e)
Revenue Source 03/04 % 04/05 % 05/06 % 06/07 % 07/08 %
LATF 3,719 27% 3,930 30% 4,986 32% 7,461 36% 8,232 35%
RMLF 323 2% 524 4% 506 3% 869 4% 1,485 6%
CILOR 365 3% 270 2% 300 2% 327 2% 327 1%
Subtotal CGtransfers
4,407 33% 4,724 36% 5,792 37% 8,657 42% 10,043 43%
SBP 1,572 12% 1,674 13% 1,736 11% 1,963 10% 2,232 10%
Property rates 2,028 15% 1,840 14% 2,497 16% 2,986 14% 3,067 13%
Market fees 706 5% 701 5% 832 5% 950 5% 1,092 5%
Vehicle parking 615 5% 973 8% 1,128 7% 1,300 6% 1,452 6%
House rents 386 3% 314 2% 314 2% 308 1% 160 1%
Plot rents 166 1% 163 1% 169 1% 202 1% 198 1%
Total cessReceipts
440 3% 494 4% 569 4% 569 3% 755 3%
Game park fees 458 3% 688 5% 729 5% 1,011 5% 884 4%
Water &sewerage fees
1,767 13% 535 4% 472 3% 518 3% 392 2%
Others 994 7% 843 7% 1,367 9% 2,156 10% 3,157 13%
Subtotal LARevenues
9,132 67% 8,225 64% 9,813 63% 11,963 58% 13,390 57%
Total centraland local
13,538 100% 12,948 100% 15,604 100% 20,619 100% 23,432 100%
Local as a % oftax and non-tax
revenue3.6% - 2.8% - 3.1% - 3.2% - 3.1% -
Table 14: Aggregate local revenues in Kenya – 2004/04 to 2007/08 (KShs millions)
Source : Ministry of Local Government, as cited by Hugounenq, Rocaboy et Vaillancourt (2010)

Annex 5.4: The EAC Customs Union
Domestic Resource Mobilisation for Poverty Reduction in East Africa: Lessons for Tax Policy and Administration
191
Box 5.1: Implications of the EAC Customs Union
The formation of the EAC Customs Union has provided major momentum to Kenya’s trade reform process. Since
the signing of the protocols in January 2005, the EAC Customs Union has gone into high gear to address critical areas
of reform. They include: documentation rationalization and standardization, information communications technology,
port services facilitation, border post cooperation, third-party insurance, transit charges harmonization, tariff reforms
(common external tariff), and standards harmonization. The reforms will install the risk management procedures
needed to build this expanded “domestic market” (originally signed by Kenya, Uganda, and Tanzania; Rwanda and
Burundi have also been accepted for membership). Kenya’s need to comply with the requirements of the new
Customs Union will continue to be a major driver for trade reform and customs modernisation.
Concern is expressed about the capacity of the EAC Customs Union to move forward successfully. A number of
those interviewed remarked on the fact that participating countries remain suspicious of each other. There is also the
view that the EAC needs to be restructured so that it can act more quickly and spend less time talking.
Source: www.bizclir.com/galleries/.../01.128.08BP12_Kenya.pdf [Accessed 11 April 2010]
The East Africa Community (EAC) was reborn on 20th
November 1999 and the Treaty, establishing the EAC
became effective on 7th July 2000, with Kenya, Tanzania
and Uganda as its founding members. Four years later, in
March 2004, the founding members signed a customs
union protocol, which became effective in January 2005.
This protocol is enshrined into the East African Commu-
nity Customs Management Act of 2004. The Act has
been legislated in each of the member countries.
The protocol establishes common external tariffs
(CETs), eliminating internal tariffs. It also brought about
the following changes:
• elimination/phased elimination of customs duty
originating from partner states;
• harmonisation of customs principles and proce-
dures; and
• removal of suspended duty.
Furthermore, in 2004/05, to harmonise Kenya’s exemp-
tion regime with those of the other EAC partner states,
and to reduce the abuse of exemptions by undeserving
organizations, GoK abolished the discretionary customs
duty waiver. However, Government still retained powers
to grant exemptions in the national interest. The implica-
tions of the customs union are further elaborated
in Box 5.1.
It is also noteworthy that with the EAC Customs Union
protocol in place, GoK no longer has scope to indepen-
dently amend customs duties. In contrast, Government
has considerable flexibility to change excise duty rates.
It has therefore made many changes to excise duty rates
over the years – including increases in rates levied on
beer, alcoholic spirits, tobacco etc. Furthermore, in a
move to curb the environmental menace caused by
plastic bags and sacks, in 2007/08, the Minister of
Finance proposed to levy an excise duty of 120% on
these items. Also, in 2008/09, all wireless telephony
services became subject to excise duty at 10%. In the
same year, imports of second-hand computers were
subject to excise duty of 25%.
As a result of the formation of regional trading blocs,
Kenya has, over the past decade, been able to increase
its volumes of exports to member states of the EAC and
COMESA. In particular, it exports food and beverages,
industrial supplies, machinery and transport supplies and
consumer goods to these countries (McCormick and
Pedersen, 1999). However, horticulture products and tea
are Kenya’s highest export earners, and in 2009 contri-
buted KShs71.6 and KShs69.0 billion respectively
(Mugambi, 2010). The highest share of horticultural
exports is from flowers, fresh fruits and vegetables.
Kenya is one of the World’s largest tea producers – its
major buyers are Egypt, the United Kingdom, Afghanis-
tan, Pakistan and Yemen28.
Domestic Resource Mobilisation for Poverty Reduction in East Africa: Lessons for Tax Policy and Administration
28 http://www.abndigital.com/news/top-business-stories/454111.htm [Accessed 7 April 2010].
192
Annex 5.5: KRA’s ICT-based comprehensive tax
administration reform strategy
Since 2004/05, KRA has embarked on more funda-
mental reforms under the Revenue Administration
Reform and Modernisation Programme. RARMP seeks
to transform “KRA into a modern, fully integrated and
client-focused organization”29. It consists of seven
projects: (i) customs reforms and modernisation; (ii)
domestic taxes reform and modernization; (iii) road
transport reform and modernisation; (iv) investigation
and enforcement reform and modernisation; (v) KRA
infrastructure development; (vi) KRA business automa-
tion; and (vii) human resource revitalisation. RARMP is
sequenced into phases, which are incorporated in
KRA’s successive corporate plans.
In line with the vision underlying the RARMP, KRA’s
current (fourth) corporate plan (2009-2013) has set the
following goals:
• a professional team that is well remunerated;
• an enabling work environment;
• a fully automated authority allowing for a single
view of the taxpayer and full utilisation of ICT to
promote compliance;
• a transformed and fully functional organisation;
• compliance costs are minimised and customer
service is enhanced; and
• revenue targets achieved.
More significantly, through the RARMP, KRA has in
effect launched an ICT-based strategy for modernisa-
tion of tax administration30. According to KRA’s
Commissioner General, the objectives of the system
are to:
• enhance efficiency of the tax collection process;
• strengthen responsiveness of systems in terms of
their accuracy and timeliness;
• minimise contact between taxpayers and tax
officials as a means of reducing corruption;
• facilitate sharing of information with third parties;
• enable KRA to have a single-view of the taxpayer; and
• reduce transaction and administration costs for
taxpayers and KRA respectively31.
The strategy covers five key ICT systems. First, there is
an Integrated Tax Management System (ITMS) in place
for domestic revenue. As part of the ITMS, KRA auto-
mated the unique personal identification numbers (PINs)
from 30 March 2009. Using an electronic registration
(e-Registration) module, taxpayers can register to obtain
PINs online for the purposes of: pay as you earn (PAYE);
VAT; land rent; income tax; and withholding tax. KRA also
discontinued the manual distribution of PIN certificates.
As a result, the “issuance of multiple tax registration
numbers has been discontinued and replaced with a
generic PIN certificate”32. “e-Registration is fully opera-
tional and cumulatively, 60,310 new taxpayers had
registered online by the end of May 2009” (KRA, 2009).
The ITMS initially enabled registered taxpayers to file
their tax returns for VAT and PAYE online – subse-
quently; the system has been extended to cover the
filing of corporate income tax returns. The system was
first piloted in December 2008; three firms-- East
African Portland Company, Safaricom and Kenya
Breweries-- were the pioneer users. KRA provides
taxpayer software and a user manual, both of which
Domestic Resource Mobilisation for Poverty Reduction in East Africa: Lessons for Tax Policy and Administration
29 http://www.kra.go.ke/rarmp/rarmp.html [Accessed 11 April 2010].30 http://www.kra.go.ke/rarmp/rarmp.html [Accessed 11 April 2010].31 www.kra.go.ke/.../CG_Remarks_Launch%20_E-filing_E-registration_290109.pdf [Accessed 11 April 2010].32 http://www.revenue.go.ke/portal/index.html [Accessed 11 April 2010].
193

can be downloaded from its website. Taxpayers can
call-in to a dedicated help centre for further assistance.
Second, from 1 January 2005, KRA introduced electro-
nic tax registers (ETRs) for VAT registered taxpayers. Key
features of ETRs include: the ability to maintain fiscal
memory – they contain “read only memory…to store tax
information at the time of sale”; and in-built security
features (e.g., seal memory, special technical specifica-
tions etc. (KRA, 2005). KRA finances the “purchase of
ETRs and other fiscal devices. However taxpayers are
required to install the machines and claim the cost from
KRA”33.
Third, in the area of customs, the Simba 2005 system
(S2005S) has been implemented. The S2005S replaced
a legacy “Bishops Office Freight Forwarders Integrated
Network”. It is based on the GAINDE system developed
in Senegal. The S2005S “has enabled the automation of
about 90% of customs operations”34. The S2005S
facilitates clearance of shipments by enabling importers
and exporters to submit declarations through direct
input, provides readily accessible information on tariffs
and regulations and is linked to banks. It also operates
at most of Kenya’s border posts via a wide area
network. S2005S is able to obtain third party information
from the Kenya Ports Authority systems – Cargo
Management Information System (CAMIS) and Kilindini
Water Front Operating System (KWATOS). S2005S is
also interfaced with the electronic cargo tracking
system, and the Revenue Authority Digital Data
Exchange. RADDEX is operational in Rwanda, Uganda
and Tanzania, and being piloted in Burundi (see Box
5.2).
Fourth, KRA has automated the management of
drivers’ licences, and the Vehicle Management System
(VMS). The VMS and S2005S are linked to allow “for
payment of motor vehicle registration fees with import
duty. The integration process enables vehicle importers
Domestic Resource Mobilisation for Poverty Reduction in East Africa: Lessons for Tax Policy and Administration
33 http://www.kra.go.ke/faq/faqetr.html [Accessed 11 April 2010].34 International Tax Dialogue Survey – 2009.
194
Box 5.2: The rationale for setting up RADDEX within the EAC
At a meeting of Commissioners General of the East African Revenue Authorities held on 21 April 2006, it was
agreed that measures be taken for quick confirmation of goods by customs administrations in importing countries. The
logical method for achieving this lies in creating a seamless and efficient customs network by providing interconnecti-
vity among the Revenue Authorities’ computerized systems.
EAC Revenue Authorities in partnership with the East and Central Africa Global Competitiveness Hub (ECA Hub)
[discussed] the interconnectivity of… ASYCUDA++ and KRA’s Simba 2005 Customs IT Systems. These discussions
have given rise to the RADDEX system.
RADDEX intends to greatly benefit trade and trade stakeholders by further reducing the time and cost of cargo
clearance at East African borders through the introduction of an electronic communication channel… This channel will
effectively allow Kenya’s Simba 2005 customs system to exchange data with…ASYCUDA++ system.
Data communicated through RADDEX… consist of exports, re-exports and transit declarations that have been
cleared by customs in the country of departure and reconciliation data from goods accepted in the country of entry.
Data security has been addressed at every level of the RADDEX system to ensure confidentiality and integrity among
the trade stakeholders. RADDEX is expected to benefit all stakeholders with particular positive impact on
importers/exporters, shippers and freight forwarders, transporters and Revenue Authorities.
Source: http://www.ictcorridor.com/wp-content/uploads/2008/01/usermanualagent.pdf [Accessed 11 April 2010]
to…[more easily] pay for registration along with other
relevant customs duties online” (KRA, 2009). The VMS
is also integrated with the PIN system in ITMS.
Fifth, KRA is implementing Free Open Source Software.
FOSS is an enterprise resource planning (ERP) system.
It merges “the support administrative functions to
enable efficiency, effectiveness and transparency. It will
provide an integrated application with a unified data-
base” (KRA, 2009). Currently, FOSS is used “for on-line
staff leave applications, request for purchase orders,
which are approved on-line, and stationery requests
among others”35.
It is noteworthy that there was serious resistance
from freight forwarders and customs clearing agents
to the implementation of both ETR and the S2005s
systems. In the case of the ETRs, businesses
mobilised considerable support against the new
system from even members of Parliament. In the
case of the S2005S, “The Kenya International
Freight and Warehousing Association initiated a
court action because members felt that [modernisa-
tion] imposed unfair and costly requirements”36.
However, following, “an agreement made on 21st
July 2005 between KRA's advocates and advocates
for Chivalo Investments and 790 others (clearing
agents)”37, KRA implemented the Simba system in
2005. It is with the support of the Government, and
by use of experienced legal counsels that KRA’s
position prevailed and the systems have been
implemented.
Domestic Resource Mobilisation for Poverty Reduction in East Africa: Lessons for Tax Policy and Administration
35 International Tax Dialogue Survey – 2009.36 www.bizclir.com/galleries/.../01.128.08BP12_Kenya.pdf [Accessed 11 April 2010]37 http://www.communication.go.ke/kenya.asp?cat_id=37 Accessed 11 April 2010].
195

Chapter 6
Rwanda

Summary of Key Findings
Context-Political economy and
fiscal legacies
As expounded in an Africa Capacity Building Founda-
tion (2003) sponsored review, at independence, in
1962, Rwanda inherited weak human, institutional and
societal capacity to cope with the challenges of deve-
lopment management. The economic crisis of the mid-
1980s, followed by genocide and war in the 1990s,
further undermined the limited progress that had been
made in the previous years (Rugumamu and Gbla,
2003). The 1994 genocide not only resulted in the un-
precedented loss of human lives and disruption of the
social fabric, it also led to the virtual destruction of the
already weak economy and socioeconomic institutions.
For instance, real GDP in 1996 remained at only 72%
of its 1990 level. Five years later, over 60% of the po-
pulation lived below the poverty line, compared to
about 40% in 1985.
The post-genocide government committed to rapid
economic recovery through prudent fiscal and mone-
tary policies, economic liberalisation and institutional
capacity building. The measures produced spectacular
results: The economy rapidly rebounded - growing by
about 80% between 1994 and 1998. After a temporary
setback in 2003 (when the real GDP growth fell to
2.9%), high growth rates have been recorded since
2004. Since 2005, Rwanda’s annual real GDP growth
has exceeded 9% every year (except in 2007 when it
dropped to 7.7%). In 2008, the economy experienced
its first double-digit growth in over five years, at 11.6%.
Three political economy factors underpin the Govern-
ment of Rwanda’s (GoR’s) zeal to maximise DRM. First,
Rwanda’s defense budget, which cannot be suppor-
ted by Official Development Assistance (ODA), will re-
main comparatively high because the country remains
in a state of defensive “war” since the genocide. Se-
cond, while the ODA contribution to the budget is subs-
tantial, there have been intermittent threats, including
two incidences of actual withdrawal or cut-back of aid
by European countries because of Rwanda’s involve-
ment in the conflicts in the DRC. Rwanda has justified
its involvement in the conflicts by its need to fend off
the continued insecurity posed by genocide perpetra-
tors operating from across the border in DRC. Third,
substantial and sustained increases in development
financing are needed to achieve the ambitious goals of
Rwanda’s Vision 2020.
Tax reforms: Sequencing,
implementation and results
The history of tax reforms in Rwanda is comparatively
short. From a sequential perspective, six distinct, al-
beit short, phases of reforms can be identified:
• First : institutional reforms and capacity building,
which correspond to the period beginning with the
establishment of Rwanda Revenue Authority (RRA)
in 1997 and the subsequent three years;
• Second : widening the tax base. The hallmark
development in this phase was introduction of the
VAT in 2001;
• Third : streamlining the tax regime and administra-
tion. This was effected by widening the mandate of
RRA to cover non-tax revenues, and rationalisation
of income tax rates, in 2003 and 2005 respectively;
• Fourth : aligning the tax system with development
policy priorities through introduction of a new
income tax law, investment and export promotion
legislation and tax code in 2005;
• Fifth : strengthening the compliance enforcement
regime by enacting Law No 25 of 2005 to cater for,
among other measures, tax audits, appeals and
Domestic Resource Mobilisation for Poverty Reduction in East Africa: Lessons for Tax Policy and Administration
198
penalties for evasion; and introducing penalties for
taxpayers who fail to comply with provisions for
consumption taxes (in 2006); and
• Sixth : harmonising Rwanda’s tax regime and
administration with that of the EAC (in 2009 and
2010).
In short, Rwanda’s tax system has undergone several
reforms since 2001. Nonetheless, they have been sys-
tematic and sequenced. More significantly, through the
reforms, Rwanda has made major strides in efficiency
improvements and modernisation of the tax adminis-
tration system. Highlights of the results include:
• The ongoing major initiative to widen the tax base
by establishing the Small and Medium Taxpayers
Office and embarking on implementation of the
block management system;
• Timely auditing of refund claims by the RRA. Also,
unlike some EAC countries, in Rwanda, RRA has
the full mandate to administer the refunds;
• Compliance levels have significantly improved with
as many as 97% compliant large taxpayers (who
contribute approximately 75% of total domestic
taxes);
• Over 90% of revenue is collected by banks;
• In 2010, Rwanda and Uganda launched a 24/7
one-stop border service at Gatuna;
• RRA has contributed to the dramatic improvement
in Rwanda’s 2010 “Doing Business” ranking by
spearheading a number of tax legislation reforms;
and
• RRA received the International Standards Organi-
sation 9001 certification in 2009.
Although Rwanda faces the same fiscal decentralisa-
tion challenges encountered by other countries in
Africa, its social context sets it apart from others in the
region. For instance, the Government’s Fiscal and Fi-
nancial Decentralisation Policy (2006) is not only
aimed at improving efficiency in the provision of ser-
vices at the local level, but it also focuses on sustai-
nable development, economic growth and poverty
reduction. The Law on the Organization and Functio-
ning of the District (2006) assigns local governments
a series of tax and non-tax revenue sources. However,
while local governments have a degree of discretion
in determining tax rates, they are not permitted to
create new taxes or define the tax base for local reve-
nue sources. This ensures coordinated implementa-
tion of tax policy and minimises distortion/ disruption
of economic activity.
Domestic revenue performance
Rwanda’s total domestic revenue as a percentage of
GDP rose from 8.4% in 1993 to 14.2% in 2008. In
1994, however, total domestic resources as a percen-
tage of GDP fell to a dismal 3.6% on account of the ge-
nocide. Tax growth has ranged between 0.25% and
0.3% of GDP every year from 1997 (IMF 2009c).
Over the years, taxes on goods and services have
formed the bulk of total domestic revenues – at about
48% of the total tax revenue. Since 2001, and with the
exception of 2004, contribution to total taxes from di-
rect taxes has been on a steady rise – in 2008 the share
of direct taxes peaked at 37.5%. The share of taxes on
international trade to total tax revenues has steadily
decreased from a high of 41% in 1995 to just over 10%
in recent years. This is attributed to an initial reduction
in import duty rates – “with the maximum rate declining
from 60% to 40%” (IMF, 2000). Furthermore,
“Rwanda’s weighted average tariff rate was 11.3% in
2008”1.
Domestic Resource Mobilisation for Poverty Reduction in East Africa: Lessons for Tax Policy and Administration
1 http://www.heritage.org/index/Country/Rwanda [Accessed 18 April 2010].
199
Challenges and issues
In the short-to-medium term, significant increase in real
tax revenue growth is more likely to come from mea-
sures to raise and sustain compliance by existing
taxpayers and improve administration efficiency. In this
regard, the main challenges and issues to be addres-
sed include the following:
• Achieving a cost-effective strategy to widen the tax
net: It entails enlisting small and micro enterprises
that are largely in the informal sector, and getting
them to pay taxes. This can be associated with high
administrative costs in the short term;
• Rationalising collection of central and local
government taxes: In line with GoR’s decentralisa-
tion policy, property and rental income taxes are
collected by local government authorities. However,
experiences from countries, such as Kenya and
South Africa, suggest that RRA would be more
effective than local governments in collecting those
taxes. Furthermore, in some countries such as
Tanzania, the revenue authority collects property
taxes on behalf of local governments;
• Developing and maintaining capacity for tax policy
management: The tax policy function is much
weaker relative to tax administration. This, to a
significant extent, is explained by the fact that the
organisation and staff in tax policy remain mired in
red tape and poor incentive environment;
• Building and sustaining management capacity in
RRA, especially technical and professional skills:
This will remain a major challenge to RRA well into
the long run. RRA’s capacity to develop and retain
the required human resources remains contingent
upon its ability to offer competitive remuneration
packages; and
Putting a cap on tax incentives and exemptions: In
pursuit of the policy goal of making Rwanda a preferred
foreign investment destination, and to attract particular
investors to Africa, GoR has offered tax incentives and
granted tax exemptions to some businesses. Yet, there
is a body of knowledge that suggests that these
incentives can be counter-productive.
Lessons learned
In confronting the challenges of design and implemen-
tation, three major lessons are worth sharing. They are:
• Explicit and strong support of top political leader-
ship matters: There is a shared view that strong sup-
port from the country’s top political leadership,
especially the President, and successive M nisters of
Finance, was the most crucial driver for change;
• Developing effective capacity is a long-term under-
taking: In spite of decade-long consistent and
determined efforts of RRA’s top management to
rapidly achieve required capacity, considerable
gaps still persists. The IMF (2009b) suggests the
priority gaps to be closed are strengthening audit
and enforcement capacity, as well as management
support functions such as ICT systems, human
resource and financial management; and
• Long-term and flexible technical assistance support
enables rapid and sustained capacity development:
DFID has provided substantial support to the RRA
since 1998. Although its support has dropped signi-
ficantly in recent years and now being phased out,
there is no doubt that the long-term orientation, pre-
Domestic Resource Mobilisation for Poverty Reduction in East Africa: Lessons for Tax Policy and Administration
200
dictability and flexibility of this support has enabled
RRA to rapidly and sustainably improve its capacity.
The rest of the chapter is organised as follows: the first
section discusses the political economy and fiscal
legacies, the second section covers trends in the tax
system, the third section explores domestic revenue
performance, the fourth section highlights the
challenges to increasing DRM, and the fifth section
concludes with lessons learned.
Domestic Resource Mobilisation for Poverty Reduction in East Africa: Lessons for Tax Policy and Administration
201
Context – political economy and fiscal legacies
Colonial legacies and the 1994
genocide
Rwanda has had uniquely chequered colonial, as well
as post-colonial legacies. It was part of the German-
East African colony from 1890 until it was occupied by
Belgium in 1916, which, in 1923, was given a League
of Nations mandate to govern Ruanda-Urundi2.
Rwanda became independent in 1962. However,
French neo-colonial influence was not only more pro-
nounced than Belgian in the immediate post-indepen-
dence period but preeminent, until the 1994 genocide.
Throughout Rwanda’s years of subjugation the colonial
powers did little to develop its economy and institu-
tions. Instead, they accentuated the ethnic divide and
promoted tensions that created the conditions for the
genocide (Mamdani, 2001).
As expounded in a 2003 Africa Capacity Building
Foundation (ACBF)-sponsored review, Rwanda inheri-
ted weak human, institutional and societal capacity to
cope with the challenges of development. It faced
severe capacity constraints in virtually all sectors,
characterised by a shortage of skilled manpower,
under-utilisation of available resources, weak institutio-
nal environments, and inadequate incentive structures,
as well as a lack of capacity retention strategies. Des-
pite various efforts to promote the social sector, neither
institutional nor human capacity grew fast enough to
keep pace with the requirements of rapidly changing
socioeconomic circumstances. The advent of the
economic crisis of the mid-1980s, as well as war and
genocide, undermined the limited progress that had
been made since the early 1980’s (Rugumamu and
Gbla, 2003).
The 1994 genocide did not only result in the unprece-
dented loss of human lives and fraying of the social
fabric, it also led to the virtual destruction of the already
fragile economy and weak socioeconomic institutions.
Per capita GDP dropped to less than US$200, and
poverty levels worsened significantly. Real GDP in 1996
remained at only 72% of its 1990 level. Five years later,
over 60% of the country’s nearly 10 million people lived
below the poverty line, compared to about 40% in
1985. In economic terms, Rwanda saw its GDP fall by
50% in 1994, and the rate of inflation increase by 64%.
Today, Rwanda remains one of the poorest countries in
the world, with a per capita GDP of just under US$500
in 2008.
Post-genocide economic
recovery and development drive
The post-genocide government made a commitment
to ensure rapid economic recovery through prudent fis-
cal and monetary policies, economic liberalisation and
institutional capacity building. Backed by substantial
external assistance, the new government successfully
delivered on its commitment: The economy rapidly re-
bounded, growing by 7% between 1994 and 1997,
and 8.9% in 1998. The growth was fuelled by large in-
flows of external aid for relief and reconstruction, and
supported by the stabilisation and liberalisation of the
economy. At the same time, inflation dropped from a
whopping 17% at the end of 1997, to an average of
6.8% in 1998.
After a temporary setback in 2003 when the real GDP
growth fell to 2.9% (IMF, 2004), high growth rates have
been recorded since 20043. Yet, as observed by Ru-
gumamu and Gbla (2003), the pre-1994 structural eco-
nomic problems still persist and will take decades to
resolve. Weakness in the Rwandan economy stems
from a lack of natural resources, poor human re-
sources, high population density, antiquated agricultu-
ral practices, environmental degradation and difficulties
in economic management. In addition, both private and
public sectors remain small and neither has been de-
veloped to meet the population’s needs.
Domestic Resource Mobilisation for Poverty Reduction in East Africa: Lessons for Tax Policy and Administration
2 http://news.bbc.co.uk/1/hi/world/africa/1070329.stm [Accessed 4 June 2010].3 In 2004, Rwanda recorded an economic growth rate of 4% (IMF, 2005).
202
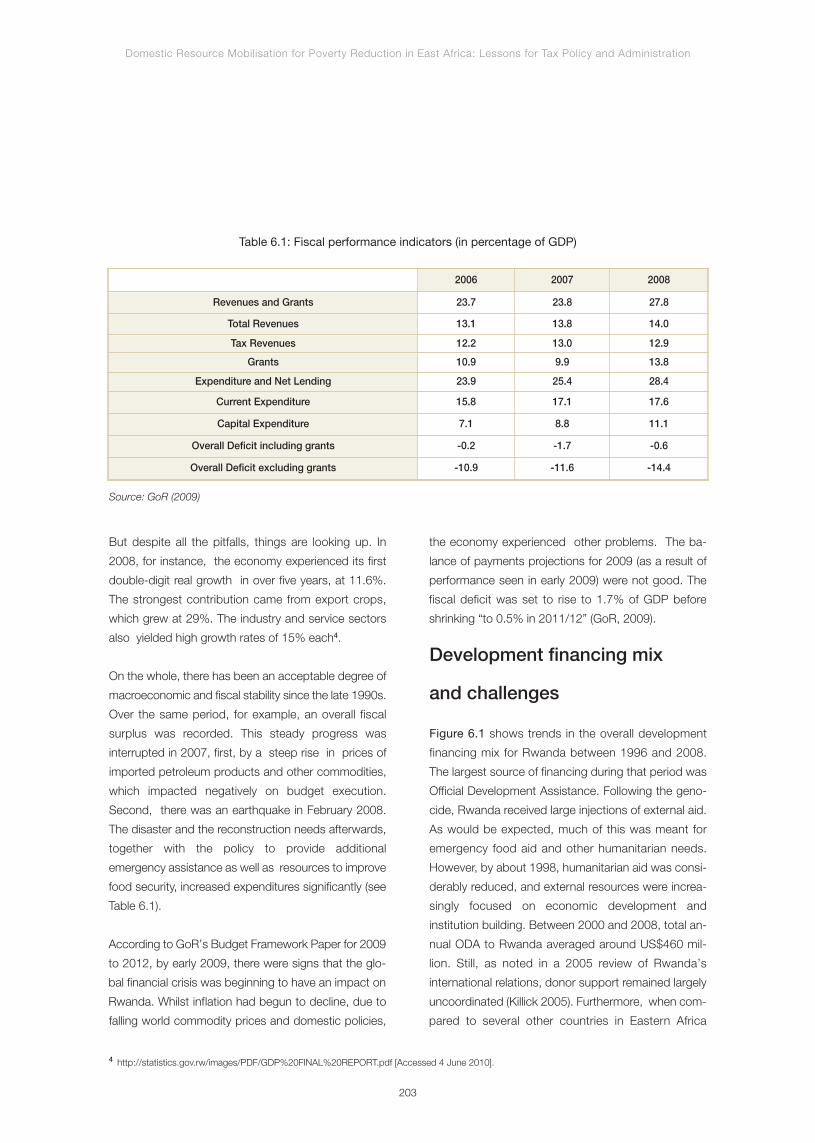
Domestic Resource Mobilisation for Poverty Reduction in East Africa: Lessons for Tax Policy and Administration
4 http://statistics.gov.rw/images/PDF/GDP%20FINAL%20REPORT.pdf [Accessed 4 June 2010].
203
2006 2007 2008
Revenues and Grants 23.7 23.8 27.8
Total Revenues 13.1 13.8 14.0
Tax Revenues 12.2 13.0 12.9
Grants 10.9 9.9 13.8
Expenditure and Net Lending 23.9 25.4 28.4
Current Expenditure 15.8 17.1 17.6
Capital Expenditure 7.1 8.8 11.1
Overall Deficit including grants -0.2 -1.7 -0.6
Overall Deficit excluding grants -10.9 -11.6 -14.4
Table 6.1: Fiscal performance indicators (in percentage of GDP)
Source: GoR (2009)
But despite all the pitfalls, things are looking up. In
2008, for instance, the economy experienced its first
double-digit real growth in over five years, at 11.6%.
The strongest contribution came from export crops,
which grew at 29%. The industry and service sectors
also yielded high growth rates of 15% each4.
On the whole, there has been an acceptable degree of
macroeconomic and fiscal stability since the late 1990s.
Over the same period, for example, an overall fiscal
surplus was recorded. This steady progress was
interrupted in 2007, first, by a steep rise in prices of
imported petroleum products and other commodities,
which impacted negatively on budget execution.
Second, there was an earthquake in February 2008.
The disaster and the reconstruction needs afterwards,
together with the policy to provide additional
emergency assistance as well as resources to improve
food security, increased expenditures significantly (see
Table 6.1).
According to GoR’s Budget Framework Paper for 2009
to 2012, by early 2009, there were signs that the glo-
bal financial crisis was beginning to have an impact on
Rwanda. Whilst inflation had begun to decline, due to
falling world commodity prices and domestic policies,
the economy experienced other problems. The ba-
lance of payments projections for 2009 (as a result of
performance seen in early 2009) were not good. The
fiscal deficit was set to rise to 1.7% of GDP before
shrinking “to 0.5% in 2011/12” (GoR, 2009).
Development financing mix
and challenges
Figure 6.1 shows trends in the overall development
financing mix for Rwanda between 1996 and 2008.
The largest source of financing during that period was
Official Development Assistance. Following the geno-
cide, Rwanda received large injections of external aid.
As would be expected, much of this was meant for
emergency food aid and other humanitarian needs.
However, by about 1998, humanitarian aid was consi-
derably reduced, and external resources were increa-
singly focused on economic development and
institution building. Between 2000 and 2008, total an-
nual ODA to Rwanda averaged around US$460 mil-
lion. Still, as noted in a 2005 review of Rwanda’s
international relations, donor support remained largely
uncoordinated (Killick 2005). Furthermore, when com-
pared to several other countries in Eastern Africa
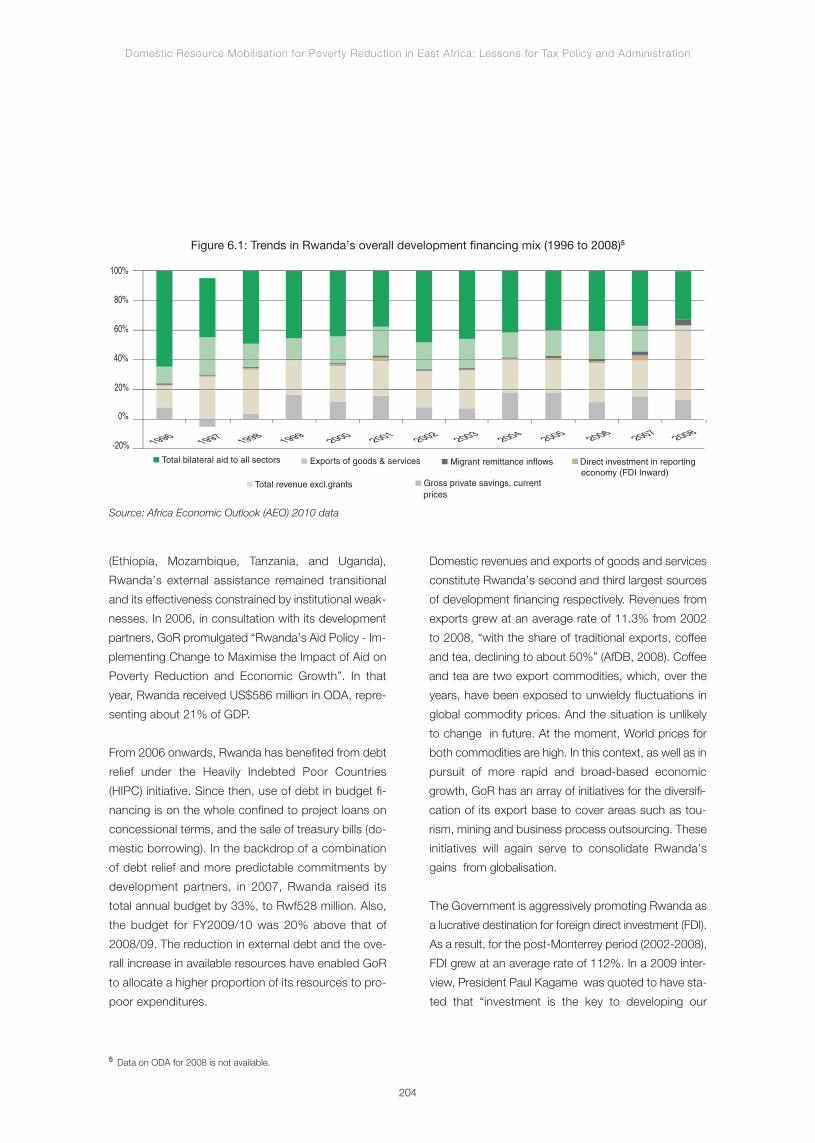
Domestic Resource Mobilisation for Poverty Reduction in East Africa: Lessons for Tax Policy and Administration
5 Data on ODA for 2008 is not available.
204
2008200720062005200420032002200120001999
1996 1997 1998
20%
100%
80%
60%
40%
-20%Total bilateral aid to all sectors
pricesGross private savings, currentTotal revenue excl.grants
economy (FDI Inward)Direct investment in reportingMigrant remittance inflowsExports of goods & services
0%
Figure 6.1: Trends in Rwanda’s overall development financing mix (1996 to 2008)5
Source: Africa Economic Outlook (AEO) 2010 data
(Ethiopia, Mozambique, Tanzania, and Uganda),
Rwanda’s external assistance remained transitional
and its effectiveness constrained by institutional weak-
nesses. In 2006, in consultation with its development
partners, GoR promulgated “Rwanda’s Aid Policy - Im-
plementing Change to Maximise the Impact of Aid on
Poverty Reduction and Economic Growth”. In that
year, Rwanda received US$586 million in ODA, repre-
senting about 21% of GDP.
From 2006 onwards, Rwanda has benefited from debt
relief under the Heavily Indebted Poor Countries
(HIPC) initiative. Since then, use of debt in budget fi-
nancing is on the whole confined to project loans on
concessional terms, and the sale of treasury bills (do-
mestic borrowing). In the backdrop of a combination
of debt relief and more predictable commitments by
development partners, in 2007, Rwanda raised its
total annual budget by 33%, to Rwf528 million. Also,
the budget for FY2009/10 was 20% above that of
2008/09. The reduction in external debt and the ove-
rall increase in available resources have enabled GoR
to allocate a higher proportion of its resources to pro-
poor expenditures.
Domestic revenues and exports of goods and services
constitute Rwanda’s second and third largest sources
of development financing respectively. Revenues from
exports grew at an average rate of 11.3% from 2002
to 2008, “with the share of traditional exports, coffee
and tea, declining to about 50%” (AfDB, 2008). Coffee
and tea are two export commodities, which, over the
years, have been exposed to unwieldy fluctuations in
global commodity prices. And the situation is unlikely
to change in future. At the moment, World prices for
both commodities are high. In this context, as well as in
pursuit of more rapid and broad-based economic
growth, GoR has an array of initiatives for the diversifi-
cation of its export base to cover areas such as tou-
rism, mining and business process outsourcing. These
initiatives will again serve to consolidate Rwanda’s
gains from globalisation.
The Government is aggressively promoting Rwanda as
a lucrative destination for foreign direct investment (FDI).
As a result, for the post-Monterrey period (2002-2008),
FDI grew at an average rate of 112%. In a 2009 inter-
view, President Paul Kagame was quoted to have sta-
ted that “investment is the key to developing our
industrial and service sectors” (Kitaoka, 2009). This ini-
tiative is bearing fruit. In 2009, Rwanda attracted a re-
cord US$600 million in FDI, surpassing Rwanda
Development Board’s (RDB) target of US$200 million
(Oluoch-Ojiwah, 2009). This was also the year when
Rwanda was ranked the best performer in the EAC in
the World Bank’s Doing Business ranking – in particu-
lar it was ranked: 67th out of 183 countries in terms of
ease of doing business; and as the top reformer glo-
bally. In addition, significant efforts have gone into im-
proving Rwanda’s regulatory and legislative
environment. “For example, the passing of the Com-
pany Law has reduced [the time taken to start a] busi-
ness from 14 to 2 days” (Ruburika, 2009).
Political economy dynamics
underpinning domestic
resource mobilisation
The synopsis of the political economy legacies that
have impacted DRM, as presented in the following sub-
sections, is based on Brautigam’s (2008) analytical fra-
mework6. It consists of five facets: (i) level of economic
development and economic structure; (ii) societal
factors: culture, values, trust and ‘tax morale’; (iii) war
and taxes: bureaucratic modernisation as a response to
threat; (iv) political institutions and tax systems; and (v)
taxation and fiscal contract.
High economic growth in recentyears but poverty levels remain high
Since 2005, Rwanda’s annual GDP growth has excee-
ded 9% every year (except in 2007, when it dropped
to 7.7%). In 2009, GDP growth was expected to slow
down to 6%. In the previous decade, the average
growth rate was more than 5% (GoR, 2009).
Despite the impressive performance since late the
1990s, the vast majority of Rwandans remain poor, and
the expected diversification of the economy has not
gained much momentum as it remains predominantly
agriculture-based. Real GDP per capita is still below
US$500. However, the economic structure is changing
(see Annex 6.3: Table 14). In other words, there are
encouraging signs of economic modernisation. For
instance, the manufacturing and construction sectors’
contribution to real GDP growth is steadily rising, while
that of agriculture is shrinking.
In the medium term, GoR projects an annual growth
rate of at least 8%, which will be fuelled by great strides
in modernisation of the economy, especially through in-
tensive exploitation of ICT. Still, the economy will remain
largely agricultural based in the foreseeable
future, ostensibly because it remains the largest provi-
der of employment in the country. This is borne by the
fact that although agriculture contributes only about
35% of GDP, it provides more than 90% of employ-
ment. The large rural (agricultural) informal sector
constitutes a vast reservoir of potential taxpayers but
one that is not readily accessible. Therefore, for the
foreseeable future, Rwanda will rely on a comparatively
narrow tax base.
Seeds of trust in governmentas a basis for a ‘tax morale’ are nowevolving7
The 1994 genocide was a culmination of decades of
intense ethnic distrust, tensions and hatred among
sections of Rwanda’s population – which also contri-
buted to a non-compliant tax culture. Mamdani (2001)
and Gourevitch (1998) argue that, while colonialists had
a major influence on these developments, the traditio-
nal (pre-colonial) culture had feudal strains that also
contributed to the distrust and conflict just before in-
Domestic Resource Mobilisation for Poverty Reduction in East Africa: Lessons for Tax Policy and Administration
6 Brautigam’s framework is adopted because compared to others that were examined; it is judged to be more comprehensive and elegant. However,like most others, its historical perspective derives too much from emergence of the modern European state to be linearly applied in states that are le-gacies of colonial rule, such as Rwanda.7 In a society where “tax morale” is high, there are low levels of tax evasion and avoidance. It is only in a social culture where citizens generally appre-ciate their responsibility for sustaining state services and where they have a trust in their state institutions and leaders that a “tax morale” evolves.
205
dependence in 1959, and in the next three and a half
decades. It has also been suggested by Rugumamu
and Gbla (2003) that Rwanda’s past monarchical and
authoritarian regimes promoted a culture of fear, sec-
tarian hatred and other negative social values that are
inimical to tax morale.
An independent review by the AfDB/OECD (2007)
suggests that the new regime:
“Has chosen the path of reconciliation, unity, social
cohesion and development as national priorities. In
October 2008, steps were taken to strengthen all
Rwandan political parties to enable them to engage in
interparty dialogue and improve their capacity to or-
ganise, communicate, and reach out to constituents
at the grassroots level. ... the ruling RPF won 78.6%
of the vote, with the Social Democratic Party and Li-
beral Party sharing the remainder of the seats. The
elections also resulted in women taking 56% of all
parliamentary seats, making Rwanda’s Chamber of
Deputies the first in the world with a female majority.
The elections were endorsed by international obser-
vers, and will enable the incumbent president to pur-
sue other pressing social development matters if he is
re-elected in 2010”.
In addition, “a study commissioned by the Regional
Centre on Small Arms has shown 96% and 94%
respectively of Civil Society and the General Public
declare high level of trust and satisfaction about
security organs and their effectiveness in providing
security to citizens” (Kagire, 2009). It is this kind of
citizen experience which eventually builds trust and
confidence in a government, and thereby enhances
its legitimacy, and stimulates tax morale among the
citizens. However, as recently as in 2007, the Rwanda
Revenue Authority (RRA) Commissioner General is
cited in a local daily to have observed that most of
the potential taxpayers evade paying taxes (The New
Times, 2007).
Continuing threat of war and reducedexternal aid impel bureaucraticmodernisation for growth in DRM
Since the genocide, Rwanda has remained in a state
of “war” because a large number of those responsible
for the genocide killings fled into the jungles of neigh-
bouring Democratic Republic of Congo (DRC), and the
threat of reprisals from them remain real. At the same
time, while external aid contributions to the budget are
substantial, Rwanda has faced intermittent threats of
withdrawal of aid by European countries because of its
involvement in the conflicts in the DRC. It argues that
it does so to fend off attacks from genocide perpetra-
tors operating from across the border. Also, the IMF
(2009a) underscores the need for GoR to formulate “an
exit strategy from aid dependence over the long term”.
These factors underpin the Government’s zeal to maxi-
mise DRM, especially by ensuring the capacity, effi-
ciency and effectiveness of the RRA.
Top political leadership keenlyfollows developments in the taxsystem
On assuming power, the RPF regime immediately rea-
lized that major institutional reforms, beginning with the
establishment of an autonomous revenue
collection agency, RRA in 1997, were crucial to streng-
thening and developing its fiscal framework. In recent
years, it has been observed that the ‘National Tax-
payers Day’ is one of the two most important
national events that the President of Rwanda must per-
sonally grace. The other is the annual leadership retreat.
According to Torero et al (2006):
“From the outset, the RRA has been able to count on
the personal support of the President, who has gone
on to play a major part in the campaign to change
public attitudes towards paying taxes and related chal-
lenges such as corruption. The President has
Domestic Resource Mobilisation for Poverty Reduction in East Africa: Lessons for Tax Policy and Administration
206

underlined the importance of the RRA as enabling the
country to finance poverty reduction expenditure, and
to reduce its dependence on outside assistance. ... The
President has also publicly stressed the importance of
creating an enabling environment for investment, which
has stimulated the RRA in making considerable effort
at outreach to the private sector”.
Government leaders are promotingthe principle of a “fiscal contract”8
According to Torero et al (2006), the principle of the
‘fiscal contract’ is well upheld by Government leaders in
Rwanda, who advocate for RRA to be seen to “contri-
buting to developing a culture of participation and
citizenship as part of a wider process of establishing
the norms and practices of democratic governance,
and of bringing government closer to the people”. In
this regard, the leaders are proactively seeking to
persuade the public to buy into the latter’s motto,
‘taxes for growth and development’.
Fiscal governance drivers,
results and trajectory
The authors suggest that there are four key fiscal
governance drivers for Rwanda in the medium-to-long
term. First, GoR has an ambitious vision to transform
the nation into a middle-income country, free of poverty
by 2020. To this end, besides achieving the MDGs,
there are grand plans to modernise the physical eco-
nomic structure and institutions, and make Rwanda the
ICT hub of East and Central Africa. According to the
IMF (2009b), although Rwanda has made significant
progress in achieving universal primary education,
gender equality and women’s empowerment, and
reducing child mortality, it may not meet some of the
MDG targets. Still, Rwanda’s leadership does not
waiver on its commitment to achieving the MDGs. It
can therefore be expected to sustain high levels of pu-
blic expenditure allocations to social services. GoR is
also geared to making high investments in infrastruc-
ture development. To this end, it looks to RRA’s im-
proved tax effort to close any fiscal shortfalls.
The second driver is international development organi-
sations’ influence, given the comparatively high level of
ODA in the budget. Total grants are shown at Rwf285.2
billion (about US$485 million) in 2008/09 and rising to
Rwf405.7 billion (about US$690 million) in 2011/12
(subject to additional donor commitments). Fiscal
expansion has allowed increases in priority spending,
especially in the areas of: infrastructure; and the social
sectors, particularly education, health as well as social
protection. It is expected that this scaling-up will conti-
nue despite the global financial crisis. However,
support from international development organisations
(IDOs) is problematic, in particular, due to the unpre-
dictability of forward commitments. For instance, the
fiscal projections in the budget framework paper for
2009/10 to 2011/12 show a gap of Rwf168.5 billion
(US$294.5 million) in grants over the medium term
(GoR, 2009).
The third one, which relates to the second driver,
emanates from the conditionalities imposed on Rwanda
by IDOs to continue to access debt relief under HIPC.
Specifically, its access to non-concessional borrowing
is restricted. Moreover, given the macroeconomic and
fiscal regimes that GoR has agreed with the IMF, which
serve to confirm compliance with HIPC conditionalities,
the fiscal space is quite restricted. This therefore im-
plies that fiscal expansion can only be achieved with in-
creased DRM.
Finally, although Rwanda’s accession to the EAC is
expected to yield considerable economic benefits in the
long run, and even facilitate the timely achievement of
the Vision 2020, this membership imposes fiscal
Domestic Resource Mobilisation for Poverty Reduction in East Africa: Lessons for Tax Policy and Administration
8 Fiscal contract has its genesis in agreements between European monarchies and the propertied class and merchants that the latter would contributeto state coffers especially to fund war in return for specific benefits. In modern times a fiscal contract would be characterised by government pledges ofspecific socio-economic benefits to justify taxation. This is a more realistic proposition in a democratic dispensation.
207
restraints. The EAC members are expected to observe
monetary and fiscal convergence. Furthermore, in the
medium term, Rwanda will experience a reduction in
customs revenue arising from lower external tariffs.
These have been estimated at Rwf23.3 billion (US$41.2
million) for the three-year period.
Although a high rate of economic growth and a
substantially improved tax effort are projected in the
medium term, there are pointers which suggest that
GoR’s fiscal governance trajectory could be precarious
in the medium-to-long term (IMF, 2009b). Tax to GDP
ratio is projected to reach 15 % by 2013. But, the level
of grants is expected to decrease from a peak of 13.6
% of GDP in 2009 to as low as 7.4 % in 2013. At the
same time, as earlier indicated, HIPC conditionalities
will limit Rwanda’s options for alternative resource mo-
bilisation. In this scenario, it may not afford a fiscal fra-
mework that is consistent with achieving its
development goals, especially as anchored to the Vi-
sion 2020, unless tax effort is raised rapidly and consi-
derably.
Domestic Resource Mobilisation for Poverty Reduction in East Africa: Lessons for Tax Policy and Administration
208
Trends in the tax system
Changes in tax policies
over the years
The rudimentary legacy tax systemof the 1960s
Rwanda inherited a rudimentary tax legislative and
institutional structure at independence. The first legis-
lation included the Ordinance of August 1912, which
established graduated tax and tax on real property. In
November 1925, there was another Ordinance, adop-
ting one issued in Belgian Congo in June 1925 to
establish a profits tax. After independence, taxes were
formally introduced in Rwanda by a law of June 1964
concerning profit tax. Customs and excise duties were
introduced later in July 19689. Apparently, there were
minimal improvements until the RPF regime was
installed in 1994.
Tax policies immediately followingthe genocide and RRA formativeyears
When the RPF assumed power, it introduced an export
tax on coffee as a temporary measure. GoR also took
steps to reduce the level of tax exemptions (e.g.,
around imports and waivers given to public enterprises,
NGOs and faith groups), and curb tax evasion. In 1996,
it imposed a “presumptive income tax of 3% of annual
turnover on all enterprises…[and increased] specific
consumption taxes on alcohol, petroleum and soft
drinks” (IMF, 2000).
The establishment of RRA in 1997 was underpinned by
the policy objective to maximise domestic revenue so
as to reduce Rwanda’s dependence on foreign aid.
There were no immediate major tax policy measures for
the next three years and focus was apparently on
building administrative capacity as GoR:
“Benefited from a long-term [IMF] resident adviser in tax
policy, legislation and administration. Particular empha-
sis was placed on the establishment of the Large
Enterprise Unit (in MINECOFIN), taxpayer registration
and identification, including the introduction of taxpayer
identification numbers, arrears collection, tax audits,
and the introduction of presumptive taxation” (IMF,
2000).
Major developments in tax policiesbeginning 2001
The first major policy initiative of the post-genocide
regime was the introduction of the Value Added Tax
(VAT) in 2001. VAT replaced the sales tax (ICHA)
through Law No. 6 of 2001. ICHA was considered to
offer too many exemptions and was difficult to admi-
nister10. The standard rate of VAT levied was initially
15% in 2001 but it is now 18%. Purchases by privileged
persons (e.g., diplomats) as well as IDO-financed pro-
jects are zero rated. Furthermore, certain supplies are
exempt from VAT, such as agricultural products, health
services and supplies, education materials and ser-
vices, transport services and water supplies.
In 2003, another major policy move was made when
RRA was assigned responsibility for collecting non-tax
revenues such as: fines and fees; revenue from public
property and assets; and proceeds from sale of
government vehicles. This was expanded with the ad-
dition of administrative fees in 2007.
Two years later, in 2005/06, further major policy and
legislative measures were taken, comprising:
• New income tax legislation, through Law No. 16 of
2005. The top marginal corporate and personal
income tax rates are 30%. Personal income tax
(PIT) rates are progressive with income categorised
into three brackets with marginal rates of 0%, 20%
Domestic Resource Mobilisation for Poverty Reduction in East Africa: Lessons for Tax Policy and Administration
9 http://www.devpartners.gov.rw/index.php?option=com_content&task=view&id=36&Itemid=56 [Accessed 21 February 2010].10 http://www.gov.rw/economy/vat.htm [Accessed 4 June 2010].
209
and 30%11. The law also provides for a: 4% annual
turnover tax on ‘intermediate’ business owners; and
dividend withholding tax. Also, depreciation allo-
wances on capital assets were rationalised and
simplified in the Income Tax Law of 2005;
• A new tax code and investment and export
promotion code, as well as a new schedule for
investments under customs were introduced
through legislation. “These laws provide fiscal
incentives to investors…There is a high threshold to
meet this classification – US$250,000 for foreigners
and US$100,000 for local investors” (USAID, 2008);
• Law No. 25 of 2005 was enacted to: improve tax
collection; set-up audit procedures, and a tax
appeals process; and introduce speedy sanctions
and penalties for tax evasion; and
• Law No. 26 of 2006 was passed “determining and
establishing consumption tax on some imported
and locally manufactured products [and] provide
penalties to taxpayers [who] fail to observe the
required provisions”12– in other words excise duties.
Soft and alcoholic drinks, cigarettes, telephone
communication, fuel, and vehicles are all subject to
varying excise duty rates.
After a lull of another 4-5 years, the following tax
policies were introduced:
• Rwanda became a signatory to the EAC Customs
Union protocol in July 2009. The Protocol is
enshrined into the East African Community Cus-
toms Management Act of 2004. It establishes com-
mon external tariffs (CETs), eliminating internal tariffs;
• Tax incentives for liquefied petroleum gas and
energy saving devises. The policy objective is to
make these devises more affordable in order to
deepen penetration of their use by households and
industries. GoR estimates that this policy will result
in a temporary revenue loss of Rwf 300 million;
• The removal of the sugar surcharge in Law No. 71
of 2008. This surcharge was removed in tandem
with the provisions of the EAC Customs Union,
leading to an estimated revenue loss of Rwf2.2
billion per annum;
• A reversal of the VAT charge on transport. This was
a tax on foreign trucks, transporting goods in and
out of Rwanda. It was introduced to ensure the
competitiveness of Rwandan transporters.
However, research has shown that the current
capacity of Rwandan transporters is insufficient to
satisfy demand. Furthermore, this tax was applied
to transporters from Uganda, Tanzania and Kenya,
which increased the comparative cost of doing
business in Rwanda. Therefore, the Government
reversed it, although about Rwf370 million revenue
per annum will be lost; and
• A specific-value fuel tax replaced the flexible
ad-valorem levy. This policy removed an implicit
subsidy on fuel pump prices, and an intervention
aimed at keeping pump prices stable. Also, the
change in tax policy was due to the desire to align
Rwanda’s tax system with EAC practices. This
entailed a shift from a flexible ad-valorem taxation
rate to a specific tax set at a nominal Rwandan
Franc value per litre. A key benefit of the new policy
is that the Government can have guaranteed
revenue per litre sold, which is independent of the
international oil price (GoR, 2009).
Institutional changes
The establishment of the RRA as an autonomous
agency in 1997, coupled with the wide-ranging policy
and legislative measures effected since 2001, has gone
a long way to transforming and modernising the insti-
Domestic Resource Mobilisation for Poverty Reduction in East Africa: Lessons for Tax Policy and Administration
11 http://www.rra.gov.rw/rra_article256.html [Accessed 16 April 2010].12 http://www.rra.gov.rw/rra_article252.html [Accessed 16 April 2010].
210
tutional environment for DRM in the country. RRA en-
joys strong political support for both its mandate and
autonomy. Government has provided an ultra-modern
building for RRA, which it shares with the National
Electoral Commission and the Auditor General. RRA is
allowed to retain 3% to 3.5% of its total revenue col-
lection to meet its administrative costs. The actual bud-
get is determined by the Board of Directors and
approved by the Minister of MINECOFIN.
The RRA staff have been completely delinked from the
civil service. They are better remunerated than civil
servants, and their compensation includes a perfor-
mance bonus of 5% of total revenue collected in ex-
cess of the target agreed with MINECOFIN. So far, each
staff member has regularly received it in three or four
instalments every year. The bonus is equal to 80% to
100% of individual staff salaries. This ratio is generally
higher for junior staff and lower for the senior. It is consi-
dered to be a critical element of staff compensation be-
cause, according to RRA staff, it ensures retention of
staff, and reduces any temptation on their part to re-
sort to corrupt practices.
More significantly, RRA has the full mandate for tax
administration. Direct strategic leadership and oversight
of the operations and performance of the authority is
exercised by a Board of Directors comprising: a Chair-
man appointed by the Prime Minister with the approval
of the Cabinet; a Vice-Chairperson who is the Perma-
nent Secretary (PS), MINECOFIN; Governor of the
National Bank of Rwanda (BNR); three professionals
from the private sector; the PS, Ministry of Trade and
Industry; and the PS, Ministry of Public Service and
Labour. The chief executive (Commissioner General)
and his/her deputy are appointed by the Cabinet. The
Commissioner General, like the Chairman of the Board,
is required to sign a performance contract with the
Minister. Under the contract, both officers are required
to submit quarterly performance reports to the Minister.
The role and mandate for policy-making and progres-
sing of legislative measures for DRM remain with the
MINECOFIN.
Structural reforms in RRA started in earnest in 2003.
Until then, the tax administration was organised on the
basis of tax categories, (i.e., Income tax and VAT
departments). In that year, the Domestic Taxes Depart-
ment (DTD) was established to further improve tax
administration.
Today, the RRA has offices in all the five provincial
headquarters, and in 11 out the 30 districts. In addi-
tion, it operates 32 customs offices and eight border
posts, and employs 875 staff, most of whom are
based at RRA’s headquarters. At headquarters, the au-
thority has two main operational departments:
• The Customs and Excise Department (CED): Its
mission is to contribute to the achievement of RRA
objectives by maximising the collection of all reve-
nues due on imports, at minimum cost; and to
facilitate trade through providing a responsive and
efficient service to stakeholders. The department
works to ensure that all legally chargeable revenues
are paid through effective application of the relevant
laws. Specifically, CED is mandated to facilitate both
international and national trade so as to support
local and foreign investment, while ensuring that
hazardous and contraband material/goods do not
enter the country;
• The DTD was established in order to create a
one-stop, efficient and customer-oriented tax office.
The basic objective is to increase and coordinate
control over the largest taxpayers and improve large
taxpayers’ compliance and revenue yield to the
government. The DTD is comprised of two offices -
the Large Taxpayers’ Office (LTO) and Small and
Medium Taxpayers’ Office (SMTO). The LTO
accounts for over 50% of total RRA revenue col-
lections. In July 2009, RRA assumed responsibility
Domestic Resource Mobilisation for Poverty Reduction in East Africa: Lessons for Tax Policy and Administration
211
for the audit, collection and enforcement of social
security contributions from employers. The dis-
charge of this function by RRA commenced in July
2010.
In addition to the two main departments, RRA has the
following supporting departments: Revenue Protection
Department (RPD); Quality Assurance; Taxpayer
Services; Planning and Research; Legal and Board
Secretariat; Human Resources and Administration;
Information Technology; Finance Department; and RRA
Training Centre.
It is noteworthy that fraud prevention and investigation
support functions and activities at RRA are carried out
by the RPD outside the core operations of the authority.
The focus is on cases of complex tax fraud. The
department’s initiatives and activities respond to either
the results of its risk research and analysis, or cases of
suspected fraud identified by the DTD and CED, or to
its “intelligence agents” (informers). Informers are paid
10% of the revenue collected/recovered on any case
they report on.
Prior to the establishment of RRA, fraud prevention and
investigation functions were handled purely as “military
surveillance” and were carried out under MINECOFIN’s
Audit department. Then, all staff were seconded from the
armed forces but they were not under the command of
MINECOFIN. Following the establishment of the RRA,
armed forces members seconded to the fraud preven-
tion unit are accountable to the RRA management.
Changes in administrative
systems
Since its establishment, RRA’s modernisation and
development of its administrative systems have been
guided by strategic planning. This planning has recently
been elevated to a state-of-the art structure through
adoption of a balanced score card. The strategic vision
of RRA is “to become a world class efficient and
modern revenue agency, fully financing national needs.
The current plan, which has been prepared with a
focus on the integration of Rwanda into the EAC, com-
prises 34 strategic objectives, and includes the follo-
wing key targets:
• Assume the collection and audit of social security
contributions by January 2010—RRA started col-
lecting these contributions in July 2010;
• Support the Government to widen the tax base
with a target to achieve tax revenue collections of
15% of GDP by June 2010 – with a long-term goal
of 18%;
• Implement an anti-smuggling strategy, especially
in the area of evasion of customs and excise du-
ties;
• Substantially increase staff productivity, in terms of
revenue per employee, and improvement in the
overall cost-of-collection ratio;
• Strengthen RRA’s presence in the regions and
computerise all regional offices. Also, provide a 24/7
service at the border posts;
• Obtain the International Standards Organisation
(ISO) 9001 certification by 2010.
Modernisation of administrative systems has been at
the core of the changes pursued by RRA since it was
established. In 2004, RRA commenced with the mo-
dernisation of its revenue collection systems. Compu-
terisation focused on piloting systems with large
taxpayers. The initiative covered the implementation of:
• The Standardized Integrated Government Tax Admi-
nistration Systems (SIGTAS) in DTD. SIGTAS is a
Domestic Resource Mobilisation for Poverty Reduction in East Africa: Lessons for Tax Policy and Administration
212

business analysis software introduced in 2003. It sup-
ports data management for each taxpayer, and faci-
litates tax returns processing, enforcement and audit;
• Automated System for Customs Data ++ (ASY-
CUDA++) for customs operations developed by the
United Nations Conference on Trade and Develop-
ment (UNCTAD). ASYCUDA allows for direct trader
input so that importers can lodge declarations from
their bases, and to minimise the build up of docu-
ments;
• PEODESY for human resources management and
an enterprise resource planning system, Sage-Pas-
tel Evolution for financial management;
• ‘I.D.E.A’ software for taxpayer audit purposes.
According to key informants, RRA has a compara-
tively strict and punitive regime for enforcing tax
collection from both large and small taxpayers,
when the latter have been identified;
• A Revenue Authorities Digital Data Exchange (RAD-
DEX) system – which has been jointly developed by
the revenue authorities of East Africa to support
coor- dinated management of transit of goods; and
• E-doc for internal correspondences and a
“one-to-one” laptop project for RRA staff.
The end-stage in the modernisation process will be the in-
troduction of electronic filing (eFiling). However, according
to RRA management, 80% of the computerisation of the
large taxpayers’ processes and systems is complete. The
remaining and planned areas of modernisation include:
• eFiling-- preparations for which started in early
2010, and should be complete by 2011;
• Electronic tax registers – funds for this initiative have
not yet been identified; and
• Social security funds collections, which commen-
ced in July 2010.
Fiscal decentralisation and
taxation by local governments
Rwanda’s National Decentralisation Policy, officially
adopted in May 2000, sets out a new course of
citizen participation through elected organs at the local
level. Territorially, the subnational government structure
of Rwanda is unlike its neighbours in East Africa: the
country is divided into 30 districts, plus the City of Ki-
gali. The district level is led by elected District Coun-
cillors and forms the main platform for
subnational service delivery. Over the past 10 years,
districts have been accorded a greater role for
service delivery across all sectors. It is the Govern-
ment’s intention for sub-district Secteurs (of which
there are 416) to increasingly become the nodes for
subnational public service delivery. The Secteurs will en-
hance service delivery by assisting the district leader-
ship in identifying, coordinating, and implementing
development plans and programmes.
Although Rwanda faces the same fiscal decentralisa-
tion challenges as others in Africa, the social context
for decentralisation reform in the country provides a
degree of vibrancy and innovation in its reform efforts
that set it apart from other countries in the region. The
goal of the Government’s Fiscal and Financial Decen-
tralisation Policy (2006) is not only to pursue efficiency
in the provision of services at the local level, but also
sustainable development, economic growth and
poverty reduction (Republic of Rwanda 2006).
The Law on the Organization and Functioning of the
District (2006) assigns local governments in Rwanda a
series of tax and non-tax revenue sources. The main
local tax sources include the property tax, trading
license tax, and rental income tax, which were formerly
Domestic Resource Mobilisation for Poverty Reduction in East Africa: Lessons for Tax Policy and Administration
213
collected by the central government and subsequently
devolved to the local level. While local governments
have a degree of discretion in determining tax rates,
they are not permitted to create new taxes or define the
tax base for local revenue sources. This ensures coor-
dinated implementation of tax policy and less distor-
tion/ disruption of economic activity.
Thus, local governments are funded by a combination
of conditional and unconditional grants, as well as by an
assortment of local revenue sources. Between 20% and
25% of all public expenditures take place at the subna-
tional level; this is similar to the share of the budget pro-
vided to the local government level in
Tanzania, but below the level in Uganda. In contrast to
either Uganda or Tanzania, local governments in Rwanda
contribute a larger share in local resources through own
source revenues (see Annex 6.3: Tables 15 and 16).
A 2004 assessment of alternative local revenue sources
identifies numerous unexploited local user fees and
charges, as well as public-private partnerships that
could generate revenue benefits at the local govern-
ment level (ARD, 2004). However, concern has been
raised about the capacity of local governments to en-
gage in substantial broad-based revenue mobilisation
(Tumukunde, Kiessel, and Khawar, 2008). Tumukunde
et.al also observed numerous innovative community-
based local revenue generation initiatives, whereby
community contributions were linked closely to impro-
vements in public service delivery.
Reforms sequencing,
implementation and results
The history of tax reforms in Rwanda is comparatively
short. From a sequential perspective, six distinct, albeit
short, phases of reforms’ implementation can be
identified:
• First : institutional reforms and capacity building,
which correspond to the period beginning with the
establishment of RRA in 1997 and the subsequent
three years;
• Second : widening the tax base. The hallmark
development in this phase was introduction of VAT
in 2001;
• Third : streamlining the tax regime and administra-
tion. This was effected by widening the mandate of
RRA to collect non-tax revenues, and rationalisa-
tion of income tax rates in 2003 and 2005
respectively;
• Fourth : aligning the tax system with development
policy priorities through introduction of a new tax,
investment and export promotion legislation and tax
code in 2005;
• Fifth : strengthening the compliance enforcement
regime; by enacting Law No. 25 of 2005 to cater
for, among other measures, tax audits, appeals and
penalties for evasion; and introducing penalties in
2006 for taxpayers who fail to comply with provi-
sions for consumption taxes; and
• Sixth : harmonising Rwanda’s tax regime and
administration with that of the EAC (in 2009 and
2010).
In a nutshell, the Rwanda tax system has undergone
several reforms since 2001. Nonetheless, the reforms
have been systematic and sequenced.
On the whole, RRA and, thereby DRM efforts of GoR
are a success story. Tax revenue collected has consi-
derably improved over the past decade, from 9.7% of
GDP in 2000 to a projected 13.8% in 2010. The aim is
for this ratio to grow at 0.2% or higher annually in the
medium-to-long term.
Domestic Resource Mobilisation for Poverty Reduction in East Africa: Lessons for Tax Policy and Administration
214
While the tax revenue to GDP ratio shows a comparatively
modest performance, there are independent
indicators that RRA has, over the decade, made
commendably steady progress in capacity development.
One such indicator is the uniquely sustained
support that RRA has received from DFID over the years.
RRA is currently benefiting from the sixth successive DFID
technical assistance and other capacity building support.
At the end of each tranche, a comprehensive evaluation
has been undertaken, and it is on the basis of the results
of such evaluation that subsequent support has been pro-
vided. This support has been broad-based and flexible. It
has been driven by RRA’s strategic plans and reflects the
priorities of MINECOFIN’s and RRA top management, and
consistent with the Economic Development and Poverty
Reduction Strategy. By 2005, DFID was funding as much
as 34% of RRA’s total budget. But it was reduced to
about 10% in 2009.
RRA has also made noteworthy strides in modernisa-
tion and efficiency improvements in its tax administra-
tion system. Highlights include:
• The ongoing major initiative to widen the tax base
by establishing the Small and Medium Taxpayers
Office (SMTO) and embarking on implementation of
the block management system (BMS) to facilitate
“the registration of more taxpayers through educa-
tion, close monitoring and audit from their proxi-
mity” (Kiregu, 2009). In 2007, RRA reports that the
SMTO had registered 9,662 taxpayers, undertook
455 audits (compared to 480 planned) and raised
Rwf3.2 billion (about US$5.4 million) in tax reve-
nues. However, “the average compliance rate in
SMTO for returns filing during 2008 was about
49%. Filing compliance for SMTO remains below
the average and requires more efforts" (RRA, 2008);
• RRA is also credited with a comparatively efficient sys-
tem for the administration and payment of tax refunds.
There is timely auditing of refund claims. Also, unlike
its counterparts in some EAC countries, RRA has the
full mandate to administer the refunds. In other coun-
tries, such as Kenya, the refunds require approval of
their ministries of finance, and sometimes specific
budgetary allocations. In the latter cases, payment of
refunds sometimes takes more than a year after vali-
dation by the revenue authority. In Rwanda, refunds
are usually paid within 30 days for claims below cer-
tain thresholds (see Section on “Tax administration
performance benchmarks”);
• Compliance levels have significantly improved with
as many as 97% compliant large taxpayers (who
contribute approximately 75% of total domestic
taxes 13). Compliance rates are lower in the medium
and small taxpayer category;
• Improved administration of collection and cash
management - Collection of revenues is mainly
undertaken by commercial banks. Over 90% of
revenue is collected by banks;
• In 2010, Rwanda and Uganda launched a 24/7
one-stop border service at Gatuna. Rwanda’s PS
in the Ministry of East African Community Affairs is
cited as having said, “The one-stop border point
shall benefit the private sector by providing quality
and quick service delivery of goods and services
across EAC” (Gahene, 2010);
• RRA has contributed to a dramatic improvement in
Rwanda’s ranking in the World Bank's 2010 global
“Doing Business Index” by spearheading the intro-
duction of a number of tax legislation reforms.
Rwanda’s ranking rose to 67 in the latest ranking
(2010) from 143 in 200914; and
• RRA became ISO 9001 certified in 2009. “Accor
ding to RRA Commissioner General, Mary Baine,
Domestic Resource Mobilisation for Poverty Reduction in East Africa: Lessons for Tax Policy and Administration
13 The large taxpayer segment constitutes less than 5% of the total tax paying community (Musoni, 2009).14 http://www.devpartners.gov.rw/index.php?option=com_content&task=view&id=36&Itemid=56 [Accessed 21 February 2010].
215

Domestic Resource Mobilisation for Poverty Reduction in East Africa: Lessons for Tax Policy and Administration
15 http://www.rra.gov.rw/rra_article521.html [Accessed 18 April 2010].
216
ISO certification demonstrates RRA’s ability to enhance
customer satisfaction through effective application of
quality systems”15.
On the other hand, there are suggestions that Rwanda
could have done significantly better in tax revenue genera-
tion if it did not extend the kind of tax incentives and
exemptions it introduced from 2005 aimed at attracting fo-
reign investors to the country. In this regard, for example,
the IMF (2007a) observed that tax incentives may be coun-
terproductive or ineffective because: (i) they distort the
investment climate and discriminate against invest-
ments by domestic and/or small and medium enter-
prises; (ii) there is evidence that such other factors
as infrastructure, property and commercial legal sys-
tem, efficiency and integrity of the public service are
ranked higher by investors in the choice of their in-
vestment locations; and (iii) what the investors’ host
country fails to tax ends up being taxed in the coun-
try of their domicile. In other words, the tax policies
of the investor’s country of origin may cancel out the
presumed local tax advantage.

Domestic revenue
Domestic Resource Mobilisation for Poverty Reduction in East Africa: Lessons for Tax Policy and Administration
16 http://www.rra.gov.rw/rra_article521.html [Accessed 18 April 2010].17 http://www.heritage.org/index/Country/Rwanda [Accessed 18 April 2010].
217
Non-tax revenue Tax revenue
10%
0%
16%
14%
12%
8%
6%
4%
2%
200820071993
1994 19951996
19971998
19992000
20012002
20032004
20052006
Figure 6.2: Tax and non-tax revenue contribution as a percentage of GDP (1993 to 2008)
Source: Various IMF staff reports. Also see Annex C: Table 14
Domestic revenue
performance trends
Rwanda’s total domestic revenue as a percentage of
GDP rose from 8.4% in 1993 to 14.2% in 2008 (see
Figure 6.2). In the year that the genocide took place
(1994), however, total domestic resources as a per-
centage of GDP fell to 3.6%. Between 1993 and 2008,
on average the split between tax and non-tax revenues
was 93.3% to 6.3%. According to the IMF (2009c), tax
growth has ranged between 0.25% and 0.3% of GDP
every year from 1997. Furthermore, the mission team
indicates that in line with GoR’s aspirations contained
in Vision 2020 to be less dependent on IDOs, “tax ef-
fort needs to be scaled up”16. It is also noteworthy that
when GoR embarked on tax reforms in 1998, it aimed
to increase “the revenue-to-GDP ratio by 0.5% p.a.”
(IMF, 2000).
There are three main categories of domestic revenue
sources: taxes on goods and services (comprising VAT
and excise duty); direct taxes (including PAYE, corpo-
rate income tax, personal income tax and tax imputed
on turnover); and tax on international trade. As shown
in Fig. 6.2, taxes on goods and services have formed
the largest proportion of total domestic revenues – at
about 48% of the total tax revenue (see also Annex 6.3:
Table 6). Since 2001, and with the exception of 2004,
contribution to total taxes from direct taxes has been
on a steady rise – in 2008, the share of direct taxes
peaked at 37.5%. The share of taxes on international
trade in total tax revenues has steadily decreased from
a high of 41% in 1995 to just over 10% in recent years.
This reduction is explained by an initial reduction in im-
port duty rates – “with the maximum rate declining from
60% to 40%” (IMF, 2000). Furthermore, “Rwanda’s
weighted average tariff rate was 11.3% in 2008”17.
A key reason for comparative underperformance of
domestic revenue in Rwanda is that whilst agriculture is
a significant contributor to GDP, farmers and other
traders operate on an informal basis and are largely not
captured within the tax net. “According to the Private
Sector Federation [PSF], about 0.3% of taxpayers
contribute 48% of Rwanda’s tax revenue” (Godbout,
2009). The IMF (2009c) estimates that between 2002
and 2009, the informal sector contributed an average of
6.25% of GDP. The IMF (2009c) also suggests that by
formalising such enterprises and monetising the
economy, there would be huge pay-offs in terms of
increased levels of DRM18. Therefore, RRA’s “onus
should be on widening the tax net to the informal
sector and ensuring that tax laws are applied evenly
and fairly” (IMF, 2007b).
In recent years, there have been continuous efforts by
the RRA to extend its reach of the informal sector, and
small and medium enterprises (SMEs). In 2008, for
example, RRA pronounced changes in the system of
taxing commercial vehicles. The change was aimed at
bringing fairness in tax collection, whereby taxes on a
vehicle would be paid according to its load capacity by
tonnage or number of passengers. Also, in 2009, the
Minister of Finance and Economic Planning, talking of
the potential of the informal sector and SMEs to
contribute to revenue, is quoted to have stated that,
“we are closing in on this very large and yet elusive in-
formal sector. The large taxpayer segment constitutes
less than 5% of the total tax-paying community but
from which over 75% of the total tax revenues are col-
lected” (Musoni, 2009).
Tax administration performance
benchmarks
Performance efficiency
Cost of collection. Between 2003/04 and 2007/08,
RRA’s operating costs (including capital expenditure) as a
percentage of total revenue collected averaged at 3% (see
Annex 6.3: Table 2). The IMF rates this result as compa-
ratively higher than what is considered typical for modern
revenue administrations, which would be less than 2%
(IMF, 2007a). In particular, in the same IMF
review, Rwanda’s collection costs as percentage of total
tax revenues were observed to be higher than that of
other countries in the region – Kenya (1.7%), Malawi
(2.8%), Tanzania (2.8%) and Uganda (2.8%). Furthermore,
during the four-year period to 2007/08, RRA’s tax admi-
nistrative costs grew at an average annual rate of 27%.
Organisational structure. RRA is organised along
functional lines. It established a LTO in 2006. In 2010,
the LTO served 307 large taxpayers. They comprise in-
dividuals, corporations,, government bodies and mi-
nistries, who meet one or more of the following criteria:
(i) their activities are complex and turnover exceeds
Rwf200 million p.a.; (ii) they pay excise duties; (iii) they
are registered with RDB and have invested over
Rwf300 million; (iv) they are gauged to have growth po-
tential; and their PAYE costs exceed Rwf600 million
p.a.19. In the same year, the SMTO was established,
and by 2007, had 9,662 registered
taxpayers who contributed 16% of total revenue col-
lections (RRA, 2008).
Ease of paying taxes. Rwanda has the best rating
among the EAC countries in terms of the World Bank’s
Doing Business Ranking, and with respect to ease of
paying taxes – ranking 59th out of 183 countries in
2010. However, Rwanda dropped one place in 2009 to
58. According to the World Bank’s 2010 Paying Taxes
report, a company is required to make 34 payments a
year, which are below the SSA average of 37.7 p.a., but
above the OCED average of 12.8.
Tax arrears. Information on tax arrears was only avai-
lable for 2006/07 and 2007/08. Tax arrears as a per-
centage of total tax collections in 2007/08 amounted
to 16.4%. According to the IMF (2007a), “significant
progress was made by the RRA in 2006 to reduce the
stock of tax arrears, particularly for corporate profits tax
where Rwf17,334 million was collected during the year.
The number of debtors at the end of 2006 was less
than 400, with around Rwf8,500 million outstanding
(i.e., 4.4% of total 2006 collections)”.
Domestic Resource Mobilisation for Poverty Reduction in East Africa: Lessons for Tax Policy and Administration
18 http://www.devpartners.gov.rw/index.php?option=com_content&task=view&id=36&Itemid=56 [Accessed 21 February 2010].19 International Tax Dialogue Survey – 2009.
218

VAT payment system. In 2008, RRA streamlined the
VAT refund process. It set various monetary refund
limits in which small (below Rwf 50,000), medium
(below Rwf 100,000) and large (below Rwf200,000)
taxpayers can automatically deduct refunds from their
next month’s VAT return. In other words, VAT refunds
for eligible amounts are made within 30 days. Refunds
above the prescribed thresholds are subject to further
conditions. They include the need: to have deposited a
payment at the Treasury; for a taxpayer to submit
honest and accurate returns; and for an audit over a
prescribed threshold.
Tax compliance. Rwanda has a low VAT gross
compliance ratio (VATGCR) of 30.30 in comparison to
World and SSA averages of 65.48 and 38.45 respecti-
vely20. Measures from the same source compute
corporate income tax revenue productivity (CITPROD)
and personal income tax revenue productivity
(PITPROD) of 0.06 and 0.09. They indicate that
Rwanda uses the taxes less efficiently in generating re-
venue than World averages of 0.13 and 0.14 for CIT-
PROD and PITPROD respectively.
Compliance by large taxpayers is generally high
because the LTO closely monitors each of them. There
is continuous audit of large taxpayers whose monthly
dues of VAT, PAYE and withholding tax are audited and
agreed before payment. The audits are also
comparatively quick but thorough. To this end, RRA has
its audit staff literally camped out at taxpayers’ pre-
mises. However, compliance by others remains weak.
According to the IMF (2007a), about a third of corpo-
rate and non-corporate tax returns were filed late, and
15% of VAT payers failed to file returns on time.
Allocative efficiency
In 2006, a review of tax incentives highlighted “revenue
losses of about 3% of GDP” (IMF, 2006). Furthermore, IMF
(2007a) raised concerns about potential allocative ineffi-
Domestic Resource Mobilisation for Poverty Reduction in East Africa: Lessons for Tax Policy and Administration
20 International Tax Dialogue Survey – 2009.
219
Box 6.1: The IMF’s rationale for avoiding tax holidays
“Tax holidays as a policy instrument should be avoided for three main reasons. First, such instruments are in direct
conflict with goals to increase tax revenues and therefore place greater pressure on tax-base broadening in the
medium and small taxpayer segments where greater effort is required for much lower yields. Second, tax is generally
a second order issue to investors eclipsed by such factors as the rule of law, a working judicial system, security of
property ownership, good infrastructure and as little bureaucracy in doing business as possible. Third, and closely
connected to the second point (in the sense that tax is not a factor) is that most investor countries’ tax systems
operate on a residence basis, and hence perversely, where taxable income is subject to no tax in Rwanda as a result
of a tax holiday, the businesses’ country of residence acquires a taxing right to this income instead…It is important for
the RRA to ensure that it adequately records revenue forgone by ensuring that businesses subject to tax holidays file
tax returns, like any other business, so that the quantum of lost revenues can be reported to the ministry of finance.
Equally important is the need to ensure that investors already established in Rwanda do not have access to this re-
gime and that businesses cannot qualify for renewed tax holidays for substantially the same investment through
restructured business entities or convoluted schemes”.
Source: IMF (2007a)

ciencies arising from use of tax holidays and other incen-
tives to attract foreign investors. The same review obser-
ved that for Rwanda they should be avoided (see Box 6.1).
Performance equity
Rwanda has a regressive income tax regime by any
standards. The 2009 personal income tax rates show
that the minimum monthly taxable income attracting the
highest PAYE rate of 30% is as low as RwF100,000
(equivalent to US$175). This is about a third of thres-
hold levels for Kenya (US$523) and Tanzania (US$542).
Yet, even the latter two countries fall in the category of
the majority of African countries that have been descri-
bed as having regressive tax rates on income. For ins-
tance, thresholds for the maximum PIT rate in the
Republic of South Africa and Botswana are about
US$1,318 and 1,515 respectively (Institute of Econo-
mic Affairs, 2010).
However, as with other countries in the region,
Rwanda’s VAT system does provide for tax conces-
sions for certain basic goods and services consumed
by poor households. Similarly, excise and import duties
are generally levied on luxury items or goods, which
contribute to negative public health externalities.
In the case of corporate business income, the World
Bank’s 2010 Paying Taxes report indicates that the
‘total tax rate’ as a percentage of profit of 31.3% is
significantly lower than the OECD average of 44.5%,
and is lower than the SSA average of 67.5%. However,
RRA is reputedly tough with taxpayers. It has forced the
closure of businesses where tax evasion went on for a
long time. Furthermore, we understand that there have
been many instances in the past, when MINECOFIN
has had to restrain the RRA from taking coercive
action against delinquent taxpayers.
Another indicator of the tax burden has to do with the
amount of time taken by taxpayers to comply with
major types of taxes. In this regard, the 2010 World
Bank paying taxes survey indicates that the time taken
by companies in Rwanda to comply with major taxes is
160 hours, which is much lower than the OECD and
SSA averages of 194.1 hours and 306.0 hours
respectively.
Performance effectiveness
RRA’s performance effectiveness is modest in terms of
tax effort and tax gap (see Annex 6.3: Table 13). At
61.4% in 2008, Rwanda’s tax effort was lower than that
in Tanzania (71.6%), but higher than in 2001 (51.2%).
However, Rwanda’s tax gap was 9.9% in 2005, and
higher than that of Kenya, Tanzania and Uganda at
2.0%, 5.9% and 7.8% respectively during the same
period.
At an operational level, RRA’s management considers
that it has been successful in establishing a good rela-
tionship with the main taxpayers. It has enabled regu-
lar dialogue with representatives of the private sector.
There is a quarterly Tax Issues Forum, which is jointly
chaired by the RRA Commissioner General and the
Chief Executive of the PSF. Participants comprise tax-
payers and senior staff of RRA. The Forum has a stan-
ding technical committee with representation from both
taxpayers and RRA staff, which facilitates collaborative
dialogue and analysis of the issues prior to the quar-
terly forum. In addition, RRA welcomes taxpayer feed-
back through an online customer satisfaction
questionnaire.
However, there is an independent perspective that RRA
has not been responsive to the specific needs of small
taxpayers; this sentiment is especially cited in terms of
outreach and education. From a study on the informal
sector in Rwanda, 53% respondents mentioned tax as
the most troublesome regulation. In any case, it is not
easy to reach many of the SMEs because they are
rural-based and thus have limited access to urban in-
Domestic Resource Mobilisation for Poverty Reduction in East Africa: Lessons for Tax Policy and Administration
220
frastructure, markets and technology (Hategeka, 2009).
PSF members have previously complained that RRA
does not pay attention to small businesses, which ac-
count for over 80% of employment (Torero et al, 2006).
However, a study by the federation also confirmed the
difficulties in bringing the SMEs and other informal sec-
tor entities into the tax bracket. It was also noted that,
in Rwanda, as in most African countries, most SMEs
are run by illiterate and semi-literate owners/families.
Summary of overall trends
Rwanda has a relatively short history of policy, institu-
tional, legislative and capacity development, and
reforms, which began after the 1994 genocide. The
implementation of changes has been rapid but
systematic and quite successful. Rwanda’s total
domestic revenue as a percentage of GDP rose
steadily from 9.7% in 2000 to 14.2% in 2008. The ratio
is projected at a lower 13.8% in 2010, but this is gene-
rally explained by failure of tax revenue growth to keep
pace with the high real GDP growth rate, as
discussed in the Section on “Political economy and fis-
cal legacies”.
Although the tax to GDP ratio for Rwanda is signifi-
cantly lower than that of, for example Kenya, Tanza-
nia and South Africa, target growth rate for this ratio
is also fairly low, at about 0.2 annual percentage
points. This comparative underperformance of do-
mestic revenue and conservative target growth rate
is explained by the fact that the economy remains
agriculture-based, with dominance of smallholding
farmers. The other significant potential pool of tax-
payers constitutes of small-time traders, who largely
operate informally. Such farmers and traders are not
easily captured into the tax net. However, RRA has
an aggressive programme to draw several of the in-
formal market participants into the tax net through
implementation of the BMS.
Domestic Resource Mobilisation for Poverty Reduction in East Africa: Lessons for Tax Policy and Administration
221

Challenges and issues
Introduction
At the end of the previous section, it was pointed out
that the structure of the Rwandan economy today
(i.e., preponderance of smallholding farmers and in-
formal traders) poses a near-binding constraint to
rapid enhancement in the overall tax revenue base.
Therefore, in the short-to-medium term, significant
increase in real tax revenue growth is more likely to
come from measures to raise and sustain com-
pliance by existing taxpayers and improve adminis-
tration efficiency. With a long-term perspective,
efforts to widen the tax net will also continue to be
implemented. Nonetheless, on both prongs, there
will be challenges and issues to be ddressed. Signi-
ficant challenges are highlighted below.
Achieving a cost-effective
strategy to widen the tax net
Widening the tax net entails capturing small and
micro enterprises that are largely in the informal sec-
tor, and getting them to pay taxes. This will not be
easy. As a survey by PSF reports, “small and micro
business operators in Rwanda generally have low li-
teracy and numerical skills, and have limited unders-
tanding of both the tax system and business record
keeping...and understanding of tax matters is weak”
(Hategeka, 2009). Furthermore, it can be costly to
apply conventional approaches such as audits to
bring these enterprises into the tax net, and to en-
force compliance. Therefore, RRA needs to develop
strategy, knowledge and other capacity to success-
fully and cost-effectively implement alternative inter-
ventions, for instance as would be the case with a
risk-based compliance management approach. The
approach to adopt should be considered on a case-
by-case basis. In particular, RRA has done well to
study the experiences of Tanzania in the implemen-
tation of the BMS. It may also benefit from Kenya’s
experiences, for instance, with electronic tax regis-
ters for VAT. Moreover, relevant taxpayer education
will remain a critical feature of whatever strategy or
modality is identified or designed.
Rationalising the collection
of central and local government
taxes
In line with GoR’s decentralisation policy, the man-
date for collecting taxes from property and rental in-
come lies with the local government authorities
(Kigali City Council and districts councils). However,
experiences from countries such as Kenya and
South Africa suggest that RRA could be more effec-
tive than local governments in collecting property
taxes and taxes on rental income because of its ex-
pertise, resources and institutional arrangements.
Also, in some countries such as Tanzania, the reve-
nue authority collects property taxes on behalf of
local government authorities. There is a distinct pros-
pect that in some districts the local elites will collude
with tax staff in councils to evade taxes. There is also
a risk that some councils will not handle taxpayers
with any courtesy. Nor are the councils likely to un-
dertake any taxpayer education. Furthermore, given
that local governments have been assigned a range
of taxes (i.e., property tax, tax on rental income, fees
and levies on quarries, markets, etc), there is a risk
that the need to file taxes to multiple tax collection
agencies could increase taxpayer compliance costs,
and potentially increase the temptation to avoid and
evade taxes. Therefore, the challenge to rationalise
the tax collection functions between RRA and local
governments can be anticipated.
Domestic Resource Mobilisation for Poverty Reduction in East Africa: Lessons for Tax Policy and Administration
222

Developing and maintaining
capacity for tax policy
management
One important consideration in the establishment of RRA
and the transfer of the tax administration function out of
MINECOFIN was the imperative to minimise red tape, low
staff morale and poor performance in the discharge of
functions. Under a quasi-autonomous revenue agency:
processes and procedures are restructured and re-engi-
neered to eliminate resource- and time-wasting routines;
salary and incentive frameworks are put in place so as to
attract, retain and motivate revenue collection officers;
and enhance their integrity. On the basis of the latter, subs-
tantial and reliable institutional and human resources ca-
pacity for rapid growth and efficient revenue collection
could be developed.
There is still another very important factor that should
have underscored the creation of RRA out of the reve-
nue collection departments of MINECOFIN. It concerns
the case for separating tax policy from administration
(DFID, 2008a).The institutional and organisational de-
velopments are in the right direction. However, it ap-
pears that the tax policy function is much weaker
relative to tax administration. This, to a significant ex-
tent, is explained by the fact that the organisation and
staff in tax policy remain in thebureaucratic and poor
incentive environment of MINECOFIN. Therefore, only
a strategic and deliberate effort to build capacity for tax
policy functions will ensure that the necessary capacity
is installed.
Building and sustaining mana-
gement capacity in RRA
Building and sustaining adequate capacity, especially
technical and professional skills, will remain a major
challenge to RRA well into the long run. Land (2004)
observed that:
“The RRA is no longer the employer of choice, and is
finding it increasingly difficult to remain competitive in
the labour market. Once the standard bearer for condi-
tions of service, a growing number of private and
quasi-public institutions as well as international
agencies now offer more competitive remuneration
packages. It is therefore becoming more difficult to
attract and retain good personnel. Constrained by
budget ceilings, the RRA will have to work at improving
efficiency so that resources can be freed up to offer
more attractive salaries linked to performance”.
The difficulties entailed in human resources capacity
development and retention is exacerbated by the
proliferation of ICT applications for both core business
processes as well as management support services. The
technologies for these applications keep changing with
short time spans, and the competition for the skills is ever
intense, because the market is not confined to the boun-
daries of Rwanda. It is definitely regional and increasingly
global. In this regard, RRA will need technical assistance
to sustain the modernisation momentum in key areas,
such as: (i) risk management for tax and customs admi-
nistration; (ii) an assessment of SIGTAS and ASYCUDA
++ to support risk management approaches, particularly
automatic profiling of taxpayers; (iii) developing a “super”
green/gold card trader facilitation programme, including
an importer self-assessment instrument and guidelines;
and (iv) developing RRA processes and procedures in rea-
diness to collect social security contributions.
Putting a cap on tax incentives
and exemptions
In the pursuit of the policy goal of making Rwanda a
preferred foreign investment destination, and to attract
particular investors to establish business in Africa, GoR
Domestic Resource Mobilisation for Poverty Reduction in East Africa: Lessons for Tax Policy and Administration
223

has legislated tax incentives (see Sections on “Trends in
the tax system” and “Domestic revenue performance”).
It has also granted tax exemptions to some businesses.
Available data suggests that the impact of these
exemptions and incentives in terms of tax revenues fo-
regone is significant. Moreover, there is a body of know-
ledge that suggests that these incentives are
counter-productive in terms of: (i) distorting the invest-
ment climate and discriminating against investments by
domestic and/or small and medium enterprises; (ii)
there is evidence that such other factors as infrastruc-
ture, property and commercial legal system, efficiency
and integrity of the public service, among others, are
ranked higher by investors in the choice of their
investment locations; and (iii) what the investor’s host
country fails to tax ends up being taxed in country of
the investors’ domicile. In other words, the tax policies
of the investor’s country of origin may cancel out the
presumed local tax advantage. Despite such argu-
ments, however, political leaders may not be easily per-
suaded to grant tax favours in their courting of brand
international investors. This remains a challenge for
Rwanda.
The outcomes and impact of the wide-ranging policy
and capacity development measures that Rwanda in
general, and RRA in particular, have implemented since
its establishment in 1997, are yet to yield the expected
results. Nonetheless, in confronting the challenges of
design and implementation, three major lessons, which
are presented below, are worth sharing.
Domestic Resource Mobilisation for Poverty Reduction in East Africa: Lessons for Tax Policy and Administration
224

Lessons learned
Explicit and strong top political
leadership support matters
Rwanda has gone through a marathon of policy, institu-
tional, legislative and capacity development changes
aimed at achieving rapid growth in tax revenues over the
past decade or so. Many of the key informants to this
study were emphatic in sharing the view that strong
support from the top political leadership, especially the
President, and successive ministers of finance was the
most crucial driver for change. This is corroborated by
Land (2004):
“The RRA was granted a clear and unequivocal man-
date and a strategic role to play within government's
wider strategy of national reconstruction, poverty
reduction and good governance. As the centrepiece of
the country's domestic revenue generation effort, it has
been expected to play a key role in meeting the aspira-
tions of the Rwandan government and its international
partners to reduce dependency on aid and to shift
towards a country-driven transformation process.
Accordingly, from the outset the RRA enjoyed a high
degree of legitimacy and backing from official circles -
there were equally high expectations placed on the
nascent organisation to perform”.
Developing and retaining
effective capacity is a long-term
undertaking
RRA has benefited from strong government as well as
IDO (especially DFID commitment) to provide the
resources needed to rapidly develop its capacity.
Furthermore, the authority’s strategic plans reflect that
there has also been determination to expeditiously
develop capacity, and improve performance on the part
of the top RRA management. Yet, considerable gaps
in capacity persist, even after a decade of consistent
efforts. The IMF (2009b) suggests the priority gaps to
be closed are strengthening audit and
enforcement capacity. It also suggests that manage-
ment support functions such as management of ICT
applications, human resource management and
finances deserve as much attention, especially
because technical and professional staff inthe latter
skills areas are in high demand in the local, regional and
global markets.
Long-term and flexible technical
assistance support enables
rapid and sustained capacity
development
DFID has provided substantial support to the RRA since
1998. As mentioned earlier, by 2003, it was 34% of the
total RRA budget, and for the subsequent four years
ranged between 31% and 20%, before dropping to about
11% in 2008 (DFID, 2008b). While that support is now
being substantially phased out, the following observation
by a DFID independent review mission is noteworthy:
“There is a clear and direct link between DFID’s
support and RRA’s revenue collection performance.
The major share of the funding has been invested in
IT hardware and software, primarily for installation
and the development of SIGTAS and ASYCUDA-- the
Domestic Resource Mobilisation for Poverty Reduction in East Africa: Lessons for Tax Policy and Administration
225

main IT systems-- supporting the improvement of the
operations at the RRA. Furthermore, the spending on
training has strengthened the skills across a broad
range of RRA’s operations. Although DFID’s share of
the total annual funding of the RRA has reduced over
the years, the contribution remains significant in the
context of the non-salary expenditures” (DFID,
2008b).
Domestic Resource Mobilisation for Poverty Reduction in East Africa: Lessons for Tax Policy and Administration
226

Annex 6.1: Key informants
Domestic Resource Mobilisation for Poverty Reduction in East Africa: Lessons for Tax Policy and Administration
228
Charles Lwanga (Mr), Head of Planning and Research, Rwanda Revenue Authority
Christopher Nzenyaremye, Acting Director General for national Budget, Ministry of Finance and Economic Planning
Denis Mukama (Mr), Head of Research, Rwanda Revenue Authority
Eugene Mugnai Torero (Mr), Deputy Commissioner General & Commissioner for Customs Services, Rwanda
Revenue Authority
Francis Nsengimuya (Mr), Acting National Coordinator, Institutional Support Project (ISP), Ministry of Finance and
Economic Planning
Gaudence Uwimana (Ms), Principal Statistics Analyst, Rwanda Revenue Authority
Gerard Nkusi Mukubu (Mr), Director of Taxpayer Services Department, Rwanda Revenue Authority
Jeremy Armon (Mr), Senior Governance Adviser, UK Department for International Development
Michael Minega Sebera (Mr), International Legal and Agreements expert, Ministry of Finance and Economic Planning
Mugo W. Maringa (Mr), Country Manager, Tourism Promotion Services (Rwanda) Limited
Noah Oluoch (Mr), Chief Accountant, Tourism Promotion Services (Rwanda) Limited
Obald Hakizimana (Mr), Head of Macroeconomic Policy, Ministry of Finance and Economic Planning
Pierre Celestin Bumbakare (Mr), Commissioner Domestic Taxes, Rwanda Revenue Authority
Richard Dada (Mr), Deputy Commissioner of Small and Medium Taxpayers Office, Rwanda Revenue Authority
Seth Muhirwa (Mr), Director of Revenue Protection Department, Rwanda Revenue Authority
Domestic Resource Mobilisation for Poverty Reduction in East Africa: Lessons for Tax Policy and Administration
229
ACBF (2004) Reconstruction and Capacity Building in Post Conflict Countries in Africa: A Summary of Lessons
of Experience from Mozambique, Rwanda, Sierra Leone and Uganda. ACBF, 2004. Occasional paper no. 3.
AfDB (2008) Rwanda: 2008-2011 Country Strategy Paper. AfDB Country and Regional Department - East A (OREA),
2008.
AfDB/OECD (2007) African Economic Outlook: Rwanda. AfDB/OECD, 2007.
ARD (2004); Alternative Sources of Revenues For Financial Sustainability: A Case of Local Governments in
Rwanda. USAID/MINALOC, 2004.
Baingana, E. (2007) Rwanda: Fiscal Policy Choices in a Post- Conflict Environment, Presented at the 4th Annual
CABRI Seminar. 6 Dec 2007.
Blenford, A. (2009): Bold Rwanda takes Broadband Leap BBC 21.09/2009, [online].
Brautigam, D.A. (2008) Introduction: Taxation and State Building in Developing Countries. In D.A Brautigam., O-H.
Fjeldstad and M. Moore (eds): Taxation and State Building in Developing Countries. Cambridge University Press:
Cambridge, pp. 1-33.
DFID (2008a): Good Taxes Reduce Poverty in Rwanda, DFID 10/01/2008, [online].
DFID (2008b): Rwanda Revenue Authority Phase VI: Output to Purpose Review. DFID, 2008.
Foreign Investment Advisory Service (2006) Rwanda: Sector Study of the Effective Tax Burden. FIAS/World Bank
2006.
Gahene, A. (2010): 24 Hour One-Stop Border Point Launched at Gatuna. The New Times 21/03/2010, [online].
Godbout, A. (2009): Tax Informal Sector to Increase revenue – expert Rwanda News Agency 29/09/09, online.
GoR (2000): Rwanda Vision 2020. Ministry of Finance and Economic Planning, 2000.
GoR (2006): Rwanda’s Aid Policy - Implementing Change to Maximise the Impact of Aid on Poverty Reduction and
Economic Growth. GoR, 2006.
GoR (2007) 2007: Macro-Economic Performance in Rwanda, Macro Economic Policy Unit 2007. GoR, 2007.
GoR (2009): Budget Framework Paper 2009/10 – 2011/12; Ministry of Finance and Economic Planning. GoR, 2009.
GoR (2009): Taxation Reforms: Past achievements & Plans for the future GoR, 2009.
Gourevitch, P. (1998): We Wish to Inform You that Tomorrow We Will Be Killed with Our Families: Stories From Rwanda
Farrar, Straus and Giroux: New York, 1st edtn.
Hategeka, E.(2009); Knowing the Segment: Particularities of SMEs in Africa, Presentation at the International Tax
Dialogue Conference. Kigali 22nd April 2009.
IMF (2000) Rwanda: Recent Economic Developments. IMF,2000. Report no. 4.
IMF (2004) Rwanda: Select Issues and Statistical Appendix. IMF, 2004. Report no. 04/383.
IMF (2005) Rwanda: Fourth Review Under the Three-Year Arrangement Under the Poverty Reduction and Growth
Facility and Requests for Waiver of Nonobservance of Performance Criteria and for Extension of the
Arrangement—Staff Report. IMF, 2005, Report no. 05/171.
IMF (2006) Rwanda: Sixth Review Under the Three-Year Arrangement Under the Poverty Reduction and Growth
Facility (PRGF), Requests for Waivers of Nonobservance of Performance Criteria, and Request for a New
Three-Year Arrangement Under the PRGF—Staff Report. IMF, 2006. Report no. 06/245.
IMF (2007a) Rwanda: Next Steps in RRA Modernization. Fiscal Affairs Department, 2007.
Annex 6.2: Bibliography
Domestic Resource Mobilisation for Poverty Reduction in East Africa: Lessons for Tax Policy and Administration
230
IMF (2007b) Rwanda: 2006 Article IV Consultation, First Review Under the Three- Year Arrangement Under the
Poverty Reduction and Growth Facility, and Request for Waiver of Non observance of Performance Criteria—Staff
Report. IMF, 2007. Report no. 07/80.
IMF (2009a) Rwanda: 2008 Article IV Consultation, Fifth Review under the Three- Year Arrangement under the Poverty
Reduction and Growth Facility , and Request for Waiver of Non-observance of Performance Criterion - Staff
Report. IMF, 2009. Report no. 09/58.
IMF (2009b) Rwanda: Sixth Review under the Three-Year Arrangement under the Poverty Reduction and Growth
Facility, and Request for Waiver of Non- observance of Performance Criterion - Staff Report. IMF, 2009. Report no.
09/264.
IMF (2009c): Some Observations on Domestic Revenue Mobilization. Presentation made during IMF Staff Visit to
Rwanda, Oct-November 2009.
Institute of Economic Affairs (2010) Alternative Budget 2010/11. IEA, February 2010.
Kagire, E. (2009): Mo Ibrahim Index Misleading; Gov't. The New Times 13/10/2009, [online].
Killick, T. (2005): Promoting a Third Phase in Rwanda Donor Relations: A focus for enhanced co-operation between
the Governments of the Netherlands, Sweden and the United Kingdom and their relations with the Government of
Rwanda. Overseas Development Institute, 2005.
Kiregu, J. (2009): RRA Attributes Superior Performance to High Paye Remittances. The New Times 11/11/2009,
[online].
Kitaoka, K. (2009): People-centred Leadership. MakingItMagazine.net 20/12/2009, [online].
Land, A. (2004): Developing Capacity for Tax Administration: The Rwanda Revenue Authority. ECDPM, 2004.
Discussion Paper no. 57D.
Mamdani, M. (2001): When Victims Become Killers: Colonialism, Nativism, and the Genocide in Rwanda. Princeton
University Press: Princeton, 1st edtn.
Meyn, M. (2005): The Progress of Economic Regionalisation in Southern Africa – Challenges for SADC and COMESA,
Conference Paper prepared for the Namibian Economic Policy Research Unit (NEPRU); Monitoring Regional
Integration in Southern Africa. Windhoek, June 11-12, 2005.
Musoni, E. (2009): SMEs to Get Due Attention From Tax Administrators. The New Times 22/04/2009, [online].
Nambi, I. (2010): Rwanda: Kagame to Chair ITU Commission. The New Times 26/03/2010, [online].
Ououch-Ojiwah, F. (2009): Rwanda FDI Worth US$600 m Recorded in 2009. The New Times 31/12/2009, [online].
Republic of Rwanda (2006): Fiscal and Financial Decentralisation Policy. Ministry of Local Government, Good
Governance, Community Development and Social Affairs and the Ministry of Finance and Economic Planning.
RRA (2005) Annual Report 2004. RRA, 2005.
RRA (2006) Annual Report 2005. RRA, 2006.
RRA (2007) Annual Report 2006. RRA, 2007.
RRA (2008) Annual Report for 2007. RRA, 2008.
RRA (2009) Annual Report for 2008. RRA, 2009.
Rubukira, S. (2009): Rwanda is Best Business Reformer but Remaining Issues might be Tricky. The Rwanda Focus
18/09/2009, [online].

Domestic Resource Mobilisation for Poverty Reduction in East Africa: Lessons for Tax Policy and Administration
231
Rugumamu, S. and Gbla, O (2003): Post-Conflict Reconstruction in Rwanda in Reconstruction and Capacity Building
in Post-Conflict Countries in Africa. The African Capacity Building Foundation, 2003.
Rwangombwa, J. (2005): Rwanda’s Aid Policy: Implementing Change to Maximise the Impact of Aid on Poverty
Reduction and Economic Growth. Ministry of Finance and Economic Planning, presentation available at
www.devpartners.gov.rw/.../Aid%20Policy/Aid_Policy_Implementation_Plan. ppt accessed February 2010.
The New Times (2007): Tax Evasion Hurt Revenue Collection. The New Times 02/11/2007, [online].
Torero, E., Everest-Phillips, M., Stern, R (2006): The Rwandan Revenue Authority Project International Workshop on
Public-Private Dialogue, Paris, 1-2 February 2006
Tumukunde, H., Kiessel, J., Khawar, A. (2008): Promoting Citizens Engagement in Public Revenue Generation:
Rwanda. United Nations Department of Social and Economic Affairs (UNDESA), 2008.
USAID (2008): Rwanda’s Agenda for Action. USAID, 2008.
World Bank (2009) Doing Business 2010 Rwanda: Comparing Regulation in 183 Economies, World Bank 2009.
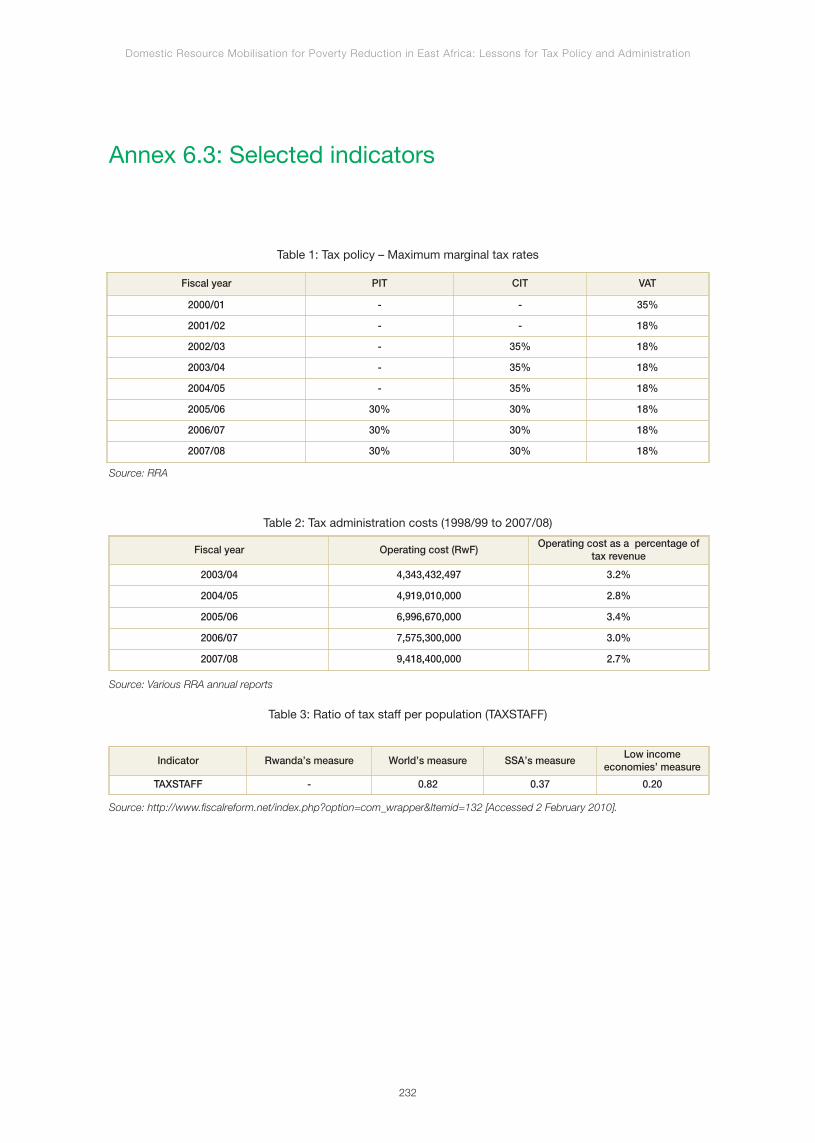
Annex 6.3: Selected indicators
Domestic Resource Mobilisation for Poverty Reduction in East Africa: Lessons for Tax Policy and Administration
232
Fiscal year PIT CIT VAT
2000/01 - - 35%
2001/02 - - 18%
2002/03 - 35% 18%
2003/04 - 35% 18%
2004/05 - 35% 18%
2005/06 30% 30% 18%
2006/07 30% 30% 18%
2007/08 30% 30% 18%
Table 1: Tax policy – Maximum marginal tax rates
Source: RRA
Fiscal year Operating cost (RwF)Operating cost as a percentage of
tax revenue
2003/04 4,343,432,497 3.2%
2004/05 4,919,010,000 2.8%
2005/06 6,996,670,000 3.4%
2006/07 7,575,300,000 3.0%
2007/08 9,418,400,000 2.7%
Table 2: Tax administration costs (1998/99 to 2007/08)
Source: Various RRA annual reports
Indicator Rwanda’s measure World’s measure SSA’s measureLow income
economies’ measure
TAXSTAFF - 0.82 0.37 0.20
Table 3: Ratio of tax staff per population (TAXSTAFF)
Source: http://www.fiscalreform.net/index.php?option=com_wrapper&Itemid=132 [Accessed 2 February 2010].
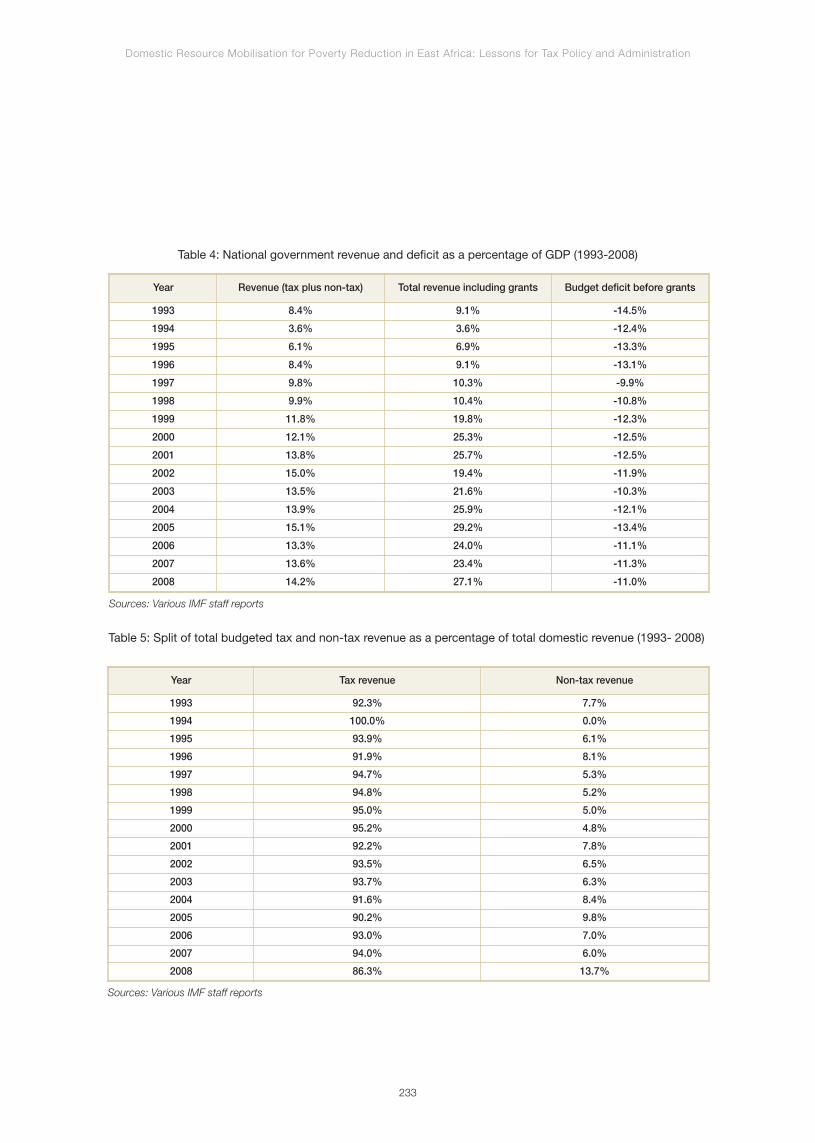
Domestic Resource Mobilisation for Poverty Reduction in East Africa: Lessons for Tax Policy and Administration
233
Year Revenue (tax plus non-tax) Total revenue including grants Budget deficit before grants
1993 8.4% 9.1% -14.5%
1994 3.6% 3.6% -12.4%
1995 6.1% 6.9% -13.3%
1996 8.4% 9.1% -13.1%
1997 9.8% 10.3% -9.9%
1998 9.9% 10.4% -10.8%
1999 11.8% 19.8% -12.3%
2000 12.1% 25.3% -12.5%
2001 13.8% 25.7% -12.5%
2002 15.0% 19.4% -11.9%
2003 13.5% 21.6% -10.3%
2004 13.9% 25.9% -12.1%
2005 15.1% 29.2% -13.4%
2006 13.3% 24.0% -11.1%
2007 13.6% 23.4% -11.3%
2008 14.2% 27.1% -11.0%
Table 4: National government revenue and deficit as a percentage of GDP (1993-2008)
Sources: Various IMF staff reports
Year Tax revenue Non-tax revenue
1993 92.3% 7.7%
1994 100.0% 0.0%
1995 93.9% 6.1%
1996 91.9% 8.1%
1997 94.7% 5.3%
1998 94.8% 5.2%
1999 95.0% 5.0%
2000 95.2% 4.8%
2001 92.2% 7.8%
2002 93.5% 6.5%
2003 93.7% 6.3%
2004 91.6% 8.4%
2005 90.2% 9.8%
2006 93.0% 7.0%
2007 94.0% 6.0%
2008 86.3% 13.7%
Table 5: Split of total budgeted tax and non-tax revenue as a percentage of total domestic revenue (1993- 2008)
Sources: Various IMF staff reports

Domestic Resource Mobilisation for Poverty Reduction in East Africa: Lessons for Tax Policy and Administration
234
Year Direct taxes Taxes on goods and services Taxes on international trade
1993 26.8% 43.1% 30.1%
1994 26.2% 37.7% 36.1%
1995 13.4% 45.6% 41.0%
1996 28.5% 39.8% 31.8%
1997 26.5% 39.8% 33.6%
1998 29.2% 45.5% 25.2%
1999 26.2% 55.6% 18.2%
2000 28.3% 53.9% 17.8%
2001 30.8% 51.6% 17.6%
2002 32.2% 50.1% 17.7%
2003 30.6% 50.1% 19.3%
2004 28.4% 52.1% 19.5%
2005 31.2% 51.0% 17.8%
2006 33.3% 49.3% 17.4%
2007 36.1% 50.9% 13.0%
2008 37.5% 49.2% 13.4%
Table 6: Composition of national government tax revenues (1993 to 2008)
Sources: Various IMF staff reports
Year Tax on profit PAYE VAT Excises Customs duties Total
2006 14.1% 17.7% 33.9% 11.7% 15.5% 100.0%
2007 13.5% 18.1% 32.2% 11.1% 14.0% 100.0%
2008 16.1% 18.0% 33.2% 10.6% 11.4% 100.0%
Table 7: Contribution of major direct, consumption and international taxes
to overall tax revenue collections in Rwanda (2006 to 2008)
Source: RRA annual reports
2002/03 2003/04 2004/05 2005/06 2006/07 2007/08
Tax arrears at the end of thefinancial year as a percentage of
fiscal collections- - - - - 16.4%
Table 8: Amount of previous year’s arrears collected as a percentage
of total amount of tax arrears at beginning of year
Source: RRA annual reports

Domestic Resource Mobilisation for Poverty Reduction in East Africa: Lessons for Tax Policy and Administration
235
Indicator Rwanda’s measure World’s measure SSA’s measureLow income
economies’ measure
CITPROD 0.06 0.13 0.09 0.08
PITPROD 0.09 0.14 0.08 0.07
VATGCR 30.30 65.48 42.3 38.45
Table 9: CIT and PIT revenue productivity and VAT gross compliance ratio (2008/09)
Source: http://www.fiscalreform.net/index.php?option=com_wrapper&Itemid=132 [Accessed 2 February 2010].
IndicatorYear
2008 2009 2010
Rwanda’s global ranking - 58 59
Number of tax payments a year 34 34 34
Time taken to comply with the majortax types
168 160 160
Table 10: World Bank Doing Business indicators on the tax burden (Rwanda only)
Source: http://www.doingbusiness.org/ExploreEconomies/?economyid=185 [Accessed 10 March 2010]
IndicatorRegion
Rwanda OECD SSA
Number of tax payments a year 34 12.8 37.7
Time taken to comply with the majortax types
160 194.1 306.0
Total tax rate as % of profit 31.3% 44.5% 67.5%
Table 11: World Bank Doing Business indicators (2010) on the
tax burden (Rwanda vis-à-vis the OECD and SSA)
Source: http://www.doingbusiness.org/ExploreEconomies/?economyid=185 [Accessed 10 March 2010]
Registered for Total number Percentage increase(2006 to 2008)2006 2007 2008
VAT 2,637 3,741 4,644 76%
PAYE 4,495 9,285 8,929 99%
Profit taxes 4,205 11,842 20,676 392%
Large taxpayers 284 289 311 10%
Table 12: Growth of registered taxpayers (2002/03 to 2007/08)
Source: RRA annual reports
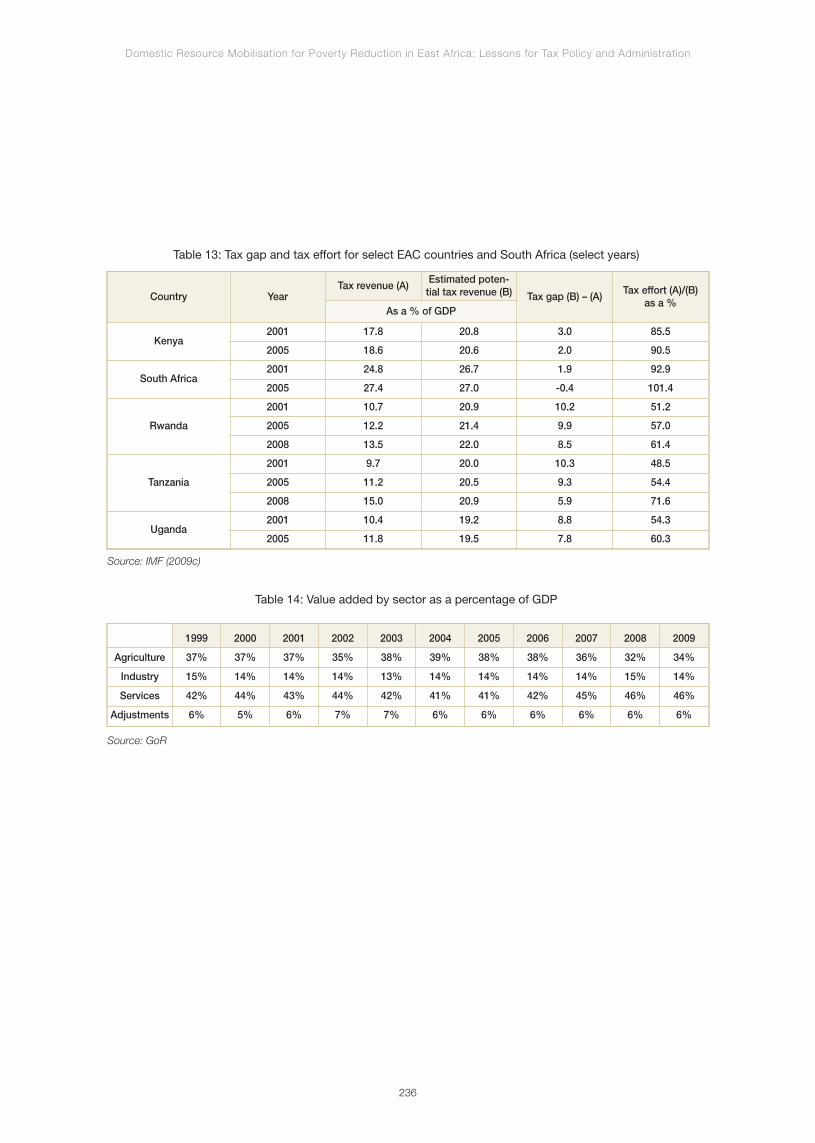
Domestic Resource Mobilisation for Poverty Reduction in East Africa: Lessons for Tax Policy and Administration
236
Country YearTax revenue (A)
Estimated poten-tial tax revenue (B) Tax gap (B) – (A)
Tax effort (A)/(B)as a %
As a % of GDP
Kenya2001 17.8 20.8 3.0 85.5
2005 18.6 20.6 2.0 90.5
South Africa2001 24.8 26.7 1.9 92.9
2005 27.4 27.0 -0.4 101.4
Rwanda
2001 10.7 20.9 10.2 51.2
2005 12.2 21.4 9.9 57.0
2008 13.5 22.0 8.5 61.4
Tanzania
2001 9.7 20.0 10.3 48.5
2005 11.2 20.5 9.3 54.4
2008 15.0 20.9 5.9 71.6
Uganda2001 10.4 19.2 8.8 54.3
2005 11.8 19.5 7.8 60.3
Table 13: Tax gap and tax effort for select EAC countries and South Africa (select years)
Source: IMF (2009c)
1999 2000 2001 2002 2003 2004 2005 2006 2007 2008 2009
Agriculture 37% 37% 37% 35% 38% 39% 38% 38% 36% 32% 34%
Industry 15% 14% 14% 14% 13% 14% 14% 14% 14% 15% 14%
Services 42% 44% 43% 44% 42% 41% 41% 42% 45% 46% 46%
Adjustments 6% 5% 6% 7% 7% 6% 6% 6% 6% 6% 6%
Table 14: Value added by sector as a percentage of GDP
Source: GoR
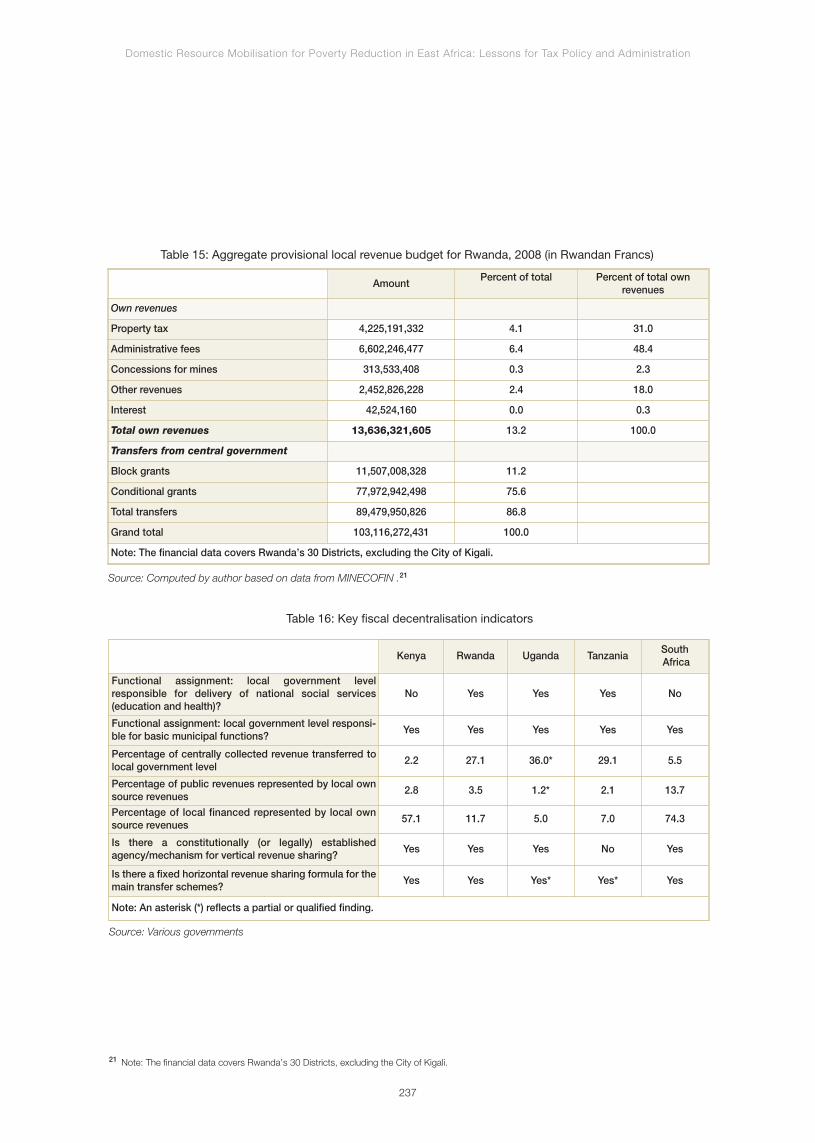
Domestic Resource Mobilisation for Poverty Reduction in East Africa: Lessons for Tax Policy and Administration
21 Note: The financial data covers Rwanda’s 30 Districts, excluding the City of Kigali.
237
AmountPercent of total Percent of total own
revenues
Own revenues
Property tax 4,225,191,332 4.1 31.0
Administrative fees 6,602,246,477 6.4 48.4
Concessions for mines 313,533,408 0.3 2.3
Other revenues 2,452,826,228 2.4 18.0
Interest 42,524,160 0.0 0.3
Total own revenues 13,636,321,605 13.2 100.0
Transfers from central government
Block grants 11,507,008,328 11.2
Conditional grants 77,972,942,498 75.6
Total transfers 89,479,950,826 86.8
Grand total 103,116,272,431 100.0
Note: The financial data covers Rwanda’s 30 Districts, excluding the City of Kigali.
Table 15: Aggregate provisional local revenue budget for Rwanda, 2008 (in Rwandan Francs)
Source: Computed by author based on data from MINECOFIN .21
Kenya Rwanda Uganda TanzaniaSouthAfrica
Functional assignment: local government levelresponsible for delivery of national social services(education and health)?
No Yes Yes Yes No
Functional assignment: local government level responsi-ble for basic municipal functions?
Yes Yes Yes Yes Yes
Percentage of centrally collected revenue transferred tolocal government level
2.2 27.1 36.0* 29.1 5.5
Percentage of public revenues represented by local ownsource revenues
2.8 3.5 1.2* 2.1 13.7
Percentage of local financed represented by local ownsource revenues
57.1 11.7 5.0 7.0 74.3
Is there a constitutionally (or legally) establishedagency/mechanism for vertical revenue sharing?
Yes Yes Yes No Yes
Is there a fixed horizontal revenue sharing formula for themain transfer schemes?
Yes Yes Yes* Yes* Yes
Note: An asterisk (*) reflects a partial or qualified finding.
Table 16: Key fiscal decentralisation indicators
Source: Various governments

Chapter 7
Tanzania

Domestic Resource Mobilisation for Poverty Reduction in East Africa: Lessons for Tax Policy and Administration
240
Summary of Key Findings
Context-Political economy
and fiscal legacies
After independence in 1961, GoT embarked on trans-
forming the economy through industrialisation and rural
development schemes. Several years later, in 1967, it
adopted socialism (‘Ujamaa’) as its development ideo-
logy. Initially, "social indicators improved, and Tanzania
made important progress in building a nation-state"
(IMF, 1999). However, the oil crisis in the 1970s and
early 1980s, and other external shocks set the country
on the path of an economic downturn, which was not
reversed until the late 1990s.
Economic liberalisation and other major policy measures
implemented from the mid-1990s heralded sustained
economic recovery. By the end of the 1990s, Tanzania
made major strides in public sector reform and other
indicators, resulting in marked improvement in econo-
mic growth. In particular, real GDP growth rate consis-
tently exceeded 5% annually during this period. At the
same time, the economy had undergone a significant
transformation, largely because of phenomenal invest-
ment in the mining sector. Still, Tanzania’s economy
remains dominated by agriculture and a large informal
sector.
While domestic tax revenues have grown considerably
since the mid-1990s, international development assis-
tance has remained a significant fiscal driver in Tanzania.
Except for the one and a half decade beginning in the
early 1980s, Tanzania has consistently been one of the
largest recipients of development assistance in the EAC.
It has been suggested, both in the literature and by key
informants, that this extensive external assistance may
have undermined ‘tax morale’ among Tanzania’s elite.
However, in recent times, its political leaders, in particu-
lar, Members of Parliament have become sensitive to
the country’s heavy reliance on aid and the excessive
influence of the donors.
Both the aggregate fiscal position and tax revenue
generation for Tanzania appear to be in an exponential
trajectory in the medium-to-long term. However, in the
medium term, tax effort will be constrained by two
factors; (i) continued elite resistance to abolition of the
prevailing extensive tax exemptions; and (ii) threat of
increased high-level corruption in government agencies.
Nonetheless, there are two motivating forces that should
sustain and possibly enhance the tax effort in future.
First, the political economy fundamentals are in place to
sustain the momentum for economic growth, diversifi-
cation, and poverty reduction. The second factor in
favour of stepped up tax effort in future is the combina-
tion of a developing national consciousness of loss of
fiscal sovereignty and associated risks of high depen-
dency on foreign aid.
Tax reforms: Sequencing,
implementation and results
Major policy changes to the tax system were initiated by
the recommendations of the Presidential Commission on
Taxation and Expenditure (1989-1991). These changes
included: (i) simplification of the customs tariff structure in
1992 as a means of curbing tax evasion; (ii) establish-
ment of Tanzania Revenue Authority (TRA) in 1996; and
(iii) introduction of the Value Added Tax (VAT) in 1998,
replacing the sales tax. There were further changes in
tax policy between 2000 and 2008, including, for exam-
ple, promulgation of a new Income Tax Act in 2004. Also,
revisions to customs policies and administration have
been driven by the East African Community Customs
Management Act of 2004.
Since its establishment, TRA has undergone three
waves of reforms centering on: (i) institution building; (ii)
improving services delivery; and (iii) enhancing TRA’s
specialisation. Under the first wave, besides increased
levels of revenue collection, TRA reports the following
results: (a) both the Board of Directors and Management
Domestic Resource Mobilisation for Poverty Reduction in East Africa: Lessons for Tax Policy and Administration
241
Team were appointed; (b) a taxpayer identification
number (TIN) system was established; (c) ASYCUDA++
system was implemented; (d) the Large Taxpayers’
Department (LTD) was established in 2001; and (e) the
tax appeals system was unified. The second wave
contributed to: (a) increased revenue collections; (b) a
growth in the large taxpayer population of 370; (c)
systems improvements; and (d) electronic tax payments
and refunds.
The implementation of the third wave reforms is still
underway. Some of the main achievements to date
include: (a) institutionalisation of tax-based risk mana-
gement operations; (b) achievement of the International
Standards Organisation 9001:2000 certification in
October 2008; (c) implementation of a compliant traders
scheme for importers; (d) opening of seven Tax Centres
to register taxpayers, assess and examine returns and
collect revenue; and (e) completion of a second time
release study in 2009/10.
Domestic revenue performance
From the establishment of TRA in 1995/96 to 2007/08,
Tanzania achieved a 2.7 percentage point increase in
domestic revenue collections. Tax revenue between
1996/97 and 2007/08 grew at an average annual rate of
15.7%1. It is noteworthy that the average annual public
revenue growth rate between 2004/05 and 2007/08
was even higher, at 20.9%. This increase was due to
extensive tax reforms undertaken between 2003/04 and
2006/07. Interestingly, VAT was the best-performing
revenue source throughout the period from 1998/99 to
2007/08, growing at an average rate of 22.9% a year.
Income tax revenues were the second largest contributor
to domestic tax collections in the 11 years to 2007/08.
Revenues grew at an average annual rate of 22.3%, partly
as a result of a buoyant macroeconomic environment,
increased coverage of large taxpayers, other efficiency
gains in tax administration and pay rises, particularly for
public servants (IMF, 2004). Also, considerable gains were
made by establishing the LTD. However, high levels of tax
exemptions contributed to substantial revenue loss,
probably accounting for most of Tanzania’s tax gap.
Challenges and issues
Significant challenges will need to be addressed so as
to attain and sustain the tax-to-GDP ratio target of at
least 20% in the long term. Key challenges are listed
below:
• Ensuring efficiency of tax incentives and exemp-
tions: Reduction of tax exemptions could raise tax
effort by several percentage points;
• Widening the tax base: Binding constraints appear
to evolve around: (a) the absence of systems and
mechanisms to reach many taxpayers; and (b) limi-
ted TRA knowledge about potential taxpayers in the
informal sector economy;
• Effectively exploiting ICT systems to enhance effi-
ciency: At present, these systems are not being
implemented using an integrated framework.
Hence, in the absence of integration, the systems’
use will remain sub-optimal;
• Building and sustaining managerial capacity:
Recruitment and retention of specialists in areas
such as ICT, accounting and finance, audit, legal,
among others, remain a challenge;
• Minimising corruption in tax collection: An indepen-
dent external integrity and transparency review
commissioned by TRA in 2007 concluded that there
seemed to be an endemic tax avoidance culture in
Tanzania; and
• Ensuring harmonised, systematic and policy-led
regional integration measures: Tanzania’s multiple
1 During that period, Tanzania mainland collections constituted over 95% of total tax collections in the United Republic of Tanzania.

Domestic Resource Mobilisation for Poverty Reduction in East Africa: Lessons for Tax Policy and Administration
242
memberships to regional economic communities
such as the EAC and SADC need to be harmoni-
sed. Further, import duty exemptions granted to
promote development of infant industries need to
be monitored aimed at minimising abuse and
consequent revenue loss.
Lessons learned
There are six key lessons that can be drawn from
Tanzania DRM experience. They are:
• Policy shifts can seriously disrupt revenue collection
efforts: It is critical to rigorously assess the
implications of policy changes prior to their imple-
mentation;
• Participatory tax forums can support effective policy
formulation: The process of tax policy formulation
is comparatively participatory and transparent;
• The Block Management System (BMS) is highly
potent for widening the tax base and tax net: The
BMS initiative has been very successful in capturing
new taxpayers and evaders;
• Comprehensive and in-depth sector studies should
inform risk management of tax-based operations:
In the absence of knowledge gained from
comprehensive and in-depth sector studies, risk
management cannot be fully effective;
• Risk-based profiling of VAT payers for refunds
enhances efficiency: TRA has exemplary perfor-
mance in managing its VAT refunds, which has been
enabled by the introduction of taxpayer profiling; and
• Tax incentives and exemptions can negate DRM
results: Exemptions and incentives could account for
up to 6% of GDP. Therefore, in targeting tax efforts,
and the outcomes and impacts of tax reforms, it is
appropriate to factor in the impact of tax incentives
and exemptions.
The rest of the chapter is organised as follows: the first
section discusses the political economy and fiscal lega-
cies, the second section covers trends in the tax system,
the third section explores domestic revenue perfor-
mance, the fourth section highlights the challenges to
increasing DRM, and the fifth section concludes with
lessons learned.

Domestic Resource Mobilisation for Poverty Reduction in East Africa: Lessons for Tax Policy and Administration
243
Context – Political economy and fiscal legacies
The legacy of socialism
and economic liberalisation
After independence in 1961, Tanzania embarked on
transforming the economy through industrialisation and
rural development schemes. Six years later, in 1967,
GoT announced a new approach to development
through, what is popularly known as the Arusha Decla-
ration, which outlined a shift in policy towards state-do-
minated interventions aimed at attaining "self-reliance".
In effect, GoT adopted socialism (‘Ujamaa’) as its ideo-
logy and called for major socio political and economic
adjustments consistent with the new dispensation,
including, public ownership.
Initially, "social indicators improved, and Tanzania made
important progress in building a nation-state" (IMF,
1999). However, the oil crisis in the 1970s and early
1980s, and other external shocks marked the beginning
of an economic downturn, demonstrated by large fiscal
deficits, high inflation rates and low foreign exchange
reserves. Mismanagement and inefficiencies in public
enterprises further exacerbated the situation. “Between
1984/85 and 1994/95, there was a net transfer from the
government to the parastatal sector. In real terms, the
net transfers increased from TShs6.3 billion in 1984/85
to TShs50.3 billion in 1993/94” (Moshi, 1998). These
inappropriate policies and structural defects, coupled
with the1979/80 war to dethrone the Idi Amin regime in
Uganda, led to a near collapse of Tanzania’s economy
in the 1980s. Between 1980 and 1985, real GDP
growth averaged 1% per annum (World Bank, 2002).
As GDP shrank, shortages of basic consumer goods
appeared, and agricultural exports collapsed (Treichel,
2005). Furthermore, Tanzania experienced a serious
shortage of foreign exchange.
In 1981, GoT launched a National Economic Survival
Programme (NESP), which aimed to reduce Tanzania’s
resource gap by boosting exports and curbing public
expenditure. However, NESP’s targets were unrealistic
(Havnevik, 1993). A successor structural adjustment
programme (SAP) of 1983, which aimed to “finance the
fiscal deficit largely through domestic borrowing… did
not address the fundamental issues of price distortions,
including and in particular the exchange rate”
(Muganda, 2004).
It was not until 1986 that GoT, with support from deve-
lopment partners, initiated an Economic Reform
Programme (ERP) geared towards achieving macroe-
conomic stabilisation, primarily through improved fiscal
management. The ERP was succeeded by the Econo-
mic and Social Action Programme (ESAP), which ran
from 1989 to 1992. As part of these programmes, GoT
focused on: reducing inflation by tightening monetary
policies and controlling public sector expenditure;
increasing domestic revenue collection through institu-
tional reform; and minimising budget deficits through
introduction of cash budget system to ensure that
resources are allocated on the basis of available revenue
from tax and external sources (World Bank, 2002).
Since early 1990s, there was extensive liberalisation of
the economy, involving: relaxation of price, exchange
and external trade controls; government’s divestment
from the parastatal sector, resulting in the successful
divestiture of more than 400 parastatals; and reform of
the financial services sector.
Economic recovery
and transformation since
the mid-1990s
From the mid-1990s, the above measures heralded a
major economic recovery, including: reduced inflation, a
sustained moderate economic growth, and a vastly
improved fiscal situation. By 1998, inflation had dropped
to 12.9% from 32.3% in 1985. By the mid-1990s,
growth ranged between 3% and 4% – “Private invest-
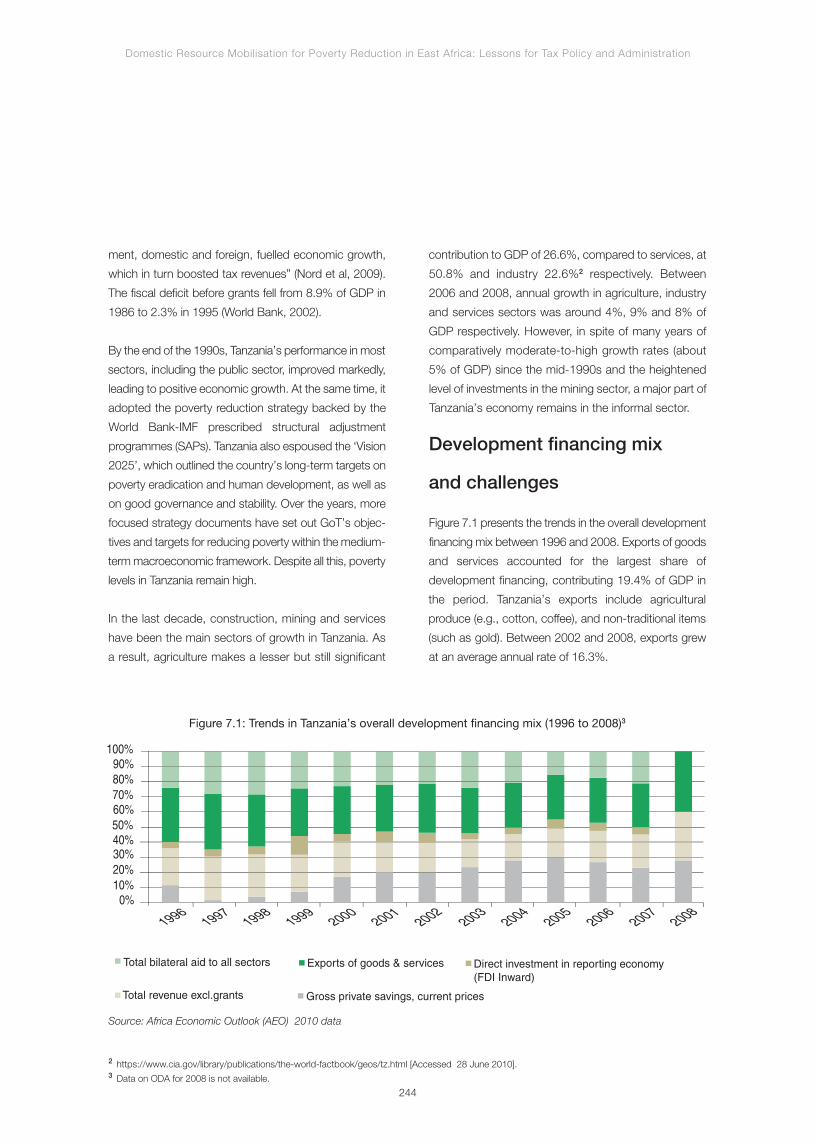
Domestic Resource Mobilisation for Poverty Reduction in East Africa: Lessons for Tax Policy and Administration
244
2 https://www.cia.gov/library/publications/the-world-factbook/geos/tz.html [Accessed 28 June 2010].3 Data on ODA for 2008 is not available.
100%
Total bilateral aid to all sectors
Total revenue excl.grants Gross private savings, current prices
Direct investment in reporting economy(FDI Inward)
Exports of goods & services
80%70%
90%
60%
40%50%
10%0%
20%30%
19961998
19992000
20012002
20032004
20052006
20072008
1997
Figure 7.1: Trends in Tanzania’s overall development financing mix (1996 to 2008)3
Source: Africa Economic Outlook (AEO) 2010 data
ment, domestic and foreign, fuelled economic growth,
which in turn boosted tax revenues” (Nord et al, 2009).
The fiscal deficit before grants fell from 8.9% of GDP in
1986 to 2.3% in 1995 (World Bank, 2002).
By the end of the 1990s, Tanzania’s performance in most
sectors, including the public sector, improved markedly,
leading to positive economic growth. At the same time, it
adopted the poverty reduction strategy backed by the
World Bank-IMF prescribed structural adjustment
programmes (SAPs). Tanzania also espoused the ‘Vision
2025’, which outlined the country’s long-term targets on
poverty eradication and human development, as well as
on good governance and stability. Over the years, more
focused strategy documents have set out GoT’s objec-
tives and targets for reducing poverty within the medium-
term macroeconomic framework. Despite all this, poverty
levels in Tanzania remain high.
In the last decade, construction, mining and services
have been the main sectors of growth in Tanzania. As
a result, agriculture makes a lesser but still significant
contribution to GDP of 26.6%, compared to services, at
50.8% and industry 22.6%2 respectively. Between
2006 and 2008, annual growth in agriculture, industry
and services sectors was around 4%, 9% and 8% of
GDP respectively. However, in spite of many years of
comparatively moderate-to-high growth rates (about
5% of GDP) since the mid-1990s and the heightened
level of investments in the mining sector, a major part of
Tanzania’s economy remains in the informal sector.
Development financing mix
and challenges
Figure 7.1 presents the trends in the overall development
financing mix between 1996 and 2008. Exports of goods
and services accounted for the largest share of
development financing, contributing 19.4% of GDP in
the period. Tanzania’s exports include agricultural
produce (e.g., cotton, coffee), and non-traditional items
(such as gold). Between 2002 and 2008, exports grew
at an average annual rate of 16.3%.
Domestic Resource Mobilisation for Poverty Reduction in East Africa: Lessons for Tax Policy and Administration
245
4 Tanzania also finances its development agenda with debt. However, the level of public debt has been on the decline since 1996.5 Brautigam’s framework is adopted because compared to others that were examined; it is judged to be more comprehensive and elegant. However,like most others, its historical perspective derives too much from the emergence of the modern European state to be linearly applied to states that arelegacies of colonial rule, such as Tanzania.6 In a society where “tax morale” is high, there are low levels of tax evasion and avoidance. It is only in a social culture where citizens generally appre-ciate their responsibility for sustaining state services and where they have a trust in their state institutions and leaders that a “tax morale” evolves.
Private savings are the second largest form of develop-
ment financing. Between 2002 and 2008, private savings
averaged at 17.8% of GDP, which is higher than the
levels for Kenya and Uganda for the same period, at
13.6% and 14.6% respectively, but lower than the Africa
benchmark for the post-Monterrey period of 22.1%. The
growth in private savings was highest following liberali-
sation of the financial services sector.
Domestic revenue is the third largest source of deve-
lopment finance (see Section on “Domestic revenue
performance”). However, domestic financing capacity
is insufficient to meet Tanzania’s needs. Therefore, GoT
relies heavily on foreign aid, which averaged at 13.2%
of GDP between 1996 and 20074. About 34% of the
budget is estimated to be financed by aid.
Tanzania has also benefited from some foreign direct
investment (FDI), which averaged at 3.4% of GDP
between 1996 and 2007. It is noteworthy that South
Africa is reported to have contributed to 35% of Tanza-
nia’s FDI between 1994 and 2003 (Page and de Velde,
2004). Its other major investors include: Australia,
Canada, Ghana, Kenya, UK, and USA. On Tanzania
mainland, “based on 2003 figures, FDI is relatively
diversified in mining (39 %), followed by manufacturing
(22%), tourism (13%) and agriculture (7%)” (MIGA, 2007).
Political economy dynamics
underpinning DRM
The synopsis of the political economy legacies that have
impacted DRM, as presented in the following sub-sec-
tions, is based on Brautigam’s (2008) analytical frame-
work5. It consists of five facets: (i) level of economic
development and economic structure; (ii) societal
factors: culture, values, trust and ‘tax morale’; (iii) war
and taxes: bureaucratic modernisation as a response to
threat; (iv) political institutions and tax systems; and (v)
taxation and fiscal contract.
The economic structure is largelyagrarian with high levels of poverty
The Tanzanian economy remains agrarian with high
poverty levels. However, in recent years, sectors asso-
ciated with enhanced monetisation of the economy
such as mining, construction, financial services and
manufacturing have recorded comparatively higher
growth. At the same time, poverty levels have recorded
a modest decline. GoT’s Poverty and Human Develop-
ment Report ( 2009) indicates that in the six year period
from 2001 to 2007, household poverty rate in rural
areas fell by 1.1 percentage points -- to 37.6%,
compared with a 1.7 percentage points drop to 24.1%
in urban areas. Still, in the evolving economic structure,
growth in employment in the modern sectors and in
urban areas is comparatively rapid – “the number of
Tanzanians employed grew by an average of 630,000
per year between 2001 and 2006” (GoT, 2009). There-
fore, the scope for DRM has considerably and steadily
improved over the past one and a half decade, and
there are bright prospects of this being sustained in
future.
An egalitarian and camaraderieculture with high levels of trust butlow tax morale6
Tradition and the enduring impact of the Ujamaa era
have left Tanzanian society with a significantly egalitarian
and camaraderie culture. Until recently, conspicuous
affluence was generally frowned upon in the society.
Trust among members of the society has been high. In
that culture, corruption remained comparatively low and
Domestic Resource Mobilisation for Poverty Reduction in East Africa: Lessons for Tax Policy and Administration
246
7 For macroeconomic management reasons, countries with high inflows of donor resources such as Tanzania are constrained to programme all exter-nal resource commitments/pledges. To the extent that high levels of external resources when combined with domestic resources can exceed the targetaggregate expenditure levels, policy makers could be tempted to make the easy choice of not putting in place measures to enhance DRM.
although a worsening trend is widely perceived, the latest
Transparency International Corruption Perception Index
suggests that among the five EAC countries, only
Rwanda ranks better than Tanzania.
Except for the one and a half decade beginning in the
early 1980s, Tanzania has consistently been one of the
largest recipients of development assistance in the
EAC. This phenomenon has undermined ‘tax morale’
among Tanzania’s elite. The authors have, for example,
been informed that most of the elite generally do not
pay taxes on non-salary income. In recent years, rising
frequency of reported levels of high-level corruption has
further eroded this morale.
Nation-building deviated from thenormative
In the decade following independence, Tanzania bene-
fited from a robust revenue mobilisation bureaucracy,
jointly developed by the defunct EAC (1967-1977) --
foundations of which were inherited from the colonial
East African Common Services Organisation. The
collapse of the EAC in the late 19970s proved disrup-
tive to the development of the revenue administration
system. By then, however, both development strategy
and development financing mix of the Nyerere regime
were not exclusively dependent on the conventional
domestic resources mobilisation bureaucracy.
In conventional terms, Tanzania has fought only one war
since independence. This was against the regime of Idi
Amin in Uganda. However, father of the nation, the late
Mwalimu Julius Nyerere, actively sought, with some
degree of success, to place Tanzania on a war footing in
two other fronts. Soon after independence, he declared
a war against hunger, disease and ignorance. Following
the Arusha Declaration of 1967, the Ujamaa drive was
also put on a similar war footing. Indeed, it was in that
spirit that Nyerere eventually transformed the ruling party
to a revolutionary one (Chama Cha Mapinduzi, ‘the
revolutionary party’), which still dominates Tanzania’s
political scene.
It is worth noting here that Nyerere did not fall back on
poor Tanzanians to mobilise resources for his wars.
Rather, he cultivated a unique and paradoxical relations-
hip with the international community, which, for two
decades, provided him with considerable resources for
nation-building. While the West provided him considera-
ble aid, he could still persuade the Chinese to finance
the Tanzania-Zambia railway line. At the same time, as
observed above, his success probably underlies a low
tax morale culture7.
There was political support forestablishing TRA as a professionalinstitution insulated from politicalinterference
The launch of TRA in 1996 was an early milestone of the
“Third Phase” Government of Tanzania (Mkapa regime)
in heralding economic recovery. Thus, from the outset,
TRA was established as a semi-autonomous technocra-
tic instrument for strengthening DRM efforts. In this
regard, recruitment of management and staff was based
on professionalism. A large proportion of staff from the
former revenue departments, who were considered inept
or corrupt, were retrenched and those who remained
were transferred to TRA. At the same time, there was a
strong drive to recruit and develop new professionals.
A few years later, TRA was to be an important source of
technocrats that former President Mkapa relied on to
spearhead consolidation of macroeconomic and fiscal
reforms in the Ministry of Finance. In particular, TRA
provided the Ministry with fiscal policy and management
experts. As a result, at the technical level, a very close
working relationship grew between TRA and its parent
ministry.
Domestic Resource Mobilisation for Poverty Reduction in East Africa: Lessons for Tax Policy and Administration
247
8 Fiscal contract has its genesis in agreements between European monarchies and the propertied class and merchants that the latter would contributeto state coffers especially to fund war in return for specific benefits. In modern times a fiscal contract would be characterised by government pledges ofspecific socio-economic benefits to justify taxation. This is a more realistic proposition in a democratic dispensation.
More significantly, since its inception, TRA is one
public organisation that has generally been insulated
from political interference. Others could argue that this
absence of political intervention is not unique to TRA.
According to Mukandala et al (2005), first, DRM and
allocation processes are “depoliticised” in Tanzania,
giving a free hand to bureaucrats, donors, investors
and external consultants. Civil society and parliamen-
tary control of these processes is still very marginal.
Second, all “demand side” state institutions in Tanza-
nia are controlled by the executive, and not politicians.
This reinforces TRA’s insulation from political interfe-
rence.
There is no fiscal contract in placeat present 8
Neither the process of state-building, nor the imperatives
of development financing have so far enabled a fiscal
contracting process to effectively evolve in Tanzania. Over
the years, government revenues have mainly come from
a few large taxpayers and international development
organisations (IDOs). About 400 large taxpayers, who are
mainly privatised public companies and subsidiaries of
multi-national organisations, contribute 80% of domestic
tax revenues. IMF (2009a) statistics show that external de-
velopment financing, at about 10% of GDP, was nearly
40% of total public expenditure in 2008/09. In other
words, vast majority of Tanzanians do not pay tax, and so
far, there have been no serious efforts to make them pay.
Furthermore, according to Fjeldstad (2009), while there
are indications that majority of the population may be
willing to engage in a fiscal contract with the state, no
such contract is in place at present. This explains why
surveys of citizens in 2003 and 2006, cited by the same
author, show they are not ready to pay taxes and fees,
and this may be a major obstacle to enhancing govern-
ment revenues in Tanzania.
Fiscal governance drivers,
results and trajectory
Historically, Tanzania’s socio-political predisposition for
an egalitarian society has been the major internal driver
of fiscal governance. The launch of a programme in the
1960s to provide education for all had a positive impact
in that regard. Following the interlude era of economic
liberalisation (second phase government), national
programmes to rapidly extend social services to all
sections of the society were re-launched under the
‘third phase’ government. Despite all this, country’s
DRM remains comparatively low. Therefore, the need
for external resources to bridge the resource gap has
been a permanent feature. It is in the latter context that
there may be validity in Hyden’s (2005) assertion that
donors are more proactive, and probably the dominant
driver of fiscal governance.
In recent times, Tanzania’s political leaders, in parti-
cular, MPs have become sensitive to the country’s
high dependency on aid and the excessive influence
of the donors. In this regard, during the debate of the
2008/09 budget, partly in response to growing donor
pressure for curbing corruption in public expenditure,
many MPs vigorously advocated for weaning Tanzania
away from its aid dependency. In response, the
Minister of Finance pledged to accelerate growth in
domestic resources.
In addition, there is no doubt that foreign investors have
been significant fiscal governance drivers in Tanzania,
especially over the past decade. Wangwe (2005) sug-
gests that while tax measures taken in the early 2000s
were generally directed to stimulating investment and
production, large-scale investors were given greater tax
relief. Mining companies were predominant among
these investors, and there have been concerns that the
Domestic Resource Mobilisation for Poverty Reduction in East Africa: Lessons for Tax Policy and Administration
exemptions and incentives they received had the effect
of reducing the potential to maximise revenues from
corporate income tax.
Until aid dependency is significantly reduced, it is difficult
to anticipate how influence of the IDOs on Tanzania’s
economy can be reduced. Furthermore, according to
Nord et al (2009), this is only a realistic prospect in the
long term, because it is dependent on a stronger
domestic revenue base, growing private FDI, and even-
tual access to sovereign bond markets and Tanzania’s
capacity to manage debt.
Furthermore, the tax effort in the medium term will be
constrained by two factors. One is the continued elite
resistance to abolition of the prevailing extensive tax
exemptions. The other factor is the prospect of increase
in high-level corruption, which could ultimately infect
TRA. While the increasing vigilance of Parliament and
other national watchdog institutions could be expected
to effectively address the second factor, the national
socio-culture may sustain the former well into the future.
Still, there are two motivating forces that should
sustain and possibly enhance the tax effort in future.
First, the political economy fundamentals are in place to
sustain the momentum for economic growth,
diversification, and poverty reduction. In 2009, IMF
projected that Tanzania’s growth will return towards the
7% level in the medium term. The benefits of recent and
ongoing substantial investments in the mining sector,
and a renewed focus on the agriculture sector should
serve to accelerate growth, employment and poverty
reduction. Also, the drive, led by the President, to
improve the investment climate and rapidly raise
Tanzania’s World Bank Doing Business ranking, will
help to sustain the growth of Foreign Direct Investment
(FDI). The second factor in favour of raised tax effort in
future is the combination of a developing national
consciousness of loss of fiscal sovereignty caused by
the current high level of aid dependency, and the
decision by development partners in May 2010 to
withhold budget support worth US$220 million.
248
Domestic Resource Mobilisation for Poverty Reduction in East Africa: Lessons for Tax Policy and Administration
249
Trends in the tax system
9 “In the area of income taxation, marginal tax rates were reduced from a range of 20-95% to 15-75% in 1986/87…[and] further to a range of 10-50%in 1989” (Osoro, 1993).10 http://www.mof.go.tz/mofdocs/revenue/exemptvat.htm [Accessed 20 March 2010].11 http://www.mining-journal.com/finance/new-tanzanian-mining-act [Accessed 6 September 2010].12 This policy measure is not in line with international practice.
Changes in tax policies over
the years
Following independence, Tanzania depended on unified
policies and an administrative system jointly operated by
the EAC founding members. However, in the early 1970s
a decision was made to “place the esponsibility of
income tax in the hands of each national government”
(Osoro, 1993). Later, GoT enacted the Income Tax Act of
1973, and expanded the sales tax base (introduced in
1969) “to compensate for the abolition of the excise tax”
(Levin, 2001). Thereafter, several studies were underta-
ken in the 1980s, which recommended that the tax
system be simplified and rationalised – leading to the
abolition of export taxes and income tax rate changes9.
The key tax policy changes, however, did not take place
until two decades later as elaborated below.
Key changes to tax policyin the 1990s
There were two key changes to the tax system from
1991 onwards that were informed by recommendations
of the Presidential Commission on Taxation and Expen-
diture (1989-1991). First, in 1992, GoT simplified the
customs tariff structure to five rates from over 50 in
1986, anticipating that there would be a decline in
evasion (Morrissey, 1995). Second, in 1998, VAT was
introduced, which replaced “the highly distortionary
sales tax…, the hotel levy, and receipt-based stamp
duty” (Nord et al, 2009). Two VAT rates were applicable
at 20% and 0%. In addition, there are several VAT
exemptions including: food, crops and livestock; health
services; pesticides and fertilisers, education materials;
and transport services10.
In addition, from 1990, to enhance workers’ take-home
pay, which “had been declining throughout the decade”,
GoT reduced the top personal income tax rate from 40%
to 30% (Osoro, 1993). It also reduced the top marginal
corporate tax rate to 30% from 35%. It is worth noting
that in 1996, the Ministry of Finance established a Task
Force on Tax Reform. Comprised of stakeholders from
government, private sector, research institutions and civil
society, it provides opinions on tax policy. The Task
Force’s recommendations are reviewed by a Think Tank
for Tax Reform chaired by the Minister of Finance.
In 1998, GoT promulgated the Mining Act, which
subjected miners to mining royalties on a net back value
at a: 3% standard rate for gold and rough gemstones;
5% for diamonds; and 0% on polished and cut stones.
This legislation was replaced by the Mining Act of 2010,
which levies royalties of 4% for precious and base
metals, 5% to 6% for diamonds and gemstones, and
7% for uranium on a gross value basis11.
Major tax policies from 2000 to 2008
In 2000-2008, GoT introduced the following policy
changes to the VAT regime:
• To raise revenue, in 2003/04, an amendment was
made to the VAT regime aimed at excluding zero-ra-
ting from almost all services supplied to businesses/
consumers overseas12;
• To reduce compliance costs, regulatory burdens
and red tape for small size enterprises, GoT, in
2004/05, increased the VAT registration threshold
from an annual taxable turnover of TShs20 million to
TShs40 million;
• To reduce transportation costs and enable the
public railways system to meet its regular mainte-
nance needs, GoT, in 2005/06, exempted
locomotives, rolling stock, spare parts, and acces-
Domestic Resource Mobilisation for Poverty Reduction in East Africa: Lessons for Tax Policy and Administration
250
13 In addition, under the new Act the withholding tax on dividends was reduced to 10%, whereas previously the rate was 20% for non-residents and15% for residents.14 To qualify, the original threshold was that at least 35% of the company’s equity had to be issued to the public. From 2009/2010 this threshold wasreduced to 30%.15 http://www.tanzania.go.tz/tra.html [Accessed 20 March 2010].
sories from VAT. It also gave relief to operators who
were suffering from rising fuel costs by exempting
Jet-A1 aviation fuel from VAT;
• To make them more affordable to the taxpayer, GoT,
in 2006/07, abolished VAT on petroleum products.
It also reduced the time limit for lodging VAT refund
claims from five to three years; and
• To prevent exploration companies from incurring
significant cash flow costs, GoT, in 2007/08, exten-
ded VAT special relief to cover entities involved in
prospecting and exploration for petroleum and
natural gas.
In 2004, GoT promulgated a new Income Tax Act
aimed at broadening the tax base. Some of the major
changes contained in the Act were also informed by
the1989-91 Presidential Commission’s recommen-
dations, which included: introduction of self-assess-
ment; significant anti-avoidance measures; measures
to match accounting and tax profits; removal of relief
on housing allowance and gratuity for employees;
and hefty interest and penalties for compliance failure
and offences13. The new Act also provides for an
upward adjustment of the presumptive tax applying
to individuals with an annual business turnover not
exceeding TShs0 million from 1.1% (on turnover up to
TShs 3 million) to 3.3% (on turnover from TShs14
million to TShs20 million). More recently, GoT has
made various amendments to the Income Tax Act,
including in:
• 2005/06, to encourage companies to broaden their
public ownership, GoT introduced a concessionary
corporate tax rate of 25% (compared to the stan-
dard 30%) to apply for the first three years to
companies that are newly listed on the Dar es
Salaam stock exchange14; and
• 2006/07, GoT reduced the marginal personal
income tax rate for the lowest tax band from 18.5%
to 15%.
Changes in customs policies and administration have
been driven by the EAC Customs Management Act of
2004, which underpins the establishment of common
external tariffs (CETs) and elimination of internal tariffs.
It also brought about the harmonisation of customs
principles and procedures, and removal of suspended
duty.
Excise duties are regulated under the Excise (Manage-
ment and Tariff) Act. In Tanzania, “apart from the
traditional excisable goods [alcohol, tobacco and
petroleum products], soft drinks and motor vehicles are
excisable for revenue generation purposes”15. In addi-
tion, GoT charges excise duty on mobile airtime. Excise
duty rates are subject to regular increases, for example,
to adjust for inflation.
Institutional changes
The 1989-91 Presidential Commission of enquiry into
public resources also recommended creation of an
autonomous revenue administration to include the
Department of Inland Revenue and Department of
Customs and Excise in the Ministry of Finance. Howe-
ver, it was not until 1995 that the National Assembly
enacted the TRA Act No. 11 of 1995. Since its esta-
blishment in 1996, TRA’s operations have been
funded by annual allocations appropriated by the
Parliament.
TRA is headed by a Commissioner General who reports
to a Board of Directors, although the Minister of Finance
and Economic Affairs retains overall responsibility for
TRA. The Board is required to meet on a monthly basis.
It has two committees: a Standing Committee, which
Domestic Resource Mobilisation for Poverty Reduction in East Africa: Lessons for Tax Policy and Administration
251
handles organisational and human resource issues; and
an Audit Committee that tackles operational and control
matters.
Each of TRA’s revenue functions (i.e., domestic revenue,
large taxpayers, customs and excise and tax investiga-
tions) is headed by a Commissioner. Its support func-
tions (internal audit, legal services, taxpayer services and
education, ICT, finance and human resources and
administration) are headed by Directors. TRA has
presence in all the 23 administrative regions of Tanzania
mainland and in Zanzibar. TRA also has a tax training
centre, the Institute of Tax Administration (ITA), which
offers both short- and long-term courses. ITA operates
as a semi-autonomous cost centre.
Changes in administrative
systems
According to TRA’s 2007/08 annual report, as of 30th
June 2008, it employed 3,413 staff. More than half of
them were deployed in Customs and Excise (30%) and
Domestic Revenue (55%). Under the Act, TRA is empo-
wered to pay its staff competitive salaries. To that end, it
undertakes salary surveys every two years. In recent
years, TRA has implemented the recommendations of
independent salary surveys undertaken in 2004/05 and
2007/08 (TRA, 2008).
In 2004/05, TRA developed an information systems
policy and strategy to guide its ICT-based modernisation
plans. Since then, it has introduced: the Automated
System for Customs Data ++ (ASYCUDA++) and Reve-
nue Authority Digital Data Exchange (RADDEX) system in
customs; an automated Central Motor Vehicle Registra-
tion System (CMVRS); ITAX (a bespoke system) in
domestic revenue; Epicor and PEODESY systems to
support management of its finances and human
resource functions respectively; TRA Monitoring and
Evaluation Database (TRAMED); a data warehousing
system; and an integrated data communication network
(see Annex 7.4).
Fiscal decentralisation
and taxation by local
governments
Since 1999, Tanzania has been pursuing a local govern-
ment reform process based on the concept of devolution
of power. There are 133 local government authorities,
which account for roughly 21% of public sector
spending in Tanzania (PMO-RALG, 2007). Local
authorities are responsible for the delivery of primary
education, basic health services, agricultural extension,
rural water supplies, local roads and public infrastruc-
ture, as well as typical local functions, such as refuse
collection, street cleaning, managing local markets, and
so on.
Local governments receive bulk of their resources
through intergovernmental fiscal transfers (see Annex
7.3: Table 7). Almost two-thirds of these transfers are
provided in the form of formula-based sectoral block
grants, whereas the remainder is given in the form of
subventions and development grants (PMO-RALG,
2007). In terms of own source revenues, local govern-
ments depend extensively on fees, permits and charges
and other minor revenue sources (see Annex 7.3: Table
8). In addition, local governments rely relatively heavily on
taxes on local business activity, including produce
cesses (turnover taxes on agricultural production of up to
5%) and the service levy (a turnover tax of 0.3% for firms
with turnover in excess of TShs20 million).
Tanzania has seen a considerable reduction in the rela-
tive importance of own source revenues as a local
source of financing. For instance, in 2002/03, almost
one-fifth of local recurrent expenditures were funded
from local revenues, but by 2006/07, this percentage
Domestic Resource Mobilisation for Poverty Reduction in East Africa: Lessons for Tax Policy and Administration
252
had declined to 9.3% (PMO-RALG, 2007). This sharp
relative decline was caused in large part by the abolition
of the development levy (a local poll tax) in 2003, and a
decision that sharply limited local authorities’ ability to
collect local business licenses in 2004 (Boex and
Martinez-Vazquez, 2006). In addition, due to poor local
revenue collection efforts, in June 2007, the Prime
Minister instructed TRA to assist local government
authorities towards collecting local property taxes. This
arrangement became effective in 2009.
In addition to the above, the crop cess (in Tanzania and
elsewhere in the region) has long been identified as an
inefficient local revenue source (see Hicks 1960; Bird
1974; Boex and Martinez-Vazquez 2006). Indeed, it
would be easy to abolish this tax, and there have been
voices advocating for this. However, the appropriate path
would be to pursue a revenue-neutral reform and to
identify and put in place an appropriate alternative local
revenue instrument to tax rural agricultural production –
for instance, a local tax on land used for commercial
production – prior to eliminating the crop cess.
Reform sequencing,
implementation and results
Tax reforms in the 1990s were motivated by Tanzania’s
fiscal crisis (see Section on “Political economy and
fiscal legacies”). It is against this rationale that the
Presidential omission on Taxation and Expenditure was
established – specifically to propose ways in which GoT
could expand its tax base and increase collection
efficiency (Fjeldstad, 1995). The Commission’s recom-
mendations were presented earlier in this section.
Sequencing and implementationof reforms
The range of tax policy reforms initiated at the beginning
of the 1990s heralded the modernisation of the tax
system (IMF, 2003). The next critical reform was initiated
to build the necessary managerial and technical capa-
city within TRA to ensure efficient and effective tax
administration.
Since its establishment, TRA has undergone three waves
of reforms centering on: (i) institution building; (ii) improving
services delivery; and (iii) deepening the authority’s
specialisation. These reforms are contained in successive
TRA corporate plans. The first corporate plan was imple-
mented in 1998/99 and remained in force until 2002/03;
the second plan continued from 2003/04 to 2006/07;
and the third one runs from 2008/09 to 2012/13.
The first wave of reform received extensive financial
support from various development partners including the
European Union, Germany, Sweden, UK, USA and the
World Bank. The reform’s thrust was on enhancing
revenue and capacity. Under the first wave, besides
increased levels of revenue collection, TRA reports the
following results: (i) both the Board of Directors and
Management Team were appointed; (ii) buildings were
rehabilitated and working tools upgraded; (iii) TIN system
was established; (iv) ASYCUDA++ was implemented; (v)
LTD was established in 2001 with an initial 100
taxpayers; and (vi) the tax appeals system was unified.
Development partners continued to support the second
wave of reform. However, pooled funding arrangements
under TRA were introduced instead of the project-based
approach during the first wave. The second wave, which
ran from 2003/04 until 2006/07, sought to achieve five
objectives: (i) increase revenue collection in a cost effec-
tive way; (ii) integrate TRA operations; (iii) provide high
quality and responsive customer services; (iv) promote
tax compliance through a fair, equitable and transparent
application of tax laws; and (v) improve staff compe-
tence, motivation, integrity and accountability.
Wave 2 reforms contributed to the following key results:
(i) increased revenue collections; (ii) growth in large
Domestic Resource Mobilisation for Poverty Reduction in East Africa: Lessons for Tax Policy and Administration
253
taxpayer population to 370; (iii) systems improvements;
(iv) electronic tax payments and refunds through the
Tanzania Inter Banking Settlement System; and (v) an
enhanced tax refund system. In addition:
• In 2004, TRA started to consult stakeholders
through a quarterly forum;
• In 2004, TRA introduced new risk-based VAT
refund arrangements “under which repayment
claimants are separated into three categories (gold,
silver and non-gold-silver)”, which are subject to
different checks (Child, 2008);
• A balanced scorecard (BSC) performance manage-
ment system was introduced in 2006 aimed at
“improving effectiveness and efficiency of the perfor-
mance” at organisational and staff levels (TRA, 2008);
and
• Implementation of a Block Management System
(BMS), which “focuses on the physical identification
and mapping of taxpayers,” (TRA, 2008). As a
result, in 2007/08, TRA registered an additional
13,300 new taxpayers.
The third corporate plan, which is aligned to Tanzania’s
development objectives, underscores five goals during
the third wave of reforms to run from 2008/09 to
2012/13. Its goals are similar to those in wave 2 reforms.
The implementation of wave 3 reforms is still underway.
Some of the main achievements to date include the:
• Institutionalisation of risk management tax-based
operations such as: building specialist audit
capacity in specific areas (e.g., construction, cash
traders and tourism); self-assessment by large
taxpayers; and risk assessment studies for risky
sectors (e.g., petroleum, whole sale and retail);
• Attainment of the International Standards
Organisation (ISO) 9001:2000 certification in
October 2008. This certification will be valid until 2011;
• Implementation of a compliant traders scheme
(CTS) for importers. As of 30 June 2008, around
60 traders had been registered under the CTS;
• Opening of seven Tax Centres in Dar es Salaam to
register taxpayers, assess and examine returns and
collect revenue; and
• Completion of a second time release study in
2009/10. The study was undertaken by various
institutions involved in the tax clearance process.
Both tax and administrative reforms resulted in impro-
ved revenue performance in 1996/97, and from
2004/05 (see Section on “Domestic revenue perfor-
mance”). However, revenue performance relative to
GDP was not sustained throughout the period from
TRA’s establishment (in 1995/96) to 2007/08. Ndulu
et al (2007) attribute this outcome to emanate “chiefly
from fiscal corruption”. Excessive tax exemptions may
also have significantly cancelled out the prospective
impact of the reforms on tax revenue performance. The
IMF (2003) concludes that GoT “overestimated the
speed at which institutional capacities could be streng-
thened”. In addition, the same author suggests that
“policy sequencing also contributed to the revenue
decline…tariffs were lowered too quickly before
compensatory tax broadening measures including a
strengthened administration were in place”.

Domestic Resource Mobilisation for Poverty Reduction in East Africa: Lessons for Tax Policy and Administration
254
Domestic revenue performance
16 During that period, Tanzania mainland collections constituted over 95% of total tax collections in the United Republic of Tanzania.
Non-tax revenue Tax revenue
0%2%
18%16%14%12%10%8%6%4%
1994
/95
1992
/93
1991
/92
1993
/94
1996
/97
1998
/99
1999
/00
2000
/01
2001
/02
2002
/03
2003
/04
2004
/05
2005
/06
2006
/07
2007
/08
1997
/98
1995
/96
Figure 7.2: Tax and non-tax revenue as a percentage of GDP (1991/92 to 2007/08)
Source: Various IMF staff reports. Also see Annex C5: Table
Domestic revenue performance
trends
By fiscal year 1988/89, Tanzania’s domestic revenue as
a percentage of GDP had declined to 9.9% (World Bank,
2002). Following the establishment of TRA, revenue
performance did not meet expectations in the initial
years. Even though actual collections against budget
averaged 99% between 1997/98 and 2002/03, tax
revenue as a percentage of GDP hovered around 10.7%
of GDP. Some of the reasons for this result are provided
in Section on “Trends in the tax system”. In addition, key
informants indicate that during this period GDP was
revised upwards, lowering revenue to GDP ratios.
By 2007/08, Tanzania’s tax as a percentage of GDP had
risen to 14.7%. However, non-tax revenues remained
consistently low from 1991/92 (1.6%) to 2007/08 (1.2%).
Tax revenue, between 1996/97 and 2007/08, grew at
an average annual rate of 15.7%16. It is noteworthy that
the average annual revenue growth rate between
2004/05 and 2007/08 was even higher, at 20.9%. This
increase was due to extensive reforms undertaken
between 2003/04 and 2006/07 aimed at broadening
the tax base.
VAT was the best-performing system throughout the
period from 1998/99 to 2007/08 (see Annex 7.3: Table
6). It grew at an average annual rate of 22.9%. In
2007/08, VAT collection as a percentage of GDP was
4.6% (IMF, 2009a); and constituted 31.7% of total
revenue collected on Tanzania mainland. It is notewor-
thy that raising the threshold for VAT registration from
2004/05 resulted in increased collection, because:
several traders actually increased their revenue decla-
rations so as to be able to remain VAT registered (and
thereby were able to reclaim VAT inputs); and there
Domestic Resource Mobilisation for Poverty Reduction in East Africa: Lessons for Tax Policy and Administration
255
17 http://www.fiscalreform.net/index.php?option=com_wrapper&Itemid=132 [Accessed 2 February 2010].18 This is another segment of large taxpayers.19 http://www.doingbusiness.org/ExploreEconomies/?economyid=185 [Accessed 10 March 2010].
was the deregistration of traders below the threshold
(where VAT input claims were no longer reclaimable).
However, there is a view that VAT’s contribution to tax
effort would be much higher if there were fewer
exemptions “and zero ratings since the original law
was passed” (Nord et al, 2009).
Income tax revenues were the second largest contribu-
tor to domestic tax collections in the 11 years up to
2007/08. Revenues grew at an average annual rate of
22.3%, partly as a result of a buoyant macroeconomic
environment, increased coverage of large taxpayers,
other efficiency gains in tax administration and pay rises,
particularly for public servants (IMF, 2004). In 2007/08:
income tax revenue as a percentage of GDP was 4.3%
(IMF, 2009a), constituting 26.6% of total revenue
collected on Tanzania mainland. By 2007/08, the best-
performing income tax was PAYE with a contribution of
14.8% of total revenue.
Tanzania is dependent on international trade taxes. In
this regard, VAT on imports (19.0%), import (10.8%)
and excise (7.8%) duties, and other import charges
(4.0%), on average, constituted 41.6% of total tax
revenue collected on mainland Tanzania between
1996/97 and 2007/08. The combined average annual
growth rate of import and excise duties and charges
between 1996/97 and 2007/08 was 23.6%.
However, the proportion of international trade reve-
nue from import duty declined from 15.4% in 1996/97
to 8.8% in 2007/08, partly due to reduction in trade
tariffs.
Tax administration benchmarks
Performance efficiency
Cost of collection. Between 2003/04 and 2007/08, tax
administration costs (excluding capital expenditure), as
a percentage of revenue collected, averaged at around
3% a year (see Annex 7.3: Table 2). During that period,
tax administration costs, as a percentage of tax reve-
nue, declined from 3.8% (2003/04) to 2.8% (2007/08),
but grew at an average annual rate of 21.9%. The
largest expenditure by far was on personnel emolu-
ments, which on average consumed around 57% of the
total budget. However, it is significant that the number of
tax staff available for every 1,000 persons is 0.05. This
‘tax staff per population’ ratio is very low compared to
the World average of 0.82, but higher than the SSA
average of 0.03717.
Organisational structure. TRA is organised along
functional lines. A Large Taxpayer Department (LTD),
established in 2001, serves around 380 taxpayers
(0.1% of all taxpayers). The Domestic Revenue Depart-
ment (DRD) provides services to all other domestic
revenue taxpayers. DRD taxpayers are segmented into
large18, medium and small taxpayers. The 1,600 large
taxpayers within the DRD are served by Large Taxpayer
Units in nine regions.
Ease of paying taxes. Judged by the World Bank’s
Doing Business Survey, the ease of paying taxes in
Tanzania is quite low. The survey ranks Tanzania 131st
and 120th out of 183 countries in terms of ease of doing
business and paying taxes respectively19. According to
the World Bank’s 2010 Paying Taxes report, a com-
pany is required to make 48 payments a year, which
are much more than the SSA and OECD averages of
37.7 and 12.8 a year respectively.
Tax arrears. TRA has been fairly proactive in collec-
ting tax debt. As of 30 June 2008, It reported that the
LTD and DRD had collected 100% and 68% of the
previous year’s debts as a percentage of the total
amount of tax arrears at the beginning of year
respectively.

Domestic Resource Mobilisation for Poverty Reduction in East Africa: Lessons for Tax Policy and Administration
256
20 Source: The International Tax Dialogue: Tax Administration in Selected African Countries: 2009.21 http://www.fiscalreform.net/index.php?option=com_wrapper&Itemid=132 [Accessed 2 February 2010].22 http://www.tic.co.tz/ [Accessed 30 June 2010].23 GoT has issued 29 licences to firms operating in such zones. In 2008 firms had exported products worth US$ 40 million, and employed around 6,522people. 24 http://www.tra.go.tz/index.php?option=com_content&task=view&id=396&Itemid=82 [Accessed 30 June 2010].
Box 7.1: Quantifying the level of incentives and exemptions
Revenue loss arising from tax exemptions is estimated at TShs 587 billion ((US$ 403 million) by the TRA between July
2008 and April 2009. Projects under the TIC accounted for the largest percentage of the total exemption. Other
beneficiaries included state-owned institutions, the Government of Zanzibar, religious and non-religious NGOs. In 2008,
it is estimated that the government lost TShs1.8 trillion (US$1.23 billion) or 6% of GDP through tax exemptions.
Source: Policy Forum (2009), TRA and author’s calculations
VAT payment system. Under TRA’s new VAT refund
system, 72% of qualifying claims are paid within 30 days
from the date of lodgement20. However, Tanzania has a
very low VAT gross compliance ratio of 27.0 in compari-
son with the World and SSA averages of 65.48 and 38.45
respectively (see Annex 7.3: Table 10)21. This low rate may
be due to the significant number of exemptions. From an
economic efficiency perspective, a moderate VAT rate
with a broad consumption base and few exemptions is
always preferred to a high rate with many exemptions. A
low VATGCR is also associated with “weak compliance
and enforcement” (Brondolo et al, 2008).
Tax compliance. Tanzania’s corporate income tax
revenue productivity (CITPROD and personal income
tax productivity (PITPROD measures of 0.05 and 0.08
indicate that taxes are used less efficiently in genera-
ting revenue than World averages of 0.13 and 0.14 for
CITPROD and PITPROD respectively. The Policy Forum
(2009) attributes low productivity figures to ‘transfer
pricing and trade mispricing’, especially by multinatio-
nals.
Allocative efficiency
Research and analysis undertaken by TRA suggests
that the tax revenue effort could be considerably higher,
if exemptions estimated at 20% of total tax revenue
collections were eliminated. An analysis of the exemp-
tions, given between July 2008 and April 2009, indicates
that a total of TShs283.5 billion (US$180.7 million), or
48% of the total waivers, was granted to Tanzania
Investment Centre (TIC). Under the Tanzania Investment
Act of 1997, TIC offers investors: import duty and VAT
exemptions on project/capital goods; and refunds of
duty charged on imported inputs used for producing
goods for export and goods sold to foreign institutions
under a duty draw back scheme22. Similar incentives
are offered in export processing and special economic
zones23. A 2008 assessment by the IMF of this regime
in Kenya and Tanzania asserts that investment incen-
tives offered to firms in special economic zones “are not
an important factor in attracting foreign investment”.
Rather, they create distortions and result in the loss of
tax revenues.
Performance equity
Tanzania has, by regional comparisons, progressive
income tax rates for PIT ranging from 14% to 30%
(effective 1 July 2010)24. Furthermore, GoT has steadily
increased the lowest monthly personal income tax
threshold from TShs60,000 (about US$40) in 2005/06
to TShs135,000 (about US$90) in 2009/10. GoT also
reduced the lowest marginal tax rate from 18.5% in
2007/08 to 15% in 2008/09. In addition, in 2008/09,
GoT widened the tax bands with the top tax rate of
30%, applying on income exceeding TShs720, 000

Domestic Resource Mobilisation for Poverty Reduction in East Africa: Lessons for Tax Policy and Administration
257
(about US$473) per month as against TShs 540, 000
before.
However, low income tax earners are also compelled to
pay excise duty for tobacco and alcohol to compensate
for negative health externalities, and are subject to VAT
which has some elements of regressivity. Specifically,
whilst several goods and services are exempt from VAT,
a study reports that as other inputs needed by farmers
(e.g., transport) are not VAT exempt, this tax contributes
to an increase in production costs of 10% to 20%. As a
result, “it has been claimed that the introduction of the
VAT system is one of the main reasons why the realised
economic growth has not benefited the poor” (OECD,
2007).
According to TRA’s Annual Report, as of 30 June 2008,
39 large taxpayers contributed 80% of tax revenues.
However, the World Bank’s 2010 Paying Taxes report
indicates that the ‘total tax rate’ as a percentage of
profit of 45.2% compares to the OECD average of
44.5%, and is lower than the SSA average of 67.5% (see
Annex 7.3: Tables 11 and 12). Another indicator of the
tax burden for corporate taxpayers has to do with the
amount of time taken by them to comply with major tax
types. In this regard, the 2010 World Bank paying taxes
survey indicates that the time taken by companies in
Tanzania to comply with major taxes is 172 hours, which
is much lower than the OECD and SSA averages of
194.1 hours and 306.0 hours respectively.
Performance effectiveness
In 2008, TRA’s tax effort of 71.6% improved consi-
derably from 48.5% in 2001 (see Annex 7.3: Table
14). In 2008, the tax gap also narrowed by 4.4
percentage points to 5.9% of GDP. Also, in 2008
Rwanda’s tax effort of 61.4% was lower; and tax gap
higher, at 8.5% of GDP. However, significant scope
remains to further reduce the tax gap and increase
Tanzania’s tax effort.
Summary of overall trends
In the 11 years since the creation of TRA in 1995/96,
Tanzania achieved a 2.7 percentage point increase in
domestic revenue collections. Considerable gains
were made by establishing the LTD. There has also
been fairly rapid growth in revenues from VAT and
income tax. However, the level of exemptions not only
contributed to undermining efficiency and effective-
ness of gains resulting from administrative reforms,
but also to the substantial revenue loss, probably
accounting for most of Tanzania’s tax gap.

Domestic Resource Mobilisation for Poverty Reduction in East Africa: Lessons for Tax Policy and Administration
258
Challenges and issues
Until the global economic crisis, Tanzania had made
steady progress in DRM as reflected in its tax collec-
tions from 2000/01 to 2007/08 (see Figure 7.2). The
setback suffered in 2008/09, due to the impact of the
global recession, is projected to be reversed in 2010/11.
It is estimated that a tax-to-GDP ratio of at least 20% will
be achieved by 2015. However, significant challenges
will need to be addressed for this target to be attained
and sustained in the long term. The key challenges and
issues are highlighted below.
Ensuring efficiency of tax
incentives and exemptions
The evidence gathered by the study team suggests
that achieving efficiency in the tax system, especially
through reduction of tax exemptions, could raise the
tax effort by several percentage points. However, as
the reversal of the measures to remove tax exemp-
tions, announced by the Minister of Finance and
Economic Affairs in his 2009/10 budget speech,
show that achieving efficiency may remain a major
challenge in the foreseeable future. Some shift in
socio-cultural traits among the main beneficiaries --
elite, political leaders and organisations-- will be
necessary. Also, strong will and commitment of the
political leadership is a pre-requisite to achieving this
shift in culture.
Widening the tax base
The more binding constraints to widening the tax base
appear to evolve around: (i) the absence of systems
and mechanisms to reach many taxpayers because
the TIN system is not sufficiently robust and the
national ID system is not yet in place; and (ii) the
limited knowledge of potential taxpayers who fall in the
informal sector economy, which, in 2002/03, Schnei-
der (2004) estimates contributed 60.2% of Tanzania’s
GDP.
TRA has initiated measures to address these chal-
lenges. For example, pending implementation of an
electronic national ID card system, it is set to introduce
a biometric system, which will encompass automated
finger printing identification to prevent issuance of more
than one TIN to a taxpayer. Furthermore, TRA is due to
commission a comprehensive study of the informal
sector in Tanzania. These initiatives will serve to widen
the tax base in the medium-to-long term. Still, conside-
rable and sustained efforts will be necessary before
Tanzania’s tax base can be significantly broadened.
Effectively exploiting ICT
to enhance efficiency
TRA has an array of initiatives to exploit ICT with a view
to enhancing efficiency in tax administration. These
include: the ASYCUDA++ for customs; ITAX and eFiling
for domestic revenue; computerised registration of motor
vehicles and drivers; and introduction of electronic cash
registers for VAT, among others. These initiatives are at
different stages of implementation. The effectiveness of
these systems will, however, depend on building and
maintaining their technical and professional capacity.
Currently, these systems are not being implemented
using an integrated framework, because this approach
poses technical and managerial challenges. Yet, in the
absence of integration, use of the systems will remain
sub-optimal. In particular, it is difficult to have a single
view of the taxpayer outside an integrated system.
Focusing reforms on strategic
priorities
As with other autonomous revenue authorities (ARAs) in
the region, TRA’s reform initiatives are strongly focused
on achieving state-of-the-art technology. There is
nothing inherently wrong with this orientation. However,
in any organisation, it poses the challenge of ensuring

Domestic Resource Mobilisation for Poverty Reduction in East Africa: Lessons for Tax Policy and Administration
259
that the reforms target strategic priorities. In this regard,
for example, the Time Release Studies of 2005 and
2009 pointed out the need for reforms in customs
clearance and a risk-based approach to checking of
documentation. But according to stakeholders, these
reforms are yet to be given due attention. On a more
general point of conjecture, it is not obvious that the
correct balance has been struck between: expansion of
the tax base; compliance; and enforcement.
Building and sustaining
management capacity
Some key informants have shared the perspective that
TRA is the paragon of excellence among Tanzania’s
public sector institutions. There is no doubt that TRA,
during its short lifespan, has succeeded in recruiting,
developing and retaining well-qualified technical and
professional personnel. Some of them have been
seconded to key central government institutions, and in
particular, the Ministry of Finance and Economic Affairs,
and to good effect. Nonetheless, as the TRA manage-
ment readily acknowledges, the challenge to recruit,
retain and motivate high-level professionals persists.
This is because, although the TRA staff compensation
system is delinked from that of the general public
service, it is still sensitive to the evolving gap with the
latter. Therefore, the recruitment and retention of
specialists in such areas as ICT, accounting and finance,
audit, and legal, which are critical for the effective
implementation and maintenance of the new systems,
remains a challenge.
Minimising corruption in tax
collection
An independent external integrity and transparency
review, commissioned by TRA in 2007, concluded that
the authority was well on its way to ensuring that all the
right building blocks are in place to enhance integrity in
its organisation and curb unethical behaviour. However,
the critical tasks for the authority are to ensure that the
systems, policies, regulations and procedures are not
only established but filtered down throughout the orga-
nisation to be fully functional and effective (PwC, 2007).
Nevertheless, the same review concluded that there
seemed to be an endemic tax avoidance culture in
Tanzania, and some of the TRA officials seem to
encourage or fall victim to this culture. Therefore, conti-
nuous vigilance on the part of TRA leadership will be
crucial in minimising corruption in tax collection.
Ensuring harmonised,
systematic and policy-led
regional integration measures
Regional integration at both EAC Customs Union level
and SADC appears to be predominantly politically-dri-
ven initiatives. Evidently, many of the integration
measures promulgated by regional political forums have
been made before any rigorous assessment of both the
feasibility of implementation, and DRM implications.
Thus, for example: (i) there is still a lot of haggling over
common external tariffs (CETs), which were pronoun-
ced on the eve of the EAC Customs Union launch; (ii)
there is an absence of clarity on the appropriate classi-
fication of manufactured and semi-manufactured
goods; (iii) “the value of goods which [qualify] for
exemptions and remissions has been growing”
(Mugisa, 2009) ; and (iv) weak and poorly coordinated
controls over the rules of origin continue to pose major
problems for all the ARAs in the EAC member states.
Furthermore, in the case of Tanzania, there is the
challenge of both policy and management of its
membership in EAC and SADC. As Nord et al (2009)
observe “overlapping memberships in… trade grou-
pings will complicate harmonization; [and] common
standards across different regional groupings”.
Domestic Resource Mobilisation for Poverty Reduction in East Africa: Lessons for Tax Policy and Administration
260
There is also the issue of exemptions. Although Tanza-
nia is eligible under the EAC Customs Management Act
to grant exemptions on import duty to promote infant
industries, the value of goods that qualified for exemp-
tions increased in 2006 by 36% to US$1,225.9 million,
with an equivalent growth in revenue foregone of
US$405.5 million. In this regard, no monitoring mecha-
nism is in place “to ensure that goods benefiting from
exemptions are not exported” or that duty is paid in full
(Mugisa et al, 2009).
Domestic Resource Mobilisation for Poverty Reduction in East Africa: Lessons for Tax Policy and Administration
261
Lessons learned
25 http://www.businessenvironment.org/dyn/be/docs/83/Session5.2MusibaDoc.pdf [Accessed 6 September 2010].
The previous section highlighted the challenges that GoT
and TRA will have to confront in order to sustain the
performance of the past decade. The major lessons that
are outlined below must be read in that context.
Policy shifts can seriously
disrupt revenue collection efforts
In the three years immediately following the introduction
of VAT and the abolition of sales tax, revenue collections
in Tanzania significantly declined. As previously observed,
revenue as a percentage of GDP fell from about 13% in
1997 to about 8.5% in 2002 (see Figure 7.2). Therefore, it
is critical to rigorously assess the implications of policy
changes.
Participatory tax forums can
support effective policy
formulation
GoT has adopted a comparatively participatory and
transparent process of tax policy formulation. The Tax
Forum and Tax Policy Think Tank enable taxpayers a
unique opportunity to effectively contribute to policy
development. Independent policy think tanks, research
institutions and tax advisory services firms are also active
in this forum. Therefore, policy development is informed
by a wide cross-section of resourceful players. In this
regard, for example, civil society, through these partici-
patory forums, contributed to the revision of the Income
Tax Act of 2004 and VAT thresholds25
The BMS is highly potent for wi-
dening the tax base and tax net
The pilot Block Management System (BMS) initiative in
Dar es Salam by TRA was very successful in capturing
new taxpayers and evaders (see Section on “Trends in
the tax system”). This explains why the decision to roll
out the system across the whole country had been
taken. This pioneering initiative has attracted the interest
of other ARAs in the region.
Comprehensive and in-depth
sector studies should inform risk
management of tax-based
operations
TRA’s comprehensive and in-depth study of the
construction, petroleum, wholesale and retail sectors
has apparently yielded critical information and know-
ledge on how to go about risk management of
tax-based operations. In the absence of such know-
ledge, risk management is informed by guess work and
therefore can not be fully effective. For this reason, TRA
plans to undertake such studies in other areas inclu-
ding the informal sector.

Domestic Resource Mobilisation for Poverty Reduction in East Africa: Lessons for Tax Policy and Administration
262
Risk-based profiling of VAT
taxpayers for refunds enhances
efficiency
TRA has exemplary performance in managing its VAT
refunds, with a turnaround of payment within 30 days of
lodgement of returns. This performance has been achie-
ved through introduction of taxpayer profiling in the
categories of gold, silver and non-gold silver (see Section
on “Trends in the tax system”)
Tax incentives and exemptions
can negate DRM results
TRA has made impressive gains in institutional ca-
pacity building and tax administration reforms. The
impact of these reforms is not fully reflected in the
outturns of tax effort and performance efficiency
measures (see Section on “Domestic revenue
performance”).
The main explanation for these shortfalls lies in tax
exemptions and incentives.
“Such incentives not only shrink the tax base but also
complicate tax administration and are a major source
of revenue resource leakage from the taxed eco-
nomy” (Gupta and Tareq, 2008).
As already pointed out in this paper, exemptions and
incentives could account for up to 6% of GDP.
Therefore, in targeting tax efforts, and the outcomes
and impacts of tax reforms, it is appropriate to factor
in the impact of tax incentives and exemptions.


Domestic Resource Mobilisation for Poverty Reduction in East Africa: Lessons for Tax Policy and Administration
264
Annex 7.1: Key informants
Alan Kiula (Mr), Taxpayer Education, Tanzania Revenue Authority
Albert Birnbaum (Mr), First Secretary, Embassy of Denmark
Bohela Lunogelo (Dr), Executive Director, Economic and Social Research Foundation
Christian Karstensen (Mr), First Secretary, Governance/Political Issues, Embassy of Denmark
David Robinson (Mr), Senior Resident Representative, International Monetary Fund
Diana Masalla (Ms), Manager, Taxpayer Education, Tanzania Revenue Authority
Joannes Mally (Mr), Commissioner for Domestic Revenue Department, Tanzania Revenue Authority
Jos Verbeek (Mr), Lead Economist, The World Bank
Mary Ngelela Maganga (Ms), Planning and Modernisation Programme Manager, Tanzania Revenue Authority
Mugisha Kamugisha (Mr), Tanzania Revenue Authority
Otieno Igogo (Mr), Chairman, Tanzania Taxpayers Association
Steven Lee (Mr), Senior Economist, Department for International Development
Tonedeus Muganyizi (Mr), Director of Research and Policy, Tanzania Revenue Authority
Vitalis Mbilinyi (Mr), Assistant Research Fellow, Economic and Social Research Foundation
Domestic Resource Mobilisation for Poverty Reduction in East Africa: Lessons for Tax Policy and Administration
265
Annex 7.2: Bibliography
Boex, J. and Martinez-Vazquez, J. (2006); Local Government Finance Reform in Developing Countries: The Case of
Tanzania Palgrave Macmillan: New York.
Brautigam, D.A. (2008); Introduction: Taxation and State Building in Developing Countries. In D.A Brautigam., O-H.
Fjeldstad and M. Moore (eds); Taxation and State Building in Developing Countries. Cambridge University Press:
Cambridge, pp. 1-33.
Brondolo, J., Silvani, C., Le Borgne, E., Bosch, F. (2008); Tax Administration Reform and Fiscal Adjustment: The Case
of Indonesia. IMF, 2008. WP/08/129.
Child, D. (2008); VAT Administration: Addressing Private Sector Concerns. In R. Krever (ed) VAT in Africa PULP:
Pretoria, pp. 129-142.
Feltenstein, A. and Sarangi, S. (2002); Macroeconomic Stabilization and Economic Growth: Analysis of Reform
Policies in Tanzania. Journal of Policy Modeling 24(5) 503-521.
Fjeldstad, O.H., Katera, L., Ngalewa, E. (2009); Maybe We Should Pay Tax After All. Research on Poverty Alleviation
(REPOA), Special Paper 09.29.
Fjeldstad, O-H. (1995); Taxation And Tax Reforms In Tanzania: A Survey. Chr. Michelsen Institute,Development
Studies and Human Rights Working Paper. WP 4:1995.
GoT (2009); Poverty and Human Development Report 2009. Research and Analysis Working Group, MKUKUTA
Monitoring System, Ministry of Finance and Economic Affairs 2009.
Gupta, S., and Tareq, S.(2008); Mobilising Revenue: Strengthening domestic Revenue Bases is Key to Creating
Fiscal Space for Africa’s Developmental Needs, IMF Fiscal Affairs Department, Finance and Development, 2008.
Havnevik, K. (1993); Tanzania: The Limits to Development from Above Motala Grafiska: Motala.
Hyden, G. (2005); Why Do Things Happen the Way They Do: A Power Analysis of Tanzania. Paper presented to the
Embassy of Sweden in Dar es Salaam, February 2005.
IMF (1999); Tanzania: Recent Economic Developments. IMF,1999. Staff Country Report No 99/24.
IMF (2003); Fiscal Adjustment in IMF-supported Programs IMF: Washington.
IMF (2004); Tanzania: 2004 Article IV Consultation and Second Review Under the Three-Year Arrangement Under the
PRGF—Staff Report. IMF, 2004. Report no. 04/285.
IMF (2008); Kenya, Uganda, and the United Republic of Tanzania: Selected Issues. IMF, 2008. Report No. 08/353.
IMF (2009a); United Republic of Tanzania: Sixth Review Under the Policy Support Instrument, First Review Under the
Exogenous Shocks Facility, and Request for a Modification of Performance/Assessment Criterion—Staff Report.
IMF, 2009. Report No 09/336.
IMF (2009b); Some Observations on Domestic Revenue Mobilization. Presentation made during IMF Staff Visit to
Rwanda, Oct-November 2009.
Kefela, T.G. (2009); Reforming Tax Polices and Revenue Mobilization Promotes a Fiscal Responsibility: A Study of
East and West African States, Journal Of Law And Conflict Resolution Vol. 1(5):98-106, October, 2009 Available
Online at http://www.academicjournals.org/JLCR ISSN 2006-9804 © 2009 Academic Journals.
Levin, J. (2001); Taxation in Tanzania. World Institute for Development Economics Research, 2001. Discussion paper no. 2001/80.
MIGA (2007); Snapshot Africa – Tanzania: Benchmarking FDI competitiveness. MIGA, 2007.
Morrissey, O. (1995); Political Commitment, Institutional Capacity and Tax Policy Reform in Tanzania World
Development 23(4): 637-649.

Domestic Resource Mobilisation for Poverty Reduction in East Africa: Lessons for Tax Policy and Administration
266
Moshi, H.P.P. (1998); Fiscal and Monetary Burden of Tanzania’s Corporate Bodies: The Case of Public Enterprises.
Africa Economic Research Consortium, 1998. Paper no. 75.
Muganda, A. (2004); Tanzania’s Economic Reforms – and Lessons Learned. Paper presented at Scaling Up Poverty
Reduction: A Global Learning Process and Conference, Shanghai, 25–27/05/04.
Mugisa, E. (2009); An Evaluation of the Implementation and Impact of the EAC Customs Union, presentation
available at www.eac.int/customs/index.php?option=com_docman&task accessed on February 10, 2010.
Mugisa, E., Onyango, C., Mugoya, P. (2009); An Evaluation of the Implementation and Impact of the East African
Community Customs Union. EAC, March 2009.
Mukandala, R., Mushi S., Mjema,G., Barkan J. (2005); The Political Economy of Tanzania. World Bank, 2005.
Ndulu, B.J., Chakraborti, L., Lijane, L., Ramachandran, V., Wolgin, J. (2007); Challenges of African Growth:
Opportunities, Constraints, and Strategic Directions IBRD/World Bank: Washington, 1st edtn.
Nord, R., Sobolev, Y., Dunn, D., Hajdenberg, A., Hobdari, N., Maziad, S., Roudent, S. (2009); Tanzania: The story
of an African Transition. IMF: Washington.
OECD (2007); Promoting Pro-poor Growth: Policy Guidance for Donors. OECD, 2007.
OECD (2009); Tax Administration in OECD and Selected Non-OECD Countries: Comparative Information Series (2008).
OECD, 2009.
Osoro, N. E., Rutasitara, L., Aikaeli, H., Kibira, G. (2010); Domestic Resource Mobilization in Tanzania. Draft report
(interim) presented to the Ministry of Finance and Economics Affairs, Dar es Salaam.
Osoro, N.E. (1993); Revenue Productivity Implications of Tax Reform in Tanzania. AERC, 1993. Paper No. 20.
Osoro, N.E. (1995); Tax Reforms in Tanzania: Motivations, Directions and Implications. African Economic Research
Consortium, Research Paper No. 38.
Page, S. and de Velde, D.W. (2004); Foreign Direct Investment by African Countries. In Went/UNCTAD 2004.
PMO-RALG (2007); Local Government Fiscal Review 2007. Government of the United Republic of Tanzania, 2007.
Accessed from www.logintanzania.net on April 8, 2010.
Policy Forum (2009); An Analysis of Tanzania’s Budget Revenue Projections: How Much Revenue are we Losing?
Tanzania Budget 2009/2010, Policy Brief 3.09.
PwC (2007); Tanzania Revenue Authority: External Integrity and Transparency Review. PwC, 2007.
Schneider, F. (2004); The Size of the Shadow Economies of 145 Countries all over the World: First Results over the
Period 1999 to 2003. IZA, December 2004. IZA DP No. 1431.
Soest, C.V. (2008); Donor support for tax administration reform in Africa: Experiences in Ghana, Tanzania, Uganda and
Zambia, Discussion paper 2/2008.
Tanzania Revenue Authority (2005); Annual Implementation Report for the Year 2004/05 Of TRA’s Second
Corporate Plan 2003/04-2007/08, TRA 2005.
Tanzania Revenue Authority (2006); Annual Implementation Report for the Year 2005/06 Of TRA’s Second Cor
porate Plan 2003/04-2007/08, TRA 2006.
Tanzania Revenue Authority (2007); Annual Implementation Report of TRA’s Second Corporate Plan for the Year
2006/07, TRA 2007.
Tanzania Revenue Authority (2008); Annual Implementation Report of TRA’s Second Corporate Plan for the Year
2007/08, TRA 2008.
Domestic Resource Mobilisation for Poverty Reduction in East Africa: Lessons for Tax Policy and Administration
267
Tanzania Revenue Authority (2008); Implementation Completion Report of the Corporate Plan 2003/04 – 2007/2008,
TRA 2008
Tanzania Revenue Authority (No date); Annual Report for 1996/97, TRA.
Tanzania Revenue Authority (No date); Annual Report for 2004/05, TRA.
Tanzania Revenue Authority (No date); Annual Report for 2005/06, TRA.
Tanzania Revenue Authority (No date); Annual Report for 2007/08, TRA.
Tanzania Revenue Authority (No date); Half Year Implementation Report of TRA’s Third Corporate Plan for the
Period Ending 31st December 2009, TRA 2009.
Treichel, V. (2005); Tanzania’s Growth Process and Success in Reducing Poverty, IMF Working Paper WP/05/35.
Van Dijk (2009); Tanzania: Uneven Growth, Policy Reforms and Poverty Alleviation: An Example of an African
Success?. In K. Wohlmuth, A. Alabi, P. Burger, A. Gutowski, A. Jerome, T. Knedlik, M. Meyn, T. Urban (eds); New
Growth and Poverty Alleviation Strategies for Africa – Institutional and Local Perspectives Lit Verlag: Berlin, pp.
243-266.
Vos, R., Sanchez, V., Inoue K. (2007); Constraints to achieving the MDGs through domestic resource mobilization,
DESA Working paper No. 36 ST/ESA/2007/DWP/36.
Wangwe, S. (2005); Macroeconomic Policy Choices for Growth and Poverty Reduction; the Case of Tanzania.
North-South Institute Policy Brief May 2005.
World Bank (2002); Tanzania at the Turn of the Century: Background Papers and Statistics. World Bank, 2002.
World Bank (2008); Program Document for a Proposed Credit to the URT for a Sixth Poverty Reduction Support
Credit. World Bank, 2008. Report No. 45348-TZ.
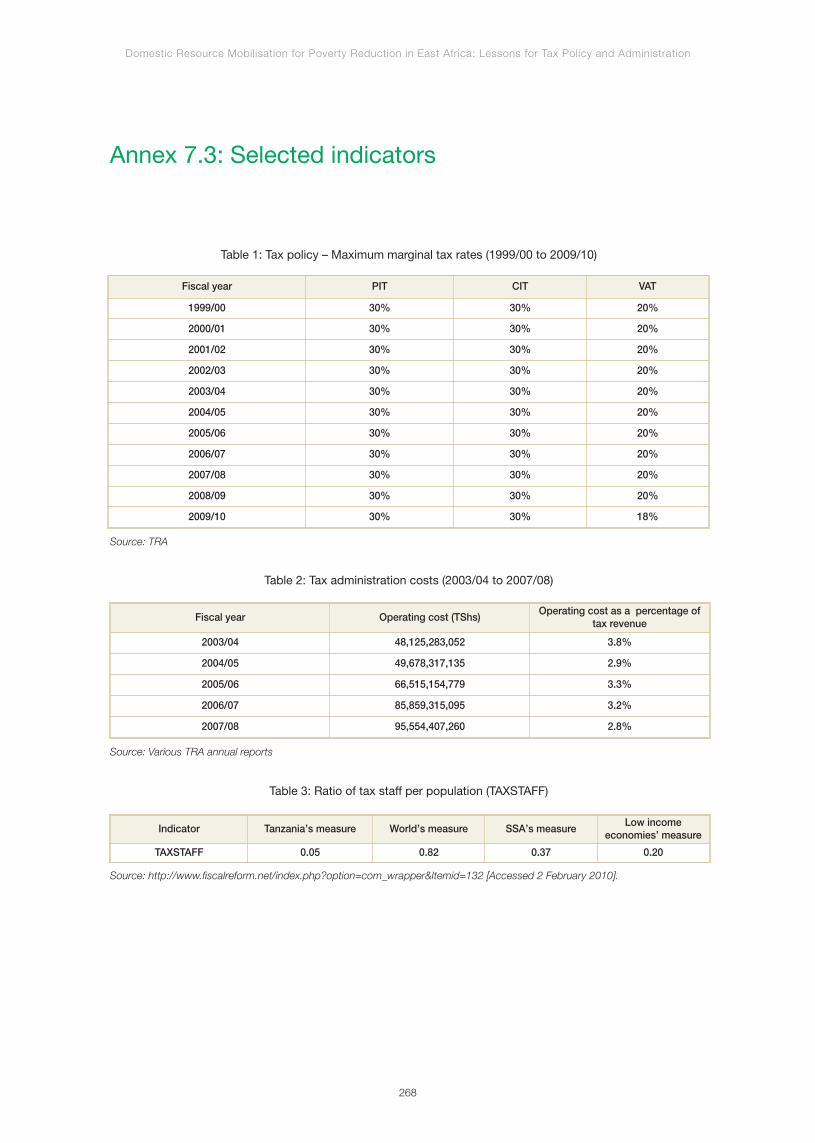
Domestic Resource Mobilisation for Poverty Reduction in East Africa: Lessons for Tax Policy and Administration
268
Annex 7.3: Selected indicators
Fiscal year PIT CIT VAT
1999/00 30% 30% 20%
2000/01 30% 30% 20%
2001/02 30% 30% 20%
2002/03 30% 30% 20%
2003/04 30% 30% 20%
2004/05 30% 30% 20%
2005/06 30% 30% 20%
2006/07 30% 30% 20%
2007/08 30% 30% 20%
2008/09 30% 30% 20%
2009/10 30% 30% 18%
Table 1: Tax policy – Maximum marginal tax rates (1999/00 to 2009/10)
Source: TRA
Fiscal year Operating cost (TShs)Operating cost as a percentage of
tax revenue
2003/04 48,125,283,052 3.8%
2004/05 49,678,317,135 2.9%
2005/06 66,515,154,779 3.3%
2006/07 85,859,315,095 3.2%
2007/08 95,554,407,260 2.8%
Table 2: Tax administration costs (2003/04 to 2007/08)
Source: Various TRA annual reports
Indicator Tanzania’s measure World’s measure SSA’s measureLow income
economies’ measure
TAXSTAFF 0.05 0.82 0.37 0.20
Table 3: Ratio of tax staff per population (TAXSTAFF)
Source: http://www.fiscalreform.net/index.php?option=com_wrapper&Itemid=132 [Accessed 2 February 2010].

Domestic Resource Mobilisation for Poverty Reduction in East Africa: Lessons for Tax Policy and Administration
269
Year Revenue Budget deficit before grants
1991/92 14.1% -1.7%
1992/93 10.6% -9.1%
1993/94 12.0% -5.8%
1994/95 12.5% -5.9%
1995/96 13.2% -4.4%
1996/97 13.5% -1.6%
1997/98 12.2% -2.9%
1998/99 11.3% -3.4%
1999/00 11.3% -7.8%
2000/01 12.0% -5.3%
2001/02 11.8% -5.4%
2002/03 12.1% -7.8%
2003/04 12.9% -9.1%
2004/05 13.3% -11.1%
2005/06 12.5% -10.3%
2006/07 14.1% -8.9%
2007/08 15.9% -6.9%
Table 4: National government revenue, debt and deficit as a percentage of GDP
Sources: Various IMF staff reports
Year Tax revenue Non-tax revenue
1991/92 12.5% 1.6%
1992/93 9.5% 1.1%
1993/94 11.0% 1.1%
1994/95 11.3% 1.2%
1995/96 11.3% 1.9%
1996/97 12.1% 1.4%
1997/98 11.1% 1.0%
1998/99 10.1% 1.2%
1999/00 10.1% 1.2%
2000/01 10.7% 1.3%
2001/02 11.0% 1.2%
2002/03 11.0% 1.1%
2003/04 11.7% 1.1%
2004/05 12.2% 1.2%
2005/06 11.5% 1.2%
2006/07 13.0% 1.1%
2007/08 14.7% 1.2%
Table 5: Total budgeted tax and non-tax revenue as a percentage of GDP (1991/92 to 2007/08)
Source: Various IMF staff reports

Domestic Resource Mobilisation for Poverty Reduction in East Africa: Lessons for Tax Policy and Administration
270
26 In 1996/97 and 1997/98 the sales tax was in force not VAT.
Fiscal year Sales tax and VAT26 Income tax Other domestic
taxes Import duty Excise duty
1996/97 24.1% 20.2% 15.3% 15.4% 18.1%
1997/98 24.6% 21.8% 14.3% 14.6% 18.1%
1998/99 35.6% 21.1% 9.9% 14.2% 13.6%
1999/00 33.4% 19.8% 8.5% 12.4% 12.6%
2000/01 37.4% 17.7% 2.6% 11.2% 18.0%
2001/02 38.4% 19.2% 2.6% 9.2% 18.2%
2002/03 39.5% 20.4% 2.3% 9.4% 16.4%
2003/04 38.6% 22.4% 2.3% 9.5% 15.4%
2004/05 43.1% 24.5% 1.5% 6.3% 14.1%
2005/06 41.4% 25.9% 1.5% 8.8% 12.9%
2006/07 33.8% 27.0% 1.4% 9.4% 18.6%
2007/08 31.7% 26.6% 2.1% 8.8% 19.1%
Table 6: Composition of national government tax revenues (1996/97 to 2007/08)
Source: RRA annual reports
Budget item Annual budget plan Cumulative outcomeCumulative outcome(in percent of total)
Own source Revenues 80,136,598,991 79,770,210,999 7.0
Intergov. transfers 1,305,926,992,865 1,059,226,293,823 92.8
Local borrowing 895,788,000 2,931,500,708 0.3
Total revenues 1,386,959,379,856 1,141,928,005,530 100.0
Recurrent expend. 892,397,359,363 780,268,304,171 75.2
Development expend. 458,614,929,946 256,746,235,967 24.8
Total expend. 1,351,012,289,309 1,037,014,540,138 100.0
Table 7: Summary of Local Government Finances in Tanzania, FY 2007-08 (in Tanzanian Shillings)
Source: PMO-RALG, LGA Finance Statistics, FY 2007/08 (LOGIN)

Domestic Resource Mobilisation for Poverty Reduction in East Africa: Lessons for Tax Policy and Administration
271
Budget item Annual budget plan Cumulative outcomeCumulative outcome
(in percent of total)
Property taxes 9,111,691,462 5,756,532,158 7.2
Land rent 1,259,110,907 1,513,956,254 1.9
Produce cess 17,196,826,821 18,533,415,691 23.2
Service levy 15,710,711,169 19,049,030,343 23.9
Guest house levy 1,616,126,009 1,572,255,283 2.0
Licenses 5,669,251,339 5,400,312,870 6.8
Fees, permits & charges 13,235,667,166 13,250,323,825 16.6
Other own revenues 16,337,214,118 14,694,384,575 18.4
Total own revenues 80,136,598,991 79,770,210,999 100.0
As a percentage of centralgovernment tax revenues
2.4%
Table 8: Summary of Local Own Source Revenues in Tanzania, FY 2007-08 (in Tanzanian Shillings)
Source: PMO-RALG, LGA Finance Statistics, FY 2007/08 (LOGIN)
2002/03 2003/04 2004/05 2005/06 2006/07 2007/08
Large taxpayers:Amount of previous year’s arrearscollected/Total amount of taxarrears at beginning of year
49% 15% 33% 83% 100% 100%
Table 9: Amount of previous year’s arrears collected as a percentage of total amount
of tax arrears at beginning of year
Source: TRA Annual Reports
Indicator Tanzania’s measure World’s measure
SSA’s measureLow income econo-
mies’ measure
CITPROD 0.05 0.13 0.09 0.08
PITPROD 0.08 0.14 0.08 0.07
VATGCR 27.00 65.48 42.3 38.45
Table 10: CIT and PIT revenue productivity and VAT gross compliance ratio (2008/09)
Source: http://www.fiscalreform.net/index.php?option=com_wrapper&Itemid=132 [Accessed 2 February 2010].
IndicatorYear
2008 2009 2010
Tanzania’s global ranking - 113 120
Number of tax payments a year 48 48 48
Time taken to comply with the majortax types
172 172 172
Table 11: World Bank Doing Business indicators on the tax burden (Tanzania only)
Source: http://www.doingbusiness.org/ExploreEconomies/?economyid=185 [Accessed 10 March 2010]

Domestic Resource Mobilisation for Poverty Reduction in East Africa: Lessons for Tax Policy and Administration
272
IndicatorRegion
Tanzania OECD SSA
Number of tax payments a year 48 12.8 37.7
Time taken to comply with the majortax types
172 194.1 306.0
Total tax rate as % of profit 45.2% 44.5% 67.5%
Table 12: World Bank Doing Business indicators (2010) on the tax burden
(Tanzania vis-à-vis the OECD and SSA)
Source: http://www.doingbusiness.org/ExploreEconomies/?economyid=185 [Accessed 10 March 2010]
Registered forTotal number Percentage increase
2002/03 2003/04 2004/05 2005/06 2006/07 2007/08 (2002/03 to 2007/08)
TIN 190,000 259.794 318,033 288,680 334,724 398,080 110%
VAT 13,634 15,320 8,010 6,154 7,342 9,036 -34%
Table 13: Growth of registered taxpayers (2002/03 to 2007/08)
Source: TRA Annual Reports
Country YearTax revenue (A)
Estimated poten-tial tax revenue (B) Tax gap (B) – (A)
Tax effort (A)/(B)as a %
As a % of GDP
Kenya2001 17.8 20.8 3.0 85.5
2005 18.6 20.6 2.0 90.5
South Africa2001 24.8 26.7 1.9 92.9
2005 27.4 27.0 -0.4 101.4
Rwanda
2001 10.7 20.9 10.2 51.2
2005 12.2 21.4 9.9 57.0
2008 13.5 22.0 8.5 61.4
Tanzania
2001 9.7 20.0 10.3 48.5
2005 11.2 20.5 9.3 54.4
2008 15.0 20.9 5.9 71.6
Uganda2001 10.4 19.2 8.8 54.3
2005 11.8 19.5 7.8 60.3
Table 14: Tax gap and tax effort for select EAC countries and South Africa (select years)
Source: IMF (2009b)
Domestic Resource Mobilisation for Poverty Reduction in East Africa: Lessons for Tax Policy and Administration
273
Annex 7.4: Changes to the administrative systems
at TRA
27 In its 2007/08 annual report, TRA reports that it received around 1,500 taxpayers’ VAT returns through the eFiling system. In 2008/09, the total num-ber of electronic submissions rose to around 4,300.
In 2004/05, TRA developed an information systems
policy and strategy to guide its modernisation effort.
Since then, TRA has introduced the following informa-
tion systems:
• The Automated System for Customs Data ++
(ASYCUDA++) in customs for direct trader input. In
addition, to support the effective sharing of informa-
tion and intelligence between the revenue authorities
of the EAC, in 2007/08 TRA commenced the
implementation of the Revenue Authority Digital Data
Exchange system. RADDEX is operational in Kenya,
Rwanda and Uganda, and being piloted in Burundi;
• An automated Central Motor Vehicle Registration
System (CMVRS);
• ITAX (a bespoke system) in domestic revenue, which
has been strengthened and enhanced over the
years. ITAX is used for: revenue accounting and
reporting; debt management; audit; electronic regis-
tration of taxpayers; and more recently, electronic
filing (eFiling)27. In its 2007/08 annual report, TRA
reports that it received around 1,500 taxpayers’ VAT
returns through the eFiling system. In 2008/09, the
total number of electronic submissions rose to
around 4,300;
• To support management of its finances and human
resource function, TRA uses Epicor and PEODESY
systems respectively;
• To manage storage and retrieval of data collected
for each of the measures, TRA has developed the
TRA Monitoring and Evaluation Database (TRA-
MED);
• To inform policy analysis and research, a data
warehousing system with data from ASYCUDA++,
CMVRS, ITAX, Peodesy, and Epicor has been deve-
loped.
• All regional offices are able to access systems
through an integrated data communication net-
work.
TRA has, in place, a five-year corporate plan with clear
goals, strategies and specific balanced scorecard
measures of performance. To manage storage and
retrieval of data collected for each of the measures,
TRA has developed the TRA Monitoring and Evalua-
tion Database (TRAMED). In addition, to inform policy
analysis and research, a data warehousing system
with data from ASYCUDA++, CMVRS, ITAX, Peodesy,
and Epicor has been developed.

Chapter 8
Uganda

Domestic Resource Mobilisation for Poverty Reduction in East Africa: Lessons for Tax Policy and Administration
276
Summary of Key Findings
Context-Political economy
and fiscal legacies
The first two and a half decades of Uganda’s indepen-
dence in 1962 were marked by political turmoil and war,
including the nine-year rule of the dreaded dictator Idi
Amin from 1971 to 1979. During that period, economic
performance was either dismal or negative. Things,
however, began to change for the better after the
National Resistance Movement (NRM) regime of Presi-
dent Yoweri Museveni came to power in 1986. Since
then, the NRM Government ushered in an era of peace,
political and economic reforms, and sustained socioe-
conomic development. After assuming power, the
regime quickly focused on fixing the moribund economy
by embracing Structural Adjustment Programmes.
(SAPs). The programmes’ implementation extended into
and dominated the 1990s (AFRODAD, 2007), entailing
wholesale economic liberalisation. In return, the regime
was lavished with generous assistance by the Bretton
Woods Washington twins and its development partners.
From the late 1980s, Uganda entered its current trajec-
tory of macroeconomic and fiscal stability, and poverty
reduction. From 1987 to 2000, per capita GDP grew at
an average annual rate of just over 3%, and it rose to
about 4% in 2001 and 8.7% in 2007/08. According to
the IMF (2009a), aggregate economic growth in the past
five years has been at a particularly higher rate -
approaching an annual average of 9%. Yet, according to
the same source, in spite of two decades of steady
growth, Uganda’s economy remains more reliant on
subsistence agriculture and correspondingly, less on
high-productivity manufacturing. It appears that one
major obstacle to Uganda’s economic development has
been its limited investments in infrastructure in the past.
As elaborated below, DRM in Uganda has clearly lagged
well behind both economic growth and far reaching tax
administration reform efforts for many years. A review of
political economy legacies suggests that despite strong
support from the NRM regime for DRM, its leadership
may have undermined tax revenue collection through ad
hoc decisions relating to tax policies and administration.
Also, the tax base remains narrow. Furthermore, “tax
morale” is undermined by widespread public perception
that public services are predominantly funded with
external resources, and a prevailing sense that due to
corruption and mismanagement, Government of
Uganda (GoU) has not been delivering value for money
with resources made available to it.
The commercial production of newly discovered oil
reserves, which are projected to commence by 2015,
will be the most critical variable in Uganda’s fiscal
governance trajectory in the medium-to-long term.
Needless to say, oil revenues will vastly enhance
domestic resources. This development will, in turn,
generate four significant outcomes: (i) whether or not
these revenues are managed by the Uganda Revenue
Authority (URA), it will impact either positively or negati-
vely on its capacity and performance to collect other
revenue; (ii) oil revenues may also serve to reduce
Uganda’s reliance on external resources, which will
redefine relationship between Uganda and the interna-
tional development organisations (IDOs). (iii) there is a
distinct prospect that new revenue streams will, in all
probability, accelerate economic modernisation and
poverty reduction; and (iv) availability of this new resource
and the concurrent modernisation efforts may, in the long
run, dampen the political leadership’s propensity for
making ad hoc awards of tax incentives and exemptions.
Therefore, barring the unforeseen or the tragedy of the so
called “oil curse”, Uganda’s fiscal governance trajectory
looks exponential.
Tax reforms: Sequencing,
implementation and results
In the early years of independence, Uganda relied on
unified tax policies and an administrative system jointly

Domestic Resource Mobilisation for Poverty Reduction in East Africa: Lessons for Tax Policy and Administration
277
administered by the three EAC founding members.
Following the enactment of the Income Tax Decree No.
1 of 1974, there were no major changes to the tax
system until the 1990s and 2000s when GoU:
• Established URA (in 1991) in an attempt to better
coordinate tax administration and enhance tax
revenue collection;
• Introduced the Value Added Tax (VAT) in 1996
despite popular resistance;
• Promulgated a new Income Tax Act in 1997with the
objectives of levying tax on a residence basis, ensu-
ring simplicity and promoting a flat tax rate scale;
• Abolished export taxes and embarked on tariff
reform whose policy objectives evolved around
simplification of the tax structure; and
• Introduced major policy changes in the decade up
to 2007/08, primarily around VAT and income tax.
A series of administrative reforms took place following
the establishment of URA. The reform focus in these
early years was on breaking the culture of corruption by
screening staff, strengthening URA’s capacity (Fjeldstad,
2005) and, to a limited extent, modernising systems (IMF,
1999). However, corruption remained pervasive, leading
to the appointment of an independent inquiry into URA
led by Justice Julia Sebutinde in 2002. The inquiry’s
report was, however, questioned by Parliamentarians,
and quashed by the High Court in 2004 (Fjeldstad,
2005). Still, in 2004/05 GoU appointed a new Commis-
sioner General and Board. Since then the URA has
undergone: (i) structural and further institutional reforms;
and (ii) a modernisation programme. As part of its post-
2005 reforms, structural changes evolved around
streamlining URA’s structure, which had become top
heavy as well as hierarchical. Thereafter, URA’s mana-
gement also addressed the problem of staff integrity, and
embarked on modernising the agency. Key results under
the modernisation phase include:
• Business processes in customs and domestic tax
have been reengineered, new procedures drawn
up, and staff retrained;
• Certain aspects of URA’s corporate services have
been modernised;
• To enhance integrity, a revised staff code of conduct
and whistle-blowing policy were developed in 2009;
• URA has disseminated a taxpayers’ charter with
clear standards of service; and
• Various publications on tax have been translated into
eight languages, and Public and Taxpayer Educa-
tion services regularly hold tax clinics to obtain feed-
back on taxpayers’ needs.
It is noteworthy that the post-2005 reforms have focused
primarily on tax administration. This is not surprising
because Uganda is yet to undertake rigorous and
comprehensive research and analysis of the tax system,
as was the case with the work of the Katz Commission
in South Africa.
Domestic revenue performance
Uganda made considerable improvements in domestic
revenue generation in the first seven years following
URA’s creation -- with tax and non-tax revenue collec-
tions rising by 5.1 percentage points to 11.9% of GDP in
1998/99. The reform of tax administration, as well as
introduction of VAT and Income Tax legislation contribu-
ted to a significant increase in domestic revenue
collections in the late 1990s.
In addition, since 1991/92, non-tax revenues have
contributed an average of 7% of total domestic revenue

Domestic Resource Mobilisation for Poverty Reduction in East Africa: Lessons for Tax Policy and Administration
278
collected each year. It is noteworthy that from 2002/03,
URA started to collect some non-tax revenues on behalf
of ministries and departments including: passport and
migration fees; company regulation fees; and mining fees
and royalties.
Still, in the current decade, domestic revenue growth
has not been as high as anticipated, levelling at 12.8%
of GDP in 2007/08; and revenue collections stagnated
due to smuggling and tax evasion. The growing level of
incentives and exemptions granted in recent years has
further undermined Uganda’s revenue potential, which
perhaps explains the sizeable tax gap.
Challenges and issues
Considerable efforts have been made to modernise the
URA, with a view to realising its vision “to be a model
for best practices and innovation in revenue services”.
However, the following major challenges will need to
be addressed for this vision to be realised and sustai-
ned:
• Ensuring efficacy of tax incentives and exemptions:
According to some key informants, tax revenue as a
percentage of GDP could easily go up to 16%, if
some of the revenue negating measures, particularly
incentives and exemptions, were removed;
• Widening the tax base: Predominance of a large
informal sector outside the tax net, coupled with
under declarations, evasion and smuggling, is a big
challenge;
• Developing and maintaining capacity for tax policy
management: There is a view that more could be
done to build and sustain tax policy capacity in
Uganda. Key informants proposed that one way of
achieving this would be to promote knowledge
sharing in the region. Another approach would
involve transferring staff between the Ministry of
Finance, Planning and Economic Development
(MoFPED) and URA;
• Building and sustaining management capacity in
URA: Senior managerial positions have fixed term
limits. Also remuneration has not been adjusted for
senior staff and personnel in professional and
technical positions since 2004/05. As a result, URA
has not been able to retain institutional knowledge
and specialised skills;
• Minimising corruption in tax collection: In 2009,
URA was ranked as the second and seventh most
corrupt public institution in Uganda, and in the three
EAC countries (Kenya, Tanzania and Uganda),
respectively (Transparency International, 2009).
Furthermore, the URA-commissioned 2008 integrity
baseline survey , suggests that corruption is still a
daunting challenge; and
• Ensuring harmonised, systematic and policy-led
regional integration measures: It is noteworthy that
there are demands by Uganda-based businesses
to extend the duty exemption period beyond 2010
for importation of key inputs and materials under
the Duty Remission Scheme. In addition, Uganda’s
tax regime is not fully in sync with the systems in
other EAC partner states.
Lessons learned
There are three key lessons that can be drawn from
Uganda DRM experience:
• It is crucial to insulate the Autonomous Revenue
Authority (ARA) from politics: It would seem that
URA’s staff remuneration has been politicised in
recent years, and therefore pay has not kept up
with packages offered by other organisations in the
market seeking to recruit similar skills. Therefore,
URA has suffered staff losses in critical areas:
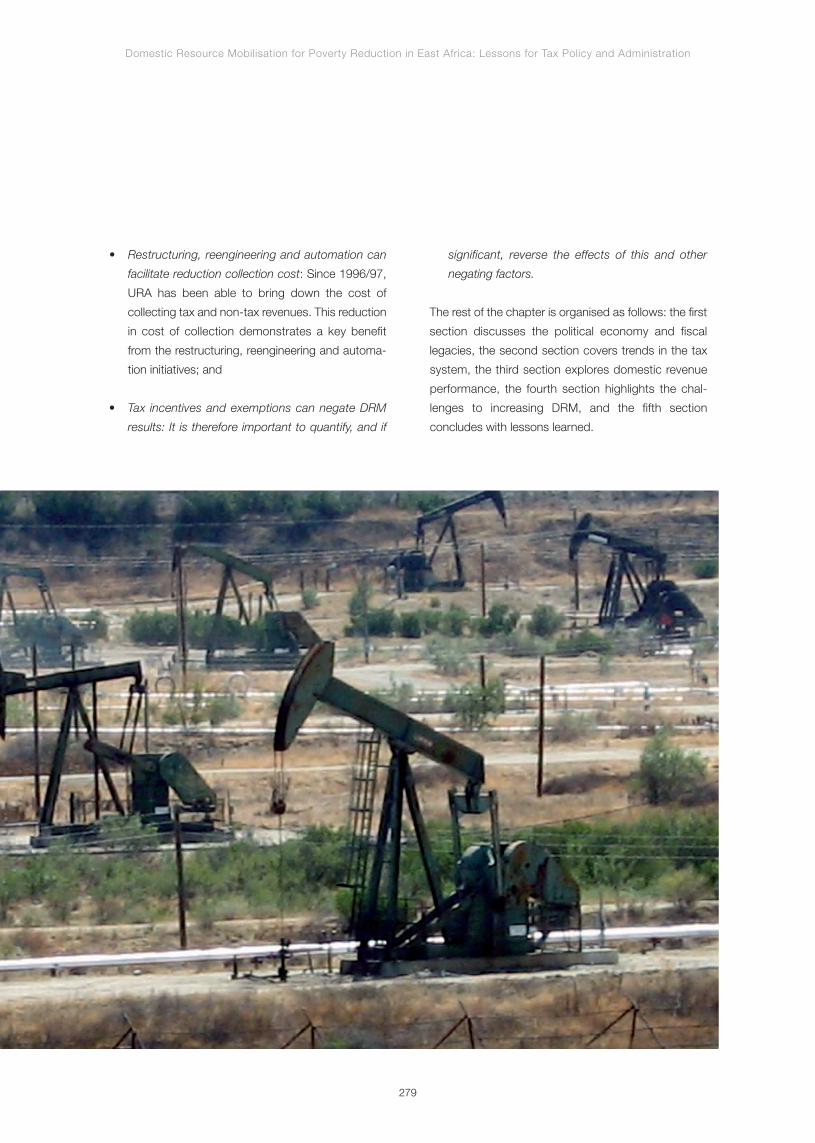
Domestic Resource Mobilisation for Poverty Reduction in East Africa: Lessons for Tax Policy and Administration
279
• Restructuring, reengineering and automation can
facilitate reduction collection cost: Since 1996/97,
URA has been able to bring down the cost of
collecting tax and non-tax revenues. This reduction
in cost of collection demonstrates a key benefit
from the restructuring, reengineering and automa-
tion initiatives; and
• Tax incentives and exemptions can negate DRM
results: It is therefore important to quantify, and if
significant, reverse the effects of this and other
negating factors.
The rest of the chapter is organised as follows: the first
section discusses the political economy and fiscal
legacies, the second section covers trends in the tax
system, the third section explores domestic revenue
performance, the fourth section highlights the chal-
lenges to increasing DRM, and the fifth section
concludes with lessons learned.

Domestic Resource Mobilisation for Poverty Reduction in East Africa: Lessons for Tax Policy and Administration
280
Context – Political economy and fiscal legacies
NRM’s drive for economic
recovery and liberalisation
The first two and a half decades of Uganda’s indepen-
dence were marked by political turmoil and war,
including a military coup in 1971 that installed Idi Amin in
power. His nine-year rule (1971-1979) was considered
the worst era, as he “became known as the ‘Butcher of
Uganda’” (The Independent, 2003). Thereafter, following
the 1979-80 war with Tanzania, Amin was deposed, and
the Uganda National Liberation Front under President
Binaisa seized power. He ruled for two years and was
overthrown by President Milton Obote, who helmed for
five years (1980-1985). He too was ousted by a military
junta led by the National Resistance Movement (NRM),
which seized power in 1986.
The NRM, under President Yoweri Kaguta Museveni, has
ruled Uganda ever since virtually unchallenged. Since
assuming power, NRM’s 10-point agenda, which until
recently was the main ideology behind the movement,
placed a strong focus on economic recovery and libera-
lisation. However, only a year after taking over, NRM
embraced the IMF-World Bank prescribed structural
adjustment programmes (SAPs) and economic liberali-
sation policies as it recognised “the need for increased
external support” (APRM, 2009). Accordingly, GoU
embarked on rebuilding the economy, which had virtually
collapsed as a result of prolonged economic mismana-
gement and wars.
Macroeconomic, fiscal stability
and steady growth from
the 1980s
“The NRM and President Museveni provided the leader-
ship and governance discipline that helped turn around
the fortunes of the country” (Tumushabe, 2009). The
regime embraced SAPs, “whose implementation exten-
ded into and dominated the 1990s” (AFRODAD, 2007).
Under SAPs, GoU liberalised: prices and trade in the
domestic market; foreign exchange; and payments.
These measures enabled Uganda to diversify its exports.
Furthermore, under SAPs, GoU restructured and dives-
ted its holdings in private enterprises. It was also able to
contain inflation and promote a rise in interest rates
through prudent monetary policies (IMF, 1999). In return,
Bretton Woods Institutions and its development partners
lavished the regime with generous assistance.
By the mid-1990s, Uganda entered into a trajectory of
macroeconomic and fiscal stability. From: 1987 to 1996,
per capita GDP grew at an annual average rate of 3%;
and 1996 to 2000, average GDP per capita remained at
around the same level. It is noteworthy that between
2001 and 2007, Uganda’s average GDP per capita rose
to around 4%. According to the IMF (2009a), in the last
five years, its average annual growth has been almost at
9%.
Between 1990/91 and 2005/06, the structure of
Uganda’s economy had undergone significant changes.
The services sector overtook the agriculture to become
the largest contributor to the economy. Industry’s share
in GDP also rose, but since 2001/02 its share in total
output has remained flat. Available estimates indicate
that the contributions by the three sectors remained at
around the same levels in 2009 – agriculture (22.2%),
industry (25.1%) and services (52.8%)1. Selassie (2008)
suggests that industry’s contribution could be much
higher if more investment had been made in infrastruc-
ture – in particular, “cheap and effective infrastructure is
a pre-requisite for industrialization”. To this end, GoU is
championing the Bujagali hydropower project schedu-
led to be commissioned in 2011.
Uganda’s economic “growth has contributed to a sharp
decline in poverty from 56% of the population in 1992/93
to 31% in 2005/06” (IMF, 2009a). This decline is attribu-
1 See https://www.cia.gov/library/publications/the-world-factbook/fields/2012.html [Accessed 26 March 2010].
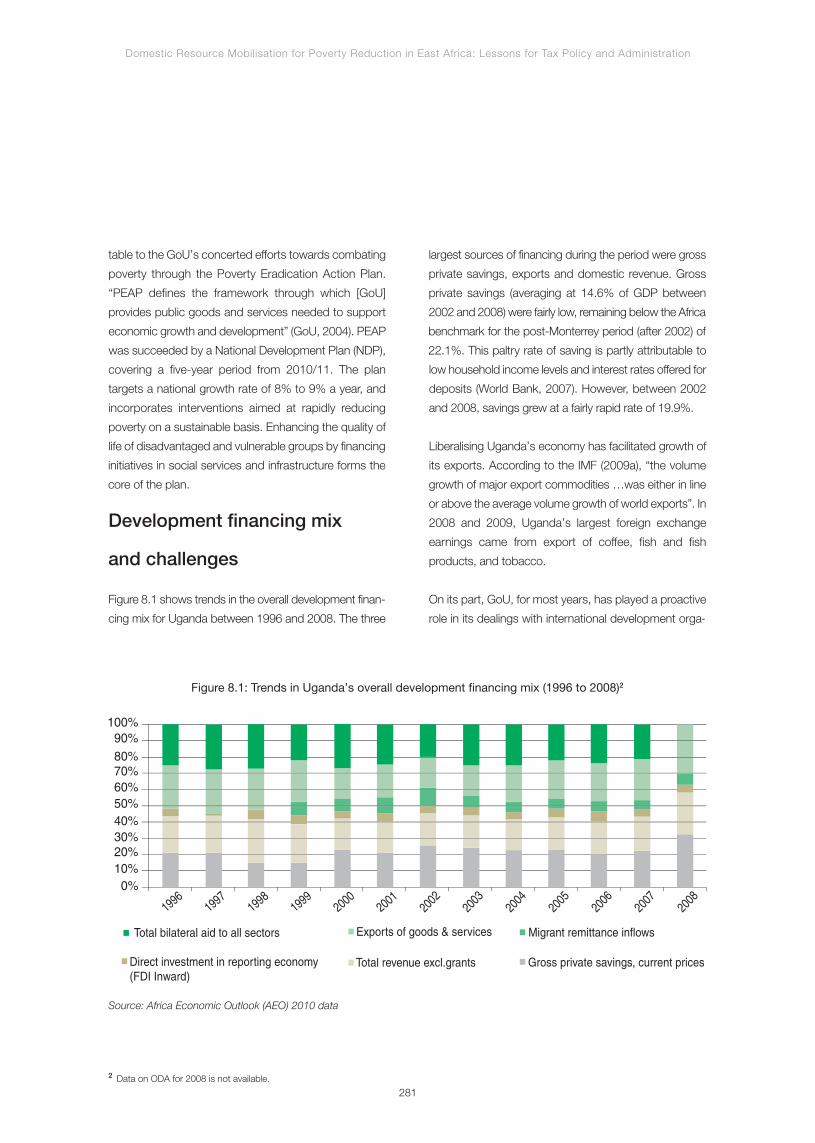
Domestic Resource Mobilisation for Poverty Reduction in East Africa: Lessons for Tax Policy and Administration
281
table to the GoU’s concerted efforts towards combating
poverty through the Poverty Eradication Action Plan.
“PEAP defines the framework through which [GoU]
provides public goods and services needed to support
economic growth and development” (GoU, 2004). PEAP
was succeeded by a National Development Plan (NDP),
covering a five-year period from 2010/11. The plan
targets a national growth rate of 8% to 9% a year, and
incorporates interventions aimed at rapidly reducing
poverty on a sustainable basis. Enhancing the quality of
life of disadvantaged and vulnerable groups by financing
initiatives in social services and infrastructure forms the
core of the plan.
Development financing mix
and challenges
Figure 8.1 shows trends in the overall development finan-
cing mix for Uganda between 1996 and 2008. The three
largest sources of financing during the period were gross
private savings, exports and domestic revenue. Gross
private savings (averaging at 14.6% of GDP between
2002 and 2008) were fairly low, remaining below the Africa
benchmark for the post-Monterrey period (after 2002) of
22.1%. This paltry rate of saving is partly attributable to
low household income levels and interest rates offered for
deposits (World Bank, 2007). However, between 2002
and 2008, savings grew at a fairly rapid rate of 19.9%.
Liberalising Uganda’s economy has facilitated growth of
its exports. According to the IMF (2009a), “the volume
growth of major export commodities …was either in line
or above the average volume growth of world exports”. In
2008 and 2009, Uganda’s largest foreign exchange
earnings came from export of coffee, fish and fish
products, and tobacco.
On its part, GoU, for most years, has played a proactive
role in its dealings with international development orga-
2 Data on ODA for 2008 is not available.
100%
Migrant remittance inflows
Total revenue excl.grants Gross private savings, current pricesDirect investment in reporting economy(FDI Inward)
Exports of goods & servicesTotal bilateral aid to all sectors
80%70%
90%
60%
40%50%
10%0%
20%30%
19961998
19992000
2001
2002
2003
2004
2005
2006
2007
2008
1997
Figure 8.1: Trends in Uganda’s overall development financing mix (1996 to 2008)2
Source: Africa Economic Outlook (AEO) 2010 data
Domestic Resource Mobilisation for Poverty Reduction in East Africa: Lessons for Tax Policy and Administration
282
nisations (IDOs). Between 1996 and 2008, official
development assistance (ODA) was a significant source
of development financing, accounting for an average of
10.7% of GDP. Most ODA financing went towards
supplementing domestic resources and debt to finance
public expenditure, which hovered around 17.5% to
17.8% of GDP between 1992/93 and 2007/08, except
in select years when it rose above 20% (e.g., 23.8% in
2002/03). Through creation of the Poverty Action Fund,
Uganda convinced its development partners to provide
substantial funding for its socio-development pro-
grammes for many years. In addition, Ugandapioneered
access to poverty reduction support credits and other
substantial support in the decade just ending.
Uganda’s fiscal deficit rose in the early years (e.g., to
11.5% in 2003/04 from 6.5% in 1997/98) due to “the
absolute expansion in the size of the government
budget”, which was financed largely by external borro-
wing (Ayoki et al, 2008). However, it is noteworthy that
Uganda was a front runner in accessing debt relief under
the Heavily Indebted Poor Country (HIPC) initiative. The-
refore, the country has not run short of resources to
finance its development agenda.
Also, Uganda, to a limited extent, benefited in recent
years from foreign direct investment (FDI), which
accounted for an average of about 3% of GDP between
1996 and 2008. More recently, the discovery of oil near
Uganda’s Lake Albert, is being described as the most
important development in recent times with prospects
for high FDI flows in the medium term.
Political economy dynamics
underpinning DRM
The synopsis of the political economy legacies that have
impacted DRM, as presented in the following subsec-
tions, is based on Brautigam’s (2008) analytical frame-
work3. It consists of five facets: (i) level of economic de-
velopment and economic structure; (ii) societal
factors: culture, values, trust and ‘tax morale’; (iii) war
and taxes: bureaucratic modernisation as a response to
threat; (iv)political institutions and tax systems; and (v)
taxation and fiscal contract.
The economic structureis predominantly agrarian-drivenand hard to tax
In spite of two decades of steady growth, Uganda’s
economy “remains more reliant on subsistence agricul-
ture and correspondingly less on high-productivity
manufacturing”4 (IMF, 2009a). Furthermore, as observed
in a DIFD (2008) publication:
“Agriculture by nature is difficult to tax, and so far
the…sector has not made any significant contribution
to government revenue. Even with the commercialisa-
tion drive that is underway, it is not expected that agri-
culture can be relied on for tax revenue in near future.
There are also views ... that taxing [farmers] will cripple
agriculture (discourage investment) and have disastrous
economic fallout for farmers who are already facing
hardship”
It appears that one major obstacle impeding Uganda’s
economic recovery has to do with limited investments in
infrastructure development. In spite of liberalisation, only
a few large corporations have invested significantly in the
economy. For many years, investments in physical infra-
structure were limited to relatively small projects in social
services delivery, and rehabilitation and maintenance of
the pre-existing energy and transport infrastructure.
Large investments in transport, energy, property deve-
lopment, agricultural production and agro-processing
have lagged behind for most of the years. Indeed, it is
3 Brautigam’s framework is adopted because compared to others that were examined, it is judged to be more comprehensive and elegant. However,like most others, its historical perspective derives too much from the emergence of the modern European state to be linearly applied to states that arelegacies of colonial rule, such as Uganda.4 Although over 70% of Uganda’s population is employed directly or indirectly in agriculture, in 2009, the services sector contributed close to 50% ofGDP.
Domestic Resource Mobilisation for Poverty Reduction in East Africa: Lessons for Tax Policy and Administration
283
only in the past five years that substantial investments in
energy, mining, tourism and roads have been made.
However, Uganda has just entered a threshold of fiscal
transformation, following discovery of substantial oil
deposits, which have attracted considerable invest-
ments in the last few years. Initial oil production is
anticipated in 2011, and full commercial potential, and
thereby revenue streams for government financing, are
expected in 2015. “The country expects to earn US$2
billion a year from oil by 2015” (The Economist, 2010).
It is, however, not clear at the moment what the full
implications for Uganda’s economic structure and
development financing mix will be, given the imminent
substantial oil revenues.
A culture of conflict and distrust,which contributes to low ‘tax morale’5
Many important facets of traditional culture among
Uganda’s diverse communities have withstood the
onslaught of western culture. In this regard, it has been
suggested that the well-entrenched native culture
constrains its transition to consumerism associated with
economic development in the same way, as it has been
observed in neighbouring Kenya.
As a consequence, many wealthy Ugandans have
resisted full entry into the modern monetary system. In
other words, a reliance on informal institutions for
business transactions remains comparatively high.
Furthermore, years of civil war and ethnic tensions
have given rise to a culture of conflict and distrust
among various communities. For instance, certain
sections of the society consider the ruling NRM to be
autocratic. In addition, over the past decade, GoU has
been intermittently bedeviled by high-profile cases of
public expenditure scandals and corruption in the
public service. As a result, trust in government, and
between communities, is low. This perhaps explains
why tax morale in the society is low.
Modernisation of the tax administrationwas a high priority following the warsthat brought NRM to power
In the decade following independence, Uganda
benefited from a robust revenue mobilisation bureau-
cracy, jointly developed by the defunct EAC
(1967-1977). The foundations of these structures
were inherited from the colonial East African Common
Services Organisation. The collapse of the EAC in the
late 1970s proved to be disruptive to the development
of the revenue administration system. The decade of
civil war that followed further exacerbated that
disruption.
The final days of the Amin regime were epitomised by his
declarations of war against both Kenya and Tanzania. “He
clashed with President Jomo Kenyatta after making
absurd territorial claims to western Kenya and in 1978
made the mistake of declaring war on Tanzania” (The
Independent, 2003). To finance these wars, Amin had stri-
ved to enter into alliances with rich Arab regimes, and, to
an extent, the then Soviet Union. Therefore, his regime did
not give due attention to DRM, and development of an
enabling bureaucracy. Therefore, subsequent short-lived
regimes, as well as, the NRM did not inherit a viable tax
administration.
After its victory, NRM accorded high priority to resource
mobilisation aimed at modernising the economy. Also,
since the NRM was not democratically elected, the
expansion and intensification of basic social services
were central to its quest for earning legitimacy among
the people. It is therefore no wonder that the NRM
5 In a society where “tax morale” is high, there are low levels of tax evasion and avoidance. It is only in a social culture where citizens generally appre-ciate their responsibility for sustaining state services and where they have a trust in their state institutions and leaders that “tax morale” evolves.
Domestic Resource Mobilisation for Poverty Reduction in East Africa: Lessons for Tax Policy and Administration
284
regime was a trail blazer among the countries in the
region in establishing the Uganda Revenue Authority
(URA), as an autonomous revenue authority (ARA) in
1991, for accelerating rapid growth in DRM.
Political support for URA’s autonomyhas waivered in recent years
Apparently, the NRM political elite, led by President
Museveni, strongly backed the establishment of URA as
an autonomous and integrated agency (Fjeldstad, 2005).
The NRM leadership collaborated closely with, and took
advice, from the Bretton Woods Institutions and the
British Government, which provided substantial initial
technical support. At that point, there was a general
consensus about the need to insulate URA from both
bureaucratic and political interference. This explains why
two Commissioners General of URA (1991-1997, 2001-
2004) were expatriates. In addition, several top mana-
gement positions were also filled by expatriates and
funded by donors. President Museveni is cited to have
openly hailed the role of the expatriates in ensuring
professionalism of the agency.
However, there were serious distrust and conflict
between URA and the top political leadership, including
those in MoFPED. When VAT was introduced, URA
staff were suspected of encouraging resistance by the
general public (Therkildsen, 2004). Subsequently, with
an explicit order from the President in 1998, MoFPED
moved to curtail the mandate and administrative
autonomy of the URA’s Board (Fjeldstad, 2005). Since
then, URA has remained prone to close oversight and
patronage by the political leadership.
In the latter context, it is also significant that political
leadership in Uganda has, over the years, intervened
on an ad hoc basis in matters relating to tax policies
and administration. In particular, many tax incentives
and exemptions have been imposed on URA by politi-
cal leaders, who have nothing to do with formal tax
policy formulation and administration processes.
There is lack of a fiscal contractbetween GoU and its citizens6
The opportunities for even a semblance of a fiscal
contract between Uganda’s taxpayers and the Govern-
ment/URA have been severely curtailed in at least three
respects. First, so far, the tax base remains narrow, and
taxpayers are largely confined to a relatively small
number of private sector enterprises, government and
importers. The popular resistance to the introduction of
VAT in 1996 reflected the absence of a fiscal contract.
Yet since then, there is no evidence of any concrete
initiatives to develop one. Such an initiative would have
to be led by the political leadership.
A second factor is the success of the NRM regime in
financing a large proportion of public expenditure with
external resources. Over the past two decades, donor
support has accounted for about 20% to 50% of the
public expenditure budget.
A third factor arises from a prevailing sense amongst
taxpayers and potential taxpayers that due to corrup-
tion and mismanagement, Government has not been
delivering value for money with resources made availa-
ble to it. According to a publication by the Private Sec-
tor Foundation of Uganda (2009), “85% of both
taxpayers and professionals believe [low compliance is]
…the key cause of low [DRM]… Most respo
dents…were generally pessimistic [about] how funds
are used”. It is no surprise therefore that the Minister of
Finance, Planning and Economic Development in her
2009/10 budget speech mentioned the problem of
compliance. Specifically, “compliance remains a chal-
lenge, as we undertake reforms in tax administration”.
6 Fiscal contract has its genesis in agreements between European monarchies and the propertied class and merchants that the latter would contributeto state coffers, especially to fund war in return for specific benefits. In modern times, a fiscal contract would be characterised by government pledgesof specific socioeconomic benefits to justify taxation. This is a more realistic proposition in a democratic dispensation.

Domestic Resource Mobilisation for Poverty Reduction in East Africa: Lessons for Tax Policy and Administration
285
Fiscal governance drivers,
results and trajectory
The NRM regime’s legitimacy has remained predicated
more on development results than on liberal democra-
tic ideals. Accordingly, President Museveni has been
preoccupied with expanding access to public service
delivery (including infrastructure development) and
economic modernisation. Thus, on one hand, the
demand for ever expanding fiscal space to meet public
service delivery targets has been sustained over the
years. On the other, the President is personally
involved in the extensive award of tax incentives and
exemptions to potential investors on an ad hoc basis
((Mwenda and Atuhaire, 2006); (Sseppuya, 2005)).
Fortunately for Uganda,external resources have been
available to close the financing gap in successive years.
The persistent large gap between domestic revenues
and the public expenditure framework has given ample
room for IDOs to exercise considerable influence in
Uganda’s fiscal governance. For example, according to
Therkildsen (2004), in addition to their involvement in
economic policy:
“Donors’ fingerprints on tax policy and administration are
obviously numerous and deep… [they] participate in
setting revenue targets…[This involvement] has [forced]
URA to concentrate on the larger known taxpayers”.
Ayoki et al (2008) suggest that “high levels of develop-
ment aid [could] be a…disincentive to making full use of
domestic resources for revenue generation”. The re-
cent African Peer Review Mechanism (APRM) (2009)
report on Uganda is another source that confirms that
excessive reliance on external financing is an important
fiscal governance driver in Uganda in that it “impinges
on the sovereignty of the country and constrains its
economic budgetary choices”. This concern has been
previously raised by Uganda’s Members of Parliament,
prompting GoU to initiate a reduction in aid contribu-
tions to its budgets, and ambitious targets to grow do-
mestic resources.
The discovery of oil has injected a new dynamic into
Uganda’s fiscal governance. Already, there is clamour
for control or influence on access and use of the oil
revenues. Also, aspirations for the rapid growth in
public service delivery and poverty reduction have been
considerably raised by the prospect of oil wealth – “Oil
executives and loyalists of Uganda’s President…say
the bonanza offers a chance to overhaul the country’s
rickety infrastructure and to train a professional
workforce” (The Economist, 2010). As the IMF (2009a)
observes, there is a case for fiscal restraint to curtail
pressure to spend when GoU starts to receive revenues
from oil. Therefore, to counter this risk “a specific line on
oil will be introduced in the National Accounts and
incorporated into the Medium Term Fiscal Framework”.
The management of the imminent substantial oil reve-
nues will be the most critical variable in Uganda’s fiscal
governance trajectory in the medium-to-long term.
There appears to be little doubt that in five years time,
these revenues will vastly enhance domestic resources.
This development will, in turn, spawn four major
outcomes. First, whether or not these revenues are
managed by URA will impact either positively or
negatively on its capacity and performance to collect
other revenue. Second, oil revenues may also serve to
reduce Uganda’s reliance on external resources. As a
consequence, relationship between Uganda and IDOs
will be redefined. Third, there is a distinct prospect that
new revenue streams will, in all probability, accelerate
economic modernisation and poverty reduction efforts.
Fourth, availability of this new source of resources, and
the concurrent modernisation efforts may, in the long
run, dampen the prevailing propensity of political leaders
to make ad hoc awards of tax incentives and exemp-
tions7. Therefore, the fiscal governance trajectory for
Uganda holds a lot of promise.
7 There is a view that the discovery of oil could, in the short term, lead the scaling-up of exemptions (through concessions).

Domestic Resource Mobilisation for Poverty Reduction in East Africa: Lessons for Tax Policy and Administration
286
Trends in the tax system
Changes in tax policies over
the years
In the early years of independence, Uganda relied on
unified tax policies and an administrative system jointly
administered by the three EAC founding members.
However, there were changes even before the collapse
of the EAC. In 1971 and 1972, the three governments
held discussions “on how to improve income tax collec-
tion in a manner equitable” to all, leading to a decision to
“place the responsibility of income tax in the hands of
each national government” (Osoro, 1993). As a conse-
quence, Uganda legislated its own Income Tax Decree
No. 1 of 1974 “which [over the next twenty years] was
frequently and extensively amended” (Holmes, 2006).
There were no major changes to the tax laws until the
1990s. Thereafter, there were two main episodes in tax
policy reforms as presented below.
Fundamental changes to tax policyin the 1990s
Despite popular resistance, Uganda was one of the first
EAC countries to introduce VAT in July 1996 at a rate
of 17%, replacing the sales tax and commercial trans-
action levy (CTL). According to the IMF (1999), copies of
the sales tax and CTL legislation were in limited supply.
Furthermore, legislation had undergone numerous
amendments, and only a few were conversant with their
requirements. The new VAT law: was “generally easier to
understand and interpret, [and therefore] huge strides
were made to help compliance and improve transpa-
rency”; and curtailed the Finance Minister’s power to
grant exemptions on a discretionary basis (IMF, 1999).
Under the Act, certain supplies were VAT exempt (e.g.,
milk, maize, dental, medical, financial and insurance
services, passenger transportation etc.).
It was not until 1997 that the GoU promulgated a new
Income Tax Act with the objectives of levying tax on a
residence basis, ensuring simplicity and promoting a flat
tax rate scale (Holmes, 2006). Again, this new act cut
the Minister’s power to grant discretionary exemptions.
It also: provided for accelerated and simplified deprecia-
tion allowances on productive assets; removed tax
holidays offered under the investment code; introduced
a presumptive tax for businesses with a turnover of less
than UShs50 million; eliminated exemptions (e.g., for
public servants and parastatals) and/or made them more
stringent; introduced a capital gains tax on certain busi-
ness transactions; and streamlined the withholding tax
regime (IMF, 1999).
During the 1990s, as a means of promoting trade,
GoU gradually abolished export taxes (Cawley and
Zake, 2010). It also embarked on tariff reform whose
policy objectives evolved around simplification of the
structure, reducing the number of rates, removal of
exemptions and elimination of bans on importation of
certain goods (e.g., cigarettes, beer, sodas etc.).
“However, as import duty rates were being lowered,
ad valorem excises were imposed…with the dual ob-
jective of allowing some degree of protection” for local
firms and recouping revenue foregone (IMF, 1999).
Major tax policies from 2000 to 2008
The major tax policy changes in the decade until
2007/08 have primarily evolved around VAT and
income tax. During this period, the main policy changes
around VAT were the following:
• To encourage development of Information and
Communications Technology (ICT) services, GoU
removed VAT on computers and computer software
in 2002/03 and 2003/04 respectively;
• To minimise any revenue leakages arising from tax
evasion, a new rule, requiring GoU to only issue
contracts to suppliers who are VAT registered,
became effective in 2002/03;

Domestic Resource Mobilisation for Poverty Reduction in East Africa: Lessons for Tax Policy and Administration
287
• To widen tax base: accommodation in hotels and
tourist venues, which were previously exempt from
VAT, became taxable at the standard VAT rate from
2003/04;
• In 2004/05, the VAT Act was amended to exempt
constructors of roads and bridges, and providers of
consulting services to such construction works.
This had the effect of reducing prices charged to
GoU for road construction, as there was no longer
any VAT element;
• In line with GoU’s deliberate policy of increasing the
proportion of national budget that is financed by
domestic revenue, the standard VAT rate went up
to 18% with effect from 1 June 2005;
• In 2006/07, GoU zero rated VAT on Liquid Petro-
leum Gas to increase its affordability, given its use
as an alternate energy source for lighting and
cooking. To promote use of condoms in the fight
against HIV/AIDS and animal husbandry, GoU also
exempted contraceptive sheaths and acaricides;
and
• To promote tax morality and enhance revenue
collections, GoU in 2007/08 also offered non-com-
pliant taxpayers an amnesty on penalties and inte-
rest for principal taxes (i.e., under the Customs and
Excise, Income Tax, VAT and Stamps Acts).
Taxpayers were required to voluntarily disclose and
pay their taxes by 31 December 2007.
The major changes to income tax policy since then
include the following:
• In 2001/02, to widen the tax base, interest payable
on Treasury bills became taxable. Likewise, to
promote development of a stock exchange,
expenses relating to initial public offerings became
an allowable tax expense;
• In 2003/04, to promote exports, GoU indicated it
would provide firms operating in export processing
zones with various incentives such as a 10-year
corporate tax holiday, duty exemption on raw
materials, plant and machinery and other inputs;
• In 2005/06, to expand access to finance, interest
earned by financial institutions on loans granted to
persons engaged in the agriculture sector was
exempted from income tax; and
• The tax amnesty of 2007/08 also covered income
tax. Also, to promote exports and thereby stimulate
economic growth in 2007/08. GoU offered various
incentives, including a 10-year tax holiday to com-
panies engaged in value added exports, which is
limited to export of finished consumer and capital
goods.
Changes in customs policies and administration have
been driven by the EAC Customs Management Act of
2004, which underpins the establishment of common
external tariffs (CETs) and elimination of internal tariffs.
It also brought about the harmonisation of customs
principles and procedures, and removal of suspended
duty.
Excise duties are regulated under the Excise Manage-
ment Act of 1970. The duties are levied on beer, wines,
spirits, soft drinks, cigarettes and fuel, which are
manufactured in or imported into Uganda, as well as
mobile airtime. Over the years, there have been modest
increases and decreases in the rates levied on certain
goods and services.
Institutional changes
URA was the second revenue authority to be established
in Africa in 1991, following the enactment of the URA
Act, Cap. 196. URA’s creation was “an attempt to
integrate central government taxes under one manage-

Domestic Resource Mobilisation for Poverty Reduction in East Africa: Lessons for Tax Policy and Administration
288
ment, and to improve revenue collection through
enhanced autonomy, acquisition of skilled staff, increa-
sed integrity and effective use of automated systems”
(Ayoki, 2008). Since its launch, URA’s operations have
been financed by Parliamentary appropriations.
The Authority is led by a Commissioner General who
reports to a Board of Directors. The Board “is [URA’s]
policy-making body and has general oversight” respon-
sibility, and is accountable to the Minister of Finance8.
MoFPED sets URA’s revenue targets on an annual
basis.
Following a restructuring of the URA in 2004, six
departments have been created, which oversee the
day-to-day operations: (i) the Commissioner General’s
office, which, in addition to maintaining executive
control, is charged with managing research and
planning, and corporate and public affairs; (ii) Board and
legal affairs; (iii) collecting and accounting for interna-
tional trade taxes; (iv) registration, audit, assessment,
collection and accounting for domestic revenues; (v)
provision of various corporate services (e.g., finance,
administration, human resources, ICT); and (vi) internal
audit and tax investigations. Also, URA has a training
school, which conducts both technical as well as ICT
courses.
Changes in the administrative
systems
URA employs around 2,000 staff. Under the Act, it has
the freedom to pay its staff competitive salaries. At its
launch, “substantial salary increases to staff that moved
to the URA meant that they were relatively well paid to
start with – by a factor of 8 to 9 – compared to most
public-sector employees” (Therkildsen, 2004). Also,
“bonuses as a percentage of their salaries were a
potential lure when URA exceeded tax collection
targets, but this was only done once, with a 10% bonus
in 1998/99” (Robinson, 2004). Furthermore, there have
been no substantial salary increments for managerial
staff since 2004/05.
The development of URA’s administrative systems has
been guided by a tax modernisation initiative (see
Section on “Reform sequencing, implementation and
results”). The systems that are now operational (also
see Annex 8.4) include:
• A bespoke developed Integrated Tax Administration
System (eTax) in the Domestic Tax Revenue
Department covering all taxes and non-tax
revenues collected by URA. The eTax’s functionality
was recently extended to cover electronic filing
(eFiling) and payments;
• The Automated System for Customs Data ++
(ASYCUDA++) for direct trader input so that impor-
ters can lodge declarations from their bases.
Further, to support effective cargo tracking
between the revenue authorities of the EAC, URA
has implemented the Revenue Authority Digital
Data Exchange (RADDEX) system;
• URA has also recently introduced a call centre with
a toll free line, which operates on weekdays and
responds to any queries lodged at the authority’s
new interactive website (http://ura.go.ug/ura-
web/index.jsp); and
• URAnet for internal communications among staff.
Fiscal decentralisation and
taxation by local governments
Uganda was widely seen as one of the forerunners of
decentralisation in Africa during the 1990s. Decentrali-
sation in Uganda is based on the devolution of powers,
functions and responsibilities to popularly elected local
8 http://www.ugrevenue.com/administration/ [Accessed 28 March 2010].

Domestic Resource Mobilisation for Poverty Reduction in East Africa: Lessons for Tax Policy and Administration
289
governments. Devolution is not only aimed at the current
112 districts in the country (as of August 2010), but also
at the sub-county and other sub-district levels (including
village). Local governments are assigned responsibility
to deliver key social and economic services, including
primary and secondary education; public health;
agricultural extension; roads; and water and sanitation.
Corresponding with the importance of the functions
assigned to them, local governments receive almost
one-third of the country’s public financial resources
(Bitarabeho, 2008; Ministry of Local Government 2009).
In principle, local governments in Uganda are highly
autonomous. In practice, however, they are constrained
by inadequate resource discretion and administrative
re-centralisation9. Own source revenues have declined
considerably over the past 10 years, in large part due
to the abolition of the main local revenue source-- the
graduated tax. As a result, local governments now
receive 90% of their resources in the form of intergo-
vernmental fiscal transfers, overwhelming majority of
which are in the form of conditional grants.
Available local revenue data indicate that own source
revenues for the district level (excluding sub-country
revenues) have decreased not only in relative terms,
but also declined considerably in nominal terms-- from
UShs80.1 billion in 2003/04 to UShs39.5 billion in
2006/07 (Steffensen 2008). The main contributing
factor to the drop in local revenue collection was the
abolition of the graduated tax on 1 July 2005. Also, the
rest of Uganda’s local government revenue system has
been performing poorly, in part due to the tax struc-
ture; for instance, the many tax exemptions in the
property rates have added to the funding gaps
amongst the urban authorities (Steffenson 2008).
A new Local Service Tax (LST) and Local Government
Hotel Tax (LGHT) system was adopted in FY 2008/09,
but implementation of these new revenue sources have
been stymied by numerous technical and political
obstacles. Even when fully implemented, the revenue
yield from these new sources is expected to be limited
compared to the graduated tax system. A Local
Government Finance Commission survey in 2009/10
established that local governments collected UShs4.8
billion from LST and LGHT in 2008/09 compared to the
projected UShs67 billion that the taxes were estimated
to contribute to local government revenues annually.
Reforms sequencing, implementation and results
A series of administrative reforms took place following
the establishment of URA. The reform focus in the early
years was on breaking the culture of corruption by
screening staff, strengthening URA’s capacity (Fjelds-
tad, 2005) and, to a limited extent, modernising
systems (IMF, 1999). However, corruption remained
pervasive, leading to the appointment of an indepen-
dent inquiry into URA led by Justice Julia Sebutinde in
2002. The inquiry report was, however, questioned by
Parliamentarians, and quashed by the High Court in
2004 (Fjeldstad, 2005). Still, in 2004/05, GoU appoin-
ted a new Commissioner General and a Board. Since
then, URA has undertaken two measures involving: (i)
structural and further institutional reforms; and (ii)
a modernisation programme.
Sequencing and implementationof reforms
As part of its post-2005 reforms, structural changes
evolved around streamlining URA’s structure, which had
become top heavy as well as hierarchical (the new
structure is described in Section on “Institutional
changes”). Thereafter, URA’s management also conti-
nued to address the problem of staff integrity. In
particular, in 2006, it launched an Integrity Enhancement
Programme (IEP), which: introduced an internal process
for investigating reported cases of misconduct; sensiti-
sed staff on ethics; and instituted a code of conduct.
9 Whereas previously, the Chief Administrative Officer was appointed by the District Service Commission, the appointment and supervision of CAOs wasre-centralised by the central government during the Constitutional reforms adopted in July 2005.
Domestic Resource Mobilisation for Poverty Reduction in East Africa: Lessons for Tax Policy and Administration
290
From 2006, URA’s reforms are specified in it ‘Moderni-
sation Plan’, covering the period from 2006/07 to
2009/10. The reforms have received support (US$15
million) from development partners, including: Belgium;
China; DANIDA; DFID; IMF; JICA, Netherlands; SIDA;
and the World Bank. The modernisation programme is
comprehensive, and seeks to achieve the following 10
objectives (URA, 2009):
• a strategy development process backed by a
disciplined “plan-implement-monitor-review” cycle
to ensure achievement of results;
• User-friendly, simplified, cost effective and transpa-
rent processes;
• Quality client service characterised by open,
responsive and proactive customer care pro-
grammes;
• a dynamic organisational structure that adapts to
operational demands;
• a highly skilled and motivated work force committed
to delivering highest professional standards;
• Application of ICT and other productivity tools in a
manner that integrates people, process and
technology for greatest value;
• a safe and healthy working environment;
• a regulatory and policy framework that supports
continuous improvement;
• Use of analytical tools and other modern manage-
ment techniques to enhance compliance and
minimise resource wastage; and
• a corporate culture across all levels of URA that
values service excellence.
Substantial modernisation reforms have been comple-
ted. Key results under the modernisation phase include:
Business processes in customs have been
reengineered, new procedures drawn up, and staff
retrained. ASYCUDA++ and RADDEX are
functioning (see Annex 8.4);
• Business processes in domestic tax have been
reengineered, new procedures drawn up, and staff
retrained. The eTax system is in operation (see
Annex 8.4), however, work is ongoing to extend its
functionality (e.g., to cover audits, refunds, investi-
gations etc);
• Certain aspects of URA’s corporate services have
been modernised. For example, URA has a corpo-
rate plan in place. M&E of the plan is supported by
the corporate scorecard system (see Annex 8.4);
• To enhance integrity, a revised staff code of conduct
and whistle blowing policy were developed in 2009.
Furthermore, URA is proactive in communicating
issues centering on integrity both internally and
externally;
• URA has disseminated a taxpayers’ charter with
clear standards of service; and
• To improve access to information, various literature
on tax have been translated into eight languages.
Further, Public and Taxpayer Education services
regularly hold tax clinics to obtain feedback on
taxpayers’ needs.
It is noteworthy that the reforms pursued by URA have
been primarily administrative in nature. In other words,
they have been short on policy innovations and
prescriptions. This is not surprising because there is
apparently no rigorous and comprehensive research and
analysis of the tax policy environment and system, such

Domestic Resource Mobilisation for Poverty Reduction in East Africa: Lessons for Tax Policy and Administration
291
as the Katz Commission work in South Africa, which
lasted for five years. This may in part explain the minimal
impact of the reforms on tax revenue as a percentage of
GDP, tax effort and tax gap (see Section on “Tax
administration benchmarks”).
Furthermore, while URA’s reforms were, in general,
administratively comprehensive, they were neither
focused nor driven by specific performance
outcomes, such as improved enforcement and a
wider tax base. “The main focus was on meeting
revenue targets and not enough was done to embed
non-revenue performance objectives and indicators”
(Cawley and Zake, 2010). Excessive tax exemptions
may also have significantly cancelled out the
prospective impact of the reforms on tax revenue
performance. In addition, Ndulu et al (2007) attribute
a slow growth in tax revenue in both Uganda and
Tanzania as a percentage of GDP to emanate
“chiefly from fiscal corruption”.
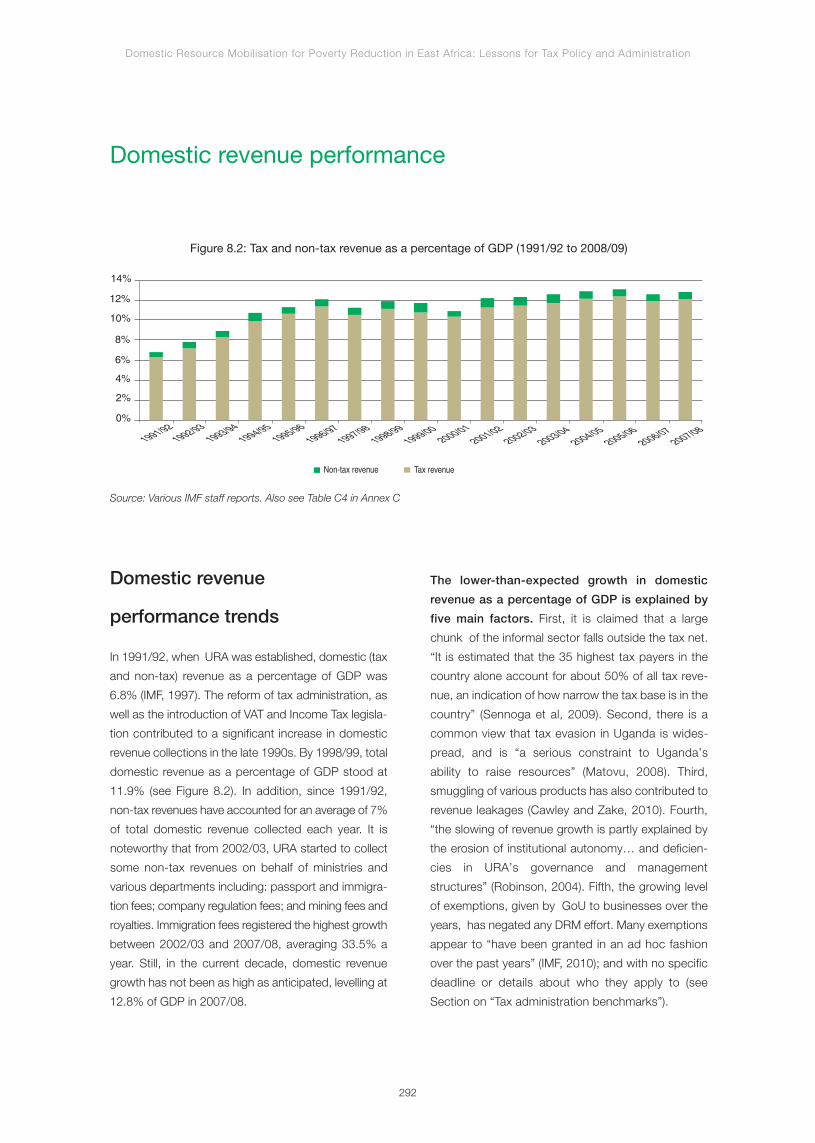
Domestic Resource Mobilisation for Poverty Reduction in East Africa: Lessons for Tax Policy and Administration
292
Domestic revenue performance
Non-tax revenue Tax revenue
0%
4%
14%
12%
10%
8%
6%
2%
1994/951992/93
1991/921993/94
1996/971998/99
1999/002000/01
2001/022002/03
2003/042004/05
2005/062006/07
2007/081997/98
1995/96
Figure 8.2: Tax and non-tax revenue as a percentage of GDP (1991/92 to 2008/09)
Source: Various IMF staff reports. Also see Table C4 in Annex C
Domestic revenue
performance trends
In 1991/92, when URA was established, domestic (tax
and non-tax) revenue as a percentage of GDP was
6.8% (IMF, 1997). The reform of tax administration, as
well as the introduction of VAT and Income Tax legisla-
tion contributed to a significant increase in domestic
revenue collections in the late 1990s. By 1998/99, total
domestic revenue as a percentage of GDP stood at
11.9% (see Figure 8.2). In addition, since 1991/92,
non-tax revenues have accounted for an average of 7%
of total domestic revenue collected each year. It is
noteworthy that from 2002/03, URA started to collect
some non-tax revenues on behalf of ministries and
various departments including: passport and immigra-
tion fees; company regulation fees; and mining fees and
royalties. Immigration fees registered the highest growth
between 2002/03 and 2007/08, averaging 33.5% a
year. Still, in the current decade, domestic revenue
growth has not been as high as anticipated, levelling at
12.8% of GDP in 2007/08.
The lower-than-expected growth in domestic
revenue as a percentage of GDP is explained by
five main factors. First, it is claimed that a large
chunk of the informal sector falls outside the tax net.
“It is estimated that the 35 highest tax payers in the
country alone account for about 50% of all tax reve-
nue, an indication of how narrow the tax base is in the
country” (Sennoga et al, 2009). Second, there is a
common view that tax evasion in Uganda is wides-
pread, and is “a serious constraint to Uganda’s
ability to raise resources” (Matovu, 2008). Third,
smuggling of various products has also contributed to
revenue leakages (Cawley and Zake, 2010). Fourth,
“the slowing of revenue growth is partly explained by
the erosion of institutional autonomy… and deficien-
cies in URA’s governance and management
structures” (Robinson, 2004). Fifth, the growing level
of exemptions, given by GoU to businesses over the
years, has negated any DRM effort. Many exemptions
appear to “have been granted in an ad hoc fashion
over the past years” (IMF, 2010); and with no specific
deadline or details about who they apply to (see
Section on “Tax administration benchmarks”).

Domestic Resource Mobilisation for Poverty Reduction in East Africa: Lessons for Tax Policy and Administration
293
It is therefore not surprising that Uganda is still heavily
reliant on revenue from international trade taxes (e.g.,
import and excise duties, especially on petroleum
imports). Table 6 (see Annex 8.3) indicates that whilst
the proportion of customs and excise revenue as a
percentage of total domestic resources fell from 53%
in 1996/97 to 36% in 2007/08, it still remains the
largest revenue source. Nonetheless, it is significant
that since its introduction in 1996/97 until 2007/08,
VAT revenue (the second largest revenue source) grew
at an average annual rate of 16.3%. In the initial years,
increase in VAT revenue was attributed to the “entry
into the Uganda market of a number of international
telecommunications and supermarket operators –
large payers with more transactions – and some
administrative improvements” (Cawley and Zake,
2010). However, according to the same authors, there
was scope for further expansion of the VAT base if
GoU had not extended the number of items eligible
for exempt or zero rating status.
Likewise, by 2007/08, inland revenue (PAYE, corporate
income and local excise taxes), the second largest
source, comprised almost 30% of total revenues
collected by the URA, a marked increase from its
contribution in 1996/97 of 17%. Throughout the period,
PAYE was the largest contributor to inland revenue
(accounting for almost 50% in 2007/08), growing at an
average annual rate of 29% between 1996/97 and
2007/08 despite reduction in tax rates (see Annex 8.3:
Table 1). This uptick is due to: economic growth,
especially in the manufacturing and service sectors,
which led to an increase in formal employment; the fact
that all government employees began to make PAYE
contributions from 1998/99; and “improvements in tax
administration and compliance” (Cawley and Zake,
2010). Corporate tax contributions constituted 12%
and 20% of inland revenues in 1996/97 and 2007/08
respectively, and grew at an average rate of 30%, due
partly to expansion of the telecommunications and
banking sectors.
Another tax policy that proved to be a success was the
tax amnesty offered by GoU in 2007/08. The amnesty
not only registered new taxpayers but it also realised
UShs41 billion (about US$18 million) from voluntary
disclosures. To further encourage entities to clean up
their books, in 2008/09, the Minister of Finance propo-
sed to write off arrears of duty and tax relating to the
principle, interest and penalties that had accrued up to
30 h June 2002. The rationale for this proposal was to
encourage taxpayers to start from a clean slate. Also, it
was in line with the Income Tax Act, which dictates URA
that it cannot go beyond five years back in its audit
coverage.
Tax administration benchmarks
Performance efficiency
Cost of collection. Between 1995/96 and 2007/08,
the average cost of collection as a percentage of total
domestic revenues was 3.4% a year. The tax collection
cost has been on the decline since 1995/96, except in
years when URA had incurred high capital expenditures
(e.g., in 2003/04, when it procured heavy duty scan-
ners for the Customs and Excise Department) (see
Annex 8.3: Table 2). However, between 1995/96 and
2007/08, tax administration costs grew at an average
annual rate of 15.1%.
Organisational structure. URA is organised along
functional lines. It established a large taxpayers’ office
(LTO) in November 1998. The LTO currently serves 667
large taxpayers. In 2008, they constituted 1% of the
entire taxpayer base, but contributed 72% of tax
revenues10.
Ease of paying taxes. Uganda has the second best
rating among the EAC countries (after Rwanda), in terms
of the World Bank’s Doing Business Ranking with
respect to ease of paying taxes – ranking 61st out of
183 countries in 2010. It is a marked improvement from
10 Source: The International Tax Dialogue: Tax Administration in Selected African Countries: 2009.

Domestic Resource Mobilisation for Poverty Reduction in East Africa: Lessons for Tax Policy and Administration
294
71st place in 2009. According to the World Bank’s 2010
Paying Taxes report, a company is required to make 32
payments a year, which are below the SSA average of
37.7, but above the OCED average of 12.8 (see Annex
8.3: Table 11).
Tax arrears. URA reports that tax arrears at the end of
2007/08 were UShs162 billion (or 4.8% of total
revenues). Key informants indicate that tax arrears
increased by 439.8% between 2006/07 and 2007/08,
due partly to the zealous charging of penalties by some
URA officers. URA is addressing this issue to ensure
that penalties are only levied when warranted. Also, in
2006/07, GoU wrote off tax arrears of UShs120 billion,
arising from Government’s commitment to pay tax on
donor-funded projects.
Tax compliance. Uganda has a very low VAT gross
compliance ratio (VATGCR) of 26.50, compared to
World and SSA averages of 65.48 and 38.45
respectively11. This low rate may be due to the signi-
ficant number of exemptions. From an economic
efficiency perspective, a moderate VAT rate with a
broad consumption base and few exemptions is
always preferred to a high rate with many exemp-
tions. Cawley and Zake (2010) also indicate that
VATGCR has remained low because “administration
capacity and compliance did not improve as much as
expected”.
Further, Uganda’s corporate income tax revenue pro-
ductivity (CITPROD and personal income tax productivity
(PITPROD) measures of 0.03 and 0.11 respectively,
indicate that Uganda uses these taxes less efficiently in
generating revenue than World averages of 0.13 and
0.14, respectively. The low revenue yields are partly
attributable to low levels of voluntary compliance by
taxpayers12.
Allocative efficiency
Between 1991/92 and 1997/98, corporate tax
collection levels were reduced as a result of the
investment code, which was subsequently abolished
and replaced with depreciation and tax allowances
(e.g., for depreciation). Furthermore, there have been
various exemptions offered over the years, such as
the 10-year tax holiday introduced in 2007/08 (see
Section on “Changes in tax policies over the years”).
Although the associated loss in tax revenues has not
been determined through rigorous study, key infor-
mants suggest Uganda could be foregoing revenue
of at least 2% of GDP due to such incentives and
exemptions.
Performance equity
The World Bank’s 2010 Paying Taxes report indicates
that the ‘total tax rate’ as a percentage of profit of
11 http://www.fiscalreform.net/index.php?option=com_wrapper&Itemid=132 [Accessed 2 February 2010].12 www.cabri-sbo.org/ [Accessed 7 July 2010].
Households Income tax (UShs millions)Total income (UShs
millions)Total collected %
Rural farm 50,106 4,695,186 1.07%
Rural non-farm 33,670 954,396 3.53%
Kampala metro 234,007 1,249,676 18.73%
Urban farm 35,768 882,176 4.05%
Urban non-farm 41,706 711,087 5.87%
Table 8.1: Tax contributions by households
Source: Sennoga et al (2009)

Domestic Resource Mobilisation for Poverty Reduction in East Africa: Lessons for Tax Policy and Administration
295
35.7% is significantly lower than the OECD average of
44.5% and the SSA average of 67.5%. Furthermore,
a study by Matovu et al (2009) intimates that PAYE
rates are relatively progressive for most individuals –
“this perhaps explains why PAYE is one of the taxes
where government collects a lot of revenue”. However,
another study by Sennoga et al (2009) reports that the
highest PAYE burden falls on households based in
Kampala, suggesting there is scope to spread the
burden by taxing households, which are based
upcountry and in rural areas, in particular those
engaged in profitable economic activities(see Table
8.1).
It is also noteworthy that the PAYE threshold has been
stagnant at UShs130,000 ( US$ 57) per month for over
10 years, suggesting that GoU has not taken into
account the inflationary effects on wages for low-income
workers. As a result, low- and fixed-income earners are
unlikely to be able to save. At the same time, tax rates by
bracket are progressive up to a relatively low threshold of
UShs410,000 (US$182) per month (after which income
tax is levied at a flat rate of 30%).
In addition to PAYE, low-income earners are also
burdened with VAT, which was adjusted upwards by 1
percentage point in 2005 to18%. However, many
basic items and services are zero rated (see Section
on “Changes in tax policies over the years”). Further-
more, excise duties are highest for cigarettes (130%),
beer (60%) and spirits (45%), which reflect the health
risks and social costs associated with their consump-
tion. High tax rate for such items is common in many
countries as it is argued that there is merit and
considerable scope for collecting additional tax
revenue to cater for externalities.
Another indicator of the tax burden for corporate
taxpayers (i.e., time taken to comply with major taxes)
suggests that Uganda’s tax system promotes equity.
In this regard, the 2010 World Bank paying taxes
survey indicates, the time taken by companies in
Uganda to comply with major taxes is 161 hours,
which is much lower than the OECD and SSA
averages of 194.1 hours and 306.0 hours respectively
(see Annex 8.3: Table 11).
Performance effectiveness
URA’s performance effectiveness is comparatively
low in terms of both tax effort and tax gap (see Annex
8.3: Table 13). At 60.3%, in 2005, Uganda’s tax effort
was well below Kenya (90.5%), but better than those
of Rwanda (57%) and Tanzania (54.4%). However, its
tax effort increased by 6 percentage points between
2001and 2005. During the same period, Uganda also
managed to reduce its tax gap by 1 percentage
point-- to 7.8% of GDP. Still, there is considerable
scope to further reduce the tax gap.
URA has been proactive in soliciting feedback on its
performance with a view to improving tax administra-
tion effectiveness. Feedback on perceptions about
service delivery, and the integrity of URA, appears to
have been of particular importance in recent years. An
independent integrity survey of 444 taxpayers,
commissioned by URA in 2008, confirms views
expressed in the literature, and by key informants on
revenue performance (RDC, 2009). For example, “tax
evasion in general was perceived to be a major
problem in tax collection”.
Summary of overall trends
Uganda achieved considerably improved levels of
domestic revenue in the first seven years following
establishment of URA - with tax and non-tax revenue
collections rising by 5.1 percentage points to 11.9% of
GDP in 1998/99. Much of this increase is attributable
to economic growth following years of conflict, and
effective collection measures by URA. However, in
subsequent years, revenue collections stagnated as a

Domestic Resource Mobilisation for Poverty Reduction in East Africa: Lessons for Tax Policy and Administration
296
result of smuggling and tax evasion. The growing level
of incentives and exemptions granted in recent years
has further undermined Uganda’s revenue potential,
which perhaps explains the sizeable tax gap.

Domestic Resource Mobilisation for Poverty Reduction in East Africa: Lessons for Tax Policy and Administration
297
Challenges and issues
An introduction to the
challenges and issues
The section on “Trends in the tax system” sought to
demonstrate the considerable efforts that have gone
into modernising the tax system in URA with a view to
realising its vision “to be a model for best practices and
innovation in revenue services”. However, major chal-
lenges will need to be addressed for this vision to be
realised and sustained. These challenges and issues
are discussed in this chapter.
Ensuring efficacy of tax
incentives and exemptions
According to some key informants, tax revenue as a
percentage of GDP could easily go up to 16%, if some
of the revenue negating measures, particularly incen-
tives and exemptions, were removed. GoU has drawn
up “a register of all existing incentives and exemp-
tions…their cost [computed]—in terms of lost reve-
nue—and net economic impact quantified” (IMF, 2010).
It is anticipated that GoU will abolish unproductive tax
expenditures from 2010/11. The elimination of non-
value adding incentives and exemptions will, however,
demand the resolve and commitment of Uganda’s
political leadership.
Widening the tax base
The predominance of a large informal sector outside the
tax net, under declarations, evasion and smuggling are
challenges that commonly arise in the literature and
discussions on Uganda’s tax system. The problem of
smuggling is being addressed through measures such
as heightened intelligence (e.g., RADDEX), and intro-
duction of customs clearance facilities at specific border
points. However, issues surrounding the informal
sector, under declarations and evasion are best
addressed through one or more of the following: (i) a
mechanism to quantify the size of the informal economy;
(ii) enforcing compliance; (iii) availability of a functioning
land registry system, which provides URA with third
party information; and (iv) introduction of a national ID
system. Of these options, development of a land
registry system is ongoing under a World Bank-finan-
ced Private Sector Development Project. In addition,
there are indications that the national ID project is back
on track.
Developing and maintaining
capacity for tax policy
management
In light of the weak tax reform mechanism and functions,
there is a view that more could be done to build and
sustain tax policy capacity in Uganda. Key informants
proposed that one way of building and sustaining this
capacity would be to promote knowledge-sharing in the
EAC region. Another approach would include transfer
staff between MoFPED and URA. But when this
approach wastried in the past, large differences in
salaries between the two institutions created a problem
in terms of motivation. In this regard, an anonymous
source at MoFPED said:
“The salary disparities paid by the same government to
its workers is creating discontent among the lowly paid
workers in the civil service, although they do almost the
same work and are equally qualified. According to this
source, there is no justification in paying workers in
statutory bodies higher salaries (which are nearly 70%
higher) compared to their counterparts working in
ministries” (Habuti and Masinde, 2009).
Domestic Resource Mobilisation for Poverty Reduction in East Africa: Lessons for Tax Policy and Administration
298
Building and sustaining
management capacity in URA
There are two potential obstacles to building and
sustaining management capacity in URA. First, the
positions of Commissioner General, Commissioners
and Assistant Commissioners have fixed term limits,
which bar incumbents from serving any longer. There is
therefore a danger that specialised skills and institutio-
nal knowledge are lost each time such staff depart from
the organisation. Second is the issue of remuneration,
which has not been adjusted for senior staff and
personnel in professional and technical positions since
2004/05. As some key informants indicated, this
perhaps explains why URA has been unable to retain
specialised skills in such areas as ICT and audit. It is
worth noting here that although URA salaries are
perceived to be higher than those offered to public
servants, they often lag behind the private sector. As
such, URA skilled staff often get lured to the private
sector.
Minimising corruption
in tax collection
In 2009, URA was ranked as the second and seventh
most corrupt public institution in Uganda, and in the
three EAC countries ( Kenya, Tanzania and Uganda)
respectively (Transparency International, 2009). URA
“was the only tax authority in the region to appear
among the top five institutions in their respective coun-
try index” (Transparency International, 2009).
In its corporate plan, URA acknowledges that “there is
a perception among the public that to some extent
corruption still exists within the organisation”. Further-
more, the 2008 URA-commissioned integrity baseline
survey indicates that “a good number of respondents
reported that they had experienced or seen URA
officers engage in improper behaviour” (RDC, 2009).
Furthermore, the report suggests that URA still needs
to strengthen its efforts to curb corruption. To this end,
URA continues to actively collaborate with anti-corrup-
tion bodies and the public, and will shortly implement its
whistle-blowing policy.
Ensuring harmonised,
systematic and policy-led
regional integration measures
Regional integration at EAC Customs Union level is
apparently a predominantly politically-driven initiative.
Evidently, many of the regional integration measures
promulgated by regional political forums have been
made before any rigorous assessment of both the
feasibility and its implications for DRM implementation.
Thus, for example: (i) common external tariffs (CETs)
were pronounced on the eve of the EAC Customs Union
launch and a lot of haggling over them still persists; (ii)
there is an absence of clarity on the appropriate classi-
fication of manufactured and semi-manufactured
goods; (iii) “the value of goods which [qualify] for exemp-
tions and remissions has been growing” (Mugisa, 2009)
; and (iv) weak and poorly coordinated controls over the
rules of origin continue to pose major problems for all
the ARAs in the EAC member states.
It is noteworthy that there are demands by Uganda-
based businesses to extend the duty exemption
period beyond 2010 for importation of key inputs and
materials (225 tariff numbers) given to 94 companies
under the Duty Remission Scheme. Yet, businesses
in other EAC member states are required to pay
import duty at the applicable CET rate. “This is
contrary to the spirit of the agreed position, and
naturally, there is opposition to this from other
members and, even in Uganda, there is no unanimous
support on this matter” (Mugisa et al, 2009). In

Domestic Resource Mobilisation for Poverty Reduction in East Africa: Lessons for Tax Policy and Administration
299
addition, Uganda’s tax regime is not fully in sync with
the systems in other EAC partner states. For exam-
ple, VAT and excise duty are not harmonised, which
could negatively impact cross-border trade.

Domestic Resource Mobilisation for Poverty Reduction in East Africa: Lessons for Tax Policy and Administration
300
Lessons learned
Box 8.1: Political leader tirade against salary adjustments for URA staff
Despite the global economic downturn, the URA is moving to increase staff salaries in a bid to improve its ‘operational
efficiency’. The tax body, which has some of the highest paid employees on the government payroll, submitted a proposal
to the Ugandan parliament last week in which it seeks a 16% increment to its employees’ salaries.
Members of parliament.. last week threatened to block the proposal. “Our economy is doing badly and we are
collecting less revenue, not due to lack of skilled staff, but because of the financial crisis... It will be irrational for us to
increase URA salaries by Shs7.8 billion yet we are collecting less and our people have no drugs in hospitals. We
cannot fix the realities of the financial crisis by rewarding URA executives.” [one Member of Parliament] argued.
Ironically, as the URA asks for staff salary increments, the National Health Service Commission will not be able to
recruit the 1,000 health workers it needs this financial year [FY 2008/09] for lack of funding. Furthermore, the national
budget this year slashed about Shs3.4 billion off the main national hospital (Mulago Hospital) budget, yet the hospital
is in dire need of these funds.
Source: Anyoka (2009)
It is clear that URA, like other ARAs in the region, has
embarked on extensive reforms and capacity building
initiatives. This synthesis of lessons is based on an
assessment of outputs from the reform efforts and
policy measures for which specific outcomes can be
identified. At the same time, this chapter captures
lessons learned in terms of what decisions, and actions,
affect tax efforts.
It is important to insulate
an ARA from politics
In line with the original envisioning of the relevance of
URA’s autonomy, the authority should have the insti-
tutional environment and incentives that allow it to
attract and retain the talent necessary to build,
operate and maintain an efficient and effective tax
administration system. However, as indicated earlier
in this paper, it would seem that URA’s staff remune-
ration has been politicised in recent years, and
therefore pay has not kept up with packages offered
by other organisations in the market seeking to recruit
similar skills (see Box 8.1). Therefore, URA has suffe-
red staff losses in critical positions. Furthermore,
freezing URA’s pay levels may serve to undermine its
image in the market. For example, it may be perceived
to be less professional due to its reduced ability to
attract and retain the best skills available in the market.
The remuneration aspect “of autonomy has [therefore]
become less significant over time as pay and condi-
tions move more closely in line with civil service
norms” (Robinson, 2004).
Restructuring, reengineering
and automation can facilitate
reduction in collection cost
Table 2 Annex 8.3 indicates that since 1996/97, URA
has been able to bring down the cost of collecting tax
and non-tax revenues. This reduction demonstrates
one benefit of the restructuring, reengineering and
automation initiatives that URA has implemented. When
all the new processes and systems are fully functioning,
Domestic Resource Mobilisation for Poverty Reduction in East Africa: Lessons for Tax Policy and Administration
301
there is a distinct possibility that the collection cost as
a percentage of total revenue collected will be even
lower. Then also, URA should start “harvesting” from its
massive investment in IT systems, for example, through
data matching, enhancing compliance management
capabilities, use of third party information, and sharing
of information across departments.
Tax incentives and exemptions
can negate DRM results
URA has made noteworthy advancements with its
modernisation agenda. However, the effect of its
reforms are not fully discernible in domestic revenue
performance indicators (See Section on “Domestic
revenue performance”), especially collections as a
percentage of GDP. The key factors for this
lower-than-expected performance appear to be: (a)
large proportion of the informal sector that falls
outside the tax net; (b) the common view that tax
evasion in Uganda is widespread; and (c) growing level
of exemptions – which “not only shrink the tax base but
also complicate tax administration and are a major
source of revenue resource leakage from the taxed
economy” (Gupta and Tareq, 2008). It is therefore im-
portant to quantify, and if possible, significantly reverse
the effects of these three negating factors.

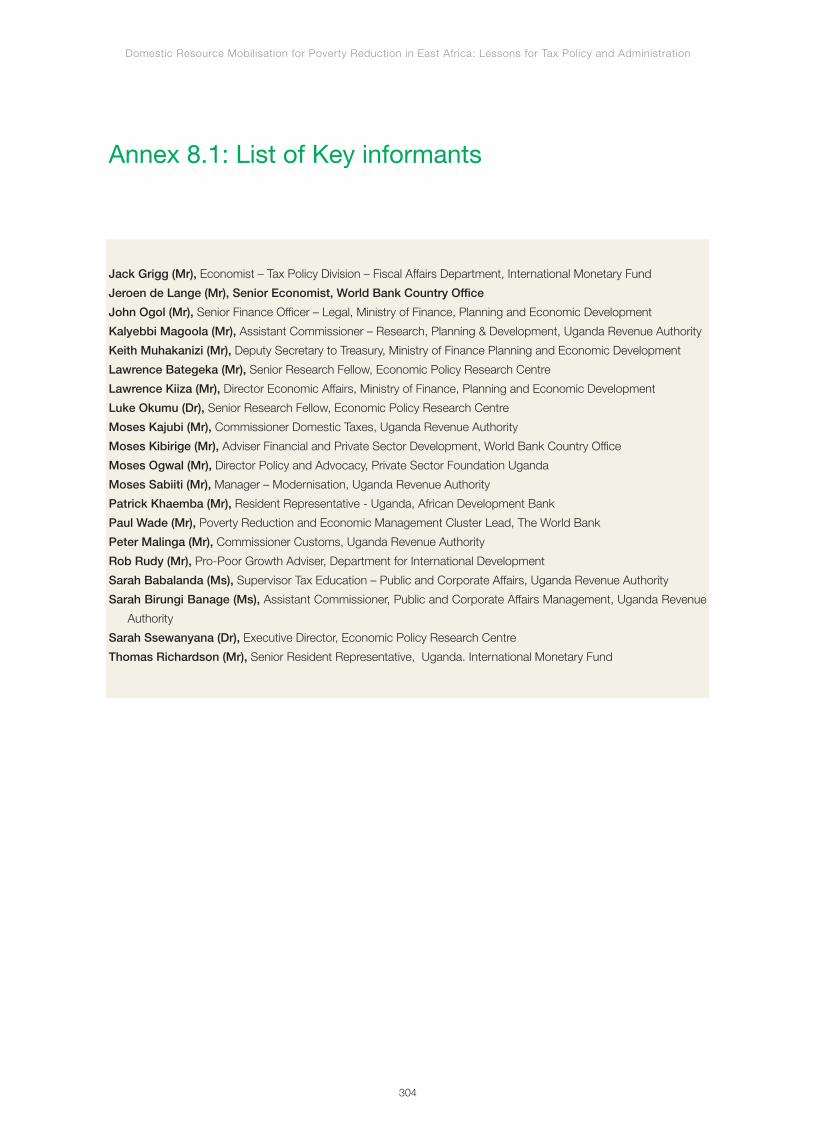
Domestic Resource Mobilisation for Poverty Reduction in East Africa: Lessons for Tax Policy and Administration
304
Annex 8.1: List of Key informants
Jack Grigg (Mr), Economist – Tax Policy Division – Fiscal Affairs Department, International Monetary Fund
Jeroen de Lange (Mr), Senior Economist, World Bank Country Office
John Ogol (Mr), Senior Finance Officer – Legal, Ministry of Finance, Planning and Economic Development
Kalyebbi Magoola (Mr), Assistant Commissioner – Research, Planning & Development, Uganda Revenue Authority
Keith Muhakanizi (Mr), Deputy Secretary to Treasury, Ministry of Finance Planning and Economic Development
Lawrence Bategeka (Mr), Senior Research Fellow, Economic Policy Research Centre
Lawrence Kiiza (Mr), Director Economic Affairs, Ministry of Finance, Planning and Economic Development
Luke Okumu (Dr), Senior Research Fellow, Economic Policy Research Centre
Moses Kajubi (Mr), Commissioner Domestic Taxes, Uganda Revenue Authority
Moses Kibirige (Mr), Adviser Financial and Private Sector Development, World Bank Country Office
Moses Ogwal (Mr), Director Policy and Advocacy, Private Sector Foundation Uganda
Moses Sabiiti (Mr), Manager – Modernisation, Uganda Revenue Authority
Patrick Khaemba (Mr), Resident Representative - Uganda, African Development Bank
Paul Wade (Mr), Poverty Reduction and Economic Management Cluster Lead, The World Bank
Peter Malinga (Mr), Commissioner Customs, Uganda Revenue Authority
Rob Rudy (Mr), Pro-Poor Growth Adviser, Department for International Development
Sarah Babalanda (Ms), Supervisor Tax Education – Public and Corporate Affairs, Uganda Revenue Authority
Sarah Birungi Banage (Ms), Assistant Commissioner, Public and Corporate Affairs Management, Uganda Revenue
Authority
Sarah Ssewanyana (Dr), Executive Director, Economic Policy Research Centre
Thomas Richardson (Mr), Senior Resident Representative, Uganda. International Monetary Fund

Domestic Resource Mobilisation for Poverty Reduction in East Africa: Lessons for Tax Policy and Administration
305
Annex 8.2: Bibliography
Africa Peer Review Mechanism (2009): Republic of Uganda. APRM Country Review Report No. 7.
African Forum and Network on Debt and Development (2007): A Critical Assessment of Aid Management & Donor
Harmonisation: The Case of Uganda, AFRODAD 2007.
Anyoka, M. (2009): Higher URA Wages vs Better Health Care [Available at:
http://www.groundreport.com/Opinion/HIGHER-URA-WAGES-VS-BETTER- HEALTHCARE/2904087] [Accessed
4 April 2010].
Ayoki, M. (2008): Tax Administration in Poor Countries: Country Report Uganda. IPRA, 2008. Working Paper No.
20.Ayoki, M (2008) Tax Administration in Poor Countries: Country Report Uganda. Institute of Policy Research and
Analysis. IPRA Working Paper No 20.
Ayoki, M., Obwana, M., Ogwapus, M. (2005): Tax Reforms and Domestic Revenue Mobilization in Uganda Institute
of Policy Research and Analysis. Global Development Network.
BBC (2002): Uganda Roots Out Tax Corruption. BBC News 15/03/02, [online].
Bitarabeho, J. (2008): The Experience of Uganda – Local Government’s Role as a Partner in the Decentralisation
Process to Strengthen Local Development. A Paper Presented at a Conference on Access to Development
Funding for Local Governments in Africa. Johannesburg, 15 – 17 September 2008.
Boko, SH. and Baliamoune-Lutz, M. (2009): Fiscal Decentralisation, Donor Funding and Poverty Reduction in Africa:
A Case Study of Uganda. Paper presented at Conference on the Role of the Sub-National Jurisdiction in Efforts to
Achieve the MDGs. Abuja, Nigeria, 7-9 May 2009.
Brautigam, D.A. (2008): Introduction: Taxation and State Building in Developing Countries. In D.A Brautigam., O-H.
Fjeldstad and M. Moore (eds) Taxation and State Building in Developing Countries. Cambridge University Press,
Cambridge, pp. 1-33.
Cawley, G. and Zake, J. (2010): Tax Reform In F. Kuteesa, E. Tumusiime-Mutebile, A. Whitworth and T. Williamson (eds)
Uganda’s Economic Reforms: Insider Accounts. Oxford University Press: Oxford, 1st edtn, pp. 103-128.
Chen, D., Matovu, JM., Reinikka, R. (2001): A Quest for Revenue and Tax I ncidence in Uganda, IMF Working Paper
WP/01/24.
DFID (2008): Making Uganda’s Tax System More Appropriate in Meeting National Objectives: What works, what
doesn’t, and why, Institute of Policy Research and Analysis, DFID 2008.
Fjeldstad, OH. (2005a): Corruption in Tax Administration: Lessons from Institutional Reforms in Uganda, CMI Working
Paper WP 2005: 10.
Fjeldstad, OH. (2005b): Revenues and Corruption: An Overview of Issues, In U4- Workshop on Corruption in Public
Financial Management: Donor Perspectives, Bergen, 16-17 February 2005.
Fjeldstad, OH. and Rakner, L (2003): Taxation and tax reforms in developing countries: Illustrations from
sub-Saharan Africa, CMI Report R 2003:6.
Gauthier, B. and Reinikka, R. (2001): Shifting Tax Burdens Through Exemptions And Evasion Exemptions: An
Empirical Investigation Of Uganda; The World Bank Policy Research Working Paper 2735.
Gauthier,B. and Reinikka, R. (2006): Shifting Tax Burdens through Exemptions and Evasion: an Empirical
Investigation of Uganda; Journal of African Economies doi:10.1093/jae/ejl022 Advance Access, published June 14,
2006.
GoU, (2004): Poverty Eradication Action Plan (2004/5 – 2007/8). GoU, 2004.
Domestic Resource Mobilisation for Poverty Reduction in East Africa: Lessons for Tax Policy and Administration
306
Growth E. (2008): Uganda’s Taxation Policy: Implications for Poverty Reduction and Economic Growth Review Report
No.9
Gupta, S., and Tareq, S.(2008): Mobilising Revenue: Strengthening domestic Revenue Bases is Key to Creating
Fiscal Space for Africa’s Developmental Needs, IMF Fiscal Affairs Department, Finance and Development, 2008.
Habuti, M.A. and Masinde, J. (2009): Tensions Mount Over Disparities in Uganda’s Public Service Salaries, East
Africa In Focus 10/11/2009, [online].
Hauser, E. (1999): Ugandan relations with Western donors in the 1990s: What impact on democratisation? The
Journal of Modern African Studies 37(4):621- 641.
Holmes, K. (2006): The Uganda Income Tax Act 1997: A Primer on Concepts and Structure; IFBD Publications:
Amsterdam.
IMF (1997): Uganda Statistical Appendix. IMF,1997. Report no. 97/48.
IMF (1999): Uganda: Selected Issues and Statistical Appendix. IMF,1999. Report No. 99/116.
IMF (2009a) Country Report: IMF Country Report No. 09/79, March 2009.
IMF (2009b): Some Observations on Domestic Revenue Mobilization. Presentation made during IMF Staff Visit to
Rwanda, Oct-November 2009.
IMF (2010) Uganda: Sixth Review Under the Policy Support Instrument and Request for an Extension of the Policy
Support Instrument—Staff Report. IMF, 2010. Report no. 10/1.
Kaweesa, C. (2004): Taxation and Investment in Uganda Structure and Trend; A Presentation To The Business Forum
in London, UK For Investment Opportunities In Uganda, May 2004.
Kayaga, L. (2007): Tax Policy Challenges Facing Developing Countries: A Case Study of Uganda; Unpublished
Master’s Thesis, Faculty of Law, Queens University.
Khorana, S., Kimbugwe, K., Perdikis, N. (2007): The Impact of Tariff Reductions under the East African Community
Customs Union: Intra-trade effects on Uganda BOUWP/08/08.
Matovu JM. (2008): Domestic Resource Mobilisation in Uganda and Economic Performance, Country Presentation for
the North-South Institute Domestic Resources Mobilization in Sub-Saharan Africa Project; January 2008-January
2009.
Matovu,J., Twimukye,E. Nabiddo,W., Guloba,M. (2009): Impact of Tax Reforms on Household Welfare. EPRC, 2009.
Research Series No.64.
Ministry of Local Government (2009): Ministerial Policy Statement Presented To Parliament For The Debate On The
Budget Estimates. Government of Uganda, 2009.
Monitor Reporter (2005): Uganda Must Give Incentives to Investors, says Museveni, The Monitor 16/02/2005,
[online].
Mugisa, E., Onyango, C., Mugoya, P. (2009): An Evaluation of the Implementation and Impact of the East African
Community Customs Union. EAC, March 2009.
Mwenda , A.M. and Atuhaire, A.B. (2006): Museveni Gives Bassajja Another Shs. 13b in Taxes, The Monitor
14/06/2006, [online].
Ndulu, B.J., Chakraborti, L., Lijane, L., Ramachandran, V., Wolgin, J. (2007): Challenges of African Growth:
Opportunities, Constraints, and Strategic Directions. IBRD/World Bank: Washington, 1st edtn.
Domestic Resource Mobilisation for Poverty Reduction in East Africa: Lessons for Tax Policy and Administration
307
Osoro (1993): Revenue Productivity Implications of Tax Reform in Tanzania. AERC, 1993. Paper No. 20.
Page, S. and Te Velde, D.W. (2004): Foreign Direct Investment by African Countries. ODI, 2004.
Private Sector Foundation, Uganda (2009): Widening Uganda’s Tax Base and Improving Tax Administration
Final Report.
RDC (2009): Perceptions and Integrity Baseline Survey in URA. URA, 2009.
Rice, X. (2009): Oil Find Sparks New Hope for Uganda’s People—Guardian 25/08/09, [online].
Robinson, M. (2004): Managing Successful Governance Reforms: Lessons of Design and Implementation – The
Political Economy of Governance Reforms in Uganda. World Bank, 2004.
Robinson, M. (2006): The Political Economy of Governance Reforms in Uganda. Institute of Development Studies,
Discussion Paper 386.
Selassie, A.A. (2008): Beyond Macroeconomic Stability: The Quest for Industrialization in Uganda. IMF, 2008.
WP/09/231.
Sennoga, E., Matovu, J.M., Twimukye, E. (2009): Tax Evasion and Widening the Tax Base in Uganda. EPRC, 2009.
Research Series No.63.
Sseppuya, M. (2005): Rakai to Get Free Trade Zone. The New Vision 16/12/2005, [online].
Steffensen, J. (2008): Fiscal Decentralisation Issues. Mission Report for the JBSF Taskforce, October 25, 2008.
Tangri, R. and Mwenda, A. (2010): President Museveni and the Politics Of Presidential Tenure in Uganda. Journal
of Contemporary African Studies, Volume 28 Issue 1 2010.
The Economist (2010): A Bonanza Beckons: Hope and Peril for the Great Lakes. The Economist 03/04/2010,
p.37-38.
The Independent (2003): Idi Amin: Jovial but Brutal Tyrant known as the 'Butcher of Uganda'. The Independent on
Sunday 18/08/2003, [online].
Therkildsen, O. (2004): Autonomous Tax Administration in Sub-Saharan Africa: The Case of the Uganda Revenue
Authority in Forum for Development Studies No. 1 – 2004 Volume 31, Norwegian Institute of International Affairs.
Transparency International (2009): The East African Bribery Index 2009.
Tumushabe, G. (2009): Trends in Public Administration Expenditure In Uganda: The Cost of the Executive and its
Implications on Poverty Eradication and Governance. ACODE Policy Research Series, No. 27, 2009.
UCC (2009): A Review of the Post and Telecommunications Market 2008/09.
Uganda Revenue Authority (2009): Taxpayer’s Charter, URA Revised edition, June 2009.
URA (2009) Modernisation Plan 2006/07 – 2009/10: Best Opportunity for Total Transformation. URA, 2009.
World Bank (1995): Economic Consequences of the Transition from Civil War to Peace Development. Brief
Number 47.
World Bank (2005) Budget Support, Aid Dependency, and Dutch Disease: The Case of Uganda, Practitioner’s
Forum on Budget Support Cape Town, South Africa, May 5-6, 2005.
World Bank (2007) Uganda: Moving Beyond Recovery: Investment & Behavior Change For Growth. World Bank,
2007. Report no. 39221-UG.

Domestic Resource Mobilisation for Poverty Reduction in East Africa: Lessons for Tax Policy and Administration
308
Annex 8.3: Selected indicators
Fiscal year PAYE Corporate tax VAT
1991/92 50% - -
1992/93 40% - -
1993/94 30% - -
1999/00 30% 30% 17%
2000/01 30% 30% 17%
2001/02 30% 30% 17%
2002/03 30% 30% 17%
2003/04 30% 30% 17%
2004/05 30% 30% 18%
2005/06 30% 30% 18%
2006/07 30% 30% 18%
2007/08 30% 30% 18%
Table 1: Tax policy – Maximum marginal tax rates (1991/92 to 2007/08)
Source: Budget speeches, IMF (1999) and Doing Businesses
Fiscal yearOperating cost including capital
expenditure (UShs)Operating cost as a percentage of
tax revenue
1995/96 24,773,779,106 3.9%
1996/97 27,070,834,505 3.6%
1997/98 29,441,017,509 3.6%
1998/99 36,530,777,177 3.8%
1999/00 36,638,290,073 3.6%
2000/01 37,867,361,311 3.4%
2001/02 47,431,462,746 3.7%
2002/03 47,052,693,855 3.2%
2003/04 71,399,654,482 4.2%
2004/05 70,644,656,503 3.5%
2005/06 74,767,060,318 3.2%
2006/07 78,153,461,190 2.8%
2007/08 100,885,309,949 3.0%
Table 2: Tax administration costs (1995/96 to 2007/08)
Source: Various URA audited accounts

Domestic Resource Mobilisation for Poverty Reduction in East Africa: Lessons for Tax Policy and Administration
309
Indicator Uganda’s measure World’s measure SSA’s measureLow income
economies’ measure
TAXSTAFF - 0.82 0.37 0.20
Table 3: Ratio of tax staff per population (TAXSTAFF)
Source: http://www.fiscalreform.net/index.php?option=com_wrapper&Itemid=132 [Accessed 2 February 2010].
Fiscal year Revenue (tax and non-tax revenue) Fiscal deficit, excluding grants
1991/92 6.8% -
1992/93 7.8% -
1993/94 8.9% -
1994/95 10.7% -
1995/96 11.3% -
1996/97 12.1% -6.4%
1997/98 11.2% -6.1%
1998/99 11.9% -6.0%
1999/00 11.7% -10.1%
2000/01 10.9% -11.0%
2001/02 12.2% -12.3%
2002/03 12.3% -11.5%
2003/04 12.6% -9.6%
2004/05 12.9% -7.2%
2005/06 13.1% -7.1%
2006/07 12.6% -6.0%
2007/08 12.8% -5.1%
Table 4: National government revenue and fiscal deficit as a percentage of GDP
Sources: Various IMF staff and PRSP progress reports

Domestic Resource Mobilisation for Poverty Reduction in East Africa: Lessons for Tax Policy and Administration
310
Fiscal year Tax revenue Non-tax revenue
1991/92 93% 7%
1992/93 92% 8%
1993/94 93% 7%
1994/95 92% 8%
1995/96 94% 6%
1996/97 94% 6%
1997/98 94% 6%
1998/99 93% 7%
1999/00 92% 8%
2000/01 95% 5%
2001/02 92% 8%
2002/03 93% 7%
2003/04 93% 7%
2004/05 94% 6%
2005/06 94% 6%
2006/07 95% 5%
2007/08 95% 5%
Table 5: Split of total budgeted tax and non-tax revenue as a percentage of total
domestic revenue (1991/92- 2007/08)
Source: Various IMF staff reports
Fiscal year Customs and excise duties VAT Inland revenues Non-tax revenues collected
by URA
1996/97 53% 30% 17% -
1997/98 49% 32% 18% -
1998/99 46% 34% 20% -
1999/00 45% 35% 20% -
2000/01 42% 36% 22% -
2001/02 40% 35% 25% -
2002/03 37% 36% 27% 1%
2003/04 37% 34% 29% 1%
2004/05 35% 33% 31% 1%
2005/06 35% 34% 31% 1%
2006/07 35% 34% 30% 1%
2007/08 36% 34% 29% 1%
Table 6: Composition of national government tax and non-tax revenues as a percentage of
total revenues collected by URA (1996/97 to 2007/08)
Source: Various URA audited accounts
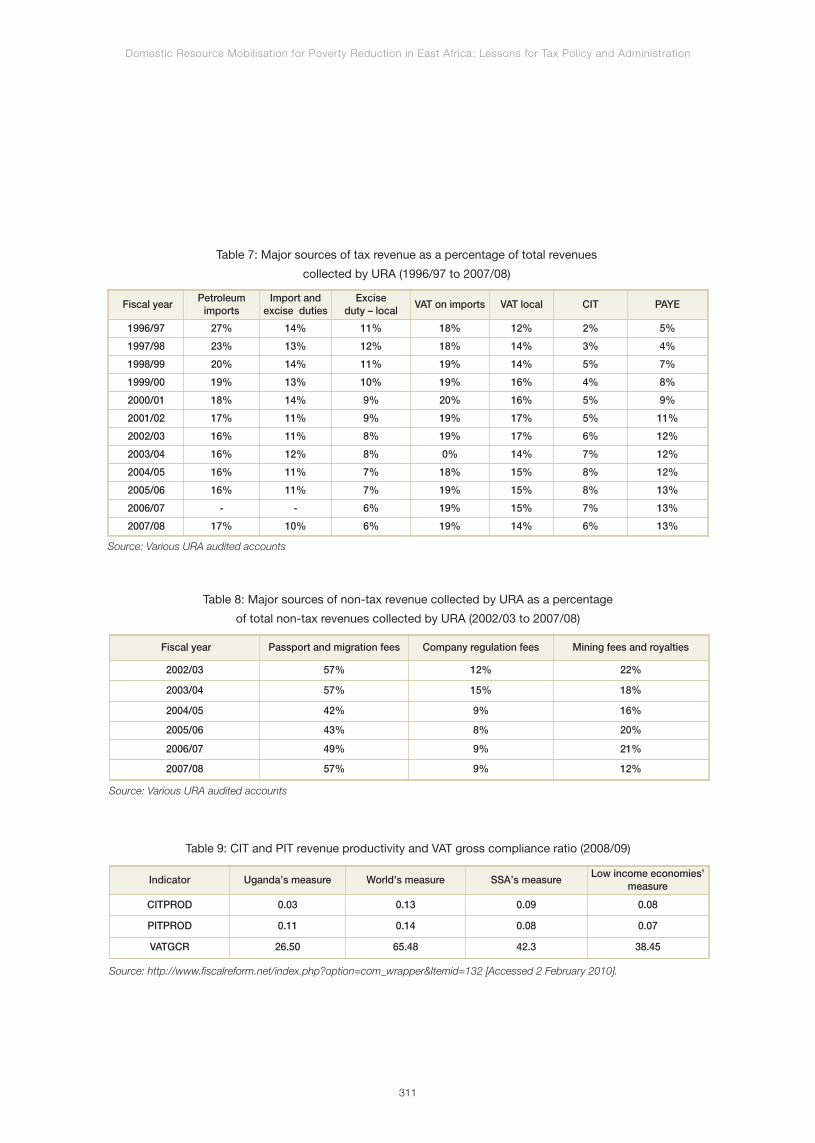
Domestic Resource Mobilisation for Poverty Reduction in East Africa: Lessons for Tax Policy and Administration
311
Fiscal year Petroleum
importsImport and
excise dutiesExcise
duty – localVAT on imports VAT local CIT PAYE
1996/97 27% 14% 11% 18% 12% 2% 5%
1997/98 23% 13% 12% 18% 14% 3% 4%
1998/99 20% 14% 11% 19% 14% 5% 7%
1999/00 19% 13% 10% 19% 16% 4% 8%
2000/01 18% 14% 9% 20% 16% 5% 9%
2001/02 17% 11% 9% 19% 17% 5% 11%
2002/03 16% 11% 8% 19% 17% 6% 12%
2003/04 16% 12% 8% 0% 14% 7% 12%
2004/05 16% 11% 7% 18% 15% 8% 12%
2005/06 16% 11% 7% 19% 15% 8% 13%
2006/07 - - 6% 19% 15% 7% 13%
2007/08 17% 10% 6% 19% 14% 6% 13%
Table 7: Major sources of tax revenue as a percentage of total revenues
collected by URA (1996/97 to 2007/08)
Source: Various URA audited accounts
Fiscal year Passport and migration fees Company regulation fees Mining fees and royalties
2002/03 57% 12% 22%
2003/04 57% 15% 18%
2004/05 42% 9% 16%
2005/06 43% 8% 20%
2006/07 49% 9% 21%
2007/08 57% 9% 12%
Table 8: Major sources of non-tax revenue collected by URA as a percentage
of total non-tax revenues collected by URA (2002/03 to 2007/08)
Source: Various URA audited accounts
Indicator Uganda’s measure World’s measure SSA’s measureLow income economies’
measure
CITPROD 0.03 0.13 0.09 0.08
PITPROD 0.11 0.14 0.08 0.07
VATGCR 26.50 65.48 42.3 38.45
Table 9: CIT and PIT revenue productivity and VAT gross compliance ratio (2008/09)
Source: http://www.fiscalreform.net/index.php?option=com_wrapper&Itemid=132 [Accessed 2 February 2010].

Domestic Resource Mobilisation for Poverty Reduction in East Africa: Lessons for Tax Policy and Administration
312
IndicatorYear
2008 2009 2010
Rwanda’s global ranking - 71 66
Number of tax payments a year 33 33 32
Time taken to comply with the majortax types
237 222 161
Table 10: World Bank Doing Business indicators on the tax burden (Uganda only)
Source: http://www.doingbusiness.org/ExploreEconomies/?economyid=185 [Accessed 10 March 2010]
IndicatorRegion
Uganda OECD SSA
Number of tax payments a year 32 12.8 37.7
Time taken to comply with the majortax types
161 194.1 306.0
Total tax rate as % of profit 35.7% 44.5% 67.5%
Table 11: World Bank Doing Business indicators (2010) on the tax burden (Uganda vis-à-vis the OECD and SSA)
Source: http://www.doingbusiness.org/ExploreEconomies/?economyid=185 [Accessed 10 March 2010]
Registered for Aug-05 Jun-06 Growth
VAT 13,485 16,410 21.7%
Corporate 15,639 19,218 22.9%
Individual 20,936 25,051 19.7%
PAYE 4,575 5,399 18.0%
Rental income 4,607 6,524 41.6%
Table 12: Number of registered taxpayers (2002/03 to 2007/08)
Source: URA audited accounts
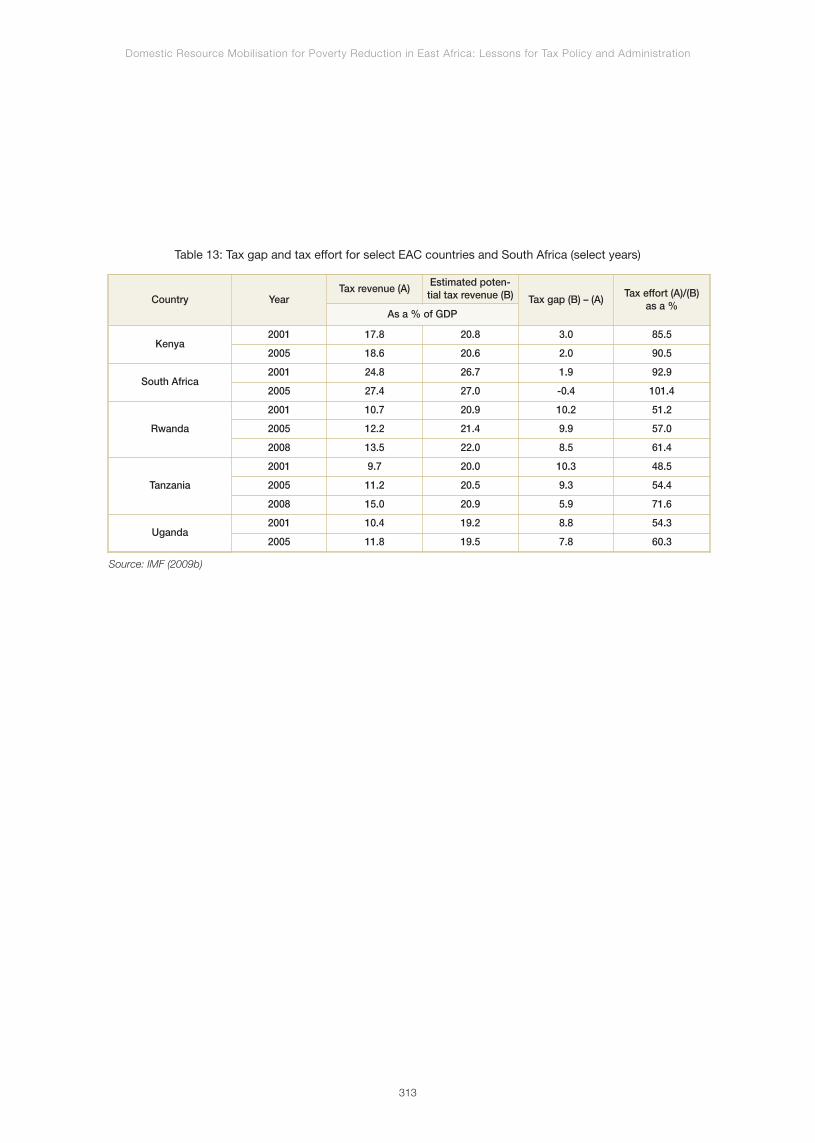
Domestic Resource Mobilisation for Poverty Reduction in East Africa: Lessons for Tax Policy and Administration
313
Country YearTax revenue (A)
Estimated poten-tial tax revenue (B) Tax gap (B) – (A)
Tax effort (A)/(B)as a %
As a % of GDP
Kenya2001 17.8 20.8 3.0 85.5
2005 18.6 20.6 2.0 90.5
South Africa2001 24.8 26.7 1.9 92.9
2005 27.4 27.0 -0.4 101.4
Rwanda
2001 10.7 20.9 10.2 51.2
2005 12.2 21.4 9.9 57.0
2008 13.5 22.0 8.5 61.4
Tanzania
2001 9.7 20.0 10.3 48.5
2005 11.2 20.5 9.3 54.4
2008 15.0 20.9 5.9 71.6
Uganda2001 10.4 19.2 8.8 54.3
2005 11.8 19.5 7.8 60.3
Table 13: Tax gap and tax effort for select EAC countries and South Africa (select years)
Source: IMF (2009b)

Domestic Resource Mobilisation for Poverty Reduction in East Africa: Lessons for Tax Policy and Administration
314
Annex 8.4: Changes to the administrative systems
at URA
The development of URA’s administrative systems
has been guided by a tax modernisation initiative. A
bespoke developed Integrated Tax Administration
System (eTax) is used in the Domestic Tax Revenue
Department, covering all taxes and non-tax revenues
collected by URA. An important feature of the eTax is
that it generates a unique taxpayer identification
number (TIN). eTax is interfaced with the URA’s
accounting system – Sun Systems. Its functionality
was recently extended to cover eFiling and payments,
and is targeted at around 2,000 medium and large
firms. The eFiling feature of eTax was piloted in
December 2009, and became fully operational in
2010.
Between 2002 and 2004, the Customs and Excise
Department adopted the Automated System for
Customs Data ++ (ASYCUDA++), which was rolled out
from 2005 to 2007. ASYCUDA++ runs at 30 out of 38
customs offices and border stations. This version allows
for direct trader input so that importers can lodge decla-
rations from their bases and minimise the build up of
documents.
Furthermore, to support the cargo tracking between
the revenue authorities of the EAC, URA has imple-
mented the Revenue Authority Digital Data Exchange
system. RADDEX is also operational in Kenya, Rwanda
and Tanzania. According to a status report on the
implementation of URA’s modernisation plan, “the
introduction of RADDEX has further provided cargo
details in standardised electronic format –minimising
data errors and saving time”.
URA has also recently introduced a call centre with a
toll free line, which operates from 8am to 5pm on
weekdays. In addition, the centre responds to any que-
ries lodged at the authority’s new interactive website
(http://ura.go.ug/uraweb/index.jsp). It is also worth
mentioning that, at this new website, taxpayers can
register as an individual, non-individual or a group, and
obtain a TIN from eTax.
Since December 2007, internal communications among
URA staff have been enabled through the use of URA-
net. “URA, in partnership with Uganda Telecoms Limited
(UTL), launched the URAnet upgrade, which now allows
members of URA to communicate among themselves on
intercom network, irrespective of where they are (in
Uganda)” (DFID, 2008).
URA had had, in place, a corporate plan covering the
period from 2006 to 2010, which specified four goals:
(i) maximise taxpayer compliance; (ii) maximise quality
of service delivery; (ii) modernise URA through its
people, processes and systems; and (iv) enhance
URA’s corporate image13. To facilitate monitoring and
evaluation (M&E) of the achievement of performance
indicators and targets contained in URA’s corporate
plan, a corporate scorecard was developed in 2009. It
maintains a record of actual results against baseline
indicators.
13 A new corporate plan based on the balanced scorecard framework has been developed to run until 2014.
Chapter 9
Proceedings from Domestic Resource Mobilization Stakeholder Workshop


Domestic Resource Mobilisation for Poverty Reduction in East Africa: Lessons for Tax Policy and Administration
317
Introduction
The African Development Bank (AfDB) in partnership with
the Korea-Africa Fund for Economic Cooperation (KOA-
FEC), African Tax Administration Forum (ATAF) and the
East African Community (EAC) Secretariat undertook a
project between November 2009 and October 2010
aimed at sharing lessons learned from studying Domes-
tic Resource Mobilisation (DRM) efforts among the EAC
countries, South Korea and South Africa. Its particular
focus was on tax policy and administration. The project’s
objective had been to make recommendations on the
priority tax policy reforms in the EAC and ways to
sequence and implement them for enhancing their DRM.
The production of all technical reports and background
materials related to the project as well as the stakehol-
ders’ workshop in Kampala were made possible from a
generous grant from the KOAFEC.
The project was carried out through case studies of the
EAC partner states, South Africa, and South Korea. For
this work, DRM is defined to include only tax policy and
administration; excluding other possible components of
DRM, such as domestic financial markets. In particular,
the project sought to answer the question: “What key
factors have contributed to or inhibited DRM in the
EAC countries, South Africa, and South Korea?” The
case studies were based on an extensive review of
available literature, interviews with key informants in the
respective countries, collection of quantitative data, and
analysis of both primary and secondary data. The core
principle of the methodological framework used for the
case studies is to analyse tax performance as a result of
both tax systems and reforms. The framework unders-
cores the central role played by tax systems as primary
determinants of tax performance, but it also emphasises
the dynamic interaction between tax systems and
performance through reforms.
The case studies’ findings were presented at a stake-
holders’ workshop held at the Commonwealth Speke
Resort Munyonyo, Kampala on Tuesday 9th and
Wednesday 10th November 2010. The workshop
attracted representatives from the Ministries of Finance
in the EAC and Sudan; Revenue Authorities of EAC
partner states, Nigeria and South Africa; Central Banks
of Kenya and Uganda, AfDB, KOAFEC, ATAF, EAC
secretariat, GTZ, KfW, IMF, World Bank, EPRC, and
others. This report summaries the key outcomes and
emerging messages from this workshop. More specifi-
cally, it sought to answer the following questions:
“What are the priority reforms for EAC partner
states and the EAC?” and “How should these
reforms be sequenced and implemented?
Domestic Resource Mobilisation for Poverty Reduction in East Africa: Lessons for Tax Policy and Administration
318
Background
For decades EAC partner states have been plagued by
widespread poverty, chronic unemployment, uneven
development and political upheaval. Not surprisingly,
mobilising domestic resources to confront these issues
has proved to be a daunting challenge. This perhaps
explains why these countries have been unable to
generate enough domestic resources, forcing them to
rely heavily on foreign aid, foreign direct investment,
export earnings and other external resources. In this
context, DRM needs to be given more emphasis since
international experience shows that high-growth econo-
mies typically save 20-30% or more of their income in
order to finance public and private investment necessary
for achieving sustained economic growth and accelera-
ting poverty reduction. Furthermore, DRM enhances
domestic ownership of the reform agenda since external
resources invariably entail restrictions and conditionality.
For instance, Official Development Assistance (ODA) is
usually oriented to the commercial interests of the
investor, as is the case with Foreign Direct Investment
(FDI). DRM is also more predictable and less volatile than
foreign aid, export earnings, or FDI; and is critical to
domestic integration (strengthening economic linkages
between domestic sectors and regions), which is a
prerequisite for successful integration into the global
economy.
Moreover, although external resources can bridge the
fiscal gap, they ultimately cannot substitute for well-es-
tablished mechanisms for generating domestic
revenue. The EAC partner states have been imple-
menting various tax reforms since the 1990s, mostly
geared towards broadening tax bases, rationalising
taxes to improve investment climate, enhancing
compliance and improving other aspects of tax
revenue administration. However, DRM via taxation is
still below its potential. For example, between 2006
and 2008, tax-to-GDP ratios in the sub-region ranged
from 12.3% to 22.1%, compared to an average of
35.6% and 25.4% for the Organisation for Economic
Cooperation and Development (OECD) countries and
South Africa respectively. Following the reduction in
ODA commitments to developing countries on
account of the recent global financial crisis, there is
renewed urgency for the EAC partner states to
improve public resources mobilisation.
Emerging issues from the DRM
Workshop
This section summarises the key emerging issues from
the consultative workshop and seeks to provide
examples and additional evidence/information where
necessary. These issues are presented under three
broad areas: (i) tax policy and legislative framework; (ii)
tax administration; and (iii) general enabling environment
under which tax administrators collect taxes. They are
intertwined and reinforce each other in the scheme of
domestic resource mobilisation efforts. Nevertheless, we
expound on each separately for purpose of clarity, while
bearing in mind their interconnectedness. Further, where
necessary, we provide international experience on the
emerging issues.
Tax policy and legislative
framework
The main issues raised under the tax policy and
legislative framework included the: (i) need to
broaden the tax base; (ii) benefit of effectively imple-
menting existing tax legislation prior to introducing
new legislation (iii) additionality of an optimally selec-
ted tax-mix; (iv) importance of linking tax revenue
mobilisation to expenditure utilisation; (v) need for tax
harmonisation in the EAC; vi) importance of rationali-
sing tax incentives and exemptions; (vii) objective of
the tax policy; (viii) voluntary tax compliance; (ix) local
government tax revenue mobilisation; and (x) taxing
the informal sector. We expound on each of these
issues based on proceedings from the workshop.

Domestic Resource Mobilisation for Poverty Reduction in East Africa: Lessons for Tax Policy and Administration
319
Need to broaden the tax base
The tax base in all the EAC countries has consistently
remained narrow as evidenced by the less than 20%
tax/GDP ratio for each of them, which is less than the
Sub-Saharan Africa average of about 28%. This low ratio
further highlights the fact that some of the economic
activities eligible for taxation are not being captured by
tax administrators. It also resonates well with workshop
participants’ concern that the current tax system is not
in tandem with the structure of the EAC economies. For
instance, each of these countries has in the recent past
experienced sustained economic growth (except
Burundi), while their share of tax revenue to GDP has
stagnated during the same period. This therefore calls
for efforts towards expanding the tax base. They should
be geared towards making the tax system simple,
efficient, neutral, as well as broadening the tax base while
addressing the equity issues. In principle, simpler taxes
are easier to collect and comply with, as are taxes that
do not pick winners or distort production choices and
allocation of resources (e.g., VAT in Uganda). In addition,
more equitable taxes enhance tax morale and
encourage savings and investments. Participants at the
workshop identified several under-utilised taxes,
including capital gains tax (CGT), property and other
asset-based taxes that EAC countries can explore in the
meantime in a bid to widen the tax base. For instance,
Rwanda has successfully introduced property tax, which
other EAC countries can emulate. Needless to mention
though, introduction or adoption of any new taxes ought
to be done only after rigorous assessment of its implica-
tion(s) on saving and investment behaviour, as well as la-
bour supply choices.
Effective implementation of existinglegislations
Participants raised concerns about the current
implementation level of existing tax legislations within the
EAC region. They cited selective implementation of exis-
ting laws and/or complete non-implementation. For
instance, enforcement of existing tax laws on capital
gains is being carried out arbitrarily. Likewise, tax exemp-
tions and holidays are being granted on an ad hoc basis,
coupled with a high level of non-compliance and
non-remittance of personal income tax from consultancy
works. This situation not only narrows the tax base but
also increases additional revenue loss due to ineffective
implementation of current tax laws. In this context, the
South African experience on CGT implementation is
instructive. In South Africa, CGT not only provided
additional revenues, but also enhanced efficiency of the
income tax system by discouraging taxpayers from
categorising ordinary income into tax-free capital gains.
It also promoted equity by ensuring that taxpayers with
the same levels of income bear comparable tax burdens,
irrespective of their income sources. Participants also
pointed out that if local government legislation on
property tax, hotel tax, and other levies are effectively
implemented, it will enhance local revenue collections. In
short, they strongly recommended the need to devise
ways of ensuring effective implementation of existing tax
laws and legislations, rather than introducing new ones.
Tax mix: Direct or indirect tax
Participants were non-committal on which type of
taxation is appropriate for the EAC region; that is
whether to adopt direct or indirect taxation. Rather the
discussion focused on merits and demerits of each of
the tax, and the prevailing conditions in each country.
It emerged that whereas indirect taxes, such as VAT,
are easy to collect and administratively cheap because
selling units act as points of administration for this tax,
it also has a downside as it mainly targets consump-
tion, leaving out production. Direct taxes, on the other
hand, target both consumption and production, and
hence tends to capture a large share of economy but
require an elaborate administrative system for assess-
ment, collection and supervision. However, the choice
of a tax mix may depend on the objectives of a
Domestic Resource Mobilisation for Poverty Reduction in East Africa: Lessons for Tax Policy and Administration
320
particular tax regime; and requires examining the
additionality of the preferred tax structure in achieving
the stated tax policy objectives. Furthermore, that
choice necessitates balancing both the theoretical and
practical considerations. They include country-speci-
fic circumstances; like ease of collection, extent of the
informal sector, and revenue requirements, among
others. As would be expected, cross-country compa-
risons reveal striking differences in the choice of tax
mix. For instance, the Andean community (Bolivia,
Colombia, Ecuador, Peru, Chile, and Venezuela) has
shown preference for indirect taxes, particularly VAT,
with considerable achievements in the tenets of
neutrality, simplicity, and progressiveness of a tax
system. Currently, in the EAC region, both direct and
indirect taxes have been embraced at varying degrees
in each country. However, considering the large GDP
share of consumption and the burgeoning informal
sector, coupled with the ease of collection, emphasis
needs to be put on indirect taxes in the EAC region.
Linking Tax Revenue Mobilisationto Expenditure Utilisation
Citizens are more receptive to paying taxes when they
can make a direct linkage between taxes paid and
receiving public services in return. However, participants
noted that there was a mismatch between revenue
collection and service delivery in the EAC region. Thus,
whereas the level of tax collection is increasing within the
region, government-rendered services are falling short of
what is collected by the tax authorities. This discourages
citizens from meeting their tax obligation as they see no
or little reason for compliance, because they don’t
receive the desired services. Therefore, governments
within the region need to improve the efficiency and
effectiveness of public spending. They ought to link
additional public revenues to achievement of national
development objectives by publicising what past
additional revenues managed to achieve in quantitative
terms (say, 100 km of road rehabilitated in a particular
financial year as a result of increased tax revenue). This
will enhance tax morale and compliance among the
public. For instance, in South Korea, improved public
expenditure efficiency and publication of the uses of
public revenues enhanced its revenue mobilisation
efforts. The same can be said for Botswana, South
Africa, and Ghana, where explicit linkage between
public expenditure utilisation and tax mobilisation has
increased tax compliance, leading to increased tax
revenue effort.
Harmonisation of tax policy
The lack of convergence on tax policy in the East African
region constitutes a bottleneck to revenue mobilisation
efforts as each country tends to pursue its own tax
policy. In some instances, such a policy tends to be
counterproductive as it might stifle trade among
members. It might also degenerate into unhealthy tax
rate competition as member states begin to use it for
attracting investors, resulting in ‘race to the bottom’.
Therefore, participants agreed that EAC member
countries need to expedite tax policy harmonisation in
order to avoid such occurrences by undertaking the
following measures: (i) strengthen capacity of the EAC
secretariat to coordinate and advise on tax harmonisa-
tion; (ii) harmonise tax legislation to avoid wasteful tax
rate competition; and (iii) draw lessons on tax harmoni-
sation from other economic blocs. This view on tax
harmonisation seems to be shared by scholars as well.
For instance, Hans-Georg Petersen (2010) recommends
development of a common EAC VAT model, reduction of
zero-rated transactions to exports only, harmonisation
and reduction of exempt transactions, and harmonisa-
tion of the tax base in his study. He further recommends
specific rates over ad vorelem, definition of lower and
upper ceilings for the national tax rates, determination of
specific tax rates in the national excise tax laws, abolition
of discriminatory rates for imported goods, and
harmonisation of excise tax rates and tax bases for
levying excise taxes.
Domestic Resource Mobilisation for Poverty Reduction in East Africa: Lessons for Tax Policy and Administration
321
Rationalising tax incentivesand exemptions
Participants generally agreed that the current tax
incentives and exemptions are ad hoc with no clear
guidelines and procedures for awarding them. They
tend to be granted based on political rather than
economic considerations, thereby benefiting only
politically-connected investors. Their duration and
coverage also tends to be vague with the tax autho-
rities left in the dark as such decisions are taken by
politicians, which complicates tax administration
matters with such investors. In fact, participants cited
examples in Uganda where the Uganda Revenue
Authority (URA) Commissioner General had been
sued by such investors in the tax tribunal court for
levying taxes on ‘politically’ exempted transactions.
Therefore, whereas tax incentives can potentially
promote investment in the short-to-medium term,
their overall economic effectiveness might be limited
due to the resulting reduction in tax effort.
Furthermore, excessive use of tax incentives has
complicated tax administration, facilitated evasion
and encouraged corruption. Thus participants want
EAC countries to grant tax incentives and exemp-
tions based on rigorous assesement of costs and
benefits in line with international practices. For
instance, in Canada and South Africa, a full cost-be-
nefit analysis for any major piece of legislation inclu-
ding tax legislation aimed at attracting foreign
investors -- is first carried out before passing it. The
analysis assesses the associated financial and
economic costs as well as benefits and impact on
the various stakeholders, particularly on a country’s
long-term tax revenues. In addition, participants
suggested that the responsibility for setting tax rates
and offering tax concessions should not be
fragmented among several agencies, rather be
centralised under the Ministry of Finance with clear
and transparent guidelines on beneficiaries.
Objective of the tax policy
Tax policy should focus primarily on developing an
efficient and neutral system of easily-administered taxes
with broad bases and moderate marginal rates; while
the expenditure side of the budget addresses income
redistribution. Nevertheless, governments can endea-
vour to design tax systems that are seen to be
consistent with society's perception of an equitable
burden of taxation. For instance, the dual income tax
system, established in the Nordic countries in the
1990s, taxes personal capital income at low and
proportional rates, while labour income tax rates are
sustained at high and progressive levels. This dual
personal income tax regime has proved to achieve
horizontal equity in the taxation of capital and labour
income. Furthermore, lower tax rate on capital income
tends to reduce the incentives for capital exports, as
well as tax avoidance and evasion. However, a major
short-coming of the dual tax system is that it treats
taxpayers with a diverse mix of capital and labour
income differently and hence does not promote tax
neutrality. On the other hand, flat tax regimes
emphasise reducing the tax rate schedule to a single
rate and eliminating tax allowances, with a view to
broadening the tax base. It is also a simpler and easier
system to administer even though flat personal income
tax system, in particular, limits the scope for an
equitable sharing of the tax burden. From the foregoing,
both the flat and dual tax rate systems have
advantages and disadvantages and the choice
between the two is not that straight forward. Thus,
whereas the workshop participants deliberated on the
two systems-- flat and dual tax system -- they did not
pronounce themselves on any one of them.
Nevertheless, Sarejeev Gupta (Deputy Director,
Financial Affairs Department of IMF) suggested that the
EAC region should adopt the dual tax system,
reasoning that its advantages outweigh those of the flat
tax system.

Domestic Resource Mobilisation for Poverty Reduction in East Africa: Lessons for Tax Policy and Administration
322
Voluntary tax compliance
During the workshop, participants also deliberated on
how tax compliance can be improved within the region
and in each of the EAC countries. A number of sugges-
tions cropped up-- some hinged on strengthening the
administration, monitoring and supervisory roles of the
Autonomous Revenue Authorities (ARAs), while others
drifted towards achieving voluntary compliance. The
notion of voluntary tax compliance was further discus-
sed with presentations on South Korea’s experience.
South Korea has been encouraging voluntary tax
compliance since the 1960s by granting preferential
treatments to those who comply. Based on this
experience, participants made the following recommen-
dations in order to promote and improve voluntary tax
compliance within the EAC region: (i) tax simplification so
that all tax payers understand each of tax heads easily;
(ii) increase tax system efficiency and transparency, for
instance, via the rationalisation of tax exemptions; (iii) tax
payer education by holding tax clinics and also incorpo-
rating tax education in secondary curriculum; (iv)
publically rewarding compliant taxpayers; and (vi)
facilitating tax payment, for instance, by teaching small
firms and businesses on how to maintain account books
and allowing them to purchase point of sale machines
that they can claim as inputs when they file their VAT
refunds.
Local government tax revenuemobilisation
Participants agreed that local governments in the
region are resource constrained and therefore, there is
an urgent need to come up with innovative ways of
mobilising domestic resources if they are to deliver their
mandated services. Currently, local governments in the
EAC region rely on irregular central government trans-
fers as their major source of funding. The key question
that emerged from the workshop was: What are the
major constraints to local government efforts at
mobilising domestic resources to supplement central
government transfers? Participants identified a number
of constraints that can be broadly summarised as: (i)
economic or fiscal reasons such as poorly-defined tax
bases, absence of tax handles, and inadequate local
government tax enforcement mechanisms; (ii) impact
of intergovernmental fiscal transfers in the sense that
whereas “matching grants” can encourage local
revenue collections, discretionary transfer system
negatively affects local tax collection efforts; and (iii)
political economy considerations- for instance, limited
accountability of national and local politicians that
discourage local tax effort, coupled with absence of
explicit linkages between local taxation and public
service provision. If the above constrains can be
overcome, participants observed, local governments
will be in a better position to realise substantial amounts
of additional revenue. At the same time, besides
overcoming these constraints, other options of revenue
mobilisation need to be explored. For instance,
participants considered the option of introducing or ex-
panding local property taxes and broadening local
taxes on income and business activity as alternative
avenues of mobilising local revenue.
Taxing the informal sector
A major contributor to low tax effort in the EAC partner
states is the large, often hard-to-tax informal sector. Tax
authorities in the EAC region have achieved minimal
success at drawing the informal sector into the tax net,
consequently constraining efforts at expanding the tax
base. A key question that arose during the workshop
was how the informal sector can be brought into the
tax net. Possible suggestions pointed towards
recognition and legitimisation as well as punitive
measures. In Box 9.1, we provide an overview of
international practices on how to bring the informal
sector into the tax net.
Domestic Resource Mobilisation for Poverty Reduction in East Africa: Lessons for Tax Policy and Administration
323
Tax administration
The key tax administration issue that arose during the
workshop was inadequate operational capacity within
the EAC ARAs. Other issues included: (i) regularity and
timeliness of VAT refunds; and (ii) a case for new tax
administration model.
Operational capacity for ARAs
All participants agreed that there are operational issues
in the region as far as tax administration is concerned.
The issues hinged on low remuneration in comparison
to the private sector, poor working conditions as well as
lack of capacity. Participants therefore concurred that
implementing successful reforms in tax administration
will necessitate marked improvements in efficient use of
available financial, human, and other supportive
resources, such as Information and Communication
Technology (ICT). Innovations in ICT, they argued, ought
to be utilised to support specialisation in the ARA by
freeing up resources to target high revenue, high risk,
and emerging taxpayer niches. Therefore, participants
Box 9.1: Possible ways of taxing the informal sector
Legitimising the informal sector: According to Bird and Wallace (2003), one way to draw the shadow economy
into the tax net is to legitimise the sector by allowing tax holidays and/or exemptions for certain sectors, like agricul-
ture, from taxation, which would significantly reduce the cost of tax administration. This system has been applied in
India where the agricultural sector is constitutionally excluded from central income tax. It encourages the farm owners
to register their business, which draws them into the formal sector. Consequently, it allows them to grow and
eventually graduate into sizable and taxable non-agricultural businesses.
Indirect taxation approach: This is ideal for economies where final consumption taxes significantly capture many
of the informal sector activities and where proportion of the informal sector to the entire economy is relatively large. This
approach has been applied in Guatemala and Jamaica on small tax‐avoiding manufacturers and found to be effective.
However, it is important to note that indirect taxation will not bring the underground businesses into the formal sector.
It only increases the equity in tax treatment between the formal and informal sectors.
Presumptive taxation approach: Following Bulutoglu (1995), presumptive taxation methods can be classified
into four categories: (i) methods that estimate taxpayer's income based on the nature of the business and information
on sales, employees, assets, and location; (ii) methods that impute a return on business assets; (iii) methods that apply
a gross receipts or turnover tax; and (iv) methods that estimate taxpayer’s income on the basis of external indicators,
such as personal expenditure and wealth. They are often advocated in the taxation of informal sectors with the aim of
reducing the cost of compliance and to educate taxpayers to deal with the tax system. At the same time, it is hoped
that this may reduce the incentive to operate in the underground economy. However, the choice of the method of
assessing presumptive tax is determined by the country’s policy objective (such as to reduce tax evasion in general or
to simplify the tax system for small taxpayers); as well as complexity of the tax administration system and data
availability. Bird and Wallace (2004) showed that simplified tax systems are widely used for the informal sectors,
particularly Small and Medium Enterprises (SMEs) in developing countries in Central and Latin America (Mexico,
Bolivia and Uruguay).
Source: Clyde (2010)

Domestic Resource Mobilisation for Poverty Reduction in East Africa: Lessons for Tax Policy and Administration
324
submitted that the following priority areas should be
considered to enhance operational capacity of the EAC
tax administration authorities:
(i) Enhanced and efficient utilisation of available or-
ganisational capacities: identifying sectors with the hi-
ghest risks to revenue collection will allow EAC ARAs to
fill the most critical skills gaps, particularly in the areas of
tax investigations, internal audit and compliance,
operations research, planning, and data management.
Collaboration, especially in sharing information between
ARA departments and other government agencies
(such as land and company registries and financial
institutions) could allow ARAs to maximise operational
capabilities;
(ii) Effective utilisation of ICT: to maximise returns
from ICT investments, ARAs should ensure that the next
generation of ICT reforms focus on the following: (i)
integrating core tax systems to engender single-view of
the taxpayer; (ii) integrating ARA ICT systems with third
party source data systems, such as land and company
registries; (iii) optimising ICT systems usage by providing
incentives to taxpayers to file taxes in off-peak periods;
and (iii) optimising utilisation of data generated by
ICT systems for evidence-based decision making; and
(iii) Operational research capacity: In addition to the
utility of enhancing tax policy research, it is also impor-
tant for the EAC ARAs to develop operational research
capacity. Such capacity would regularly and reliably
provide useful indicators of the efficiency and effective-
ness of interventions in such aspects of performance
as: taxpayer feedback on ARA staff attitudes and
services (e.g., the ease using ICT systems on eFiling);
and voluntary compliance. Also, operational research
would seek to understand emerging trends in particular
sectors and industry groups so as to inform the design
of more appropriate interventions for improving
compliance management and enforcement.
Regularity and timeliness of VATrefunds
Participants noted that currently VAT refunds are irregular
and not issued on a timely basis, thereby negatively im-
pacting tax compliance. They cited numerous challenges
within the region relating to VAT refunds, such as the long
period it takes to refund claimants (about 60 days in Kenya,
6 months in Tanzania), discriminatory tax refund policy (e.g.,
in Rwanda), and ad hoc principle on deduction of input tax.
Box 9.2 summarises VAT refund challenges within the EAC
region. The delay in tax refunds affects company cash
flows and has the potential of slowing business processes
and expansion with the worst case scenario being insol-
vency. However, participants suggested the use of ICT-
based risk filters in order to improve the timeliness of tax
refunds. This would provide ARAs with information on tax
payer risk profile, which could go a long way in improving
tax audits and other verifications.
Domestic Resource Mobilisation for Poverty Reduction in East Africa: Lessons for Tax Policy and Administration
325
New tax administration model:Is there a need for one in the EACregion?
Over the years, tax revenue collections as share of GDP
have not grown in tandem with economic performance
within the region. That is why EAC countries have
undertaken a number measures to enhance tax collec-
tion. These measures, however, have highlighted some
important issues. One such issue relates to the fact that
tax audits may not be the best response to non-com-
pliance, especially if it is caused by ignorance of the law.
It may also indicate that taxpayer education is not the
best response to deliberate tax evasion. Moreover, it may
show that imposition of strong penalties may not be
appropriate where voluntary compliance with tax obliga-
tions is made difficult by inadequate administrative
policies and procedures. This calls for an integrated
compliance programme that will deliver the optimal mix
of responses, such as tax education, audit, and
enforcement to mitigate identified tax system risks. It also
calls into question the current tax administration model
being pursued by the ARAs. So the obvious question
was whether there is a need for a new tax administration
model within the region. The answer to such a question
can only be provided by empirical analysis.
General enabling environment
Key issues that arose at the workshop regarding the
general enabling environment for tax administration
included: (i) better use of taxpayer information and
identification; and (ii) enabling legislation to allow for the
sharing of third party information.
Box 9.2: VAT refund problems within the EAC region
In Kenya, VAT refunds are often made after 60 days, in spite of the statutory requirements that refund should be
done within 60 days. Moreover, there is no entitlement for interest payments on delayed tax refund. The law in Tanza-
nia mentions a period of six months even though exceptions apply to companies having regular excess input tax, like
exporters. Uganda has usually an immediate refund for such companies but non-recurring excess input tax is only
refunded if the amount exceeds US$2500.
Rwanda, on the other hand, runs a discriminatory tax refund policy because it provides particular exceptions for
deductibility. For instance, in case of “importation of services”, the reverse charge method is applicable (Article 29 VAT
law). Thus the “importer” is obliged to pay the VAT but can only deduct the tax as an input tax if the importer gets a
service that is not available on a local market. This regulation is discriminatory and constitutes a distortion of
competition principle within the EAC region. Additionally, in Rwanda, an exporting enterprise cannot deduct input tax
related to its own purchases of the merchandise if it does not repatriate the proceeds from his/her activities into
Rwanda. This also is contradictory to the VAT system and violates the EAC principle of free movement of capital.
Similarly, in Burundi, the principle of deduction of input tax is not fully satisfied since only 50% of input tax (related
to investment) is generally eligible for deduction. When deduction of input tax has been claimed for an acquisition of
goods, it has to be reversed. This regulation is not in line with VAT principles and should be harmonised. Generally,
deduction of input tax is of crucial importance to the VAT system. Therefore, there is need to harmonise the legal basis
and the administrative processes regarding VAT input tax deductions.
Source: Hans-Georg et al (2010)

Domestic Resource Mobilisation for Poverty Reduction in East Africa: Lessons for Tax Policy and Administration
326
Taxpayer informationand identification
EAC countries have under-developed national identi-
fication (ID) systems or have only recently
embarked on their implementation. Rwanda and
Kenya have national IDs and are in the process of
upgrading their systems to allow for real time data
transmission and sharing with other national
agencies. Tanzania and Uganda have taken initiatives
to introduce biometric national ID cards. They can
facilitate information-sharing across public institutions
(including ARAs) and help in the tracking of taxpayers
transactions. Therefore, participants suggested full
adoption of national biometric IDs in order to improve
tracking of tax payers. In addition, financial sector
information on depositors and public sector data
bases can be a good step to begin with on tracking
taxpayers. The Deputy Governor of the Bank of
Uganda, however, sounded a warning note on the
use of financial sector information to monitor
taxpayers. He reasoned that such a practice might
actually discourage people from using financial
services. Moreover, it could undermine efforts to
broaden the use of financial services and has the
potential to discourage savings. Nevertheless, finan-
cial sector information can potentially supplement
other data sources, such as TINs in expanding the
tax net. Participants, however, agreed that for the
moment, public sector databases, including land and
company registries, present the most viable options
to enhance tracking of current and potential
taxpayers.
Sharing of third party information:Is there an enabling legislation?
Participants noted that there is a need for collaboration,
especially in sharing of information between ARA depart-
ments and other government agencies (such as land and
company registries and financial institutions). Currently,
such effort is either minimal or non-existent in the EAC
region. For instance, only Kenya uses third party
information, primarily from the property and business
registries, to support its compliance management inter-
ventions. However, utilisation of this avenue by other EAC
partner states is hampered by the absence of both
supporting legislation and the quality of national data-
bases. Furthermore, while all EAC ARAs maintain basic
taxpayer identification information, only Kenya and
Rwanda have national identifiers, which are also linked to
other public and private information infrastructure.
Conclusion
Based on discussions and emerging issues from the
workshop, it was concluded that the following need to
be addressed in order to enhance domestic resource
mobilisation in the EAC.
The tax base needs to be broadened. First, there is a
need for streamlining tax exemptions and incentives, with
clear procedures, duration and a coordinating unit within
the country and across the region. This will avoid the
current chaos that has been caused by the ad hoc man-
ner in which such exemptions are extended to business
people – normally putting tax administrators at logger
heads with potential tax payers and the general public.
Moreover, tax exemptions and incentives within the EAC
region need to be harmonised in order to ensure that
member countries do not use them for attracting investors
to their country. This might cause a ‘race to the bottom’
and unnecessary concessions being extended to would-
be investors. In fact, workshop participants agreed that
investors value other things more highly, such as reliable
infrastructure and a consistent policy environment.
Second, existing policies and laws should be enforced
before introducing any new ones. This will help in redu-
cing the pervasive tax evasion problem in the region. Third,
addressing the areas highlighted below will also help in
bringing more tax payers into the net, which will lead to
broadening the tax base and an increase in tax collection.
Domestic Resource Mobilisation for Poverty Reduction in East Africa: Lessons for Tax Policy and Administration
327
An appropriate tax mix needs to be developed Further
research is required on the appropriate level of direct/in-
direct taxes, and where the emphasis should be for the
most efficient revenue yield. In addition, efficiency and
neutrality concerns should supersede equity concerns,
as equity can be managed on the expenditure side of
fiscal policy.
Improve linkage between revenue mobilisation and
expenditure utilisation Governments in the EAC should
link tax effort to service delivery in order to demonstrate
what is collected by government as revenue and the
public goods and services they provide. This will help in
improving tax compliance and, thus, tax revenue collec-
tion. Compliance can also be enhanced through educa-
tion and general taxpayer communication campaigns.
Build capacity in Revenue Authorities Participants
agreed that this could be a key area for development
partner support. This capacity needs to align with the
structure of the economy, its key sectors and the
development path going forward (e.g., a budding oil in-
dustry in Uganda). ICT can be used appropriately to
supplement RA capacity and efficiency.
Revenue Authorities require strong political
leadership and support This point was emphasised
by the Commissioners General and other ARA staff.
They argued that ARAs need to have clear targets as
well as managerial and operational autonomy to
achieve this. At the same time, performance criteria
need to be expanded to include issues like client
services and staff training. Such support will help
encourage taxpayer compliance and reduce tax
evasion. At the moment, evasion in the EAC region
seems most common among well-established firms
with close links to the political class.
Strengthen linkages between institutions Participants
were in agreement that the linkages, especially between
public sector institutions, are weak. Thus, the quality of
their databases must be improved and expanded, and
ultimately linked for a more comprehensive view of
taxpayers.
Policies and tax rates in EAC member countries
need to be harmonised Member countries must not
use tax rates as a way of competing and attracting
investors to their respective countries.
This would have negative consequences for the inte-
gration and economic success of the whole region.
Participants noted that this is another area where deve-
lopment partner assistance would be very welcome.
Domestic Resource Mobilisation for Poverty Reduction in East Africa: Lessons for Tax Policy and Administration
328
References
Africa Development Bank (AfDB) 2010, “Domestic Resource Mobilization for Poverty Reduction in East Africa: Burundi,
Kenya, Rwanda, South Africa, South Korea, Tanzania, & Uganda country case studies”.
Arias, L., A. Barreix, A. Valencia, and L. Villela (2004). “The Harmonization of Indirect taxes in the Andean Community.”
Buenos Aires: Inter-American Development Bank/ INTAL
Atkinson, A.B., “Optimal taxation and the direct versus indirect tax controversy,” Canadian Journal of Economics 10
(1977), 590-606
Bird, R.M and Wallace Sally (2003 & 2004): Is It Really Hard To Tax the Hard‐To‐Tax?
The Context and Role of Presumptive Taxes. A preliminary document circulated for comments and discussion
at Joseph Rotman School of Management, University of Toronto, Canada. Website: http://w.w.w.rotman.uto
ronto.ca/iib/
Bulutoglu, Kenan (1995), “Presumptive Taxation” in P. Shome (ed.), Tax Policy Handbook, Washington DC, IMF
Clyde Mutsotso (2010), “Harmonization of EAC tax policies and laws: Proposals for Taxation Regime for Fostering
Small Business Development and Regional Economic Growth” CUTS GRC series publications
Daniel Platz (2009), Infrastructure finance in developing countries—the potential of sub-sovereign bonds:
DESA Working Paper No. 76ST/ESA/2009/DWP/76
David Widdowson, (n.d): “Managing risks in the Customs context”, Asian Development Bank
IMF conference on: Economic policy and Equity: IMF Headquarters, Washington, DC, June 8–9, 1998
Fernando Velayos, Alberto Barreix and Luiz Villela (n.d) Regional Integration and Tax Harmonization: Issues and
Recent Experiences
Hans-Georg Petersen, et all (2010), Tax systems and Tax Harmonization in the East African Community (EAC)-
Report for the EAC/GTZ program on support to the EAC integration process.
Suhas L. Ketkar and Dilip Ratha (2007): Development Finance via Diaspora Bonds Track Record and Potential: Paper
presented at the World Bank


Domestic Resource Mobilisation for Poverty Reduction in East Africa: Lessons for Tax Policy and Administration
331
Annex 9.1
Country/Organization Name Job Title Email
Burundi
Mme Clotilde Nizigama Minister of Finance [email protected]
Mr. Emile SinzumusiDeputy Commissioner General,Burundi Revenue Authority
Mr. Nimenya M Burundi Revenue Authority [email protected]
Mr. Niyonziah Levie Director, Burundi Revenue Authority [email protected]
KenyaProf. Njuguna Ndung'u Governor, Central Bank of Kenya [email protected]
Mr.John NjirainiCommissioner, Domestic Tax Department,Kenya Revenue Authority
Nigeria Mr. Fashola. N. ADeputy Director, Federal Inland RevenueServices
Rwanda Mr. Torero EugeneDeputy Commissioner General, Rwanda Re-venue Authority
South AfricaMr. Mbongiseni NgcoboBrandley
Senior Manager, Capacity Development,South African Revenue Services
SudanMs. Amna Ahmed SaadAbdellah
Director, National Revenue General Directo-rate, Ministry of Finance and National Eco-nomy
Tanzania
Mr. Bedason Shallanda Commissioner, Ministry of Finance [email protected]
Mrs. Nema MremaAg. Commissioner, Tanzania Revenue Autho-rity
Mr. Patrick KasseraCommissioner, Domestic Tax Department,
Tanzania Revenue [email protected]
Mr. Tonedeus K. Muga-nyizi
Director, Tanzania Revenue Authority [email protected]
Uganda
Hon. Syda BbumbaMinister of Finance, Planning and EconomicDevelopment
Mr. Patrick OcailapDirector Budget, Ministry of Finance,Planning and Economic Development
Mr. Lawrence KiizaDirector Economic Affairs, Ministry of Finance,Planning and Economic Development
Mr. Gerald SendawulaChairperson, Private Sector FoundationUganda & Uganda Revenue Authority
Mrs. Allen KaginaCommissioner General, Uganda Revenue Au-thority
Dr. Louis Kassekende Deputy Governor, Bank of Uganda [email protected]
Dr. Wilberforce KisambaMugerwa
Chairman, National Planning Authority [email protected]
Mr. Wamibu MichaelAg. Commissioner Tax Policy Department, Mi-nistry of Finance, Planning and Economic De-velopment
Mr. Moses OgwapusAg. Assistant Commissioner Tax Policy Dept,Ministry of Finance, Planning and EconomicDevelopment
Mr. Francis Twinamatsiko Senior Economist, Ministry of Finance, Plan-ning and Economic Development
f r a n c i s . t w i n a m a t s i k o @ f i -nance.go.ug
List of participants

Domestic Resource Mobilisation for Poverty Reduction in East Africa: Lessons for Tax Policy and Administration
332
Ms. Susan NakagoloEconomist, Ministry of Finance, Planning andEconomic Development
Mr. Gerald NamomaEconomist, Ministry of Finance, Planning andEconomic Development
Ms. Jennifer MuwulizaAg. Commissioner ALD, Ministry of Finance,Planning and Economic Development
Mr. H.Opondo Director, Bank of Uganda [email protected]
Mr. Kalyeebi MagoolaResearch Planning and Economic Develop-ment
Ms. Sarah BanageAssistant Commissioner, Public & CorporateAffairs Management, Uganda Revenue Autho-rity
Mr. Moses KajubiCommissioner, Domestic Tax Department,Uganda Revenue Authority
Prof. Moses Golola Deputy Executive Secretary [email protected]
Mr. Moses OgwalDirector Policy and Advocacy, Private SectorFoundation Uganda
Mr. Kavuma John BoscoEconomic Analyst, National Planning Autho-rity
Mr. Twimera EvaristSenior Research Fellow, Economic Policy Re-search Center
Dr. John Mary MatovuPrincipal Research Fellow, Economic PolicyResearch Center
Mr. Jeff Alumai. GResearch Fellow, Economic Policy ResearchCenter
East African Commu-nity Secretariat
Mr. Keneth Bagamu-hunda
Director Customs [email protected]
AfDB Staff
Mr. Aloysious OrduVice President, Regional and Country Pro-grammes
Mr. Steve Kayizi-Mu-gerwa
Director, Operational Policy Resources andPolicy
Mr. Nimpe Boaz Senior Advisor to Executive Director [email protected]
Ms. Diarietou Gaye Director, Regional Department East 'A' [email protected]
Mrs. Catherine BaumontLead Economist, Regional Department East'A'
Ms. Patience Kuruneri Social Sector Specialist [email protected]
Ms. Belinda ChesireSenior Cooperation Officer, Partnerships andResource Mobilization Unit
Ms Jean Shirley Economist, Regional Department East 'A' [email protected]
Mr. Myeongjoo Kim Senior Advisor to Executive Director [email protected]
Mr. Patrick Khaemba Resident Representative, Uganda [email protected]
Ms. Peninah Kariuki Country Economist [email protected]
Mr. Edward Sennoga Country Economist [email protected]
Mrs. Furaha Bishota-Fol-quet
Country Programme Officer [email protected]

Domestic Resource Mobilisation for Poverty Reduction in East Africa: Lessons for Tax Policy and Administration
333
Ms. Sylvia Namuli Research Assistant [email protected]
Ms. Buzingo Domina Resident Representative, Kenya [email protected]
Mr. Richard Walker Country Economist r.walker@afdb,org
Mr. Bhakta Prajesh Officer in Charge, Tanzania [email protected]
DevelopmentPartners
IMFMr. Sarajeev Gupta Deputy Director, Fiscal Affairs Department [email protected]
Mr. Tom Richardson Senior IMF Resident Representative, Uganda [email protected]
World Bank
Ms. Kundhavi Kadiresan Country Manager [email protected]
Mr. Paul Wade Senior Economist [email protected]
Mr. Asumani Guloba Economist [email protected]
UNDPMr. Sebastian Levine Senior Economist [email protected]
Mr. David Marcos Program Officer [email protected]
KfW Ms. Carmen Schickinger Senior Economist [email protected]
GTZ Dr. Christiane Schuppert Advisor [email protected]
Missions andAgencies
Mr.Johannes van Niekerk Counsellor, High Comission of South Africa [email protected]
Mr. Simon Kamanu Commercial Attache, Kenya High Commission [email protected]
H. E. Mr. Gaspard Musa-vyarabona
Ambassador, Embassy of Burundi [email protected]
Mr. Marlon Gilbert Second Secretary, Trinidad and Tobago [email protected]
Mr. Anisa Mbega First Secretary, Tanzania High Commission [email protected]
Pricewaterhouse-Coopers
Ms. Kariuki Elizabeth Director, Advisory Services [email protected]
African DevelopmentProfessional Group
Mr. Kithinji Kiragu Director [email protected]

Domestic Resource Mobilisation for Poverty Reduction in East Africa: Lessons for Tax Policy and Administration
334
Annex 9.2
Presentations
Louis Kasekende (2010), “Domestic Resource Mobilisation Priority Reforms in EAC and Africa: Sequencing and
Implementation”. Presentation at the workshop held at Commonwealth Speke Resort Munyonyo, Kampala-Uganda
Richard Walker (2010), “Lessons from South Korea for DRM”. Presentation at the workshop held at Commonwealth
Speke Resort Munyonyo, Kampala-Uganda
Njuguna Ndung’u (2010), “Domestic Resource Mobilization Priority Reforms in EAC and Africa, their Sequencing and
Implementation” Presentation at the workshop held at Commonwealth Speke Resort Munyonyo, Kampala-Uganda
PWC (2010), “Domestic Country Mobilization: Country Case Study Findings”. Presentation at Kampala-Uganda, 9th & 10th
November, 2010.
Sanjeev Gupta (2010), “Learning from the Global Experiences in Domestic Resource Mobilization”. Presentation at the
workshop held at Commonwealth Speke Resort Munyonyo, Kampala-Uganda
Sennoga Edward (2010), “Strategic Policy Options for Enhancing DRM: Key emerging recommendations for East Africa”.
Presentation at the workshop held at Commonwealth Speke Resort Munyonyo, Kampala-Uganda