lesson 4: back to school - federal reserve bank of atlanta · lesson 4: back to school. lesson...
TRANSCRIPT

LESSON 4: B ACK TO SCHOOL
1
Lesson 4: Back to School
Lesson Description
In this five-part lesson, students look at the financial lessons that a teen and her family learned while they were displaced from their home and community following Hurricane Katrina. The lesson content examines postsecondary education as a key to greater financial well-being, the costs of and financing options for postsecondary education, and budgeting and saving for achieving financial and personal goals and more.
The lesson is designed for personal finance classes and is presented in two formats: 1) SMART Board-based lesson and 2) PowerPoint-based lesson.
The video component of the lesson shares the financial and personal experiences and lessons learned of a teenage girl, her family, and friends when they were forced to evacuate New Orleans during Hurricane Katrina and after they returned.
LESSON 4: B ACK TO SCHOOL
2
Time Required
Five to seven 45-minute class periods for entire lesson.
The SMART and PowerPoint lessons and/or individual lesson components could be utilized in single-class-period segments.
Concepts
529 college savings plan
Budget
Careers, career goals
Certificate of deposit
Debt
Deductions
Discouraged workers
Emergency fund
Employment/Unemployment/ Unemployment rate
Exempt/Nonexempt worker
Expenses, fixed and variable
Free Application for Federal Student Aid (FAFSA)
Grants
Human capital
Income, gross and net
Income, salary and wages
Interest/Interest rate
Interest, simple and compound
Investing
Labor force
Liquidity
Money market account
Opportunity cost
Postsecondary education
Principal
Rule of 72
Saving
Savings account/Savings bonds
Scarcity
Scholarships
Student loans
Term
Withholdings, required and voluntary
Work study programs
Objectives
The students will be able to:
• Analyze graphs and charts related to education and saving.
• Articulate reasons and goals for saving.
• Evaluate the opportunities and expenses associated with postsecondary education.
• Explain and use the vocabulary associated with postsecondary education, budgeting, and saving.
• Identify postsecondary institutions that offer specific programs of study.

LESSON 4: B ACK TO SCHOOL
3
• Identify the purpose of a budget.
• Implement the budgeting steps.
• Perform calculations for growth of funds.
• Recognize that higher education is the key to greater income over a lifetime.
• Recognize the need for financial preparedness in the face of a disaster.
• Understand the relationship between human capital and income.
Materials
• Presentation: Katrina’s Classroom Lesson 4 — SMART Notebook file* or PowerPoint presentation
• “Back to School” video: DVD, flash drive or online (www.youtube.com/watch?v=KXvC-CVO1Mk)
• Handouts 1, 2, 3, 5, 6, 8: One copy per student
• Handout 4: One to two copies total, depending on number of students
• Handout 7: One copy for each group
*SMART Notebook files for all lessons can be found at www.frbatlanta.org/edresources/classroomeconomist/.

LESSON 4: B ACK TO SCHOOL
4
National Curriculum Standards
COMMON CORE STANDARDS
Grades 6–8 students Grades 9–10 students Grades 11–12 students
College and Career Readiness Anchor Standards for Reading Key Ideas and Details
1. Read closely to determine what the text says explicitly and to make logical inferences from it; cite specific textual evidence with writing or speaking to support conclusions drawn from the text.
College and Career Readiness Anchor Standards for Reading Integration of Knowledge and Ideas
7. Integrate and evaluate content presented in diverse media and formats, including visually and quantitatively, as well as in words.
College and Career Readiness Anchor Standards for Writing Production and Distribution of Writing
1. Produce clear and coherent writing in which the development, organization, and style are appropriate to task, purpose, and audience.
College and Career Readiness Anchor Standards for Writing Research to Build and Present Knowledge
8. Gather relevant information from multiple print and digital sources, assess the credibility and accuracy of each source, and integrate the information while avoiding plagiarism.
College and Career Readiness Anchor Standards for Writing Research to Build and Present Knowledge
9. Draw evidence from literary or informational texts to support analysis, reflection, and research.
College and Career Readiness Anchor Standards for Speaking and Listening Comprehension and Collaboration
1. Prepare for and participate effectively in a range of conversations and collaborations with diverse partners, building on others’ ideas and expressing their own clearly and persuasively.
College and Career Readiness Anchor Standards for Speaking and Listening Presentation of Knowledge and Ideas
4. Present information, findings, and supporting evidence such that listeners can follow the line of reasoning and the organization, development, and style are appropriate to task, purpose, and audience.

LESSON 4: B ACK TO SCHOOL
5
National Curriculum Standards (continued)
JUMP$TART NATIONAL PERSONAL FINANCE STANDARDS
8th Grade Students Additional Expectations
12th Grade Students Additional Expectations
Income and Careers
Standard 1: Explore career options.
Give an example of how education and training can affect lifetime income.
Identify online and printed sources of information about jobs, careers, and entrepreneurship.
Compare personal skills and interests to various career options.
Describe the educational or training requirements, income potential, and primary duties of at least two jobs of interest.
Identify individuals who can provide a positive job reference.
Identify a career goal and develop a plan and timetable for achieving it, including educational or training requirements, costs, and possible debt.
Planning and Money Management Standard 1: Develop a plan for spending and saving.
Prepare a personal spending diary. Discuss the components of a personal
budget, including income, planned saving, taxes, and fixed and variable expenses.
Explain how to use a budget to manage spending and achieve financial goals.
Identify changes in personal spending behavior that contribute to wealth-building.
Given a scenario, design a personal budget for a young person living alone.
Analyze how changes in circumstances can affect a personal budget.
Credit and Debt Standard 1: Identify the costs and benefits of various types of credit
Explain how interest rate and loan length affect the cost of credit.
Using a financial or online calculator, determine the total cost of repaying a loan under various rates of interest and over different periods.
Explain how students, homeowners, and business owners use debt as an “investment.”
Explain the potential consequences of deferred payment of student loans.
Identify various types of student loans and alternatives to loans as a means of paying for postsecondary education.

LESSON 4: B ACK TO SCHOOL
6
8th Grade Students Additional Expectations
12th Grade Students Additional Expectations
Saving and Investing
Standard 1: Discuss how saving contributes to financial well-being.
Give examples of how saving money can improve financial well-being.
Describe the advantages and disadvantages of saving for short- and medium-term goals.
Explain the value of an emergency fund. Explain why saving is a prerequisite to
investing.
Describe the advantages and disadvantages of saving for short-, medium-, and long-term goals.
Identify and compare saving strategies—including “pay yourself first,” payroll deduction, and comparison shopping to spend less.
Develop a definition of wealth based on personal values, priorities, and goals.

LESSON 4: B ACK TO SCHOOL
7
Lesson Procedures
Specific instructions for SMART Board and PowerPoint are highlighted with a dotted border.
SLIDE 1. TITLE SLIDE
These lessons will cover information related to education as a foundation for earning income, budgeting and saving to achieve personal financial goals, and preparing for emergency situations.
SLIDE 2. LESSON OBJECTIVES
In these lessons, we define human capital; explore the relationships between education and income and between education and unemployment; learn and implement the components of a budget; and discuss how saving can help students meet personal financial goals.
SLIDE 3. HUMAN CAPITAL AND EDUCATION
Tell students that an important part of earning power relates to human capital—our knowledge, skills, and training. Emphasize that people invest in human capital by going to school, pursuing additional training, and developing skills.
SLIDE 4. HUMAN CAPITAL: INVEST IN YOURSELF
Human capital is the knowledge, talent, and skills that people possess. Explain that every person’s human capital is different. One person’s human capital may be appropriate for a particular career while another person’s may be better suited for another. There is a strong correlation between the level of a person’s human capital and the amount of income earned. The good news is that we aren’t limited to one level of human capital. We can learn new skills and gain knowledge—which means our human capital can change over our lifetimes as we acquire new knowledge and skills.
SLIDE 5. YOUR HUMAN CAPITAL
Tell students that as they prepare for their future careers, they should consider their human capital and ways to acquire, maintain, and improve it.
Tell students that they are going to think about their own human capital, both current and future.
ACTIVITY INSTRUCTIONS
Distribute copies of Handout 1 (Human Capital Assessment) or have students record their responses on a sheet of paper.
LESSON 4: B ACK TO SCHOOL
8
Explain to students that the table is an outline to use as they think about their current and future human capital. For the Current human capital column, students should respond based on the traits that they currently have. For the Future human capital column, students should consider their future education, training, and career goals and how attaining those goals can affect their human capital. Give students a few minutes to reflect and write their answers. When they’re done with the table, tell them to respond to the reflection questions at the bottom.
After students complete the handout, ask for volunteers to share examples of their current and future human capital.
SMART Board instructions
Use your finger to touch each circle with the question mark to reveal discussion questions you can use with the students. Touch the blue arrows to return to the original position.
PowerPoint instructions
Click Enter to reveal the discussion questions at the bottom of the slide.
ASK THE STUDENTS How does your current human capital differ from your future human capital? Possible responses: Currently, lower levels and less work experience; in the future, potential of higher levels depending on additional education and training, experience, and other factors. Point out to students that the more human capital they possess, the more likely they will have higher paying careers.
What steps do you need to take to achieve your future human capital? Possible responses: Continue to receive an education, make plans to go to college, acquire a certification in a specific area of interest, learn more about skills needed for desired careers.
SLIDE 6. HOW LONG WILL IT TAKE TO EARN $1 MILLION?
Explain to your students that now that they have explored their future human capital, they can estimate how long it will take for them to become millionaires based on various levels of education. The median incomes represent a wide range of occupations. The actual length of time to earn $1 million will vary according to the specific career path.
ACTIVITY INSTRUCTIONS
Distribute a copy of Handout 2 (How Long Will It Take to Earn $1 Million?) or have students record their responses on a sheet of paper. Tell them to work with a partner to discuss and estimate the median annual salary for the various levels of education listed. They should also calculate how many years it will take to earn $1 million based on the estimated salaries. Students
LESSON 4: B ACK TO SCHOOL
9
should record their answers in the Estimate columns. You may need to remind students that they can calculate the number of years by dividing $1 million by the estimated median annual salary. Once students have identified their estimates and calculated the number of years, they should plot (using a triangle for each data point) the estimated amount of time to earn $1 million for each level of education. Give students a few minutes to work with their partners.
Ask the class to share their estimates of the various salaries by education level and record the salary predictions on the board.
ASK THE STUDENTS Why did you guess as you did? Possible responses: People who work in certain jobs generally earn more money; those with higher levels of human capital are often paid more.
SMART Board instructions
Use your finger to tap the cell shades to reveal the correct answers for the 2015 median annual salary and then the number of years to earn $1 million. Have students record the actual median annual salary and number of years to earn $1 million in the “actual” columns for each level of education. Repeat the process until you’ve revealed the information for all eight levels of education. To restore the shades, click the gray area of the cell.
PowerPoint instructions
Click the Enter key (or the advance button) to reveal first the correct answers for the 2015 median annual salary and then the number of years to earn $1 million. Have students record the actual median annual salary and number of years to earn $1 million in the “actual” columns for each level of education. Repeat the process until you’ve revealed the information for all eight levels of education.
The annualized number is based on 2015 median weekly salary data from the U.S. Bureau of Labor Statistics (BLS; www.bls.gov/emp/ep_chart_001.htm).
ASK THE STUDENTS Were your predictions close? Possible responses: Yes, no.
Do any of the salaries surprise you? Why? Possible responses: Salaries were much lower/higher than expected; time to earn $1 million is much shorter/longer than expected.
Tell the students they will now plot (using a square for each data point) the actual amount of time to earn $1 million dollars for each level of education.
When students have completed their graphs, continue to the next slide.
LESSON 4: B ACK TO SCHOOL
10
SLIDE 7. HOW LONG WILL IT TAKE TO EARN $1 MILLION?
Explain to the students that the graph shows both a potential number, which may or may not be similar to their estimates, as well as the actual number of years it would take to earn $1 million for each of the education levels and their related median salaries.
ASK THE STUDENTS Do your graphs look similar to the one displayed on the screen? What is different? Possible responses: The estimate is different, data points were (were not) correctly plotted for the actual number of years.
How would you interpret the graph? In other words, what does the graph tell you about the salaries? Possible responses: Lower education levels take much longer to earn $1 million; estimates were near/far from the actual number of years; using actual data is important in informing decisions.
What does this make you think about your future potential human capital? Possible responses: I may want to rethink education goals in order to earn more money more quickly.
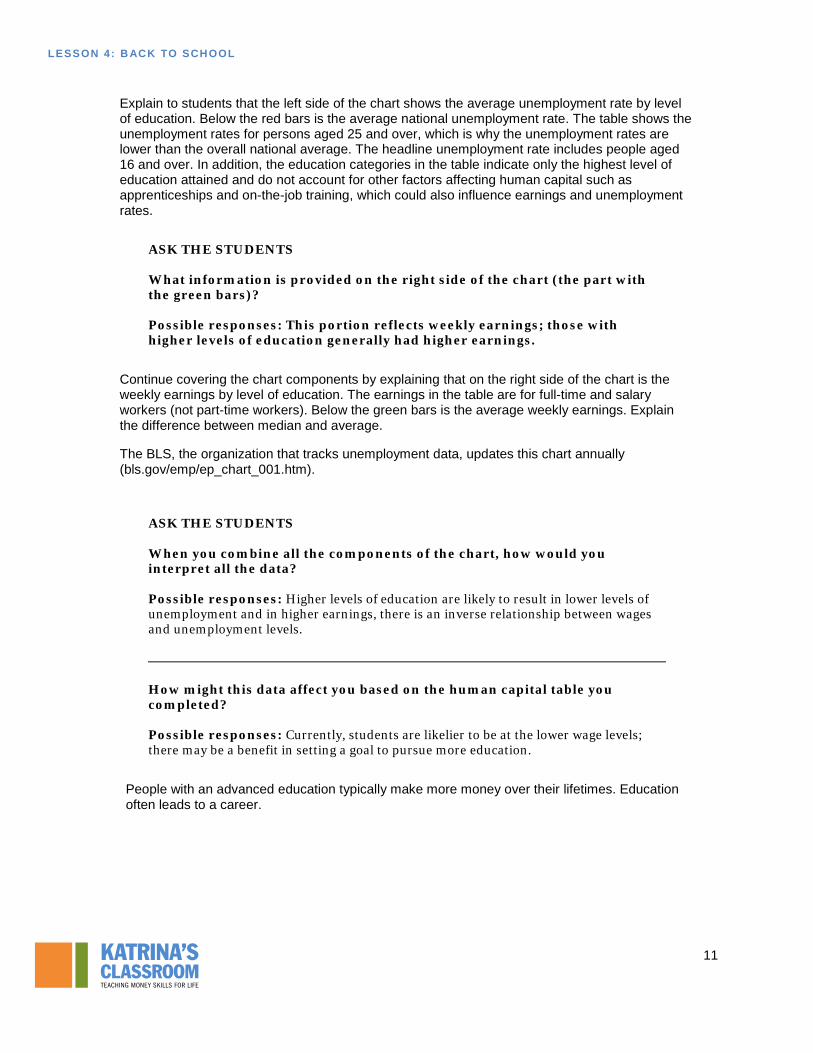
SLIDE 8. EARNINGS, UNEMPLOYMENT RATE, AND EDUCATION
Remind students about the strong correlation between the level of a person’s human capital and the amount of income earned. Emphasize that both of these factors also have a close connection with the likelihood of being unemployed.
The chart shows this relationship.
ASK THE STUDENTS What information is provided on the left side of the chart (the part with the red bars)? Possible responses: This portion reflects the unemployment rate; those with higher levels of education have lower levels of unemployment.
LESSON 4: B ACK TO SCHOOL
11
Explain to students that the left side of the chart shows the average unemployment rate by level of education. Below the red bars is the average national unemployment rate. The table shows the unemployment rates for persons aged 25 and over, which is why the unemployment rates are lower than the overall national average. The headline unemployment rate includes people aged 16 and over. In addition, the education categories in the table indicate only the highest level of education attained and do not account for other factors affecting human capital such as apprenticeships and on-the-job training, which could also influence earnings and unemployment rates.
ASK THE STUDENTS What information is provided on the right side of the chart (the part with the green bars)? Possible responses: This portion reflects weekly earnings; those with higher levels of education generally had higher earnings.
Continue covering the chart components by explaining that on the right side of the chart is the weekly earnings by level of education. The earnings in the table are for full-time and salary workers (not part-time workers). Below the green bars is the average weekly earnings. Explain the difference between median and average.
The BLS, the organization that tracks unemployment data, updates this chart annually (bls.gov/emp/ep_chart_001.htm).
ASK THE STUDENTS When you combine all the components of the chart, how would you interpret all the data? Possible responses: Higher levels of education are likely to result in lower levels of unemployment and in higher earnings, there is an inverse relationship between wages and unemployment levels.
How might this data affect you based on the human capital table you completed? Possible responses: Currently, students are likelier to be at the lower wage levels; there may be a benefit in setting a goal to pursue more education.
People with an advanced education typically make more money over their lifetimes. Education often leads to a career.
LESSON 4: B ACK TO SCHOOL
12
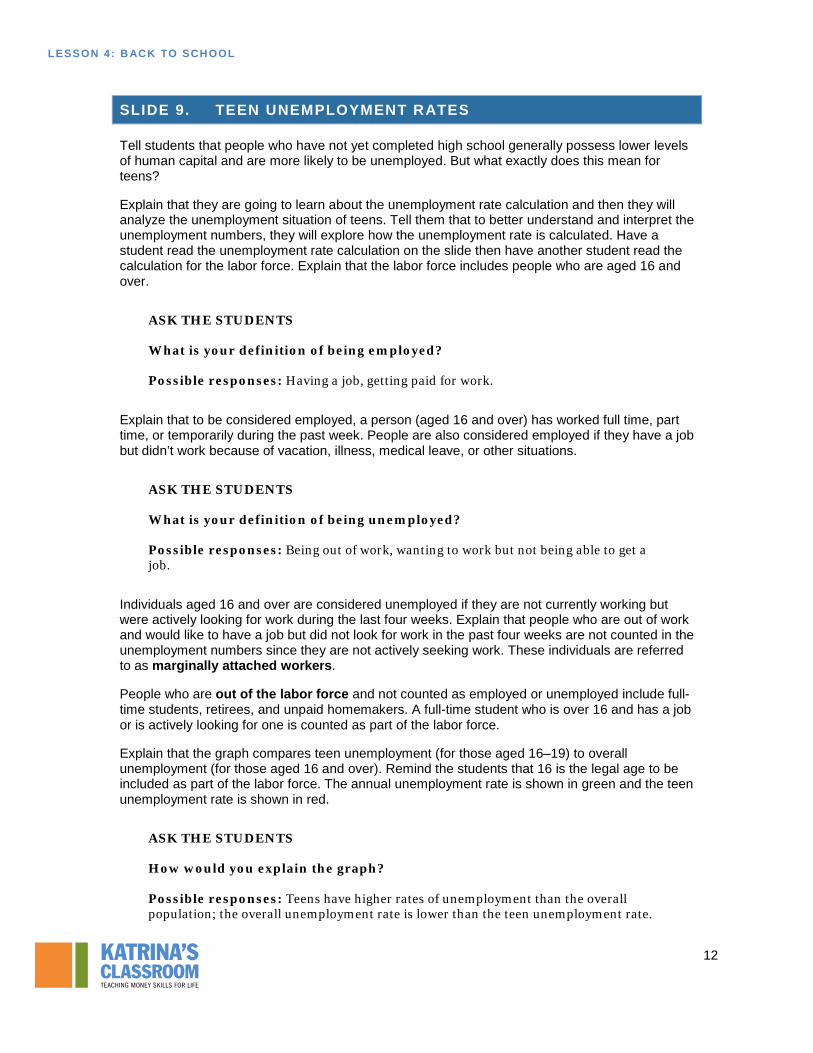
SLIDE 9. TEEN UNEMPLOYMENT RATES
Tell students that people who have not yet completed high school generally possess lower levels of human capital and are more likely to be unemployed. But what exactly does this mean for teens?
Explain that they are going to learn about the unemployment rate calculation and then they will analyze the unemployment situation of teens. Tell them that to better understand and interpret the unemployment numbers, they will explore how the unemployment rate is calculated. Have a student read the unemployment rate calculation on the slide then have another student read the calculation for the labor force. Explain that the labor force includes people who are aged 16 and over.
ASK THE STUDENTS What is your definition of being employed? Possible responses: Having a job, getting paid for work.
Explain that to be considered employed, a person (aged 16 and over) has worked full time, part time, or temporarily during the past week. People are also considered employed if they have a job but didn’t work because of vacation, illness, medical leave, or other situations.
ASK THE STUDENTS What is your definition of being unemployed? Possible responses: Being out of work, wanting to work but not being able to get a job.
Individuals aged 16 and over are considered unemployed if they are not currently working but were actively looking for work during the last four weeks. Explain that people who are out of work and would like to have a job but did not look for work in the past four weeks are not counted in the unemployment numbers since they are not actively seeking work. These individuals are referred to as marginally attached workers.
People who are out of the labor force and not counted as employed or unemployed include full-time students, retirees, and unpaid homemakers. A full-time student who is over 16 and has a job or is actively looking for one is counted as part of the labor force.
Explain that the graph compares teen unemployment (for those aged 16–19) to overall unemployment (for those aged 16 and over). Remind the students that 16 is the legal age to be included as part of the labor force. The annual unemployment rate is shown in green and the teen unemployment rate is shown in red.
ASK THE STUDENTS How would you explain the graph? Possible responses: Teens have higher rates of unemployment than the overall population; the overall unemployment rate is lower than the teen unemployment rate.
LESSON 4: B ACK TO SCHOOL
13
How would you explain the gap in the unemployment rates? Possible responses: Companies are less willing to hire teenagers; teenagers are competing with other age groups who may be more likely to get the job teens have less education and work experience.
Explain that teenagers generally find themselves in entry-level or seasonal positions. Perhaps in part because these types of positions tend to be affected by technological advancements or taken by older workers, especially during difficult economic times, teens generally experience higher levels of unemployment...
ASK THE STUDENTS What examples of positions that have been eliminated can you think of? Possible responses: Movie store clerk position eliminated due to new technology of on-demand movies and self-service rental kiosks.
How can you be better positioned to lower your risk of unemployment? Possible responses: Improve human capital.
Remind students of the previous slide showing that people with higher levels of education generally have lower unemployment. Encourage students to build their human capital by increasing their knowledge and learning new skills.
The BLS, the organization that tracks unemployment data, maintains the employment situation historical data (www.bls.gov/cps/cpsatabs.htm).
SLIDE 10. EDUCATION PAYS… BUT IT ALSO COSTS
ASK THE STUDENTS Do you remember the average unemployment rate for individuals with a bachelor’s degree? Answer: 4.5%
What about for those without a high school diploma? Answer: 12.4%

LESSON 4: B ACK TO SCHOOL
14
Education, which is one part of human capital, is a form of insurance that can help protect against unemployment. Having that protection also positively affects salaries. Clearly, education is important and can help us to be better off, but there is a cost associated with that education.
According to the College Board, the average annual cost of tuition and fees at a four-year public college is $8,655. When you multiply this amount by four years, you get $34,620. This number does not include other living expenses such as food, apartment rent or dorm fees, transportation, or textbooks.
Click the picture to go to a College Board video on college costs (bigfuture.collegeboard.org/pay-for-college/college-costs/college-costs-faqs).
Tell students that the Project on Student Debt reports that 70 percent of college seniors graduated with an average student loan debt of $29,400. To learn more about college debt by state, visit the Project on Student Debt (projectonstudentdebt.org/state_by_state-data.php).
SLIDE 11. STUDENT LOAN RULE OF THUMB
Explain that a suggested rule of thumb related to student loans is for students not to borrow more for all years of postsecondary education than they anticipate making in the first year of employment. For example, a public relations manager, a job that requires a bachelor’s degree, has an estimated entry-level salary of less than $30,500. This means that total student loans for this degree should not exceed $30,500. Students should also consider their personal money values regarding taking on large amounts of debt before even starting their career. The good news is that the median salary for a public relations manager is $91,810, so there is the potential for upward salary mobility. Students can find information about careers and salaries in the BLS Occupational Outlook Handbook (www.bls.gov/ooh/).
Although student loans allow many people to get a postsecondary education, students should realize that student loan debt can affect their purchasing power in the future. With increasing student loan debt and postsecondary expenses, many people are delaying home and car purchases either because they can’t fit the extra expenses into their budgets or they are declined for credit. The concept of opportunity cost is relevant in this situation. Opportunity cost is the foregone next best alternative when making a decision. By choosing to acquire debt, a student’s opportunity cost might be foregone future purchasing power.
ASK THE STUDENTS What would be the opportunity cost of your time for going to the movie on Friday night? Possible responses: Going to the mall; doing homework.
Remind students that even though they may all have different responses, each of them will have only one opportunity cost since it is the next best alternative, something they would have selected had they not made their specific choice.

LESSON 4: B ACK TO SCHOOL
15
SLIDE 12. PAYING FOR COLLEGE: DO YOUR HOMEWORK
There are a variety of options for paying for college. It is the responsibility of the student to seek out and apply for these options. Students and their families should complete the Free Application for Federal Student Aid (FAFSA) to learn what they might be eligible for. Information and the form are available on the website of the Department of Education’s Federal Student Aid office: www.fafsa.ed.gov/.
Students should also be aware that there are a number of scams related to financial aid. Financial aid scams include paying money for help finding financial aid as well as identity theft. Students and their families should be careful about to whom they give personal information and take other measures to reduce their risk. Federal Student Aid provides information about student aid scams (studentaid.ed.gov/types/scams).
Here are some financial aid options:
Students are awarded scholarships according to certain criteria. Scholarships are often merit-based and do not have to be repaid. Schools, employers, private companies, communities, and civic, professional, and social organizations may offer scholarships. Many scholarships require high academic achievement, but others are based on community service, involvement in a specific organization, college major, place of residence, hobby, religious affiliation, or some other requirement. Students can find information about many scholarships on the U.S. Department of Education’s Federal Student Aid office website (studentaid.ed.gov/types/grants-scholarships/finding-scholarships).
Grants also do not have to be repaid, and are often financial need-based. The federal government and some private institutions provide grants. Being eligible for a grant one year does not guarantee that the student will receive it again, especially if the student’s financial situation changes. Conversely, if the student was turned down one year, he or she may become eligible later.
College work study programs provide part-time jobs that can help students pay for part or all of the tuition and fee expenses.
Using savings is another method of financing postsecondary education. Students can save for college with a traditional savings account at a financial institution or through a 529 college savings plan. A 529 plan is a tax-advantaged savings plan that encourages saving now to help offset future college expenses. States and state agencies or educational institutions generally sponsor these plans. The Securities and Exchange Commission provides information about 529 college savings plans (sec.gov/investor/pubs/intro529.htm).
Student loans are borrowed funds that must be paid back along with interest and any related fees. Several student loan options with many interest rate levels are out there, so students should research all the details. Information about student loans is available on the U.S. Department of Education’s Federal Student Aid office website (studentaid.ed.gov/types/loans).
Click the picture on the slide to go the Consumer Financial Protection Bureau’s Paying for College website (consumerfinance.gov/paying-for-college/) for lots more information about paying for college.

LESSON 4: B ACK TO SCHOOL
16
SLIDE 13. PLANNING FOR POSTSECONDARY EDUCATION
Students should also research others areas to make the transition to postsecondary education and their future career. Some people know from a very early age what they want to do when they grow up while others are still exploring. A tool that can help students match their interests and skills with their future career is an interest inventory. Several interest inventories and personality profile tools are available online. Although these tools can’t tell anyone specifically what their specific career should be, they can provide some direction about areas to explore. They can help students identify career paths that they may otherwise have missed.
My Next Move, which is a partner of the American Job Center network, provides an interest inventory (www.mynextmove.org/explore/ip).
When students have a good understanding of their interests, they can then explore some career options, set career goals, and identify appropriate degree programs.
You may want to review the Classroom Economist’s Lesson 3 for the discussion on short-, intermediate-, and long-term goals.
ASK THE STUDENTS What is an example of a short-term goal related to postsecondary education? Possible responses: Complete an interest inventory; participate in a job shadow to learn more about a specific career; complete admissions application.
What is an example of an intermediate-term goal related to postsecondary education? Possible responses: Volunteer a certain number of hours to gain experience in a certain career field; save enough money for the first year of college.
What is an example of a long-term goal related to postsecondary education or your career? Possible responses: Graduate from college; start a business; obtain a specific job.
Students should research degrees and postsecondary institutions to find a match between the two. The College Navigator provides information about postsecondary institutions (nces.ed.gov/collegenavigator/).
The application process varies by postsecondary institution, but generally you will need to include your school transcript so the school can verify that you meet grade point average and academic requirements. You will also need to include your ACT or SAT scores and an application fee. In some cases, postsecondary institutions may also require applicants to provide details about community and school activities, awards, and special talents or skills as well as a personal statement or essay and letters of recommendation.
LESSON 4: B ACK TO SCHOOL
17
As previously mentioned, students have many choices for paying for a postsecondary education, but financial aid requires research and planning.
SLIDE 14. EVALUATING POSTSECONDARY OPPORTUNITIES AND EXPENSES
Tell students that they will work collaboratively to evaluate postsecondary opportunities for given scenarios.
ACTIVITY INSTRUCTION
Read the following scenario to the students:
You are exploring options for attending college next year to pursue the necessary bachelor’s degree for your chosen career, as shown on the career card, which you will receive shortly. Cost is a major factor in your decision. You may have scholarships and your parents will help with tuition, but you will have to cover half of the total cost of your four-year education with student loans. You have already decided that you will attend school in your home state. You have not yet decided whether to live on or off campus so you’ll have both options to consider.
Distribute Handout 3 (Postsecondary Education Cost Comparison Worksheet) to the students.
Tell students that there are several online tools on the worksheet to help them compare the costs of obtaining the degree from three different colleges or universities in their home state.
After they complete the chart, they should answer questions about each option and then select the best one. Have them report their findings, decisions, and reasons for their decisions to the rest.
Although they are working as a group to gather the information, each student should complete the worksheet because they will use it in another project.
Divide students into groups of two or three. Distribute one of the cards from Handout 4 (career option cards) to each group.
If you think it’s necessary, give the students an overview of the websites they will use to complete the worksheet. You can find information about these on slides 15–18.
SLIDE 15. BUREAU OF LABOR STATISTICS OCCUPATIONAL OUTLOOK HANDBOOK
The Occupational Outlook Handbook profiles hundreds of occupations. Each occupation profile also includes the BLS’s employment projections for the 2010–20 decade.
Show students that they can search for the career on their card at either of the yellow circles labeled with a “1.” Both of these will provide the same information, but are two different search options.
LESSON 4: B ACK TO SCHOOL
18
Click the picture to go to BLS Statistics Occupational Outlook Handbook (www.bls.gov/ooh/home.htm).
SLIDE 16. BUREAU OF LABOR STATISTICS OCCUPATIONAL OUTLOOK HANDBOOK CAREER PROFILE
All the careers have a tabbed profile that provides detailed information about the career.
The yellow circles labeled “1–4” provide the information students need to complete the first part of the worksheet.
Click the picture to go to the BLS Occupational Outlook Handbook and get information about the sample career (www.bls.gov/ooh/architecture-and-engineering/civil-engineers.htm).
SLIDE 17. NATIONAL CENTER FOR EDUCATION STATISTICS COLLEGE NAVIGATOR
To learn about the in-state colleges and universities that offer programs related to your career field, use the College Navigator. Click the picture to go to the National Center for Education Statistics College Navigator (nces.ed.gov/collegenavigator/).
The yellow circles labeled “1–6” provide the information students need to complete the second part of the worksheet.
1. Select your home state from the States list or from the map.
2. Click the check box next to the degree level you want (in this case, click Bachelor’s).
3. Click the Browse for Programs button to open a box listing programs and majors.
4. To narrow your selection, type the career name in the Programs/Majors field, then click the Add button next to the correct career.
5. Close the box (upper right corner).
6. Click Show Results.
A listing of schools with majors related to your career appears.
SLIDE 18. FINAID STUDENT LOAN PAYMENT CALCULATOR
The Student Loan Payment Calculator computes an estimate of the size of your monthly loan payments and the annual salary required to manage them.
The yellow circles labeled “1–2” provide the information the student needs to complete the first part of the worksheet. Click the picture to go to the FinAid Student Loan Payment Calculator (www.finaid.org/calculators/loanpayments.phtml).
1. Scroll down the page to the calculator.

LESSON 4: B ACK TO SCHOOL
19
2. Type the loan balance found in part 2 into the Loan Balance field.
3. Click Compute Payment and Cost.
SLIDE 19. EVALUATING POSTSECONDARY OPPORTUNITIES AND EXPENSES DEBRIEFING
When the groups have completed the worksheets, ask each group to share their findings. Ask them the following questions.
• What career option did you evaluate?
• What school was selected as the best alternative for this career and why?
• What is the opportunity cost of this decision?
• Will the entry level salary support the estimated student loan payment? Why or why not?
• What are some strategies to reduce the amount borrowed to finance postsecondary education?
Suggested alternative instructions for this activity:
Have the students complete the worksheet individually using their own career and school options. If possible, have the students complete an interest inventory to help them identify some career options. My Next Move, which is a partner of the American Job Center network, provides an interest inventory (www.mynextmove.org/explore/ip).
SLIDE 20. “BACK TO SCHOOL” VIDEO
Explain to students that they are going to watch the video “Back to School,” which tells the story of a family from Harvey, Louisiana, whose home and community Hurricane Katrina destroyed. Jamie, an 12th grader at the time of the storm, and her family found themselves in a financial emergency similar to what many people experienced in the aftermath of Hurricane Katrina when they were unable to return home for several months. Pay close attention to what Jamie’s family relied on to help pay for what they needed.
Click the picture to go to the Katrina’s Classroom “Back to School” video (www.youtube.com/watch?v=KXvC-CVO1Mk).
SLIDE 21. ASSESSING THE IMPACT OF FINANCIAL PREPAREDNESS
ASK THE STUDENTS What did Jamie’s friends recommend in order to be financially prepared? Possible responses: Having an emergency fund; not living paycheck to paycheck.
LESSON 4: B ACK TO SCHOOL
20
As previous lessons covered, an emergency fund can be vital when dealing not only with natural disasters but also with unexpected life situations such as job loss. An emergency fund is money set aside that can be accessed quickly for unexpected expenses. A general rule of thumb for an emergency fund is to have three to six months’ worth of living expenses.
ASK THE STUDENTS How was Jamie able to use the money she had earned and saved? Possible responses: She purchased clothes; the money she had saved was available for her to use when she was evacuated to Houston.
Reinforce the fact that by having saved some of her earnings, Jamie was prepared for the unexpected.
Remind the students that Jamie mentioned in the video that she was on a tight budget. Explain that a budget is a general plan for your money.
ASK THE STUDENTS How might having a budget help you achieve your financial goals? Possible responses: The budget provides a plan for how to spend the money; the budget might include funds dedicated to saving; the budget helps you track your income and expenses.
How might getting a good education help ensure your financial future? Possible responses: Higher levels of education generally have higher incomes; people with higher levels of income generally earn more over a lifetime; you may be able to save larger amounts if you earn a higher income and control spending.
SLIDE 22. BUDGETING
Tell students they are going to learn about the budgeting process as well as how a budget may help them to achieve their education and financial goals.
SLIDE 23. MANAGING YOUR MONEY: THE BUDGET
Explain to students that a budget is a plan that helps you manage your money by balancing your income with your expenses. It is an itemized summary of probable income and expenses for a given period, usually monthly.
Creating a budget helps you to better understand where your money goes. A budget is a tool that helps you live within your means, reach your goals, and increase your wealth. When you keep
LESSON 4: B ACK TO SCHOOL
21
track of your money and stick to your budget, you are in control. If your budget is realistic and you follow your budget plan, you will be able to pay for the things you need and save money for the things that are really important to you.
Since money is a scarce resource, you must make decisions about how to allocate money. Scarcity means that there are unlimited human wants and needs in a world of limited resources.
SLIDE 24. MANAGING YOUR MONEY: THE BUDGET (SLIDE WITH BUBBLES)
Tell the students that the budgeting process has five key components: 1) Determine income; 2) Identify expenses and track spending; 3) Develop the budget plan; 4) Implement and track the budget; and, 5) Review and adjust the budget. Explain that the class will be reviewing each component more closely.
SLIDE 25. THE BUDGET: DETERMINE INCOME
The first step in the budget process is to calculate all your income. Income is money received through work or investments, or from other sources. Let’s explore some of the various types of income.
People receive income for their labor. Income falls into two categories: wages and salaries. Wages are payment to workers for labor or services rendered, generally on an hourly, daily, or weekly basis. Wages will vary between pay periods based on number of hours worked. An hourly worker is also known as a non-exempt worker and may receive additional compensation for overtime or variable work arrangements. Salaries are fixed regular payments, typically paid on a monthly or biweekly basis. Salaries are often expressed in terms of an annual sum. For example, a person may have a salaried position that pays $35,000 a year. Salaried workers are exempt workers since they generally do not receive overtime pay.
ASK THE STUDENTS For those of you who currently have a job, how are you paid—with an hourly wage or with a salary? Possible responses: Many students will answer that they are paid with an hourly wage.
Explain that the total amount earned for an individual’s work is called gross pay (or gross income). For the hourly worker who makes $10 an hour and works 40 hours a week, the gross weekly pay would be $400. Let’s say a salaried worker has a gross annual pay of $35,000. Divide $35,000 by 52 weeks to calculate a salaried worker’s gross weekly pay—in this case, $673.08.
Net pay (or net income) is the amount the employee actually receives after any deductions are withheld from gross pay. Students should use net pay to develop their budgets. Deductions may be either required or voluntary withholdings. To comply with government regulations, employees pay required withholdings such as federal income tax; state income tax, where applicable; and Social Security and Medicare taxes. Voluntary withholdings—such as employer-sponsored
LESSON 4: B ACK TO SCHOOL
22
health insurance fees, retirement plan contributions, and charitable contributions—provide more discretion since employees can change the level of withholding.
ASK THE STUDENTS For the hourly worker with the gross pay of $400, what would his or net pay be after required deductions of 20 percent? Answer: $320 ($400 x 0.20 = $80; $400 - $80 = $320) The worker’s weekly take-home, or net, pay would be $320. This amount would be used for budgeting.
People may also receive income from sources such as gifts, allowances, or interest from savings or other interest-bearing accounts. Postsecondary students may also have income from scholarships, grants, or other student aid.
Have students identify all their sources of income. Remind them that for budgeting purposes, they should consider all their available income sources.
SLIDE 26. THE BUDGET: IDENTIFY EXPENSES AND TRACK SPENDING
Tell students that the most detailed, essential part of the budget process is identifying expenses and tracking spending.
Have students begin by listing all their spending. They should know what they owe. Help students distinguish between fixed and variable expenses.
ASK THE STUDENTS What do you think the difference is between fixed and variable expenses? Possible responses: Fixed expenses are always the same; variable expenses may be different each month.
Fixed expenses do not change from month to month—for example, rent, car, insurance, and student loan payments. Because fixed expenses are the same each month, it is easier to begin the budget process with them. Variable expenses fluctuate from month to month—for example, utilities, food, entertainment, and gifts. Heating a home in December is more expensive than in April, for instance. Sometimes utilities and other businesses offer "levelized" billing, which allows consumers to pay a fixed sum each month. However, in the case of utilities, if the consumer uses more energy than he or she paid in the fixed sum, the consumer will receive a lump sum bill.
Many fixed and variable expenses are planned, but there also are unplanned expenses, like an unexpected birthday present or a flat tire.
When budgeting, always consider ongoing needs and identify how much income is needed to cover expenses. Maintaining a budget helps to prepare for the unexpected. Tracking spending identifies how much and on what money is being spent.
LESSON 4: B ACK TO SCHOOL
23
SLIDE 27. TRACKING YOUR EXPENSES
Have you ever asked yourself, “Where did my money go?” Sometimes it seems as though money just disappears. Review the example with your students.
In this example, $4.75 in cash was used to pay for a favorite coffee drink at a specialty coffee shop.
ASK THE STUDENTS Why might it be easy to forget you have spent money on this purchase? Possible responses: Paid cash, which may make it harder to keep up with these sorts of expenses; don’t keep track of food expenses.
How do you think that tracking expenses like this purchase might help in the budgeting process? Possible responses: Helps me become more aware of money spent; I might make different decisions about how to spend money. As people become more aware through the budgeting process, they sometimes consider alternative ways they spend their money.
What might be an alternative to making this purchase? Possible responses: Make coffee at home; make fewer purchases; buy less expensive coffee. Answers will vary for each individual since we all have our own preferences and priorities.
Tracking expenses can help solve the problem of wondering where money went and will allow for more accurate budgeting.
SLIDE 28. TRACKING YOUR EXPENSES
Tell students that to gain a better understanding of how they are spending their money, they will think about their spending for the last couple of days.
ACTIVITY INSTRUCTIONS
Distribute a copy of Handout 5 (Expense Tracker) to each student or have students record their responses on a sheet of paper. Handout 5 includes a table with the information that students need to report for the expenses. Tell students that for each expense, they should include the date,

LESSON 4: B ACK TO SCHOOL
24
the item purchased or the expense, the amount paid, the payment method (cash, check, ATM or debit card, credit card, or autodraft), and whether it is a fixed or variable expense.
SLIDE 29. TRACKING YOUR EXPENSES DEBRIEFING
Use the following questions to debrief the activity.
ASK THE STUDENTS What types of goods and services were purchased? Possible responses: Food, gas for vehicle, clothes.
What payment methods were used? Possible responses: Cash, debit card, credit card. Remind students that if they paid with a credit card, they need to budget this payment.
Did the way you paid affect how much you spent? Possible responses: Yes, I spent less when I used cash; no, I would spend the same no matter what.
Which expenses were fixed and which were variable? Possible responses: Auto insurance and car payment were fixed; gas and food were variable.
Any surprises regarding how much was being spent? Possible responses: Yes, I was spending more than I realized; no, I know what I am spending my money on.
What income did you have that paid for these expenses? Possible responses: Wages from my job; allowance from parents; gift money.
LESSON 4: B ACK TO SCHOOL
25
Did tracking make you rethink any of your purchases? Possible responses: Yes, I might not eat out as much; no, I will still spend the same.
What influenced your spending—people, situation, emotion? Possible responses: Being with friends; limited amount of time between school and other activities.
How did the purchase make you feel? What about now? Possible responses: Good because I had money to spend; upset because I was spending instead of saving my money.
Tell the students that tracking their spending is not intended to make them feel bad about their purchases. Rather, it is meant to empower them as they build a foundation for their budget.
SLIDE 30. THE BUDGET: DEVELOP THE BUDGET PLAN
Tell students they have the key components—income and expenses—necessary for completing their budgets.
As they develop their budgets, remind them to weigh additional considerations based on their personal values and goals. For example, many people feel it is important to pay themselves first by building savings into the budget at the outset rather after accounting for all other expenses. One strategy is to automatically deduct savings from a paycheck or checking account into a savings account each month and then to base the budget on what remains. It is important to have savings to compensate for potential income shortfalls.
Remind students that an emergency fund will help them to meet financial goals and unexpected expenses.
SLIDE 31. CREATE A BUDGET
Tell students they are now going to explore the budget plan using the sample budget on the screen.
ASK THE STUDENTS What main components of the budget are listed? Possible responses: Income, fixed expenses, variable expenses.
LESSON 4: B ACK TO SCHOOL
26
What might be the source of the income? Possible responses: Wages, salary, allowance.
Why are rent, cell phone, and car insurance included as fixed expenses? Possible responses: These expenses are the same every month; the amounts of these expenses generally don’t change.
Explain that cell phone charges are fixed as long as you stay within the plan. However, if you incur overage charges, you need to include the overage charge as a variable expense. Additionally, with expenses like car insurance, you often pay the expense quarterly rather than monthly. If you pay quarterly, you should include it in the monthly budget as a fixed expense so you can save the necessary funds.
ASK THE STUDENTS In addition to the listed variable expenses, what other expenses might be included in this category? Possible responses: Entertainment, gifts.
How do the total expenses reconcile to the income? In other words, are expenses more or less than income? Possible responses: Expenses are less than income; person is living within his or her means.
What might be done with the extra money? Possible responses: Emergency fund, postsecondary savings, entertainment.
How would this be included as part of the budget? Possible responses: Depending on the income situation, include as fixed or variable expenses.
SLIDE 32. BUDGET SCENARIOS
Tell the students they will complete a group budget activity.
LESSON 4: B ACK TO SCHOOL
27
ACTIVITY INSTRUCTIONS
Divide students into groups of two to three.
Read the following scenario:
You recently graduated from college and started a new job. Your net pay is $2,000 a month. In your groups, develop a budget in the Estimate column. You need to indicate how you would spend your money. Be careful not to go over budget. After you complete your estimate, you will receive your scenario cards Take turns drawing a card from the stack of scenarios. Each of you should enter the value of the card under the Actual column for the appropriate category on the monthly budget worksheet. Remember to add dollar signs and decimal points. Once you have drawn all cards, total the fixed and variable expenses, and calculate the surplus or deficit. Then answer the questions at the bottom of the worksheet.
SLIDE 33. BUDGET SCENARIOS
Distribute a copy of Handout 6 (Budget Worksheet) to each student.
Once students have completed the estimate, distribute Handout 7 (Budget Worksheet Scenario Cards).
After the groups complete the actual budget and related question, have a student read the scenarios cards starting with number 1 (cards are numbered on the bottom right corner). Then have the student assign the expense to the appropriate category.
SMART Board instructions
Use your finger to tap the cell shades under the actual column to reveal the scenario card budget items. To restore the shades, click the gray area of the cell.
PowerPoint instructions
Click the Enter key (or the advance button) to reveal the answers under the actual column for the scenario. Repeat for each scenario. After all scenarios are read, click the Enter key (or the advance button) to reveal total fixed expenses, total variable expenses, total expenses, and surplus or deficit.
SLIDE 34. BUDGET SCENARIOS DEBRIEFING
ASK THE STUDENTS How did your group’s estimates differ from the actual column? Possible responses: Estimate was close to actual expense; estimate was much different.

LESSON 4: B ACK TO SCHOOL
28
How much did you estimate as savings each month? Possible responses: Answers will vary.
Were there expenses on this budget that were not listed in the categories? Possible responses: Cable, internet, cell phone, credit card bills.
If you had to pay for these expenses, where would the money come from? Possible responses: Savings; cutting back in other areas; finding sources of additional income.
Tell students they have just successfully developed a budget based on income and expenses and they will now learn the rest of the steps in the budgeting process.
SLIDE 35. THE BUDGET: IMPLEMENT AND TRACK
Once you have developed a budget plan, the next step is to implement the plan. This step can be difficult because it may involve having to go on a financial diet to cut expenses and begin saving. As part of this step, continue to track expenses since budgeting is a work in progress. Remind students to use whatever tracking method works best for them, whether it is using an app on a mobile phone or keeping a spreadsheet of expenditures.
SLIDE 36. THE BUDGET: REVIEW AND ADJUST
Use the information that is gained from implementing and tracking to review and adjust the budget accordingly. Especially when first starting out with the budget plan, review the budget monthly. Review your documents and make notes about your ability to follow the budget. It may be necessary to make adjustments. For example, you may find that you’ve allotted too much money for entertainment and not enough for food.
It may be useful to consider the following as part of the review:
Have income sources changed? Does your income cover your expenses?
ASK THE STUDENTS Why would sources of income make a difference? Possible responses: Hourly workers may not have the same amount of income each month; a person may spend more than what he or she makes.

LESSON 4: B ACK TO SCHOOL
29
Also consider where and when you are spending money. Are you saving regularly? Has anything changed your income, spending, and saving?
What might affect your income, spending and saving? Possible responses: Loss of job (loss of income); adding more hours at work for an hourly position (gain in income); unexpected life events and emergencies.
Finally, consider whether you are achieving your personal financial goals.
A careful review of your current budget, spending habits, and responsibilities helps paint a picture of your financial situation. Remind students that budgets can change at any time based on their particular circumstances.
SLIDE 37. SAVING
Tell students they are going to explore the idea of saving to determine what it is and the impact of interest on the growth of their funds.
SLIDE 38. SAVING VERSUS INVESTING
Although we sometimes use the terms interchangeably, saving and investing are actually two unique concepts. It's important to understand the difference between them and the need for both.
Explain that savings: 1) is the difference between disposable income and consumption; 2) involves the protection and preservation of money from loss; and 3) helps people meet short-term goals and to be prepared for the unexpected.
Tell students the definition of saving is to store money safely, such as in a deposit account, for short-term needs such as upcoming expenses or emergencies. Typically, a low, fixed-rate of return is earned in exchange for easy access to and withdrawal of the money, or rather more liquidity.
Remind students that liquidity is how easily an asset can be converted into cash, or it is the ready availability of money. The more quickly we can convert an asset to cash, the more liquid it is.
Now explain that investing: 1) is making a long-term commitment of money to realize a financial gain; 2) involves taking a risk with money, such as by buying stocks or bonds, in the hopes of realizing higher long-term returns.

LESSON 4: B ACK TO SCHOOL
30
SLIDE 39. REASONS FOR SAVING
Tell students that people save for their financial security.
It is important to establish positive relationships with financial institutions. People who have bank accounts can create financial stability and plan for emergencies.
Recall that an emergency fund is money set aside that is readily accessible to meet unexpected expenses. An emergency fund is vital to cope with emergencies such as natural disasters and unexpected life situations. A general rule of thumb for an emergency fund is to have three to six months’ worth of living expenses.
Also, savings can help people meet monthly budget shortfalls.
Savings also helps meet future needs. Say you need a new car at some point in the future. Savings allows you to pay for all or part of the cost of the car.
There is a cost to attaining a postsecondary education and savings can help cover your education expenses.
People often start by saving money to meet various specific personal financial goals as well as to acquire enough money to invest for long-term goals. Although you may not be able to buy stock with just $5, you will have enough money to buy shares of stock if you’ve been saving $5 per week for the past year.
SLIDE 40. YOUR GOALS FOR SAVING
Remind the students that since each person has different personal values and financial goals, each should reflect on these values. Tell the students that they will consider what is important to them and what strategies will be necessary to achieve their savings goals.
Have students work individually to develop written responses to the following questions:
• List three things you want that may require you to save money to buy them.
• How much will each item cost you?
• How long do you estimate it will take you to save for each item?
• How much per week or per month will you need to save?
• What effect will this have on your budget?
• What might you have to give up to attain these items?
After students complete their individual reflections, debrief as a group.
ASK THE STUDENTS What sort of things did you identify to save your money for?
LESSON 4: B ACK TO SCHOOL
31
Possible responses: iPad, cell phone with data package, gaming system, used car.
Based on the expense, how long will it take you to save enough money to purchase each item? Possible responses: Several weeks or months; students may indicate a specific timeframe.
Will purchasing the item or items affect your budget? Possible responses: Yes, no.
What strategies do you plan to use to attain the items? Possible responses: Save; adjust budget; reduce spending.
Remind students that both budgeting and saving can be essential in reaching goals, whether the goal is to get a postsecondary education or to buy an iPad or laptop. Also, explain that budgeting and saving to have the things on the list can help them avoid getting into debt.
SLIDE 41. TOOLS FOR SAVING
Remind students that they learned about some of these tools for saving—savings account, money market account, and certificate of deposit— when they completed the “In the Aftermath” lesson on financial relationships and deposit accounts.
ASK THE STUDENTS What are some of the characteristics of a savings account? Possible answers (covered in the previous lesson): • Designed to help save money. • Often used for emergency fund and other short-term savings goals. • May have minimum balance requirements and withdrawal restrictions. • May have monthly fees. • Earns interest. • FDIC/NCUA-insured.
What are some of the characteristics of a certificate of deposit (CD)? Possible answers (covered in the previous lesson):

LESSON 4: B ACK TO SCHOOL
32
• Deposit locked in for a specific amount of time and interest rate. • Often used for medium-term savings goals. • Minimum opening balance requirements. • Penalties for early withdrawal. • Earns interest. • FDIC/NCUA-insured.
What are some of the characteristics of a certificate of deposit (CD)? Possible answers (covered in the previous lesson): • Offers variable interest rate and has potential of risk of loss. • Generally offers higher rates of return on deposits. • Minimum balance requirements. • May have monthly fees. • Earns interest. • FDIC/NCUA-insured. Note: A money market mutual fund (MMMF) is an investment tool that offers variable interest rates and has the potential risk of loss. Money market mutual funds are not FDIC- or NCUA-insured.
Tell students that they have not previously covered savings bonds.
Generally, a savings bond has the following characteristics:
• Low-risk, liquid savings products. • Government-issued and government-backed. • Earns interest. • Unlike the other savings tools on the list, they are not insured and cannot be purchased at a
financial institution. • Can be purchased via TreasuryDirect.gov or, for some savings bonds, with your IRS tax
refund. • In some cases, penalties for early withdrawal. • There are different types of savings bonds, each with slightly different features and
advantages.
ASK THE STUDENTS Which tool is the best choice? Possible responses: It depends on your savings goals.
Remind students that their answers will depend on their specific financial goals, how much interest they want to earn, and how they plan to use the money, and the amount of their original deposit. Additionally, emphasize that in most cases, the greater the liquidity, the less interest they will earn, and that the higher the risk, the higher the potential return. It is essential to evaluate the institution and tools available to ensure alignment with their needs and goals.
LESSON 4: B ACK TO SCHOOL
33
SLIDE 42. COMPOUND INTEREST: DAILY VERSUS MONTHLY VERSUS YEARLY
Tell students they are going to review common savings-related terminology.
ASK THE STUDENTS In finance, what does principal mean? Answer: Principal is the original amount of money deposited.
In this example, what is the principal amount? Answer: $1,000 Explain to students that the $1,000 deposit is being made only in the first year. However, if they made deposits in future years, those deposits would also be part of the principal.
What does interest rate mean? Answer: Interest rate is expressed as a percentage. It is what an account earns if funds are kept on deposit for an agreed-on term.
In this example, what is the interest rate? Answer: 5%
What does interest mean? Answer: Interest is money an institution pays you for the use of your funds. One of the factors in determining the amount of interest you receive is the interest rate.
What is the definition of compound interest? Answer: Compound interest is the method of computing interest whereby the interest rate is applied to the principal and any earned interest. It is often referred to as “interest on interest.”
LESSON 4: B ACK TO SCHOOL
34
Remind students that they compared the power of compound interest during the “In the Aftermath” lesson on financial relationships and deposit accounts. Tell students that another type of interest is called simple interest.
What is the definition of simple interest? Answer: Simple interest is interest paid only on the principal amount deposited into the account.
What does term mean? Answer: It is the length of time money is left on deposit in an account.
In this example, what is the term? Answer: Five years.
Tell students that the graph shows the impact of compounding interest. Explain that if all other factors are held equal (such as the principal amount, or term), the more frequent the compounding and the better the return on savings. Explain that compound interest earns interest on interest. In other words, the money that being earned in interest gets added to the principal and is used to calculate the interest being paid.
Point out to the students that the green bars represent when funds are compounded daily; the red bar, when compounded monthly; the blue bars, when compounded yearly. Next to each bar is the year-end total. The vertical axis represents the value of the funds for each of the years 1 to 5. The horizontal axis represents the dollar amounts, in $50 increments, with the far left amount being $1,000, the amount of the original deposit.
ASK THE STUDENTS How would you interpret the information in the graph? Possible responses: The more frequent the compounding, the more money earned; compound interest helps your money grow.
What is the benefit of compound interest and having your money in one of the savings tools? Possible responses: Interest is calculated on both the principal and the interest; funds grow more quickly; security of the funds.
LESSON 4: B ACK TO SCHOOL
35
OPTIONAL ACTIVITY
Have students visit an online compound savings calculator and use their own scenarios to explore the power of compound interest. Alternatively, click the picture to access an online compound savings calculator at Bankrate.com (www.bankrate.com/calculators/savings/compound-savings-calculator-tool.aspx).
SLIDE 43. WATCH IT GROW: RULE OF 72
The Rule of 72 is a mathematical equation that estimates the growth of funds over time with compound interest, specifically the length of time in years for the principal deposit to double. This is calculated by dividing 72 by rate of return. (Some textbooks teach the Rule of 70.)
Explain to students that in the example, $5,000 is deposited at an 8% interest rate. To calculate the number of years it would take the funds to double, divide 72 by 8, and you find that the principal will double every 9 years.
ASK THE STUDENTS How long will the $5,000 principal take to double if the interest rate were now 9%? Answer: 8 years (72 ÷ 9 = 8)
Explain to students that you can also use this formula to determine what the interest rate would be if you know the length of time and the principal. The calculation would be similar except now divide 72 by the number of years to find the interest rate needed to double the $5,000 to $10,000.
ASK THE STUDENTS In the example on the screen, assuming that you don’t know the interest rate, what numbers would you use to determine the interest rate? Answer: Divide 72 by 9 (the number of years), which would result in the interest rate being 8%.
SLIDE 44. RULE OF 72 CALCULATIONS: PROBLEM #1
Tell students to work with partners to solve the following problems.
ASK THE STUDENTS If you deposit $50,000, how many years will it take for it to grow to $100,000?
Tell the students they should solve for each of the interest rates listed.
LESSON 4: B ACK TO SCHOOL
36
After students finish their calculations, go over each of the calculations and answers.
ASK THE STUDENTS What formula did you use to calculate the number of years? Answer: 72 ÷ interest rate = number of years
SMART Board instructions
Use your finger to drag the red box to the right to reveal the answers.
PowerPoint instructions
Click the Enter key (or the advance button) to reveal the answers.
What was your answer at 4% annual interest? Answer: 18 years (72 ÷ 4 = 18)
What was your answer at 6% annual interest? Answer: 12 years (72 ÷ 6 = 12)
What was your answer at 9% annual interest? Answer: 8 years (72 ÷ 9 = 8)
What was your answer at 12% annual interest? Answer: 6 years (72 ÷ 12 = 6)
Do interest rates matter? If so, why? Possible responses: Yes, because higher interest rates lead to higher rates of return; one needs to understand if interest rates are keeping up with the rate of inflation.
SLIDE 45. RULE OF 72 CALCULATIONS: PROBLEM #2
Tell students they will again work with their partners to solve the following problems.

LESSON 4: B ACK TO SCHOOL
37
ASK THE STUDENTS What interest rate is needed to grow $50,000 to $100,000?
Remind them that this was the alternative calculation discussed on the Rule of 72 slide.
Tell students they should solve for each of the years listed.
After students finish their calculations, go over each of the calculations and answers.
ASK THE STUDENTS What formula did you use to calculate the interest rate? Answer: 72 ÷ number of years = interest rate
SMART Board instructions
Use your finger to drag the red box to the right to reveal the answers.
PowerPoint Instructions
Click the Enter key (or the advance button) to reveal the answers.
What was your answer at 2 years? Answer: 36% interest rate (72 ÷ 2 = 36)
What was your answer at 5 years? Answer: 14.4% interest rate (72 ÷ 5 = 14.4)
What was your answer at 10 years? Answer: 7.2% interest rate (72 ÷ 10 = 7.2)
What was your answer at 20 years? Answer: 3.6% interest rate (72 ÷ 20 = 3.6)
Does the term (number of years) matter? If so, why?
LESSON 4: B ACK TO SCHOOL
38
Possible responses: Yes, because shorter terms require higher interest rates in order for the principal to double; one needs to understand how long it will take for the principal to double in value.
Why does the Rule of 72 matter? Possible responses: The rule of 72 allows individuals to understand how long it will take a deposit to double with compound interest; it is a tool to help people understand whether they are making smart decisions with their funds.
SLIDE 46. VOCABULARY REVIEW
SMART Board instructions
In this activity, students will need to drag and drop the green concept on the right into the word section that describes the definition. Once they have placed all of the terms, click Solve to reveal the answers. (This action advances you to slide 50, which has the answers.) Click the arrow to return slide 49.
PowerPoint instructions
In this activity, students select a word from the word bank for each definition. Read the definition and then ask: Which word from the word bank matches definition #1?
Click on the slide to reveal the correct term for definition #1. Repeat the process until you’ve matched all eight words to the corresponding definitions.
SLIDE 47. IN SUMMARY
SMART Board instructions
Use your finger to touch the number and reveal the summary information. You will need to use the scroll bar on bullet three.
PowerPoint instructions
Click the Enter key (or the advance button) to reveal each summary point.
In this lesson, we learned that:
• Human capital is the knowledge, talent, and skills that people possess.
• Education can increase human capital and earning potential as well as decrease unemployment risk.
• Planning for postsecondary education includes considering career goals, postsecondary options, financing strategies, and necessary documentation.
LESSON 4: B ACK TO SCHOOL
39
• Budgeting puts you in control of your money and helps you understand the allocation of your income.
• Saving allows you to meet short-term goals and be prepared for the unexpected.
CLOSING ACTIVITY
Explain to the students they will undertake a full-scale expense tracking and budgeting exercise for one month.
Distribute a copy of Handout 8 (Full-Scale Expense Tracking and Budgeting Worksheet) to each student.
Note: The students can also use an Excel spreadsheet to record the information.
Have students estimate their total incomes and write these numbers on the line labeled Estimated Monthly Income. Remind them to consider all sources of income including allowance, gifts, and wages. They should then complete the column Monthly Estimated Budget based on the Estimated Monthly Income. Remind students that this will be similar to the estimate they completed in the budget activity.
Distribute a copy of Handout 5 (Expense Tracker) to each student. Have students record all expenses using the expense tracker.
Each week they should use the information from the expense tracker to record the information in their budget worksheet. Additionally, each week they should record their weekly income.
At the end of the fourth week, they should generate a monthly total for each category by totaling weeks one through four. They should then compare these numbers against their budget to determine a surplus or deficit.
Have students present their budgets and plans to the class.
LESSON 4: B ACK TO SCHOOL
40
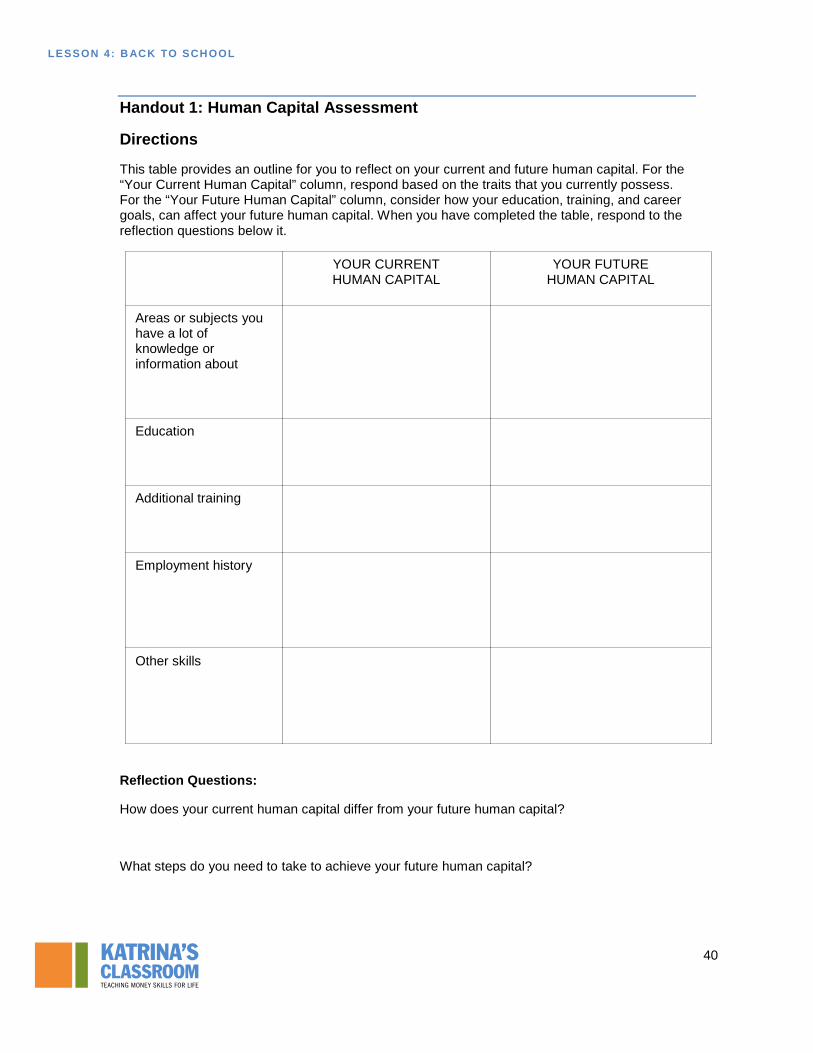
Handout 1: Human Capital Assessment
Directions
This table provides an outline for you to reflect on your current and future human capital. For the “Your Current Human Capital” column, respond based on the traits that you currently possess. For the “Your Future Human Capital” column, consider how your education, training, and career goals, can affect your future human capital. When you have completed the table, respond to the reflection questions below it.
YOUR CURRENT HUMAN CAPITAL
YOUR FUTURE HUMAN CAPITAL
Areas or subjects you have a lot of knowledge or information about
Education
Additional training
Employment history
Other skills
Reflection Questions:
How does your current human capital differ from your future human capital?
What steps do you need to take to achieve your future human capital?

LESSON 4: B ACK TO SCHOOL
41
Handout 2: How Long Will It Take to Earn $1 Million?
Directions
1. Work with a partner to discuss and estimate the median annual salary for the various levels of education listed in the chart. Also calculate the number of years it will take to earn $1 million based on the estimated salaries. Record your answers in the Estimate columns.
Number of years to earn $1 million = $1 million / Estimated median annual salary
2. Once you have identified your estimates and calculated the number of years, plot (using a triangle for each data point) on the graph the estimated amount of time it would take to earn $1 million for each level of education.
3. When you learn the actual median annual salary and number of years to earn $1 million, record your answers in the Actual columns.
4. Plot (using a square for each data point) the actual amount of time it would take to earn $1 million for each level of education.
How much would you earn each year?
(2012 median annual salary)
How many years would it take to earn $1 million?
Level of education Estimate Actual Estimate Actual
Less than high school diploma
High school diploma
Some college, no degree
Associate’s degree
Bachelor’s degree
Master’s degree
Professional degree
Doctoral degree

LESSON 4: B ACK TO SCHOOL
42
Handout 2 (Continued)
0
5
10
15
20
25
30
35
40
45
Num
ber o
f yea
rsYears to Earn $1 Million By Education Level
Level of education
Estimate
Actual
LESSON 4: B ACK TO SCHOOL
43
Handout 3: Postsecondary Education Cost Comparison Worksheet
Scenario
You are exploring options for attending college next year to pursue the necessary bachelor’s degree for your chosen career, as shown on the career card, which you will receive shortly. Cost is a major factor in your decision. You may have scholarships and your parents will assist with tuition, but you will have to cover half of the total cost of your four-year education with student loans. You have already decided that you will attend school in your home state. You have not yet decided whether to live on or off campus so you’ll have both options to consider.
Directions
As a group, complete the following charts using the information found on the websites provided for each chart. After completing each chart, answer any questions that follow it and be prepared as a group to report your findings to the class when the activity is complete. Each student should complete the worksheet based on the information found by the group members because this will be used in a future project.
Career option (from career card) _____________________________________________
For this section, go to the BLS Occupational Outlook Handbook (www.bls.gov/ooh/home.htm).
In the Search Handbook field, enter your assigned career option and click GO, or scroll down to locate the career in the A to Z Index list.
Using the Summary information and the information on the other tabs, answer the following questions:
1. What does a person in this career do?
2. What college degree is necessary for this job?
3. What does “median annual wage” mean?
4. What is the median annual wage for this job?
5. What is the annual wage for the lowest 10% of workers in this job? (Note: The salary for the lowest 10 percent of workers is the entry-level salary for many positions).
LESSON 4: B ACK TO SCHOOL
44
Handout 3 (continued)
For this section, go to the Career and College/University information at nces.ed.gov/collegenavigator/. How to use the Navigator for this activity: Select your home state; Click Browse for Programs, enter the career name in the Programs/Majors box, click Add. Click Close, then click Show Results Select three schools from the list. Open the information for each school and explore the tab Tuition, Fees, and Estimated Student Expenses. Fill in the chart below
IN STATE
College/University Option 1
IN STATE College/University
Option 2
IN STATE College/University
Option 3
School name, city, and state
Estimate of annual expenses for in-state, either on or off campus Annual tuition + housing + fees
Estimate of total expenses for 4 years. Hint: Multiply by 4 or use the multiyear tuition calculator button.
Amount of student loans to equal 50 percent of total estimated expenses for four years
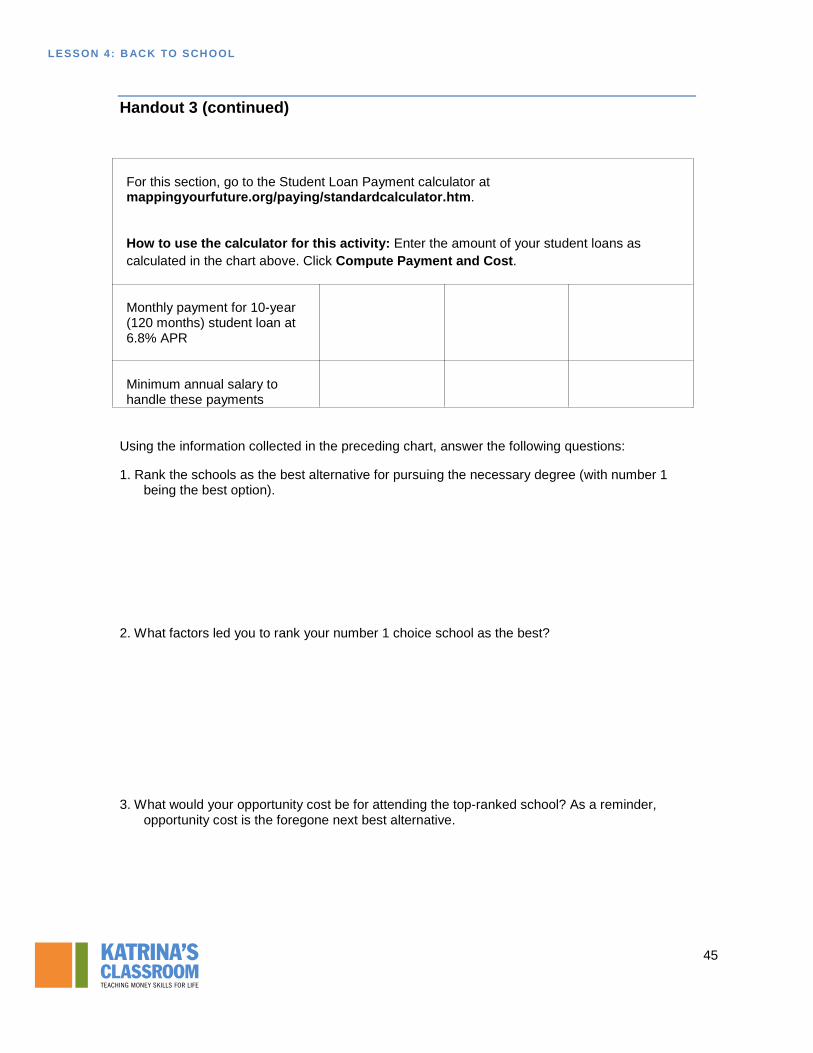
LESSON 4: B ACK TO SCHOOL
45
Handout 3 (continued)
For this section, go to the Student Loan Payment calculator at mappingyourfuture.org/paying/standardcalculator.htm.
How to use the calculator for this activity: Enter the amount of your student loans as calculated in the chart above. Click Compute Payment and Cost.
Monthly payment for 10-year (120 months) student loan at 6.8% APR
Minimum annual salary to handle these payments
Using the information collected in the preceding chart, answer the following questions:
1. Rank the schools as the best alternative for pursuing the necessary degree (with number 1 being the best option).
2. What factors led you to rank your number 1 choice school as the best?
3. What would your opportunity cost be for attending the top-ranked school? As a reminder, opportunity cost is the foregone next best alternative.

LESSON 4: B ACK TO SCHOOL
46
Handout 3 (continued)
4. Remember that an entry-level salary is usually the amount earned by the lowest 10 percent of wage earners in a particular job (see question 4 on the first page of Handout 4). Will the estimated entry salary for this position be enough to make the student loan payments? Why or why not?
5. What are some strategies that you could use to reduce the total amount you borrow to attend any of the schools on your list?

LESSON 4: B ACK TO SCHOOL
47
Handout 4: Career Option
Teacher Directions Copy and cut apart the cards. You will randomly distribute one card to each group. Depending on the size of your class, you may have to copy more than one set of cards.
Civil Engineer
1
Social Worker
2
Registered Nurse
3
Financial Analyst
4
Librarian
5
Urban Planner
6
Physical Therapist
7
Elementary School
Teacher
8
High School
Teacher
9
Accountant
10
Computer Programmer
11
Athletic Trainer
12
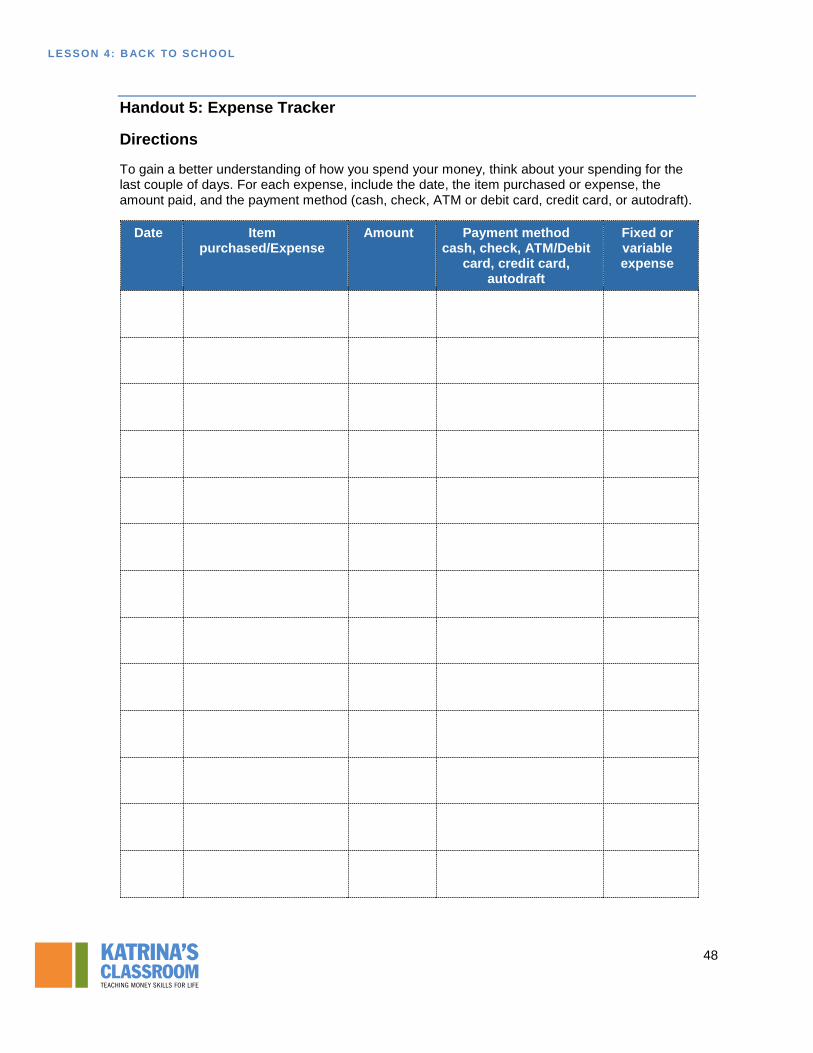
LESSON 4: B ACK TO SCHOOL
48
Handout 5: Expense Tracker
Directions
To gain a better understanding of how you spend your money, think about your spending for the last couple of days. For each expense, include the date, the item purchased or expense, the amount paid, and the payment method (cash, check, ATM or debit card, credit card, or autodraft).
Date Item purchased/Expense
Amount Payment method cash, check, ATM/Debit
card, credit card, autodraft
Fixed or variable expense

LESSON 4: B ACK TO SCHOOL
49
Handout 5 (Continued)
Date Item purchased/Expense
Amount Payment method cash, check, ATM/Debit
card, credit card, autodraft
Fixed or variable expense

LESSON 4: B ACK TO SCHOOL
50
Handout 6: Budget Worksheet
Directions
You recently graduated from college and started a new job. Your net pay is $2,000 a month. With your group, develop a budget in the Estimate column. You will need to indicate how you would spend your money. Be careful not go over budget. After you complete your estimate, you will receive your scenario cards from your teacher. Take turns drawing a card from the stack of scenarios. Each of you should enter the value of the card under the Actual column for the appropriate category on the monthly budget worksheet. Remember to add dollar signs and decimal points. Once you have drawn all cards, sum up the fixed expenses and variable expenses, and then calculate the surplus/deficit. When you have completed the table, answer the questions at the bottom of the worksheet.
Income Estimate (based on $2,000)
Actual (based on scenario
cards) Net income
Fixed expenses Rent Renter’s insurance Automobile loan payment Automobile insurance Medical insurance Student loan Total fixed expenses
Variable expenses Groceries Dining out Utilities Gasoline Car maintenance Clothing and personal upkeep Gifts Entertainment Savings Total variable expenses
Total expenses SURPLUS (DEFICIT)
LESSON 4: B ACK TO SCHOOL
51
Handout 6 (Continued)
Discuss your findings as a group.
• How did your group’s estimates differ from the scenario? • How much did you estimate as savings each month? • Were there expenses on this budget that were not listed in the categories? • If you had to pay for these expenses, where would the money come from?

LESSON 4: B ACK TO SCHOOL
52
Handout 7: Budget Worksheet Scenario Cards
Teacher Directions Copy and cut apart the cards. Give one set of cards (or one complete page) to each group of students after they complete their budget estimate.
Student Directions
Use the scenario cards to complete the Actual budget column.
You pay a $250 car payment every month.
1
You receive your monthly net income of $2,000.
2
You pay rent of $450 per month.
3
You pay your medical insurance of $100 a month.
4
You pay your renter’s insurance of $25 a month.
5
You make your month car insurance payment of $75.
6
You pay for monthly groceries $200.
7
Your monthly utilities are due. You owe $125 for power and water.
8
Your monthly bill for gasoline comes in and you must pay $75.
9
It’s your mother’s birthday. You purchase a $25 present.
10
Your monthly student loan payment is $325.
11
You go to a movie with a friend that costs $10.
12
Every month, you put $75 into savings for a vacation at the beach.
13
You hit a pothole and have a flat tire. You must pay $100 for a new tire.
14
You went out to eat three times this month, spending a total of $75.
15
You find the perfect outfit for your date this weekend. You pay $75.
16

LESSON 4: B ACK TO SCHOOL
53
Handout 8: Full-Scale Expense Tracking and Budgeting Worksheet
Directions
PART 1
1. Estimate your total income and write it on the line above the table labeled Estimated monthly income. Be sure to consider all sources of income, including allowance, gifts, and wages.
2. Based on your estimated income, complete the column Monthly estimated budget. 3. Use the Expense Tracker to track all your expenses. 4. Each week, use the information from the Expense Tracker to record the information in the
Budget Worksheet. 5. Each week, should record your weekly income. 6. At the end of the fourth week, generate a monthly total for each category by adding up
weeks 1 through 4. 7. Compare against your budget estimate to determine a surplus or deficit for each category
and overall.
Estimated monthly income: ______________
Expense categories Week 1 Week 2 Week 3 Week 4
Total Expenses
(add weeks 1–4)
Monthly budget
estimate Surplus/ Deficit
Groceries
Dining out
Gas
Entertainment
Car payment
Car repair
Car Insurance
Gifts
Rent
Renters i
Health insurance
Utilities
School
Clothing
Credit cards
Loans
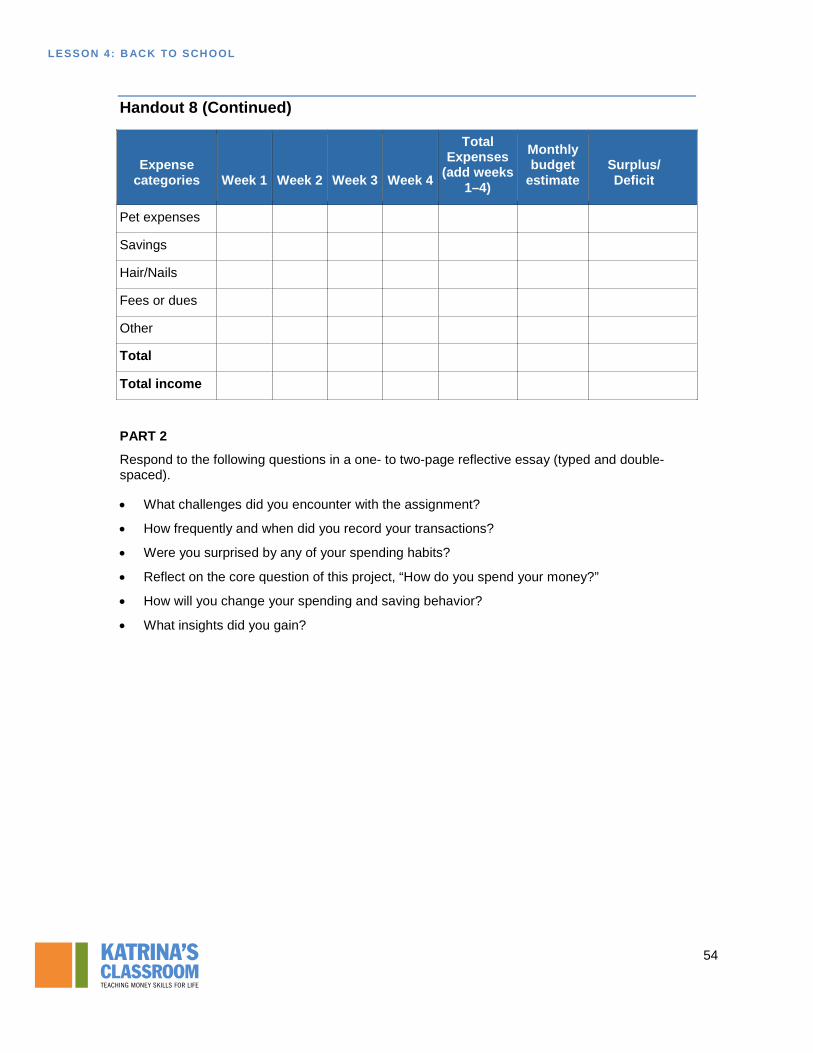
LESSON 4: B ACK TO SCHOOL
54
Handout 8 (Continued)
Expense categories Week 1 Week 2 Week 3 Week 4
Total Expenses
(add weeks 1–4)
Monthly budget
estimate Surplus/ Deficit
Pet expenses
Savings
Hair/Nails
Fees or dues
Other
Total
Total income
PART 2 Respond to the following questions in a one- to two-page reflective essay (typed and double-spaced).
• What challenges did you encounter with the assignment?
• How frequently and when did you record your transactions?
• Were you surprised by any of your spending habits?
• Reflect on the core question of this project, “How do you spend your money?”
• How will you change your spending and saving behavior?
• What insights did you gain?

LESSON 4: B ACK TO SCHOOL
55
Katr ina’s C lassr oom wa s deve lop ed by a t eam of senior economic a nd f inancial educat ion sp ecia l i st s a t th e F edera l R eser ve Bank of At lanta.
C la i r e Lou p, N ew O r lea n s B ra n ch J u l i e K o rn e ga y , B i rmi n gha m B ra n ch J a ck i e Mor ga n , Na shvi l l e B ra n ch
For additional classroom resources and professional development opportunities, please visit www. frbatlanta.org/edresources