lesson 2.0 algebra exercises - ms. talley -...
TRANSCRIPT

CCGPS UNIT 2 – Semester 1 COORDINATE ALGEBRA Page 1 of 22
Reasoning with Equations and Quantities Name: _________________
Date: ________________
Understand solving equations as a process of reasoning and explain the reasoning
MCC9-12.A.REI.1 Explain each step in solving a simple equation as following from the equality of numbers asserted at the previous step, starting from the assumption that the original equation has a solution. Construct a viable argument to justify a solution method. (Students
should focus on and master linear equations and be able to extend and apply their reasoning to other types of equations in future courses.)
Solve equations and inequalities in one variable
MCC9-12.A.REI.3 Solve linear equations and inequalities in one variable, including equations with coefficients represented by letters.(Extend earlier work with
solving linear equations to solving linear inequalities in one variable and to solving literal equations that are linear in the variable being solved for.
Include simple exponential equations that rely only on application of the laws of exponents, such as 5x = 125 or 2x = 1/16.)
Solve systems of equations
MCC9-12.A.REI.5 Prove that, given a system of two equations in two variables, replacing one equation by the sum of that equation and a multiple of the other produces a system with the same solutions. (Limit to linear systems.)
MCC9-12.A.REI.6 Solve systems of linear equations exactly and approximately (e.g., with graphs), focusing on pairs of linear equations in two variables.
Represent and solve equations and inequalities graphically
MCC9-12.A.REI.12 Graph the solutions to a linear inequality in two variables as a half-plane (excluding the boundary in the case of a strict inequality), and graph the solution set to a system of linear inequalities in two variables as the intersection of the corresponding half-planes.
LESSON 2.0 ALGEBRA EXERCISES
Solve for x
1. 5 10 35x 2. 30 3 0x
3. 0.5 6.7 13.3x 4. 2 10 4 8x x
5. 54
x 6.
1020
x
7. 10 15 a 8. 14 16x
CCGPS UNIT 2 – Semester 1 COORDINATE ALGEBRA Page 2 of 22
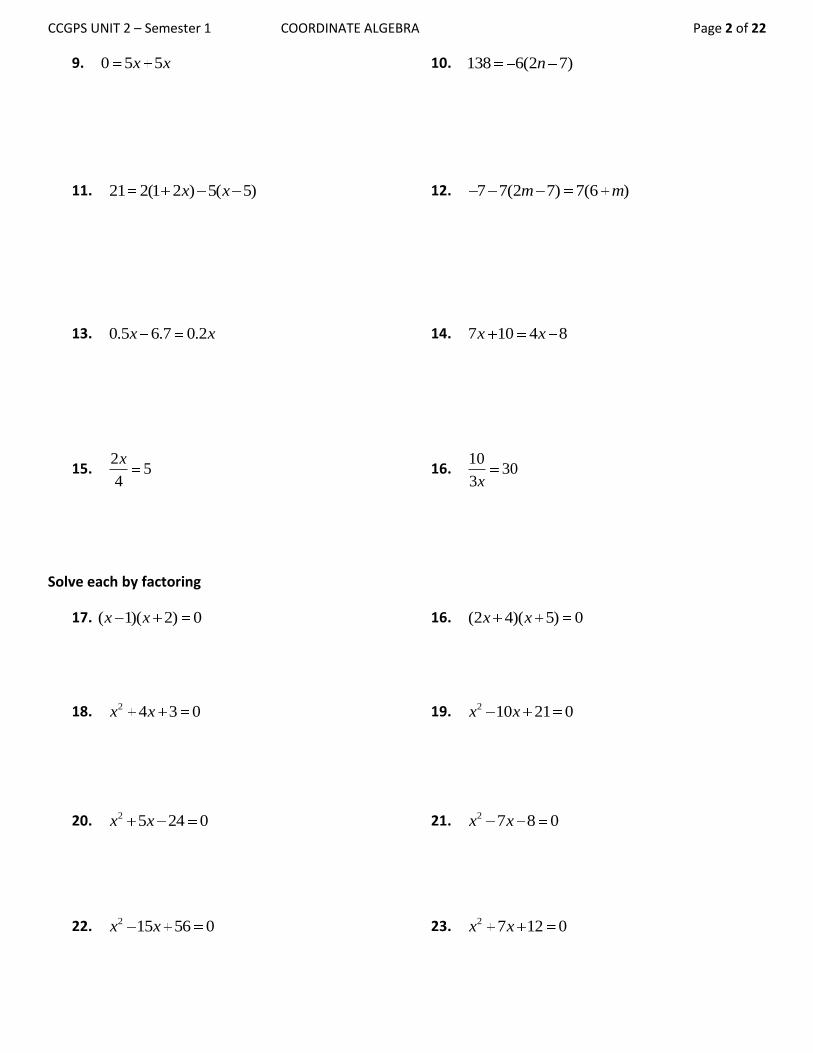
9. 0 5 5x x 10. 138 6(2 7)n
11. 21 2(1 2 ) 5( 5)x x 12. 7 7(2 7) 7(6 )m m
13. 0.5 6.7 0.2x x 14. 7 10 4 8x x
15. 2
54
x 16.
1030
3x
Solve each by factoring
17. ( 1)( 2) 0x x 16. (2 4)( 5) 0x x
18. 2 4 3 0x x 19. 2 10 21 0x x
20. 2 5 24 0x x 21. 2 7 8 0x x
22. 2 15 56 0x x 23. 2 7 12 0x x
CCGPS UNIT 2 – Semester 1 COORDINATE ALGEBRA Page 3 of 22
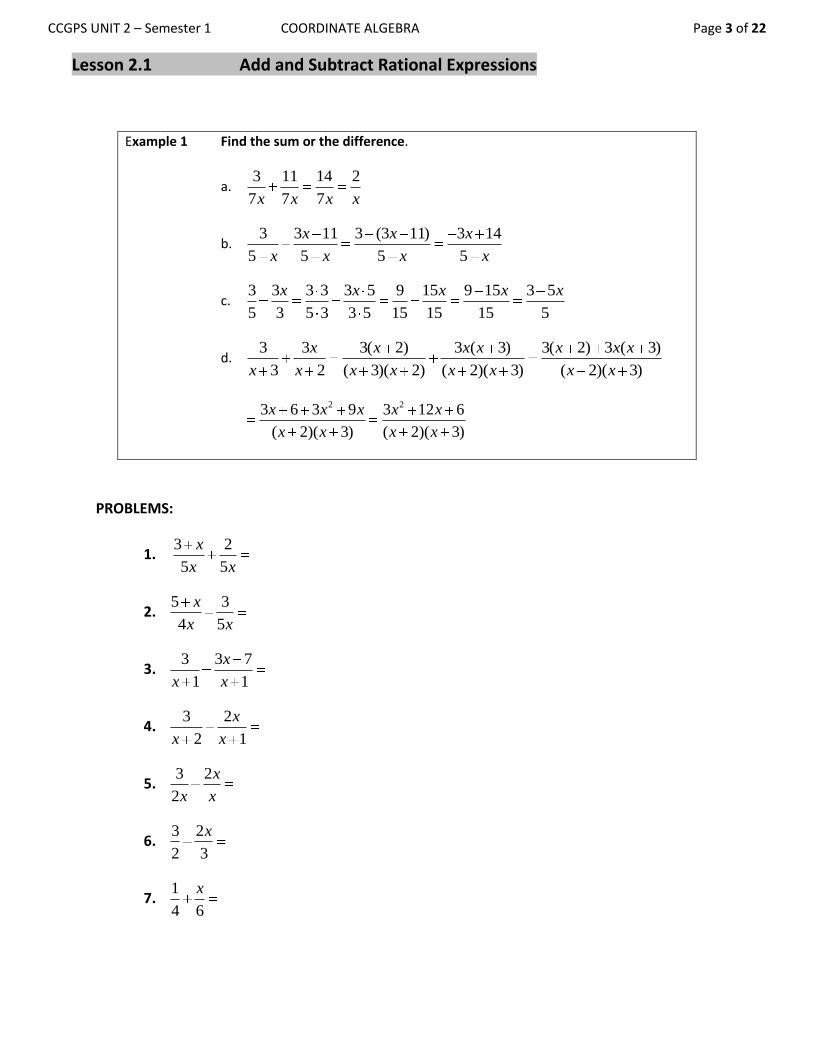
Lesson 2.1 Add and Subtract Rational Expressions
PROBLEMS:
1. 3 2
5 5
x
x x
2. 5 3
4 5
x
x x
3. 3 3 7
1 1
x
x x
4. 3 2
2 1
x
x x
5. 3 2
2
x
x x
6. 3 2
2 3
x
7. 1
4 6
x
Example 1 Find the sum or the difference.
a. 3 11 14 2
7 7 7x x x x
b. 3 3 11 3 (3 11) 3 14
5 5 5 5
x x x
x x x x
c. 3 3 3 3 3 5 9 15 9 15 3 5
5 3 5 3 3 5 15 15 15 5
x x x x x
d. 3 3 3( 2) 3 ( 3) 3( 2) 3 ( 3)
3 2 ( 3)( 2) ( 2)( 3) ( 2)( 3)
x x x x x x x
x x x x x x x x
2 23 6 3 9 3 12 6
( 2)( 3) ( 2)( 3)
x x x x x
x x x x
CCGPS UNIT 2 – Semester 1 COORDINATE ALGEBRA Page 4 of 22
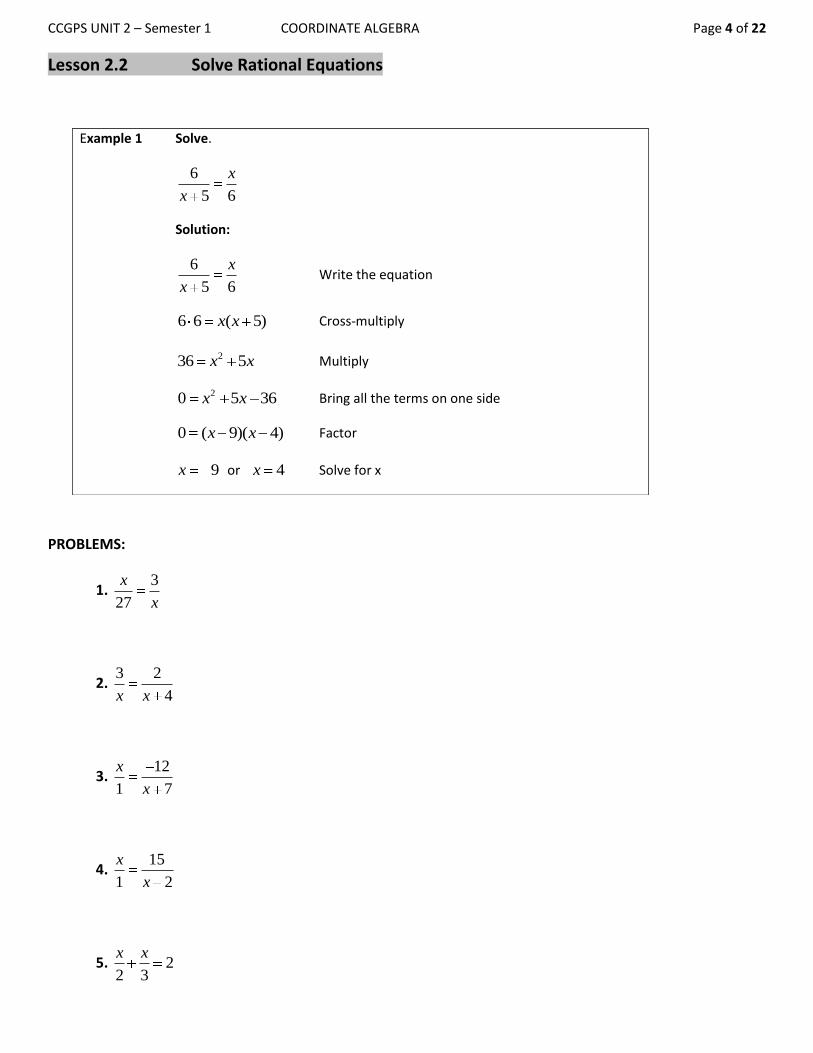
Lesson 2.2 Solve Rational Equations
PROBLEMS:
1. 3
27
x
x
2. 3 2
4x x
3. 12
1 7
x
x
4. 15
1 2
x
x
5. 22 3
x x
Example 1 Solve.
6
5 6
x
x
Solution:
6
5 6
x
x Write the equation
6 6 ( 5)x x Cross-multiply
236 5x x Multiply
20 5 36x x Bring all the terms on one side
0 ( 9)( 4)x x Factor
9x or 4x Solve for x

CCGPS UNIT 2 – Semester 1 COORDINATE ALGEBRA Page 5 of 22
Lesson 2.3 Solve a Linear System by Graphing
Goal Solve systems of linear equations
Vocabulary A system of linear equations with two variables x and y consists of two equations that can be
written in the following form: .Ax By C and Dx Ey F
A solution of a system of linear equations with two variables is an ordered pair ( , )x y that satisfies
each equation (plugging in the corresponding numbers for xand y ).
A system which has at least one solution is called consistent. The solution point is where both lines
cross which was defined earlier as an ordered pair.
If there is no solution to a system, it is called inconsistent (if both lines are parallel they never
touch; therefore there is no solution to the system).
A consistent system with exactly one solution is called independent.
A consistent system with infinitely many solutions is called dependent: Both lines lay on top of each
other and every point is a solution.
Example 1: Solve systems graphically
3 5 1
2 5 2
y x Equation
y x Equation 3 5y x 2 5y x
Solution: Graph both equations. The lines intersect
each other at (2, 1) , i.e. ordered pair.
Check the solution by plugging in the ordered pair into the equations:
1 2
3 5 2 5
( 1) 3(2) 5 ( 1) 2(2) 5
1 6 5 1 4 5
5 5 5 5
Equation Equation
y x y x

CCGPS UNIT 2 – Semester 1 COORDINATE ALGEBRA Page 6 of 22
PROBLEMS
Graph the linear system and find its solution. Then check the solution algebraically.
1. 4 1y x
4y x
2. 3 7x y
2 3y x
3. 2 2 4x y
1y
CCGPS UNIT 2 – Semester 1 COORDINATE ALGEBRA Page 7 of 22
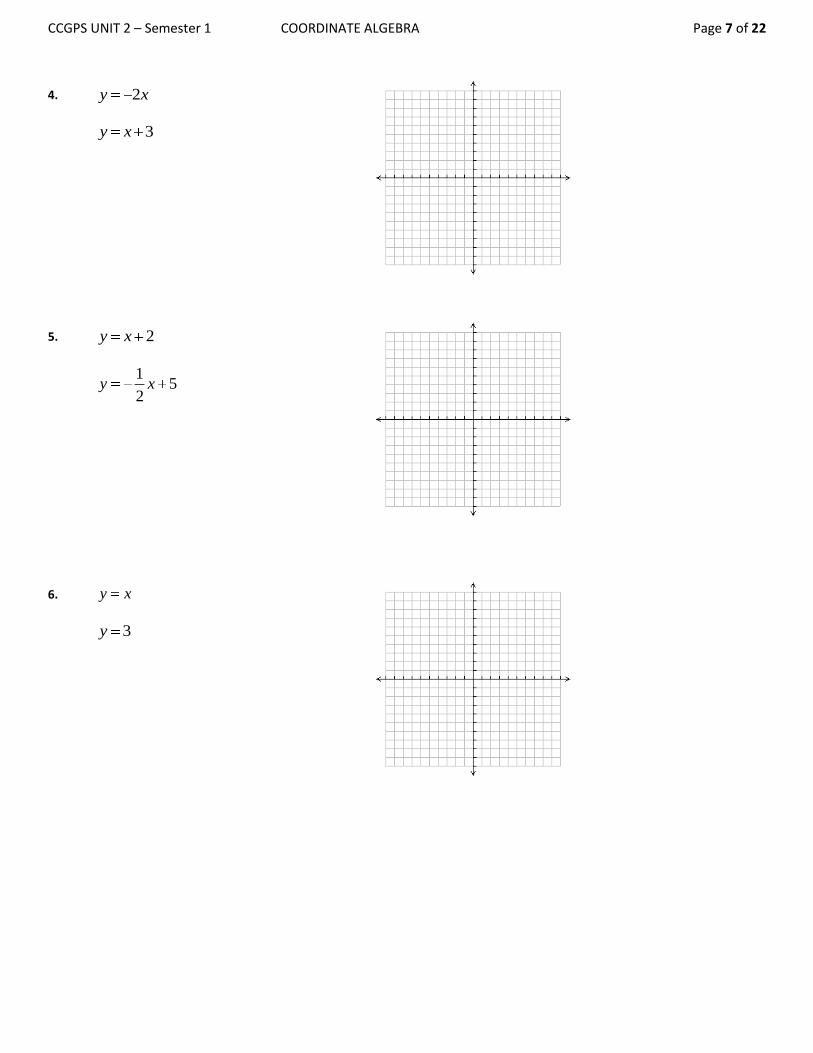
4. 2y x
3y x
5. 2y x
1
52
y x
6. y x
3y
CCGPS UNIT 2 – Semester 1 COORDINATE ALGEBRA Page 8 of 22
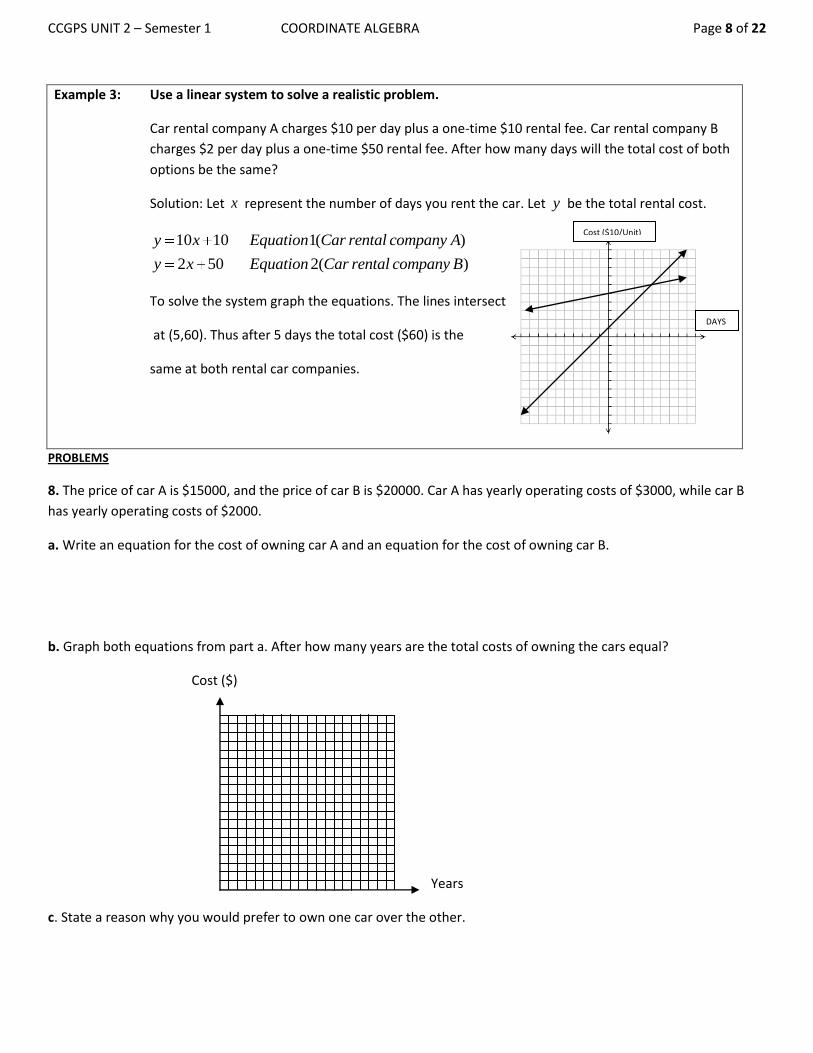
Example 3: Use a linear system to solve a realistic problem.
Car rental company A charges $10 per day plus a one-time $10 rental fee. Car rental company B
charges $2 per day plus a one-time $50 rental fee. After how many days will the total cost of both
options be the same?
Solution: Let x represent the number of days you rent the car. Let y be the total rental cost.
10 10 1( )
2 50 2( )
y x Equation Car rental company A
y x Equation Car rental company B
To solve the system graph the equations. The lines intersect
at (5,60). Thus after 5 days the total cost ($60) is the
same at both rental car companies.
PROBLEMS
8. The price of car A is $15000, and the price of car B is $20000. Car A has yearly operating costs of $3000, while car B
has yearly operating costs of $2000.
a. Write an equation for the cost of owning car A and an equation for the cost of owning car B.
b. Graph both equations from part a. After how many years are the total costs of owning the cars equal?
Cost ($)
Years
c. State a reason why you would prefer to own one car over the other.
Cost ($10/Unit)
DAYS

CCGPS UNIT 2 – Semester 1 COORDINATE ALGEBRA Page 9 of 22
9. John decides to open a bank account. He deposits $35 and plans to deposit every week another $10. Markus has
saved $60 and plans to save $5 every week.
a. Plot a line which represent John’s money, and plot a line that represents Markus’ money over time.
Money Saved ($)
Weeks
b. When do both lines meet? What does that point mean?
c. Who will have more money after 3 weeks?
d. Who will have more money after 8 weeks?
e. Why are the slopes of both lines different from each other?
f. What does that the slope of each line represent?
g. What do the y-intercepts of each line represent?
CCGPS UNIT 2 – Semester 1 COORDINATE ALGEBRA Page 10 of 22
Lesson 2.4 Solve Linear System Algebraically
PROBLEMS Solve the system using the substitution method
1. 2 4
3 5 6
x y
x y 2.
3 6 3
2 5
x y
x y
Vocabulary Substitution Method: See example 1
Elimination Method: See example 2.
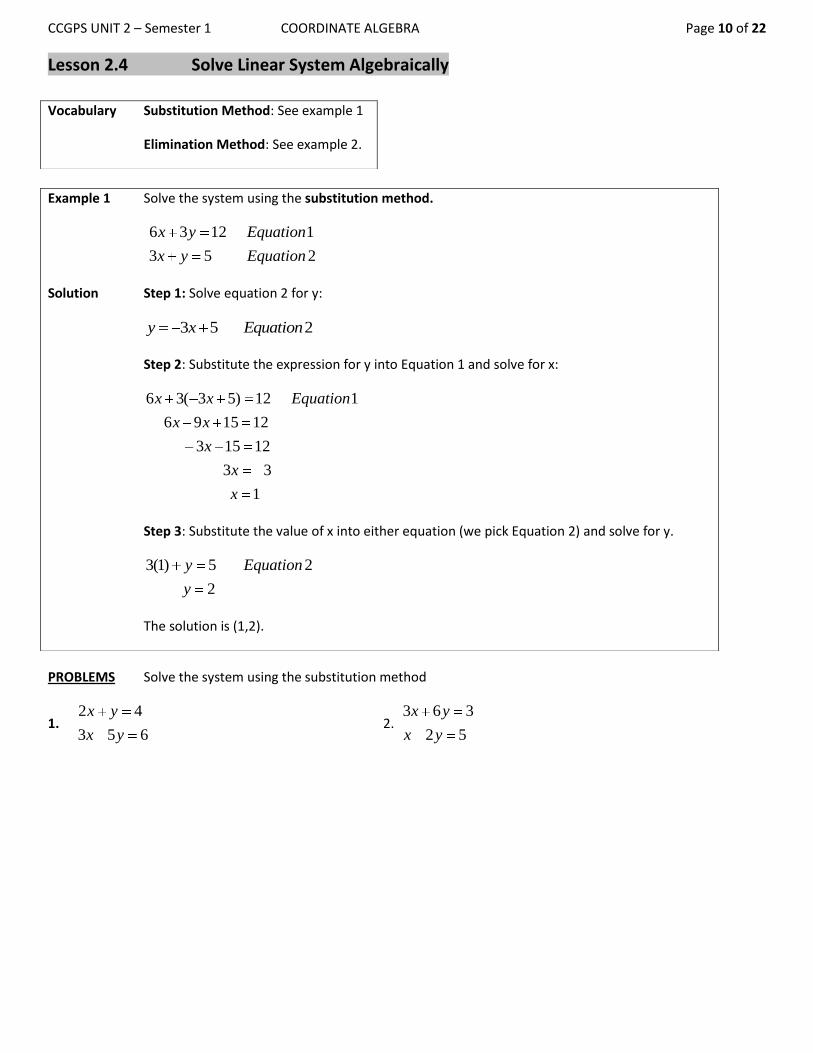
Example 1 Solve the system using the substitution method.
6 3 12 1
3 5 2
x y Equation
x y Equation
Solution Step 1: Solve equation 2 for y:
3 5 2y x Equation
Step 2: Substitute the expression for y into Equation 1 and solve for x:
6 3( 3 5) 12 1
6 9 15 12
3 15 12
3 3
1
x x Equation
x x
x
x
x
Step 3: Substitute the value of x into either equation (we pick Equation 2) and solve for y.
3(1) 5 2
2
y Equation
y
The solution is (1,2).

CCGPS UNIT 2 – Semester 1 COORDINATE ALGEBRA Page 11 of 22
PROBLEMS Solve the system using the elimination method
3. 3 3 3
3 9
x y
x y 4.
4 2 2
6 5
x y
x y
Solve the system using any method of your liking.
5. 5 7 2
2 7 9
x y
x y 6.
7 3 6
2 5 10
x y
x y
Example 2 Solve the system using the elimination method.
6 3 12 1
3 5 2
x y Equation
x y Equation
Solution Step 1: Multiply equation 2 by -3, so that the coefficients of y only differ in sign. Then add both
equations and solve for x (since 3y is cancelled out by -3y):
6 3 12 1 6 3 12
3 5 ( 3) 2 9 3 15
3 3
1
x y Equation x y
x y Equation x y
x
x
Step 2: Substitute the expression for y into Equation 1 and solve for x:
6 3 12 1
6(1) 3 12
3 6
2
x y Equation
y
y
y
The solution is (1,2).
Hint: Alternatively you could have multiplied Equation 2 by -2 and cancelled x upon addition of
both equations. Choose any way which is most convenient.
CCGPS UNIT 2 – Semester 1 COORDINATE ALGEBRA Page 12 of 22
Lesson 2.5 Graph Linear Inequalities in Two Variables
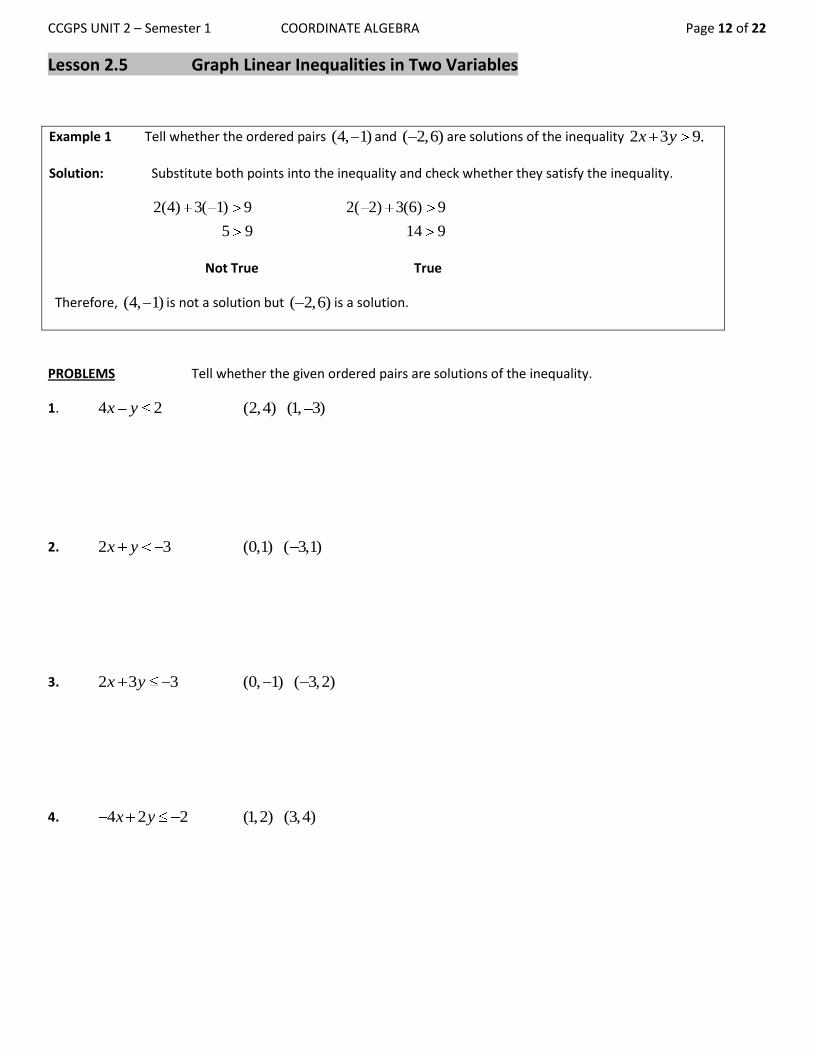
Example 1 Tell whether the ordered pairs (4, 1) and ( 2,6) are solutions of the inequality 2 3 9.x y
Solution: Substitute both points into the inequality and check whether they satisfy the inequality.
2(4) 3( 1) 9 2( 2) 3(6) 9
5 9 14 9
Not True True
Therefore, (4, 1) is not a solution but ( 2,6) is a solution.
PROBLEMS Tell whether the given ordered pairs are solutions of the inequality.
1. 4 2 (2,4) (1, 3)x y
2. 2 3 (0,1) ( 3,1)x y
3. 2 3 3 (0, 1) ( 3,2)x y
4. 4 2 2 (1,2) (3,4)x y
CCGPS UNIT 2 – Semester 1 COORDINATE ALGEBRA Page 13 of 22
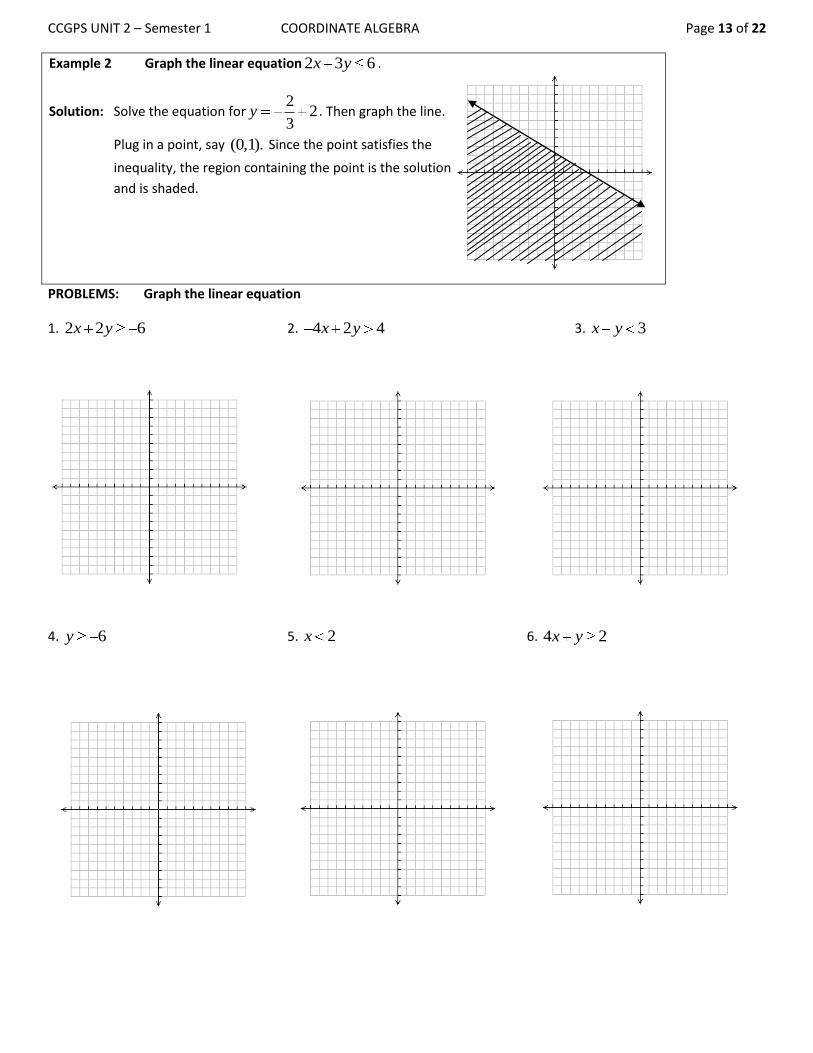
Example 2 Graph the linear equation 2 3 6x y .
Solution: Solve the equation for2
23
y . Then graph the line.
Plug in a point, say (0,1). Since the point satisfies the
inequality, the region containing the point is the solution
and is shaded.
PROBLEMS: Graph the linear equation
1. 2 2 6x y 2. 4 2 4x y 3. 3x y
4. 6y 5. 2x 6. 4 2x y

CCGPS UNIT 2 – Semester 1 COORDINATE ALGEBRA Page 14 of 22
PROBLEMS:
1. The Boston Celtic coach believes they can win the NBA title if they score at least 90 points per game.
a. Write an inequality to represent the number of two-point shots and the number of three-point shots that total
at least 90 points per game.
b. Graph the inequality.
Example 3 In basketball you can score by throwing two-point and three-point shots.
a. Write an inequality to represent the number of two-point shots and the number of
three-point shots that total at least 15 points.
b. Graph the inequality.
Solution a. Let the number of two-point score be x, and the number of three-point scores be
y. Then the number of two-point scores times 2 and the number of three point scores
times three have to be equal or exceed 15. The equation for this inequality can be
written as follows:
2 3 15x y
b. In order to plot the equation you can solve the equation for y which yields:
2
53
y x
The solution is the area on and above the line. (2,6)
That means any combination of integers for
x and y with a coordinate point on or above
the line will be a solution.
For example the point (2, 6) is a solution since it is above the line. The score
associated with the point is 2x3 plus 6x2 which is larger or equal to 15.
CCGPS UNIT 2 – Semester 1 COORDINATE ALGEBRA Page 15 of 22
2. In soccer you receive 3 points for winning and 1 point for a tie. In order to win the national championship a soccer
coach estimates his team needs to make at least 50 points.
a. Write an inequality to represent the number of wins and ties that total at least 50 points for the season.
b. Graph the inequality.
3. You are the owner of a coffee shop and sell espressos for $2 and lattes for $4.
a. Write an inequality to represent the number of espressos and lattes you have to sell each day to make a daily
revenue of more than $100.
b. Graph the inequality.
CCGPS UNIT 2 – Semester 1 COORDINATE ALGEBRA Page 16 of 22
Lesson 2.6 Graph Systems of Linear Inequalities
Vocabulary
An example of a system of linear inequalities is: 2 6x y and 3 4 1x y . A solution
of a system of inequalities is an ordered pair that satisfies both inequalities.
PROBLEMS: Graph a system of two inequalities.
1. 2
y x
y 2.
2 1
4 3
y x
y x 3.
2
3
y x
y x
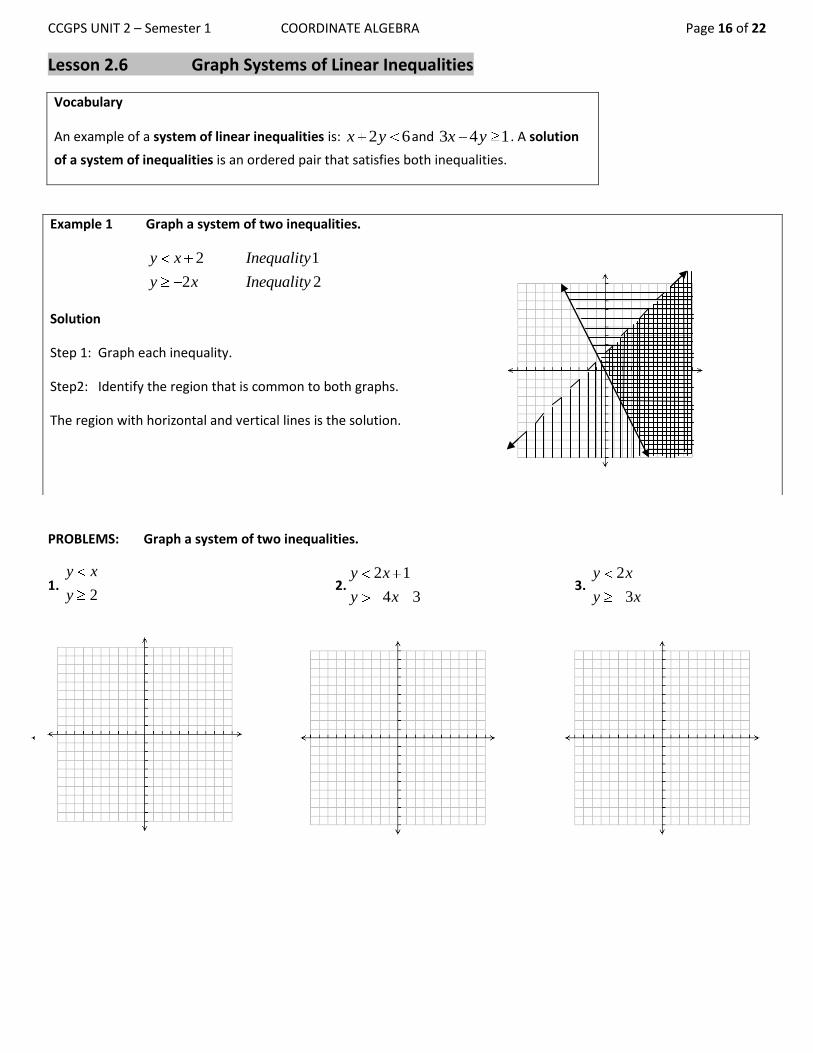
Example 1 Graph a system of two inequalities.
2 1
2 2
y x Inequality
y x Inequality
Solution
Step 1: Graph each inequality.
Step2: Identify the region that is common to both graphs.
The region with horizontal and vertical lines is the solution.

CCGPS UNIT 2 – Semester 1 COORDINATE ALGEBRA Page 17 of 22
PROBLEMS: Graph a system of inequalities.
1. 2
5
y x
y
y
2.
1
3
2
y x
y
x
3.
3
0
2
5
y
y
x
x
Example 2 Graph a system of three or more inequalities.
1
2 2
3
y x Inequality
y Inequality
y x Inequality
Solution
Step 1: Graph each inequality.
Step2: Identify the region that is common to all graphs.
The region with horizontal and vertical lines is the solution.
CCGPS UNIT 2 – Semester 1 COORDINATE ALGEBRA Page 18 of 22
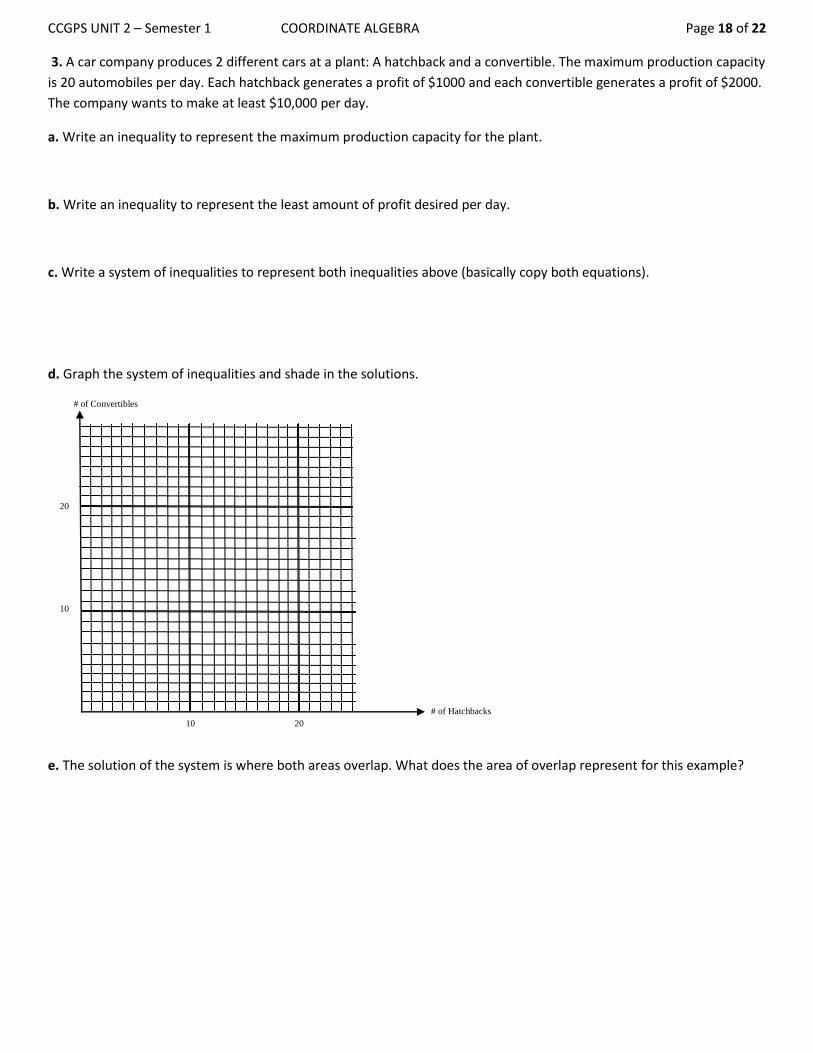
3. A car company produces 2 different cars at a plant: A hatchback and a convertible. The maximum production capacity
is 20 automobiles per day. Each hatchback generates a profit of $1000 and each convertible generates a profit of $2000.
The company wants to make at least $10,000 per day.
a. Write an inequality to represent the maximum production capacity for the plant.
b. Write an inequality to represent the least amount of profit desired per day.
c. Write a system of inequalities to represent both inequalities above (basically copy both equations).
d. Graph the system of inequalities and shade in the solutions.
# of Convertibles
20
10
# of Hatchbacks
10 20
e. The solution of the system is where both areas overlap. What does the area of overlap represent for this example?
CCGPS UNIT 2 – Semester 1 COORDINATE ALGEBRA Page 19 of 22
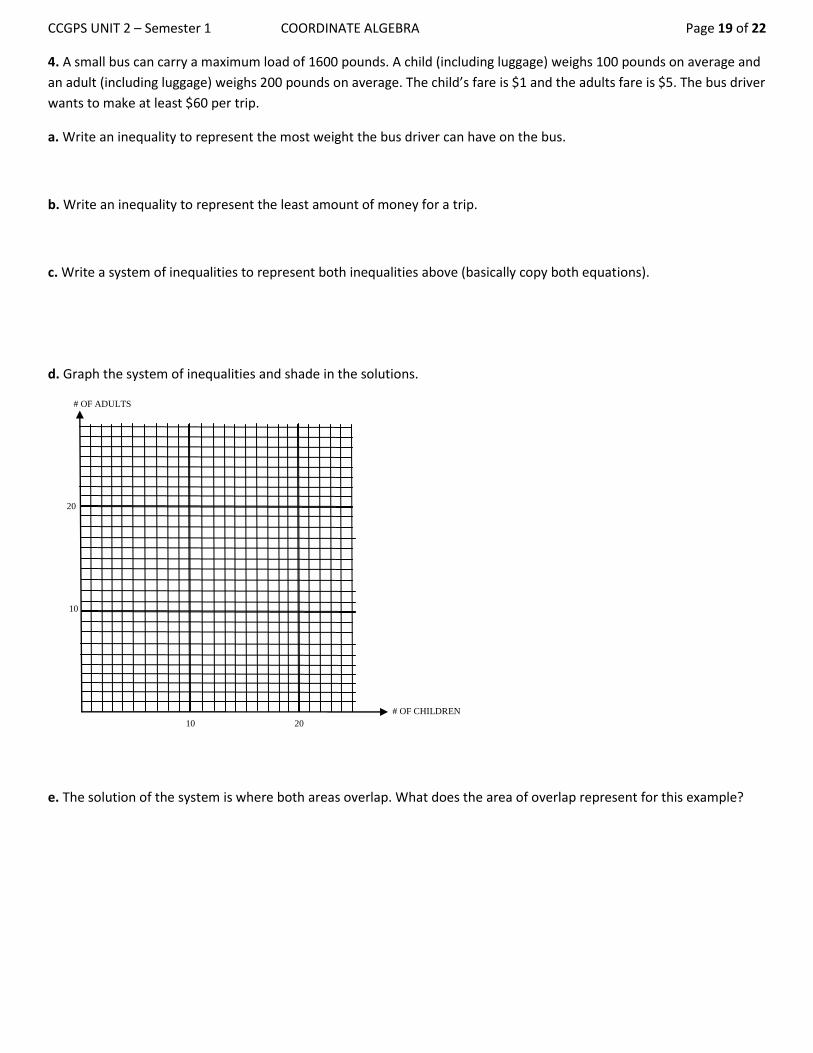
4. A small bus can carry a maximum load of 1600 pounds. A child (including luggage) weighs 100 pounds on average and
an adult (including luggage) weighs 200 pounds on average. The child’s fare is $1 and the adults fare is $5. The bus driver
wants to make at least $60 per trip.
a. Write an inequality to represent the most weight the bus driver can have on the bus.
b. Write an inequality to represent the least amount of money for a trip.
c. Write a system of inequalities to represent both inequalities above (basically copy both equations).
d. Graph the system of inequalities and shade in the solutions.
# OF ADULTS
20
10
# OF CHILDREN
10 20
e. The solution of the system is where both areas overlap. What does the area of overlap represent for this example?

CCGPS UNIT 2 – Semester 1 COORDINATE ALGEBRA Page 20 of 22
5. You are shopping for a bike. The regular price of a bike is between $200 and $400. The store is running a sale
where all bikes are between 20% and 60% off the regular price. The system of linear equations represents the
amount you can save.
Let x represent the regular price.
Let y represent the amount you can save.
200
400
x
x The regular price is between $200 and $400
0.60
0.20
y x
y x The sales price is between 20% (=0.20) and 60% (=0.60) of the regular price
a. Plot the inequality
SAVINGS ($)
400
300
200
100
REGULAR PRICE ($)
100 200 300 400
b. What is the most you can save? (Hint: Look at the point (400,240))
c. What is the least you can save? (Hint: Look at the point (200,40))
d. What is the most you will pay for the most expensive bike? (Hint: Look at the point (400,80))
e. What is the most that you will pay for the least expensive bike? (Hint: Look at the point (200,40))
f. What is the least you will pay for the most expensive bike? (Hint: Look at the point (400,80))

CCGPS UNIT 2 – Semester 1 COORDINATE ALGEBRA Page 21 of 22
6. A company is manufacturing computers. A tablet computer costs $300 to make and a laptop costs $600 to
make. The budget available for materials is $21,000 per day. The manufacturing capacity is 50 computers per
day.
Let x represent the tablets.
Let y represent the laptops.
a. Write a system of linear inequalities to represent the problem situation.
b. Graph the inequality.
# OF LAPTOPS
100
50
# OF TABLETS
50 100
CCGPS UNIT 2 – Semester 1 COORDINATE ALGEBRA Page 22 of 22
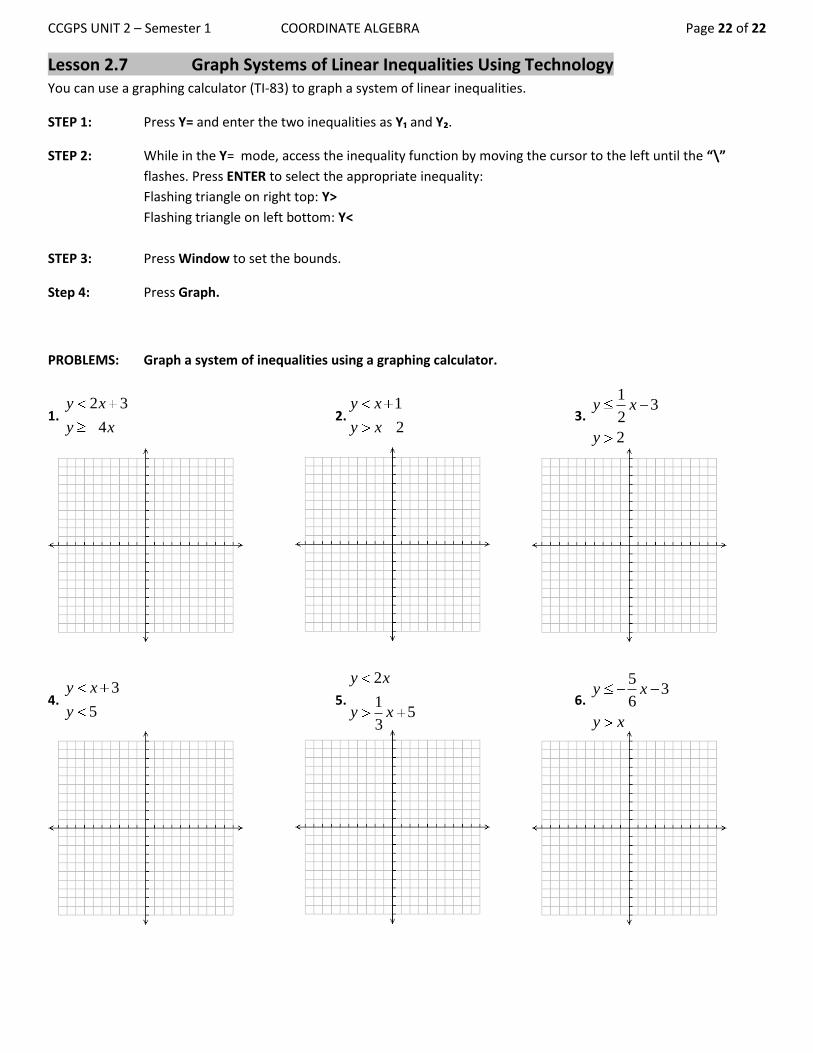
Lesson 2.7 Graph Systems of Linear Inequalities Using Technology You can use a graphing calculator (TI-83) to graph a system of linear inequalities.
STEP 1: Press Y= and enter the two inequalities as Y₁ and Y₂.
STEP 2: While in the Y= mode, access the inequality function by moving the cursor to the left until the “\”
flashes. Press ENTER to select the appropriate inequality:
Flashing triangle on right top: Y>
Flashing triangle on left bottom: Y<
STEP 3: Press Window to set the bounds.
Step 4: Press Graph.
PROBLEMS: Graph a system of inequalities using a graphing calculator.
1. 2 3
4
y x
y x 2.
1
2
y x
y x 3.
13
2
2
y x
y
4. 3
5
y x
y 5.
2
15
3
y x
y x 6.
53
6y x
y x