lesson 17: discerning good data from bad data design principles: less is more: limited capacity of...
Post on 21-Dec-2015
218 views
TRANSCRIPT

Lesson 17: Discerning Good Data from Bad Data
Design principles:
•Less is More: Limited capacity of working memory
•Colored highlighting: Direction selection of important information

“After taking our e-learning course, sales people sold 3.5 more units per day” Do you buy it?
Design principles:
•Less is More: Limited capacity of working memory
•Highlighting: Directing selection of important information
•Use of images and words
E-Learning
?

Learning Objective:
Develop a statistical tool to tell what data is believable and what data should be ignored.
Design principles:
•Less is More: Limited capacity of working memory
•Highlighting: Directing selection of important information
•Providing learning objective: Directing selection of important info
How it will help you: In future assignments you will be able to read reports about e-learning studies and see if the data is statistically significant.

Back to the knives: Look at the data?
Design principles:
•Highlighting: Directing selection of important information
•Text & Pictures close together: Contiguity principle
E-Learning
Without training
Average sales of 100 salespeople =
87.5 knives
With training
Average sales of 100 salespeople =
91 knives

Design principles:
•Highlighting: Directing selection of important information
•Text & Pictures close together: Contiguity principle
•Practice exercises: Help integration
E-Learning
Without training
Average sales of 100 salespeople =
87.5 knives
With training
Average sales of 100 salespeople =
91 knives
What do the averages tell us?Training increases sales of knives
Training decreases sales of knives
Training has no impact on sales of knives

Have you seen data that uses averages to convince you of a point?
Design principles:
•Give context to previous work to provide hooks for retrieval and transfer.
Use this space to describe some point in your job that you have seen data that includes averages.
Key Take-Away 1: Averages are not the whole story.
Design principles:
•Less is more
•Highlighting
•Provide learning objective
Learning Objective 2:We need to learn about Standard Deviation (SD).
= SD

Key Take-Away 1: Averages are not the whole story.
Design principles:
•Less is more
•Highlighting
•Provide learning objective
Learning Objective 2:We need to learn about Standard Deviation (SD).
= SD

Design principles:
•Less is more
•Highlighting
•Practice and involvement for integration
0
5
10
15
20
25
30
35
70 72 74 76 78 80 82 84 86 88 90
0
2
4
6
8
10
12
14
16
70 72 74 76 78 80 82 84 86 88 90
Two histograms of 100 numbers: Both have an average of 80?
What do you see as the difference?

Design principles:
•Less is more
•Highlighting
0
5
10
15
20
25
30
35
70 72 74 76 78 80 82 84 86 88 90
0
2
4
6
8
10
12
14
16
70 72 74 76 78 80 82 84 86 88 90
Standard Deviation = 2
Standard Deviation = 6
A lower standard deviation means the results are CLOSER to the average
A high standard deviation means the results are further from the average

Design principles:
•Less is more
•Practice exercise for integration
Which has the LOWER Standard Deviation?
0
5
10
15
20
25
30
70 72 74 76 78 80 82 84 86 88 900
2
4
6
8
10
12
14
70 72 74 76 78 80 82 84 86 88 90
A Or B
0
5
10
15
20
25
70 72 74 76 78 80 82 84 86 88 900
5
10
15
20
25
30
35
40
70 72 74 76 78 80 82 84 86 88 90
A
B
A
B

Design principles:
•Highlighting: Directing selection of important information
•Text & Pictures close together: Contiguity principle
E-Learning
Without training
Average sales of 100 salespeople =
86.9 knives
SD=20
With training
Average sales of 100 salespeople =
90.6 knives
SD=20
Back to the knives! How does SD fit in?

Design principles:
•Keep it simple
•Highlighting: Directing selection of important information
•Practice for integration
Without training
Average sales of 100 salespeople =
87.5 knives
SD=20
What will the histogram look like?
0
1
2
3
4
5
6
7
8
0
5
10
15
20
25
30
or

Design principles:
•Keep it simple
•Highlighting: Directing selection of important information
•Practice for integration
With training
Average sales of 100 salespeople =
91 knives
SD=20
What will the histogram look like?
0
1
2
3
4
5
6
7
8
0
5
10
15
20
25
30
or

Design principles:
•Keep it simple
•Highlighting: Directing selection of important information
With training
Average sales of 100 salespeople =
91 knives
SD=20
Without training
Average sales of 100 salespeople =
87.5 knives
SD=20
0
1
2
3
4
5
6
7
8
0
1
2
3
4
5
6
7
8
9
Can you tell them apart?
Design principles:
•Keep it simple
•Highlighting: Directing selection of important information
0
1
2
3
4
5
6
7
8
0
1
2
3
4
5
6
7
8
9
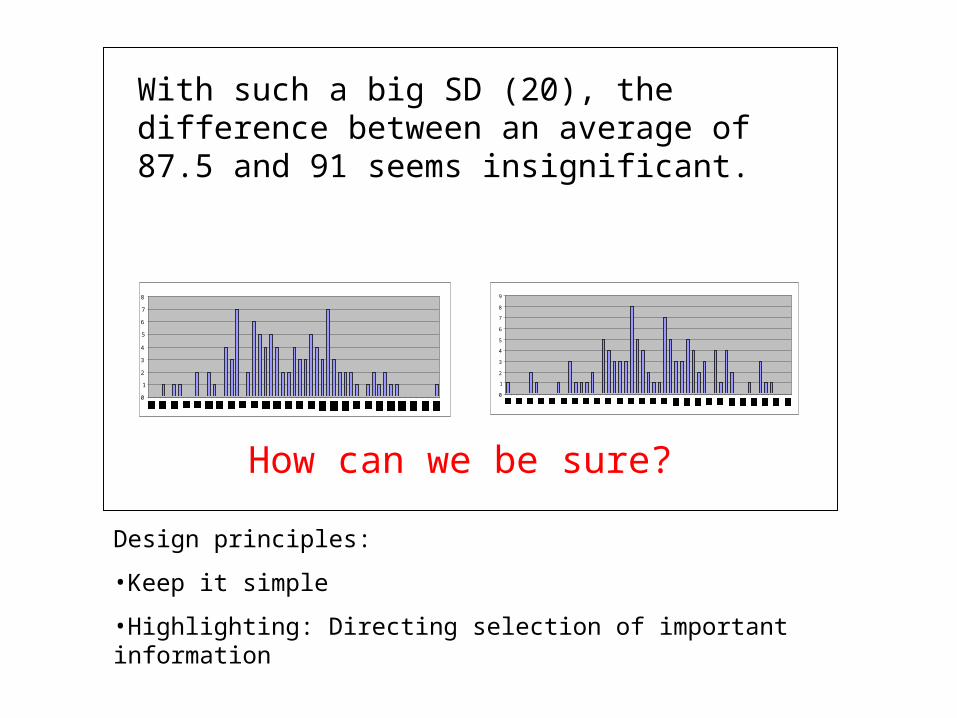
How can we be sure?
With such a big SD (20), the difference between an average of 87.5 and 91 seems insignificant.
Key Take-Away 2: We need a tool to tell if a difference in averages is significant.
Design principles:
•Less is more
•Highlighting
•Provide learning objective
Learning Objective 3:We need to learn about p-values.
= P-Value

Design principles:
•Highlighting: Directing selection of important information
•Text & Pictures close together: Contiguity principle
E-Learning
Without training
Average sales of 100 salespeople =
86.9 knives
SD=20
With training
Average sales of 100 salespeople =
90.6 knives
SD=20
Back to the knives! What is p-value?
The P-Value of this data = 0.087

Design principles:
•Highlighting: Directing selection of important information
•Text & Pictures close together: Contiguity principle
The P-Value of this data = 0.087
This means that there is a 8.7% chance that the difference between 87.5 and 91 knives was due to chance, not the e-learning program. It is “statistically insignificant and should not be trusted.
P<.05•“Statistically significant”•Believable
P>.05•“Statistically insignificant”•Do not believe!

Design principles:
•Practice for integration
•Text & Pictures close together: Contiguity principle
Try it out!
P-value= .00034
P-value= .25
P-value= .049

Design principles:
•Exercise for retrieval and transfer to the job (student) context
Bringing it Home
Next class, a classmate says that by using video games, the average student improves her reasoning skills by 4%
What should you ask first?
• What kind of video game was it?
• How many students did you test?
• What is the p-value of that data?

Design principles:
•Practice for integration
•Text & Pictures close together: Contiguity principle
Bringing it Home
•What is the p-value of that data?
They respond that P-value = 0.012
What should you think?
• Hmmm. This data does not sound so good.
•Wow, there is about a 1% chance this finding is due to change. That is great data!

Design principles:
•Practice for integration
•Text & Pictures close together: Contiguity principle
Bringing it Home
They respond that P-value = 0.012
What should you think?
• Hmmm. This data does not sound so good.
•Wow, there is about a 1% chance this finding is due to change. That is great data!

Design principles:
•Encourage metacognitive monitoring by self-checking
Self-Check: Click how you are feeling
Having a hard time with basics
Want to practice
Got it
Averages
Standard Deviation
P-Values