lesson 09 - part 2 - deep foundations 667 geotech design/lesson 09-chapt… · deep foundations...
TRANSCRIPT

Deep FoundationsDeep Foundations
Lesson 9 Lesson 9 -- Topic 2Topic 2Construction Monitoring and Construction Monitoring and
Quality AssuranceQuality Assurance(Section 9.9)(Section 9.9)
Learning OutcomesLearning Outcomes
At the end of this session, the At the end of this session, the participant will be able to:participant will be able to:-- Recall pile driving equipmentRecall pile driving equipment-- Review wave equation analysisReview wave equation analysis-- Assess pile Assess pile driveabilitydriveability

Both the pile and the driving equipment Both the pile and the driving equipment must be sized to permit pile installation must be sized to permit pile installation to the designed geotechnical soil to the designed geotechnical soil resistance without damageresistance without damage
Pile Driving Equipment and Pile Driving Equipment and OperationOperation

Figure 9-37

Figure 9-38


Driving System AnalysisDriving System Analysis
Fundamental pile driving mechanismFundamental pile driving mechanismEN approachEN approachWave equation approachWave equation approach

The Fundamental The Fundamental Pile Driving FormulaPile Driving Formula
shW R
s R hW ResistanceSoilofWorkEnergyHammer
=
==
RR
WW
SS
hh

The EN Bearing GraphThe EN Bearing Graph
R = R = 2W h 2W h s+0.1s+0.1
Safe Load “R”Safe Load “R”
1/8”1/8”
Set “s”Set “s”
WWhh
1/16”1/16” 1/24”1/24” 1/32”1/32”

RR
100 200 300 400100 200 300 400
Blows per FootBlows per Foot
Find Blow CountFind Blow Count
For Given LoadFor Given Load
Limit of Limit of DriveabilityDriveability

Construction Considerations Construction Considerations in Designin Design
Intelligent preparation of plan and Intelligent preparation of plan and specifications can only be done by one specifications can only be done by one who understands the construction who understands the construction operation as well as structural design operation as well as structural design conceptsconcepts

EN Formula Factor of SafetyEN Formula Factor of SafetyTo find F.S. between P and R, revise ENR to be dimensionally correct and compare the resulting equation for P with R
sWHR =
( )s6
WH12/11.0s
WH2P =+
=
P6R =
WH
sR
2 W H(ft)s(in) + 0.1
#=P
Safety Factor = 6Safety Factor = 6
To find F.S. between P and R, revise ENR to be dimensionally correct and compare the resulting equation for P with R
sWHR =
( )s6
WH12/11.0s
WH2P =+
=
P6R =
WH
sR
WH
sR
2 W H(ft)s(in) + 0.1
#=P
Safety Factor = 6Safety Factor = 6

Dynamic Analysis of Pile DrivingDynamic Analysis of Pile Driving

Important Important Driving Driving System System PropertiesProperties

HammerHammer
Impact hammers and vibratory hammersImpact hammers and vibratory hammers-- Numerous manufacturersNumerous manufacturers-- Variations in power source, configurations and Variations in power source, configurations and
rated energyrated energyMechanical efficiency determines percentage Mechanical efficiency determines percentage rated energy transmitted to the pilerated energy transmitted to the pile-- Typical values are 50% for airTypical values are 50% for air--steam, 70% for steam, 70% for
diesel and 90% for hydraulicdiesel and 90% for hydraulicForce wave shape characteristics are Force wave shape characteristics are different for different hammer typesdifferent for different hammer types-- Affects pile stress and pile penetrationAffects pile stress and pile penetration

Pile and AppurtenancesPile and Appurtenances(Cushions, Helmets, etc.)(Cushions, Helmets, etc.)
Stiffness of appurtenances (e.g., hammer Stiffness of appurtenances (e.g., hammer cushion) = AE/tcushion) = AE/t-- Major effect on blow count and stress transfer to Major effect on blow count and stress transfer to
the pilethe pile-- Must not degrade during driving resulting in Must not degrade during driving resulting in
decreasing blow count and increasing pile stressdecreasing blow count and increasing pile stressCrossCross--sectional area of pile is major factor in sectional area of pile is major factor in driveabilitydriveability-- The hammer energy is absorbed in strain rather The hammer energy is absorbed in strain rather
than performing work (i.e., penetrating pile) for than performing work (i.e., penetrating pile) for long piles with small long piles with small c/sc/s areaarea

SoilSoil
SetupSetupRelaxationRelaxation
Important soil propertiesImportant soil properties-- QuakeQuake-- DampingDamping
Total soil resistance to be overcome Total soil resistance to be overcome during driving to estimated lengthduring driving to estimated length

Wave Equation MethodologyWave Equation Methodology

1. Soil model and ultimate capacity assumed.
2. Analysis set in motion by selecting hammer efficiency.
3. Impact velocity of hammer mass elements calculated from efficiency.
4. For each time step, the acceleration, velocity, force, and displacement for each element and the pile toe are calculated based on force equilibrium (F = ma).
5. Process continues until pile toe rebounds.
6. Final set calculated for capacity.
Analysis ProcedureAnalysis Procedure
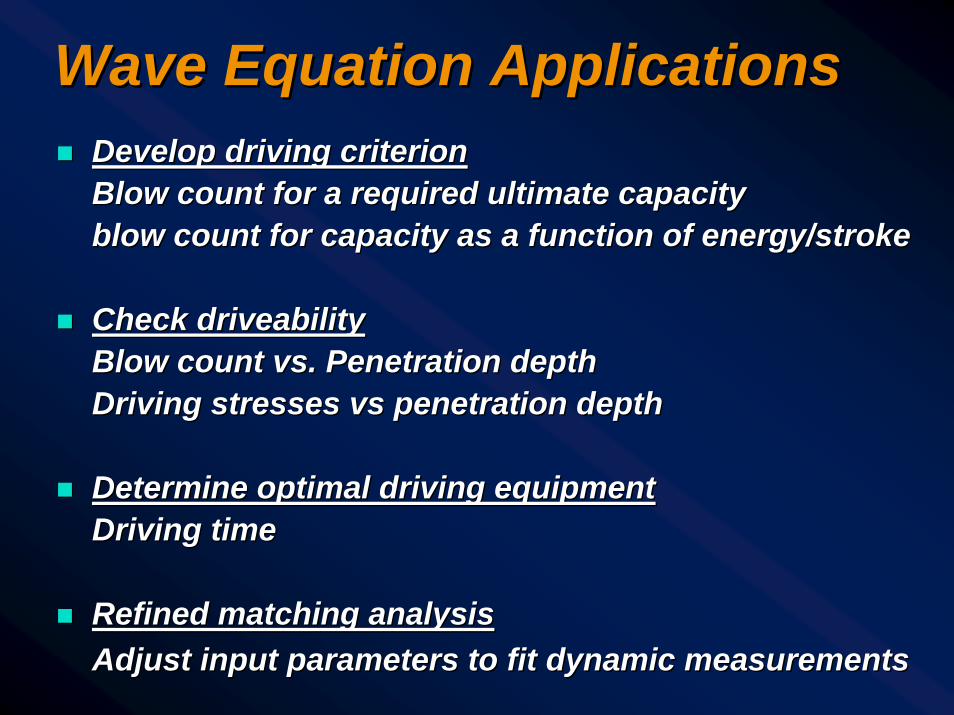
Develop driving criterionDevelop driving criterionBlow count for a required ultimate capacity Blow count for a required ultimate capacity blow count for capacity as a function of energy/strokeblow count for capacity as a function of energy/stroke
Check Check driveabilitydriveabilityBlow count vs. Penetration depthBlow count vs. Penetration depthDriving stresses Driving stresses vsvs penetration depthpenetration depth
Determine optimal driving equipmentDetermine optimal driving equipmentDriving timeDriving time
Refined matching analysisRefined matching analysisAdjust input parameters to fit dynamic measurementsAdjust input parameters to fit dynamic measurements
Wave Equation ApplicationsWave Equation Applications

IMPORTANT NOTESIMPORTANT NOTES
The wave equation analysis CANNOT The wave equation analysis CANNOT determine pile lengthdetermine pile lengthDoes the method determine capacity?Does the method determine capacity?

HammerHammer-- ModelModel-- Stroke and Stroke ControlStroke and Stroke Control-- Any ModificationsAny Modifications
Driving SystemDriving System-- Helmet Weight (including Striker Plate & Cushions)Helmet Weight (including Striker Plate & Cushions)-- Hammer Cushion Material (E, A, t, Hammer Cushion Material (E, A, t, eerr))-- Pile Cushion Material (E, A, t, Pile Cushion Material (E, A, t, eerr))
Input to Wave Equation AnalysisInput to Wave Equation Analysis

Pile Pile -- Length,Length,-- Cross Sectional AreaCross Sectional Area-- Taper or Other NonTaper or Other Non--uniformitiesuniformities-- Specific WeightSpecific Weight-- Splice DetailsSplice Details-- Design LoadDesign Load-- Ultimate CapacityUltimate Capacity-- Pile Toe ProtectionPile Toe Protection
Input to Wave Equation AnalysisInput to Wave Equation Analysis

Input to Wave Equation AnalysisInput to Wave Equation Analysis
SoilSoil-- Boring Locations with ElevationsBoring Locations with Elevations-- Soil DescriptionsSoil Descriptions-- NN--values or Other Strength Parameters values or Other Strength Parameters vsvs DepthDepth-- Elevation of ExcavationElevation of Excavation-- Elevation of Pile CutElevation of Pile Cut--offoff-- Elevation of Water TableElevation of Water Table-- Scour Depth or Other Later ExcavationsScour Depth or Other Later Excavations

Pile Pile Driving Driving
and and Equipment Equipment Data FormData Form
Contract No.: Structure Name and/or No.: Pro ject:
Pile Dr iving Contractor or Subcontractor: County:
(Pi les driv en by)
Manufacturer: Model No.: Ham mer Type: Serial No.: Manufacturers Max imum Rated Energy: (ft-lbs)
Hammer Stroke at Max imum Rated Energy: (ft)Range in Operating Energy: to (ft-lbs)Range in Operating Stroke: to (ft)Ram W eight: (kips)Modific ations:
Striker Weight: (kips) Diam eter: (in)Plate Thickness: (in)
Material #1 Material #2(for Composi te Cushion)
Nam e: Name: Hammer Area: (in2) Area: ( in2)Cushion Thickness/Plate: (in) Thickness /Plate: (in)
No. of Plates: No. of Plates: Tota l Thickness of Hamm er Cushion:
Helmet(Drive Head) Weight: (kips)
Pile Material: Cushion Area: (in2) Thickness /Sheet: (in)
No. of Sheets: Tota l Thickness of Pile Cus hion: ( in)
Pile Type: Wal l Thickness: ( in) Taper : Cross Sectional Area: ( in2) Weight/Ft:
PileOrdered Length: ( ft)Design Load: (kips)Ultim ate Pile Capacity: (kips)
Descr iption of Splice:
Driv ing Shoe/Closure Plate Description:
Subm itted By: Date: Telephone No.: Fax No.: Telephone No.: Fax No.:
Ram
Anvil

Output from Wave Equation Output from Wave Equation AnalysisAnalysis
For a given hammer, driving system, For a given hammer, driving system, pile and soil model combination, the pile and soil model combination, the WEA output includes the following:WEA output includes the following:-- Predicted blow countPredicted blow count-- Pile stressesPile stresses-- Delivered hammer energyDelivered hammer energy

Example Output from Wave Example Output from Wave Equation AnalysisEquation Analysis
Output is usually plotted for interpretationOutput is usually plotted for interpretation
WAVE EQUATION SUMMARY
Rult Kips
Blow Count BPF
Stroke Ft.
Tensile Stress
Ksi
Compressive Stress Ksi
Transfer Energy Ft-Kip
35.0 7 3.27 -0.73 1.68 13.6 80.0 16 3.27 -0.32 1.71 13.6 140.0 30 3.27 -0.20 1.73 13.0 160.0 35 3.27 -0.14 1.73 13.0 195.0 49 3.27 -0.00 1.75 12.8 225.0 63 3.27 0.0 1.96 12.7 280.0 119 3.27 0.0 2.34 12.6 350.0 841 3.27 0.0 2.75 12.5
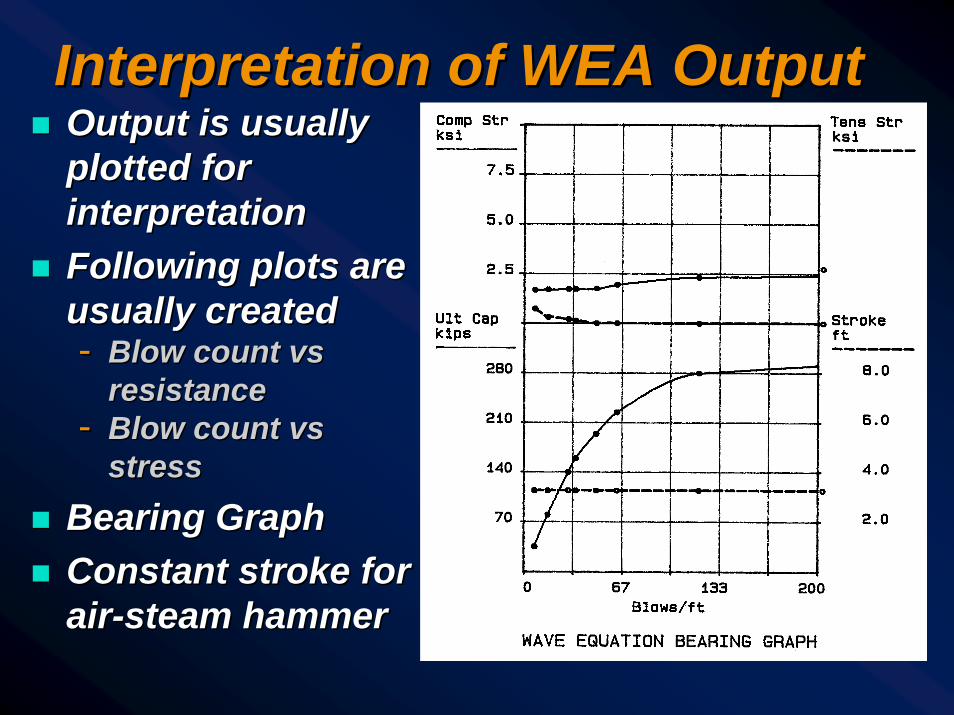
Interpretation of WEA OutputInterpretation of WEA OutputOutput is usually Output is usually plotted for plotted for interpretationinterpretationFollowing plots are Following plots are usually createdusually created-- Blow count Blow count vsvs
resistanceresistance-- Blow count Blow count vsvs
stressstressBearing GraphBearing GraphConstant stroke for Constant stroke for airair--steam hammersteam hammer

Diesel Hammer at Constant Diesel Hammer at Constant StrokeStroke
0
Ru , Kips
300
200
100
5 10 15 20
d e f
8.0 6.5
5.0
Ru =180 Kips
Stroke (ft)
0
Ru , Kips
300
200
100
5 10 15 20
d e f
8.0 6.5
5.0
Ru =180 Kips
Stroke (ft)

0
Stroke ft
BPI (b)
5 10 15 20
d’
e’
f’
Ru = 180 Kips
3
4
5
6
7
8
9
0
Stroke ft
BPI (b)
5 10 15 20
d’
e’
f’
Ru = 180 Kips
3
4
5
6
7
8
9
Variable Stroke Variable Stroke –– Diesel HammerDiesel Hammer

Driving StressesDriving Stresses
In almost all cases, the highest stress In almost all cases, the highest stress levels in a pile occur during pile drivinglevels in a pile occur during pile drivingHigh driving stresses are necessary to High driving stresses are necessary to achieve pile penetrationachieve pile penetrationWEA can predict driving stressesWEA can predict driving stressesCompare predicted stresses to safe Compare predicted stresses to safe stress levelsstress levelsTable 9Table 9--1010

General Criteria for Pile General Criteria for Pile DriveabilityDriveability
Acceptable driving stressesAcceptable driving stresses-- Table 9Table 9--1010
Hammer blows between 30 to 144 Hammer blows between 30 to 144 bpfbpffor friction piles and higher blows of for friction piles and higher blows of short duration for end bearing pilesshort duration for end bearing piles

Example 9Example 9--44Example: Determine If The 14” Square Concrete Pile Can Be Driven To A Driving Capacity Of 225 Kips By Using The Wave Equation Output Summary. Assume The Concrete Compressive Strength Is 4000 psi And The Pile Prestress Force Is 700 psi.
WAVE EQUATION OUTPUT SUMMARY
Rult Kips
Blow Count BPF
Stroke Ft.
Tensile Stress
Ksi
Compressive Stress Ksi
35.0 7 3.27 -0.73 1.68 80.0 16 3.27 -0.32 1.71 140.0 30 3.27 -0.20 1.73 160.0 35 3.27 -0.14 1.73 195.0 49 3.27 -0.00 1.75 225.0 63 3.27 0.0 1.96 280.0 119 3.27 0.0 2.34 350.0 841 3.27 0.0 2.75

SolutionSolution
Acceptable Acceptable driveabilitydriveability depends on depends on achieving the hammer blows between achieving the hammer blows between 30 and 144 30 and 144 bpfbpf as the driving resistance as the driving resistance and allowable compressive and tensile and allowable compressive and tensile stresses are not exceededstresses are not exceededAt At RRultult = 225 kips, blow count = 63 = 225 kips, blow count = 63 bpfbpf-- Between 30 and 144 Between 30 and 144 bpfbpf-- OkayOkay

SolutionSolution
Based on Table 9Based on Table 9--1010Allowable compressive stressAllowable compressive stress
Maximum compressive stress from Maximum compressive stress from WEA = 1.96 WEA = 1.96 ksiksi = 1,960 = 1,960 psipsi < 2,700 < 2,700 psipsi-- OkayOkay
0.85 f'c - fpe = 3400 – 700 = 2700 psi

SolutionSolution
Based on Table 9Based on Table 9--1010Allowable tensile stressAllowable tensile stress
Maximum tensile stress from WEA = Maximum tensile stress from WEA = 0.730 0.730 ksiksi = 730 = 730 psipsi < 890 < 890 psipsi-- OkayOkay
Analyzed driving system is approvedAnalyzed driving system is approved
3 (f'c )1/2 +fpe = 190 + 760 = 890 psi

120
100806040
20
020
40
60
80
100
120
Res
ista
nce
- Ton
s
Blow Per Foot
Wave Equation Pile Length 40’
Pile Length 80’
Pile Length 120’
Engineering News Formula All Lengths

Student Exercise 8Student Exercise 8
The soil profile shows the calculated driving The soil profile shows the calculated driving resistance in each soil layer at each footing resistance in each soil layer at each footing for the proposed 12” diameter steel pipe for the proposed 12” diameter steel pipe piles (piles (fyfy=36 =36 ksiksi). Using maximum driving ). Using maximum driving resistance at any footing, find the anticipated resistance at any footing, find the anticipated maxiumummaxiumum driving stress and blow count driving stress and blow count from wave equation summaries shown for 3 from wave equation summaries shown for 3 pile sizes. Compare these values to the pile sizes. Compare these values to the recommended friction piles values for blow recommended friction piles values for blow count and driving stress to determine count and driving stress to determine minimum acceptable pile wall thickness for minimum acceptable pile wall thickness for the pipe piles at this sitethe pipe piles at this site
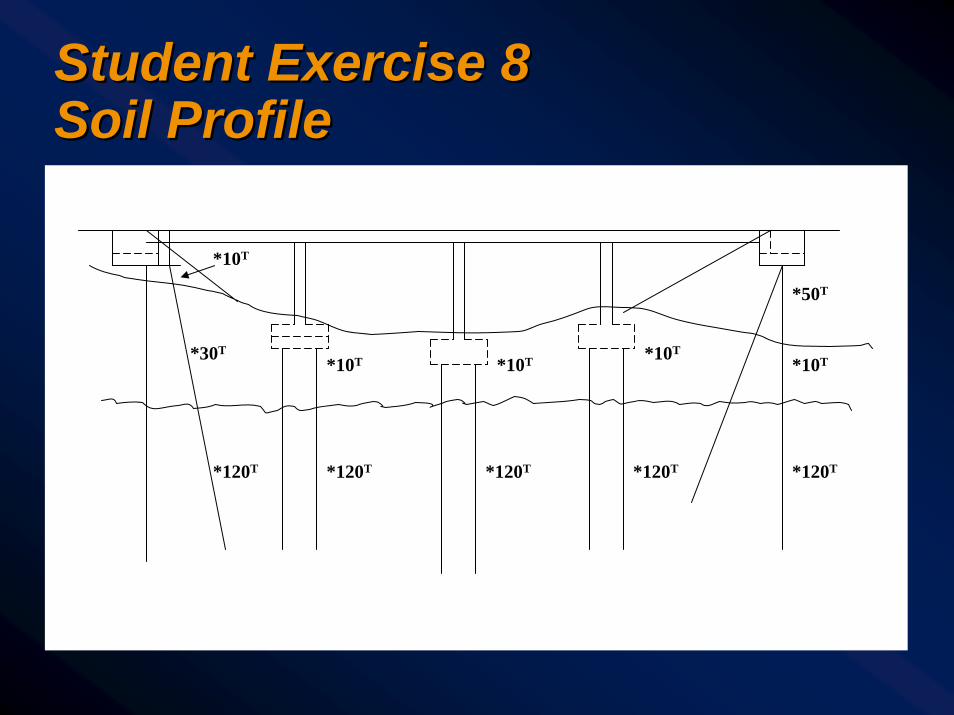
Student Exercise 8Student Exercise 8Soil ProfileSoil Profile
*10T
*50T
*10T*10T*10T*10T*30T
*120T*120T*120T*120T*120T

Student Exercise 8 Student Exercise 8 -- Summaries Summaries GRLWEAP S & F STUDENT EXERCISE 0.250″ WALL THICKNESS
Rult Kips Bl Ct bpf Stroke (eq.Ft)
Min str. ksi Max str.ksi
Enthru kip-ft
260.0 35.3 3.25 -0.85 36.34 14.8360.0 111.8 3.25 -0.98 42.07 13.8
GRLWEAP S & F STUDENT EXERCISE 0.312″ WALL THICKNESS
Rult Kips Bl Ct bpf Stroke (eq.Ft)
Min str. ksi Max str.ksi
Enthru kip-ft
260.0 31.8 3.25 -0.68 28.58 15.1360.0 72.9 3.25 -0.70 35.98 14.2
GRLWEAP S & F STUDENT EXERCISE 0.375″ WALL THICKNESS
Rult Kips Bl Ct bpf Stroke (eq.Ft)
Min str. ksi Max str.ksi
Enthru kip-ft
260.0 30.2 3.25 -0.45 24.67 15.2360.0 58.8 3.25 -0.95 30.47 14.5

Student Exercise 8 Student Exercise 8 -- SolutionSolution
Select Pile 3, 0.375″ Wall Thickness,Which meets both the Blow Count andStress Criteria.
Pile 1: 0.250″ wall thickness (9.77 in2) Maximum Stress 42 Blow Count 112 Pile 2: 0.312″ wall thickness (12.19 in2) Maximum Stress 36 Blow Count 73 Pile 3: 0.375″ wall thickness (14.60 in2) Maximum Stress 30.4 Blow Count 59
OK N.G.

Student Student Exercise 9Exercise 9--Hammer Hammer ApprovalApproval
Pile Design Pile Design capacity = 115kcapacity = 115kPile Driving Pile Driving resistance = 300k resistance = 300k Should you Should you accept the accept the hammer? hammer?

Student Exercise 9Student Exercise 9WEA OutputWEA Output

Student Exercise 9Student Exercise 9Plots of WEA OutputPlots of WEA Output

Student Exercise 9Student Exercise 9Solution SummarySolution Summary
Acceptable Driving Stresses: Maximum Compressive Stress = (0.85 × 5,000 psi) –700 psi = 3,550 psi Maximum Tensile Stress = (3 × √5,000 psi) + 700 psi =912 psi Acceptable Blow Count Range: 30-144 blows/foot Wave Equation Results: 300 Kips Driving Resistance Max (compressive) stress = 1.9 ksi = 1,900 psi < 3,550 psi okay Min (tensile) stress = -0.28 ksi = -280 psi < -912 psi okay Blow Count = 47 bpf between 30 & 144 bpf okay HAMMER APPROVED

Learning OutcomesLearning Outcomes
At the end of this session, the At the end of this session, the participant will be able to:participant will be able to:-- Recall pile driving equipmentRecall pile driving equipment-- Review wave equation analysisReview wave equation analysis-- Assess pile Assess pile driveabilitydriveability

Any Questions?Any Questions?
THE ROAD TOUNDERSTANDING
SOILSAND
FOUNDATIONS