lesotho ndso supply chain analysis - world...
TRANSCRIPT
Lesotho NDSO Supply Chain Lesotho NDSO Supply Chain AnalysisAnalysis
Impacting public health through Supply Chain Improvements

AgendaAgenda
�� Introduction:Introduction:◦◦ Supply chain definedSupply chain defined◦◦ LesothoLesotho statsstats◦◦ Scope of the assignmentScope of the assignment
�� MethodologyMethodology◦◦ Data collection, analysis and data sourcesData collection, analysis and data sources◦◦ Data collection, analysis and data sourcesData collection, analysis and data sources◦◦ Supply andSupply and DemandDemand◦◦ Strategic network analysisStrategic network analysis◦◦ Inventory and Variability Analysis Inventory and Variability Analysis ◦◦ SupplySupply Chain Finance Process MappingChain Finance Process Mapping
�� Summary and recommendationsSummary and recommendations
�� Next StepsNext Steps

SupplySupply Chain Project: Process Chain Project: Process MappingMapping
Visualize Analyze Optimize
A Miracle Occurs
Success!
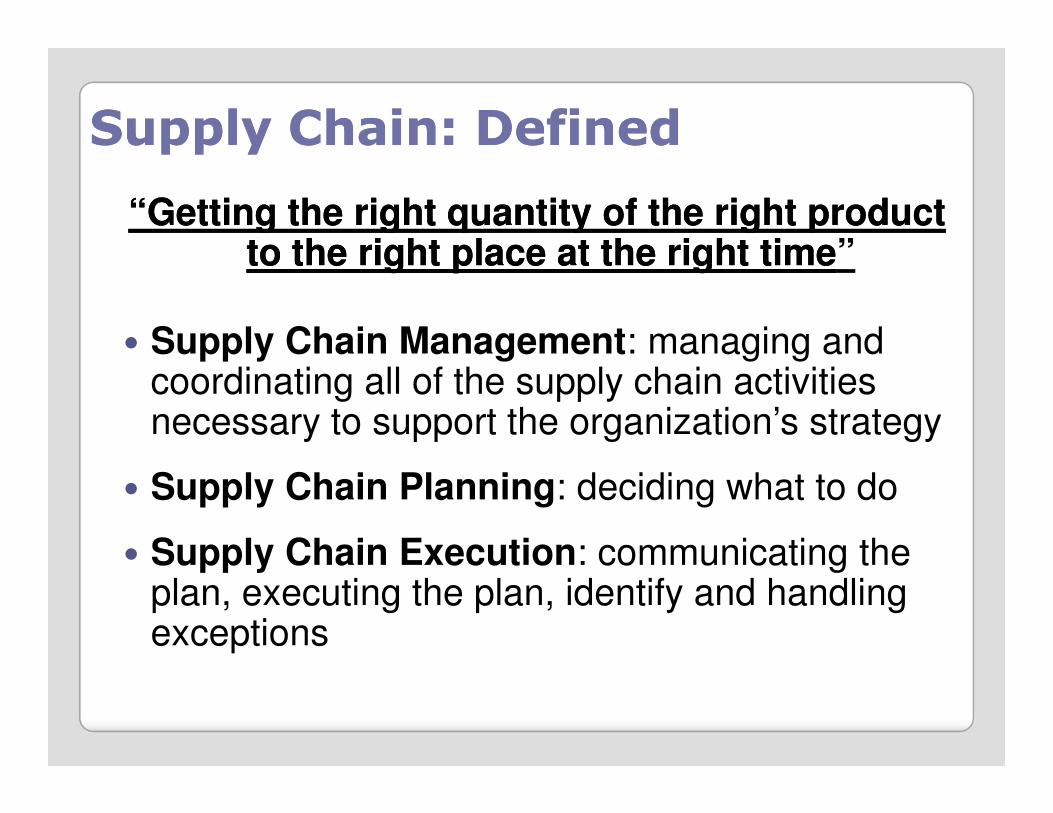
Supply Chain: DefinedSupply Chain: Defined
“Getting the right quantity of the right product “Getting the right quantity of the right product to the right place at the right timeto the right place at the right time”
� Supply Chain Management: managing and coordinating all of the supply chain activities necessary to support the organization’s strategynecessary to support the organization’s strategy
� Supply Chain Planning: deciding what to do
� Supply Chain Execution: communicating the plan, executing the plan, identify and handling exceptions

Supply Chain PlanningSupply Chain Planning
� Operational: day to day operations (loading
trucks, placing replenishment orders, creating pick lists)
� Tactical: week to week / month to month orders (when
do we build up supplies, should we push or pull, how
much transportation capacity is needed, what much transportation capacity is needed, what
warehouse locator system to use)
� Strategic: longer time frames, a year or more (focus on
how is the network structured, where are the facilities)

Supply Chain Activities: Public Supply Chain Activities: Public HealthHealth
� Product Selection� Forecasting� Procurement and sourcing� Manufacturing� Warehousing� Warehousing� Inventory� Transportation� Order (Demand) Management� Finance
Population

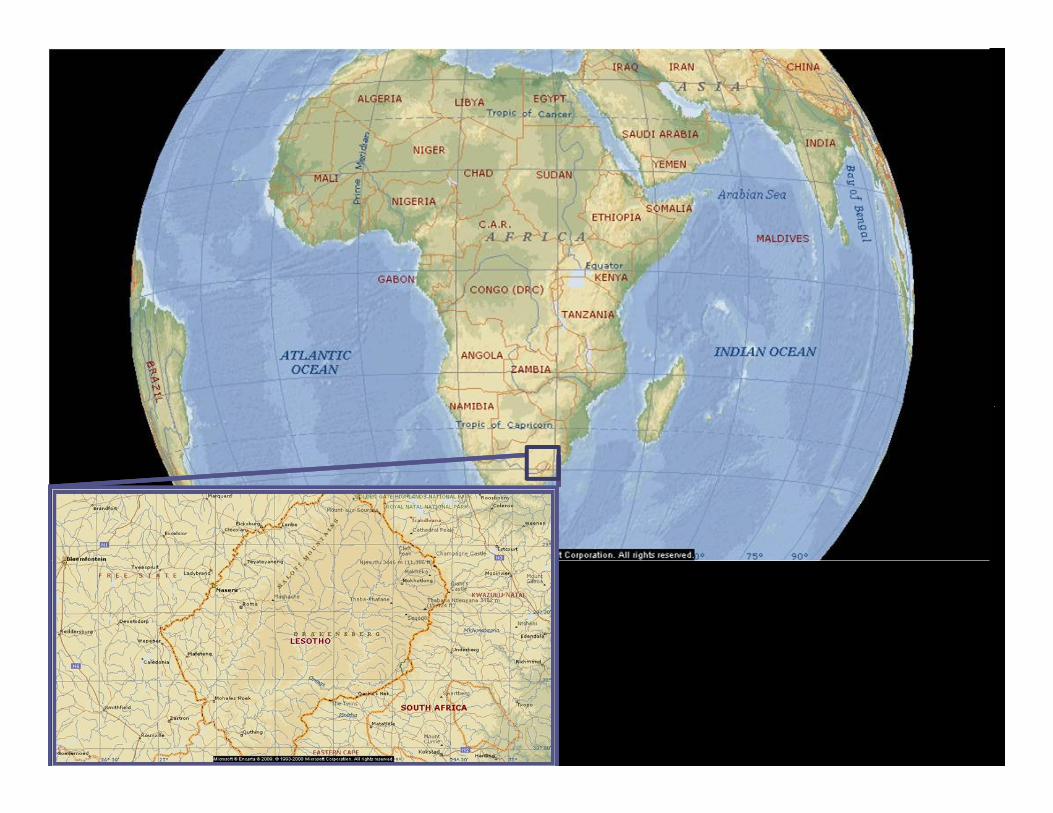
Basic FactsBasic Facts
� Kingdom of Lesotho
� Population: 2.1 Million
� Population growth rate: 0.13%
� Life expectancy: 40.2 years� Life expectancy: 40.2 years◦ Female: 39.3 years
◦ Male: 41 years
� Infant mortality rate: 79 deaths per 1,000 live births

Current Distribution NetworkCurrent Distribution Network
� Current network is formally a “Hybrid”◦ Most items are supplied to major customers directly from NDSO in Mafeteng
◦ Health centers are supplied through DHMTs

Current Network FinancialsCurrent Network Financials
Supply Chain Costs by
Function FY2006 FY2007 FY2008
Customer Response 440,220 548,519 822,478
Inventory Planning and
Management 432,671 371,724 561,010
Supply (Procurement) 291,552 335,010 536,775
Transport 1,110,466 1,229,322 2,046,263
Warehouse 2,155,886 2,279,090 3,880,304 5,000,000
6,000,000
7,000,000 Customer Response
Inventory Planning and Warehouse 2,155,886 2,279,090 3,880,304
Admin 1,613,923 3,474,831 6,555,531
Total 6,044,716 8,238,497 14,402,360
Supply Chain Costs by
Function FY2006 FY2007 FY2008
Customer Response 7% 7% 6%
Inventory Planning and
Management 7% 5% 4%
Supply (Procurement) 5% 4% 4%
Transport 18% 15% 14%
Warehouse 36% 28% 27%
Admin 27% 42% 46%
100% 100% 100%
-
1,000,000
2,000,000
3,000,000
4,000,000
FY2006 FY2007 FY2008
Planning and ManagementSupply (Procurement)
Transport
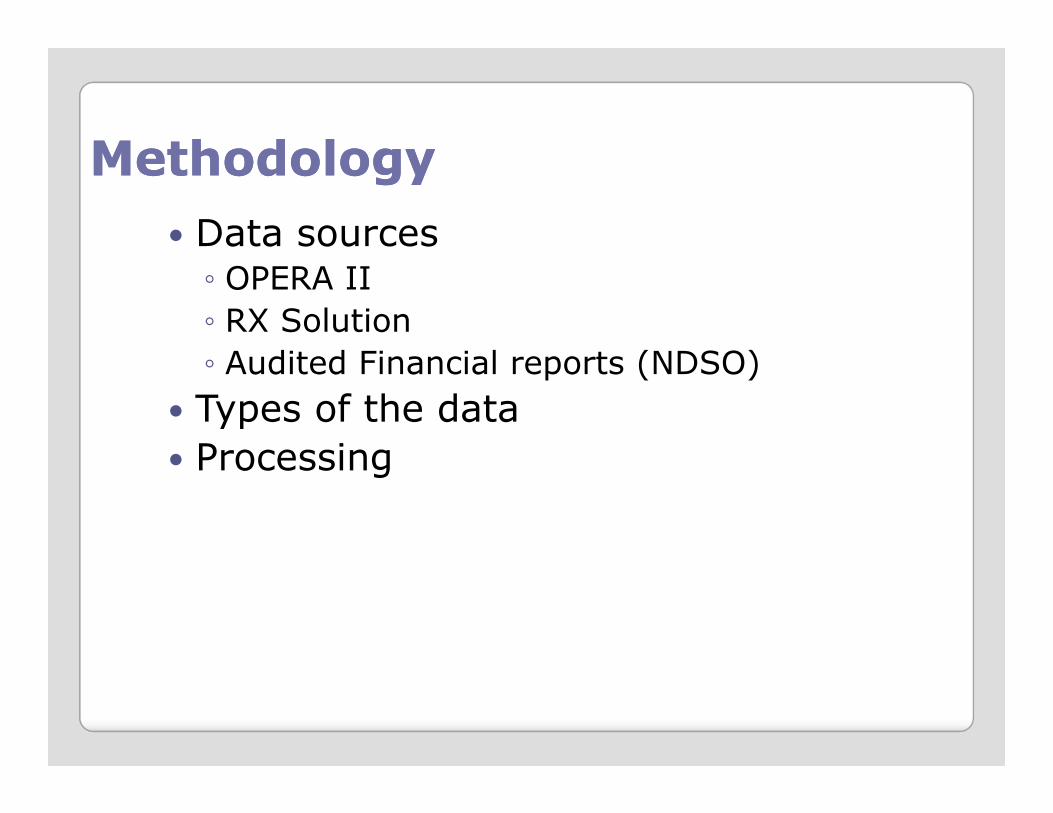
MethodologyMethodology
� Data sources◦ OPERA II
◦ RX Solution
◦ Audited Financial reports (NDSO)
� Types of the data� Types of the data
� Processing

Data Sources: Opera IIData Sources: Opera II� Opera II was in use as the NDSO basic InventoryMgmt System from Oct 2004 thru Oct 2008
� Discontinued and replaced by Rx Solution� Data was recovered from backup, processed and combined into a single analytical database
� Opera Database contains detailed transaction data suitable for logistics analysis◦ Supplier and demand information◦ Supplier and demand information◦ Outbound shipments◦ Inbound receipts◦ Invoice Information
� Product Information: Price, Cost, Qty Ordered, Qty Shipped, Date Ordered Rcvd, Date Shipped
� Master Products and Customer data is similar to current Rx Solutions data, but not exactly. Could be combined into a single database with manual work.

Data Sources: Rx SolutionData Sources: Rx Solution
� SQL Server database with customized front end� Replaced Opera II as Inventory Mgmt System in Oct 2008
� Data was easy to retrieve from most recent backup, contains 4 months of detailed shipment and receipt data, master data, etc.Team extracted relevant supply chain data in and receipt data, master data, etc.
� Team extracted relevant supply chain data in incorporated into a second supply chain analysis database
� Analytical Data Approach:◦ For Supply Chain Analysis, focus on utilizing Opera II data due to length of time available
◦ Incorporate Rx Solution Data to check trends, improve future predictions

FinancialsFinancials and Cost Dataand Cost Data
� Income Statements provide high level cost data broken out into major accounts
� Developed rough cut supply chain costs for use in models as basic cost/budgeting capabilitycapability
� Use either Qty or Value basis for allocating costs
� Only used for basic structural comparisons and high level supply chain related financial projections
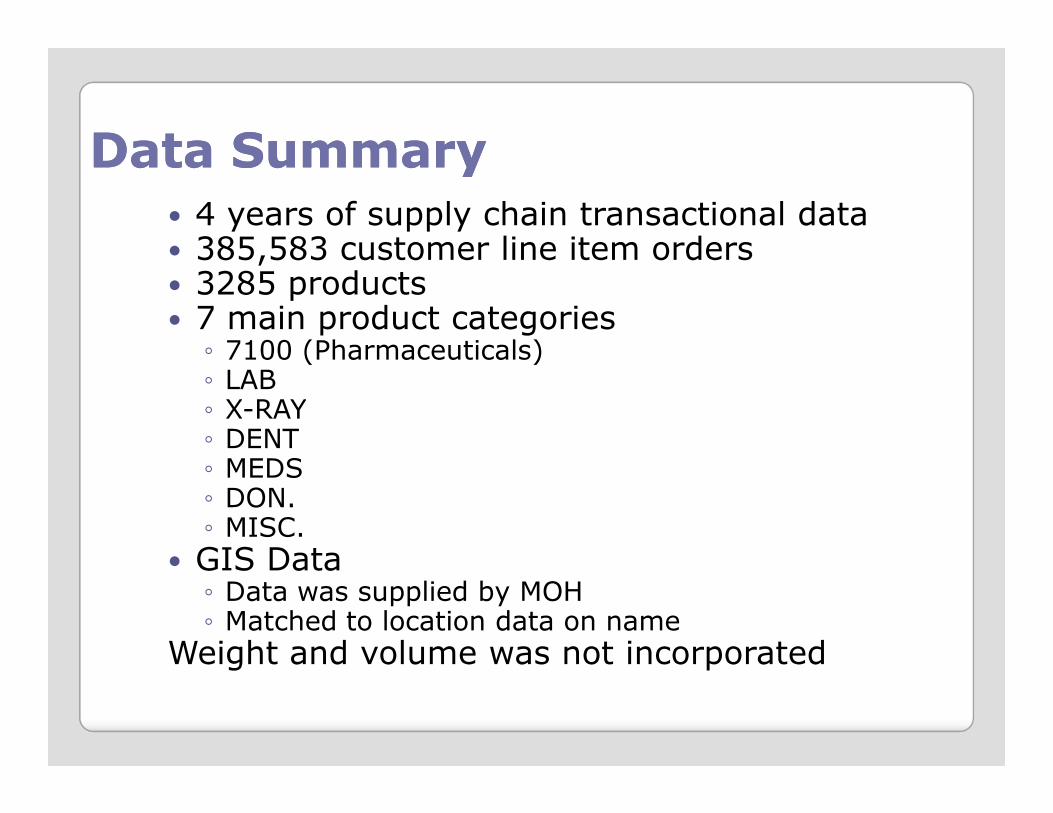
Data SummaryData Summary� 4 years of supply chain transactional data� 385,583 customer line item orders� 3285 products� 7 main product categories
◦ 7100 (Pharmaceuticals)◦ LAB◦ X-RAY◦ X-RAY◦ DENT◦ MEDS◦ DON.◦ MISC.
� GIS Data◦ Data was supplied by MOH◦ Matched to location data on name
Weight and volume was not incorporated

Supply Chain Analysis: Supply and Supply Chain Analysis: Supply and DemandDemandDemandDemand

Throughput Throughput QtysQtys 20042004--20082008
1000000
1500000
2000000
2500000
3000000
EQUIP.
X-RAY
MISC.
MEDS
LAB
DON.
DENT
2004 2005 2006 2007 2008 (est)
7100 365302 1305479 1970184 2254598 2438030.4
DENT 179 1123 1429 869 12606
DON. 47955 125994 147338 151695 121134
LAB 2268 4654 4638 11307 27367.2
MEDS 69466 217354 282738 272527 238941.6
MISC. 76609 160872 67343 58812 89390.4
X-RAY 355 1750 2488 1767 2092.8
EQUIP. 300 12273.6
TOTAL 562134 1817226 2476158 2751875 2941836
0
500000
2004 2005 2006 2007 2008
(est)
DENT
PHARMS

Throughput Value 2004Throughput Value 2004--20082008
6,000,000,000
8,000,000,000
10,000,000,000
12,000,000,000
14,000,000,000
16,000,000,000
Annual Product Volume/Value (2004-2008)
X-RAY
MISC
MEDS
LAB
DON.
0
2,000,000,000
4,000,000,000
2004 2005 2006 2007 2008 (est)
DON.
DENT
PHARMS
YEAR TOTAL (Maloti)
2004 4,678,721,303
2005 14,317,393,994
2006 15,756,775,142
2007 15,859,071,020
2008 (est) 11,891,036,256
Note: all 2008 (est) values are estimated using 10 months actual 2008 data extrapolated to 12 months

ProductProduct Type Mix Value 2004Type Mix Value 2004--20082008
0%1% 4%
13%
3% 1%
Total Shipped Value
PHARMA DENT DON. LAB MEDS MISC. X-RAY
78%
0%1%

*Fill Rate is Ordered Qty filled within 0 or 1 days divided by total Ordered Qty. 10%
20%
30%
40%
50%
60%
70%
80%
90%
100%
22%28%
15%
27%22%
18%11%
95%
72%
20%19%24%
94%
28%
17%
34%
15%19%
93%
29%
Qty Fill Rate
Average Fill Rate* for all Pharma Products = 37.1%
Total Fill Rates by Product Type (Top 20)Total Fill Rates by Product Type (Top 20)
Qty.0%
10%

Comparison to NDSO Service Comparison to NDSO Service RatesRates� NDSO calculations indicate a 75% service rate
◦ Rate calculated based on the percentage of order quantities available within one week of order
◦ Orders in the system with a received date but no ship date all assumed to be “cancelled” thus they do not count against service
� Follow-up analysis by WB team confirms 75% service according to this definitionservice according to this definition◦ Definition of acceptable service should be strategized◦ Confirmation that no “cancelled” orders were actually unmet demand is necessary
◦ Cancelled orders and unmet demand are suggested to be logged separately to allow for more accurate service calculations

Largest Customers by VolumeLargest Customers by Volume
2009 Supply2009 Supply--Demand Balance Demand Balance AnalysisAnalysis
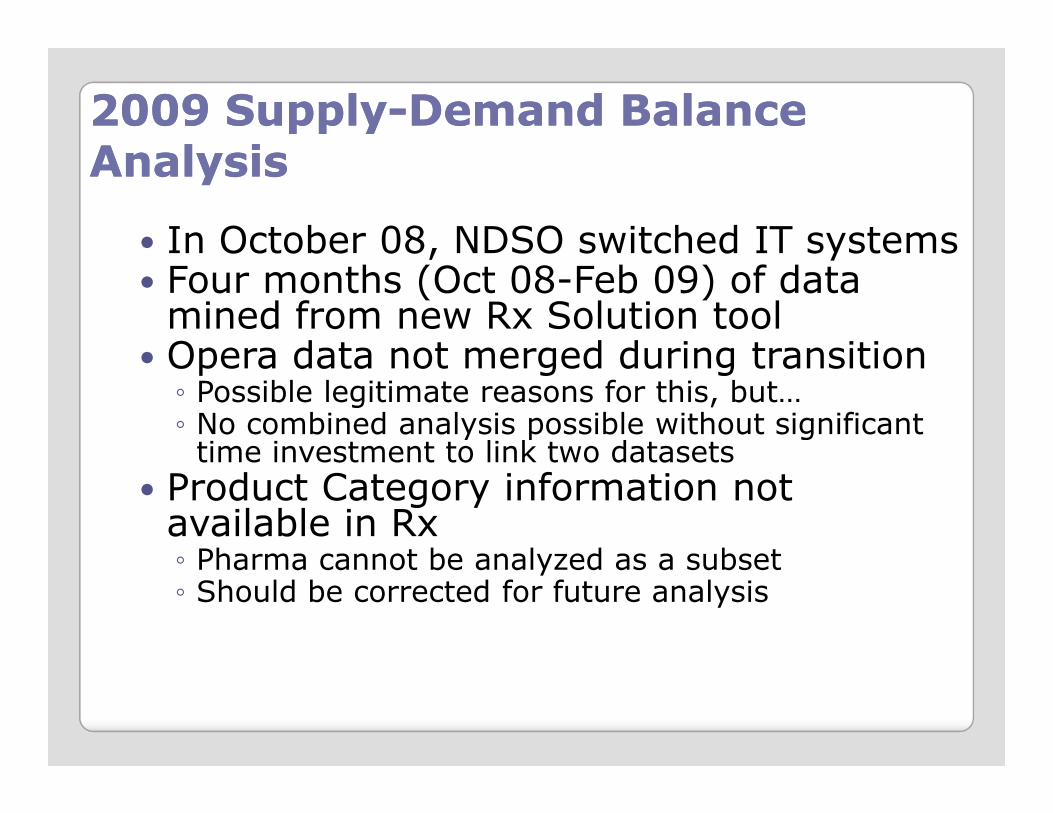
� In October 08, NDSO switched IT systems� Four months (Oct 08-Feb 09) of data mined from new Rx Solution tool
� Opera data not merged during transition◦ Possible legitimate reasons for this, but…◦ No combined analysis possible without significant ◦ Possible legitimate reasons for this, but…◦ No combined analysis possible without significant time investment to link two datasets
� Product Category information not available in Rx◦ Pharma cannot be analyzed as a subset◦ Should be corrected for future analysis

Rx SupplyRx Supply--Demand SnapshotDemand Snapshot
1.20
1.40
1.60
1.80
2.00
Million Units
0.00
0.20
0.40
0.60
0.80
1.00
1.20
Total Quantity Receipts
(units)
Total Quantity Demand
(units)
Million Units
•Demand Quantity – Receipts = 685,000 units•Total Value of 4-month imbalance = 26.5 Million Maloti

Balance for Selected ProductsBalance for Selected Products
20000
30000
40000
50000
60000
70000
80000
RecNum
DemNum
Product Description Received
Units
Demanded
Units
Investment
Requirement
Amoxycillin 125mg/5mL Suspension; 100 mL [PO] 60000 78241 95,721.47
Cotrimoxazole 240mg/5mL Suspension; 100 mL [PO] 41297 66892 103,529.22
Insulin Actraphane 30/70U/mL 10mL Vial; 1 Vial [SC] 7000 15341 276,837.79
Paracetamol 120mg/5mL Syrup; 100 mL [PO] 20000 40381 73,481.66
0
10000
20000
Amoxycillin
125mg/5mL
Suspension; 100
mL [PO]
Cotrimoxazole
240mg/5mL
Suspension; 100
mL [PO]
Insulin
Actraphane
30/70U/mL 10mL
Vial; 1 Vial [SC]
Paracetamol
120mg/5mL
Syrup; 100 mL
[PO]

Supply Chain Analysis: Network Supply Chain Analysis: Network Structure OptimizationStructure OptimizationStructure OptimizationStructure Optimization

Supply Chain Network DesignSupply Chain Network Design� Strategic analysis of network structure
◦ Where are the facilities◦ How does product flow to the customer
� Results largely driven by:◦ Transportation costs◦ Other supply chain costs (warehousing, order entry, sourcing, processing)
◦ Facility fixed operating costs◦ Demand locations and other constraints◦ Demand locations and other constraints
� Does NOT optimize inventory stock locations (where do I hold stock and how much), but does incorporate inventory holding costs
� Sets the structure, next step is to optimize business rules and operating policies◦ Inventory Push vs. Pull◦ Transportation mode selection◦ Sourcing and allocation rules

Baseline (Current System)
DirectDecentralized
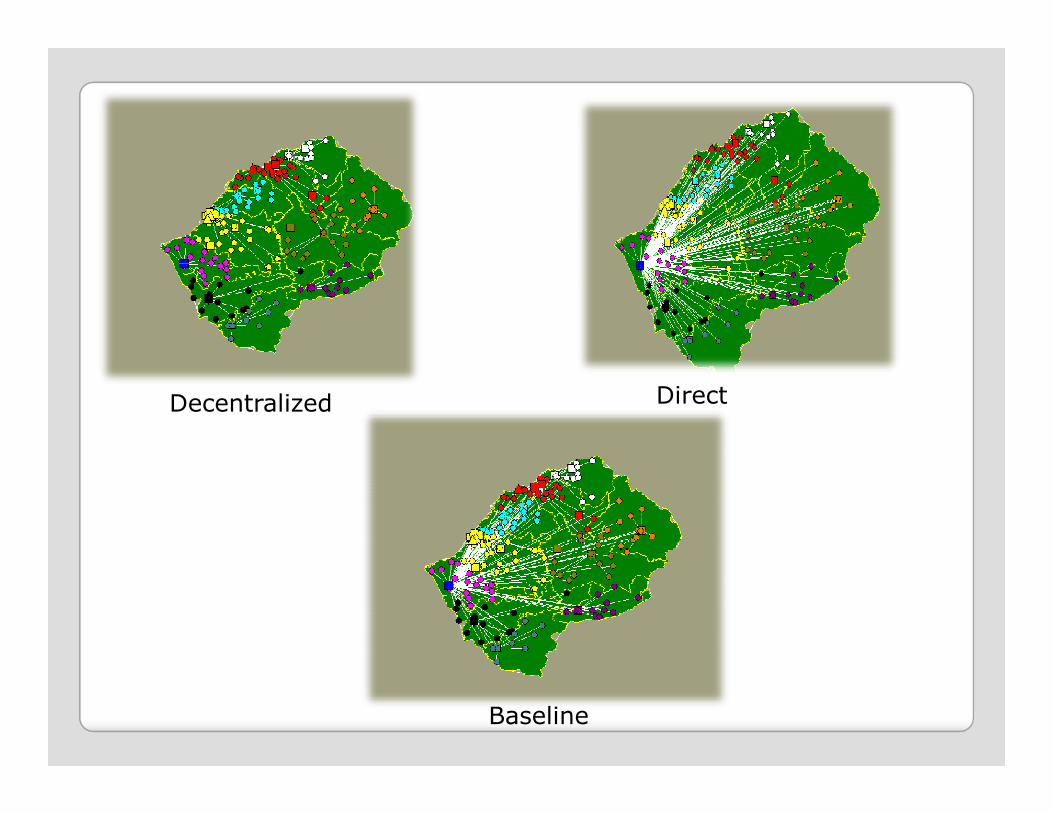
DirectDecentralized Direct
Baseline
Decentralized

3 Alternative Scenarios3 Alternative Scenarios� Baseline: Current approach (hybrid)� Fully decentralized: all must run through DHMTs (not a feasible option, included for comparison only)
� Direct: everything shipped direct from CMS
R 2,200,000.00
R 2,300,000.00
R 2,400,000.00
Annual Transportation Cost
� Summary: 5% decrease in transportation costs by shipping everything direct
� Results assume that all transport costs are distance based and will not change with different flow patterns
R 1,700,000.00
R 1,800,000.00
R 1,900,000.00
R 2,000,000.00
R 2,100,000.00
R 2,200,000.00
Decentralized Baseline Direct
Supply Chain Analysis: Optimizing Supply Chain Analysis: Optimizing Inventory and Improving ServiceInventory and Improving ServiceInventory and Improving ServiceInventory and Improving Service

ExplainExplain IInventory and Variability nventory and Variability AnalysisAnalysis
� Inventory is held to ensure immediate response and availability for customers
� Main causes of higher inventory◦ Demand variability◦ Supplier lead time and variability
� After calculating demand and supply characteristics, select inventory policy and calculate inventory targets to meet desired service target
� Simulation to get visibility into stocking levels

Introduction to InventoryIntroduction to Inventory

Inventory Analysis ApproachInventory Analysis Approach
� Analyze and calculate historic demand variability for PHARMA products
� Analyze and calculate historic lead times and lead time variability for 2004-2008
� Calculate Safety Stock levels and financial inventory investment
� Run Scenarios to Explain◦ Cost and plan to achieve Service Targets (80/95/99)◦ Effect of Lead Time Variability◦ Effect of Reducing Lead Time
� Run Simulations to test out new inventory policies

Supply Lead Time and VariabilitySupply Lead Time and Variability
� Pharma Suppliers have extremely long lead times with high variability◦ Lead Times and StDev range from 30-150+ days!◦ This puts a significant strain on the supply chain as high inventory will be required to meet desired service

Supply Lead Time and VariabilitySupply Lead Time and Variability
� Average Lead Times and Variability differ by product and supplier◦ Supply strategy is an important consideration in the performance of a supply chain

Demand Volumes and VariabilityDemand Volumes and Variability
Top 20 most demanded products from 2004-2008 Opera data

Demand Volumes and VariabilityDemand Volumes and Variability� High Demand variability requires you to hold lots of inventory ◦ If we knew what/when/how much, we’d just order the exact amount in advance
◦ Since we don’t know this, we must hold safety stock
800.00%
900.00%
1000.00%
Ratio of Variability to Average Daily Demand for Top 20 Products
0.00%
100.00%
200.00%
300.00%
400.00%
500.00%
600.00%
700.00%
1005110071101411016110391105011054110761 1155 1527116081 1851 2380 25085 3199 3200 480 500
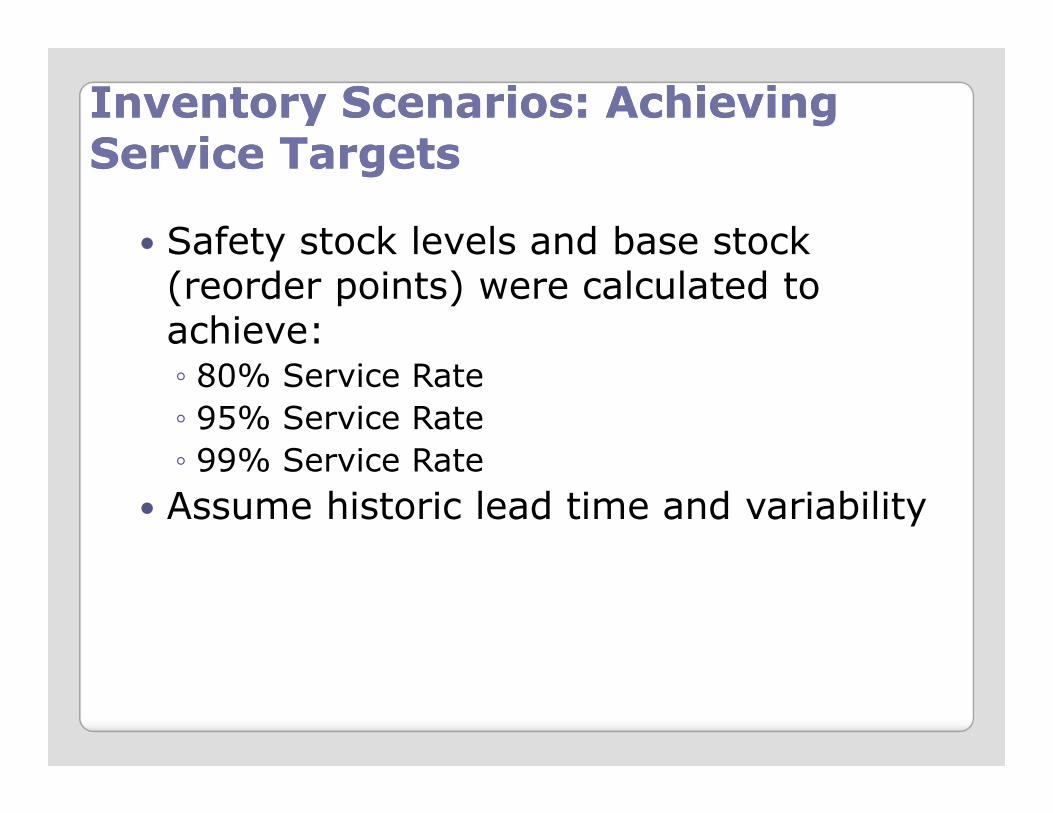
Inventory Scenarios:Inventory Scenarios: Achieving Achieving Service TargetsService Targets
� Safety stock levels and base stock (reorder points) were calculated to achieve:◦ 80% Service Rate
◦ 95% Service Rate◦ 95% Service Rate
◦ 99% Service Rate
� Assume historic lead time and variability

DOS to Achieve DOS to Achieve Service TargetsService Targets
1000
1500
2000
2500
3000
SL80/LTV1.0
0
500SL80/LTV1.0
SL95/LTV1.0
SL99/LTV1.0

Cost Of Inventory Investment Cost Of Inventory Investment (COII) to Achieve Service Targets(COII) to Achieve Service Targets
10,000,000,000
12,000,000,000
14,000,000,000
Cost of Inventory to Achieve Service Targets
To move from 80% to 95% doubles inventory.
To move
-
2,000,000,000
4,000,000,000
6,000,000,000
8,000,000,000
10,000,000,000
80% 95% 99%
To move from 95% to 99% incurs another41% cost increase.

Inventory Scenario:Inventory Scenario: Effect of Effect of Reducing Inventory Lead Time Reducing Inventory Lead Time VariabilityVariability
� Safety stock levels and base stock (reorder points) were calculated if Supplier Lead Time is constant BUT could be made more predictable (reduced be made more predictable (reduced variability)◦ Baseline lead time variability
◦ 50% reduction in variability
◦ Eliminate variability

Effect of Reducing Inventory LeadEffect of Reducing Inventory Lead Time Time Variability on DOSVariability on DOS to Achieve 95% Service Rateto Achieve 95% Service Rate
1000
1500
2000
2500
0
500 SL95/LTV1.0
SL95/LTV0.5
SL95/LTV0.0

Effects of Reducing Supplier Lead Time Effects of Reducing Supplier Lead Time Variability Using Historic Lead Times, 95% Variability Using Historic Lead Times, 95% Service TargetService Target
6,000,000,000
7,000,000,000
8,000,000,000
9,000,000,000
10,000,000,000
-
1,000,000,000
2,000,000,000
3,000,000,000
4,000,000,000
5,000,000,000
6,000,000,000
0%20%40%60%80%100%

Inventory Scenario: Effect of Inventory Scenario: Effect of Reducing SupplierReducing Supplier Lead TimeLead Time
100%, 9,352,
074,812
50%, 6,310,8
100%, 9,352,
074,812 50%, 8,589,9
92,853
Lead Time Variability Lead Time
50%, 6,310,8
02,140
0%, 4,591,50
0,461
0%20%40%60%80%100%

ComparisonComparison ofof Alternative Alternative Approaches to Inventory StrategyApproaches to Inventory Strategy
10,000,000,000
12,000,000,000
14,000,000,000
Total Cost of Inventory
-
2,000,000,000
4,000,000,000
6,000,000,000
8,000,000,000
95% Service
100% Lead
Time Var
95% Service
50% Lead
Time Var
95% Service
0% Lead
Time Var
80% Service
100% Lead
Time Var
99% Service
100% Lead
Time Var
95% Service
50% Lead
Time

Summary and RecommendationsSummary and Recommendations
� Good data is available for supply chain analysis◦ Processed and available for further analysis◦ GIS Locations matched up and included in models
� Concerns for continued data availability◦ Dropped support for product families◦ Very difficult to match new and old naming schemes◦ Other?
Network structure: direct shipment to all facilities � Network structure: direct shipment to all facilities could save money, but more important provide visibility to NDSO to better serve their customers
� structure does not need revision at this time� Historic fill rates are not good
◦ Supplier lead time variability is very high◦ Inventory is not designed to achieve strategic service targets

Summary and Recommendations Summary and Recommendations (continued)(continued)
� Detailed inventory plans have been developed to achieve service targets◦ Inventory target specific by product◦ Cost of safety stock investment
� Supplier lead time variability must get managed down!down!
� Supply-Demand imbalances exist, must be addressed prior to implementing inventory
� What is the “right” demand forecast on aggregate???◦ Historic demand may represent actual need, or may represent diversions and theft
◦ Population should be modeled and total demand forecast, strategic procurement plan developed as a first step