lesmahagow high school experiments with four different gases, a syringe was held vertically as shown...
TRANSCRIPT

HIGHER CHEMISTRY PAST PAPERS 2000 - 2010
1
Lesmahagow High School
Higher Chemistry
Controlling the Rate - Past Paper Homework

HIGHER CHEMISTRY PAST PAPERS 2000 - 2010
2
Rates of reaction 2000
1. Methanoic acid, HCOOH, can break down to carbon monoxide and water by two different
reactions, A and B. Reaction A (catalysed) HCOOH(aq) + H+(aq) CO(g) + H2O(l) + H+(aq) Reaction B (uncatalysed) HCOOH(aq) CO(g) + H2O(l)
(a) (i) What is the evidence in the equation for Reaction A that the H+(aq) ion acts as a catalyst?
1 (ii) Explain whether Reaction A is an example of heterogeneous or homogeneous
catalysis.
1 (b) The energy diagram for the catalysed reaction is:
Draw a line on the diagram to show the reaction pathway for the uncatalysed reaction.
1 (3)

HIGHER CHEMISTRY PAST PAPERS 2000 - 2010
3
2001 2. In experiments with four different gases, a syringe was held vertically as shown with the weight of
the syringe piston applying a downward pressure on the gas. The times taken for 60cm3 of helium, methane, carbon dioxide and butane to escape through the pinhole were measured and the graph shows the results plotted against relative formula mass.
(a) Calculate the average rate of escape from the syringe of 60cm3 of methane, in cm3s-1
1
(b) Name a hydrocarbon gas which would take 56s to escape. 1
(c) The error in a measurement decreases as the actual size of the measurement increases. Suggest one way of reducing the error in each of the time measurements.

HIGHER CHEMISTRY PAST PAPERS 2000 - 2010
4
1
(3)
2001 3. The effect of temperature changes on reaction rate can be studied using the reaction between an
organic acid solution and acidified potassium permanganate solution.
5(COOH)2(aq) + 6H+(aq) + 2MnO4-(aq) 2Mn2+(aq) + 10CO2(g) + 8H2O(l) The apparatus required is shown in the diagram.
(a) Name the organic acid.
1 (b) Describe how the reaction time can be measured.
1
(c) The headings for a set of results are shown below.
Temperature of reaction / ˚C
Reaction time / s Reaction rate /
Complete the headings by entering the correct unit in the third column.
1 (3)

HIGHER CHEMISTRY PAST PAPERS 2000 - 2010
5
2002 4. The decomposition of hydrogen peroxide solution into water and oxygen can be catalysed by an
enzyme.
2H2O2(aq) 2H2O(l) +O2(g) The rate of reaction can be followed by recording the mass loss over a period of time.
(a) The following graph was obtained from experiments to find the effect of pH on the efficiency of the enzyme.
(i) Calculate the average rate of reaction over the first 20 minutes, in g min-1, for the experiment at pH 10.
2 (ii) From the results shown on the graph, what can be concluded about the efficiency of
the enzyme over the pH range used in the experiment?
1
(b) Give one other way of following the rate of this reaction. 1
(4)
HIGHER CHEMISTRY PAST PAPERS 2000 - 2010
6
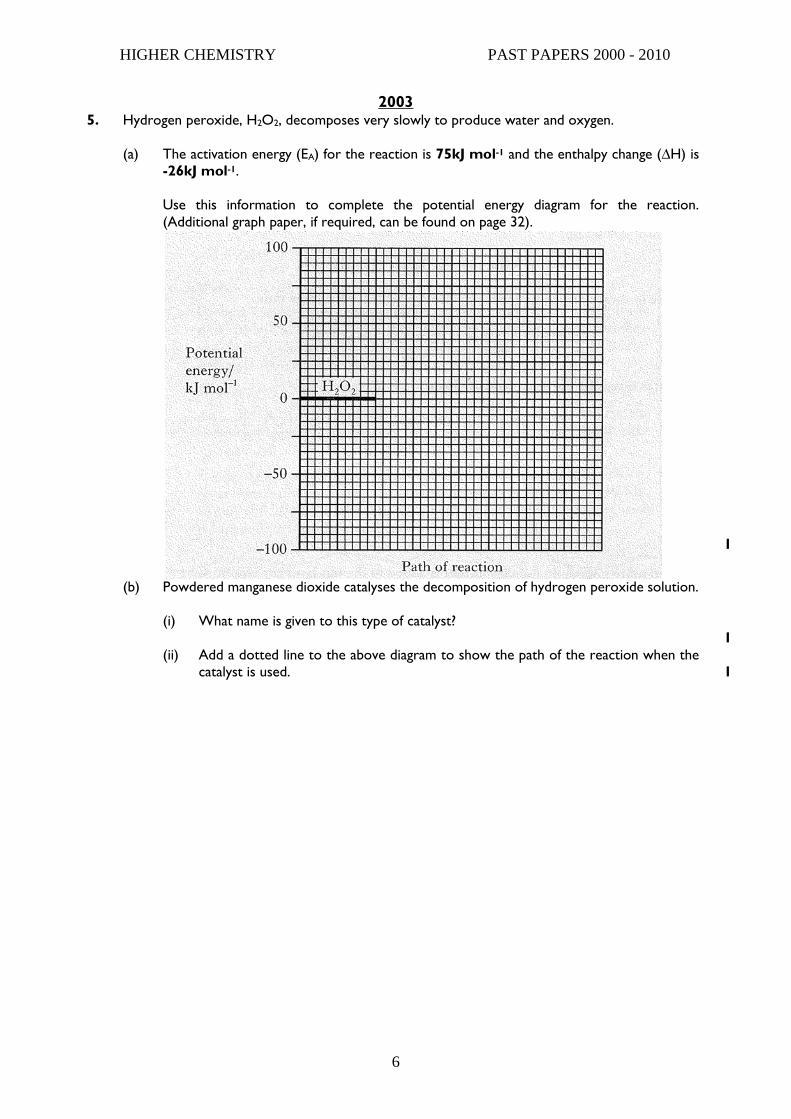
2003 5. Hydrogen peroxide, H2O2, decomposes very slowly to produce water and oxygen.
(a)
The activation energy (EA) for the reaction is 75kJ mol-1 and the enthalpy change (∆H) is -26kJ mol-1. Use this information to complete the potential energy diagram for the reaction. (Additional graph paper, if required, can be found on page 32).
1
(b) Powdered manganese dioxide catalyses the decomposition of hydrogen peroxide solution.
(i) What name is given to this type of catalyst? 1
(ii) Add a dotted line to the above diagram to show the path of the reaction when the catalyst is used.
1

HIGHER CHEMISTRY PAST PAPERS 2000 - 2010
7
(c) The balanced equation for the reaction is:
2H2O2(aq) 2H20(l) + O2(g)
(i) The following graph is obtained for the volume of oxygen released over time.
Calculate the average rate of reaction between 10 and 20 s.
1
(ii) Using information from the above graph, calculate the mass of hydrogen peroxide used in the reaction, assuming all the hydrogen peroxide decomposed. (Take the molar volume of oxygen to be 24 litres mol-1) Show your working clearly
2 (6)

HIGHER CHEMISTRY PAST PAPERS 2000 - 2010
8
2003 6. A student was asked to write a plan of the procedure for an investigation. The entry made in her
laboratory note book is shown.
(a) Why is instruction 4 not the best way of altering the concentration of the potassium iodide solution?
1 (b) State two other ways of improving the student’s plan of this investigation procedure.
1 (2)
2004
7. The effect of temperature on reaction rate can be studied using the reaction between oxalic acid
and acidified potassium permanganate solutions.
(a) What colour change would indicate that the reaction was complete?

HIGHER CHEMISTRY PAST PAPERS 2000 - 2010
9
1 (b) A student’s results are shown on the graph below.
(i) Use the graph to calculate the reaction time, in s, at 40˚C. 1
(ii) Why is it difficult to obtain an accurate reaction time when the reaction is carried out at room temperature?
1
(c) The diagram below shows the energy distribution of molecules in a gas at a particular
temperature.
Draw a second curve on the diagram to show the energy distribution of the molecules in the gas at a higher temperature. Label the diagram to indicate why an increase in temperature has such a significant effect on reaction rate.
1
(4)

HIGHER CHEMISTRY PAST PAPERS 2000 - 2010
10
2005
8. The rate of carbon dioxide production was measured in three laboratory experiments carried out at the same temperature and using excel calcium carbonate.
The curve obtained for Experiment A is shown.
Experiment Acid Calcium Carbonate
A 40cm3 of 0.10 mol 1-1 sulphuric acid
1g lumps
B 40cm3 of 0.10 mol 1-1 sulphuric acid
1g powder
C 40cm3 of 0.10 mol 1-1 hydrochloric acid
1g lumps
(a) Use the graph to calculate the average reaction rate, in cm3s-1, between 10 and 20s 1
(b) Draw curves on the graph to show results that could be obtained for experiments B and C. Label each curve clearly. (Additional graph paper, if required, can be found on page 31.)
2
(c) Draw a labelled diagram of the assembled apparatus which could be used to carry out this experiment.
2
(5)

HIGHER CHEMISTRY PAST PAPERS 2000 - 2010
11
2005 9. The following solution mixtures were used in a series of experiments involving the reaction
between hydrogen peroxide in acid solution and potassium iodide solution.
H2O2(aq) + 2H+(aq) + 2I-(aq) 2H2O(l) + I2(aq)
(a) From the information in the shaded columns in the table above, what variable is being kept constant throughout the series of experiments?
1 (b) What was the aim of the series of experiments?
1 (c) Calculate the time, in seconds, for the reaction in Experiment A.
1 (3)
2006 10. Catalytic converters in car exhaust systems convert poisonous gases into less harmful gases.
(a) Two less harmful gases are formed when nitrogen monoxide reacts with carbon monoxide. Name the two gases produced.
1
(b) The catalyst is made up of the metals platinum, palladium and rhodium. Explain what happens to molecules in the exhaust gas during their catalytic conversion to less harmful gases. You may wish to draw labelled diagrams.
2 (3)

HIGHER CHEMISTRY PAST PAPERS 2000 - 2010
12
2006 11. An enzyme found in potatoes can catalyse the decomposition of hydrogen peroxide.
2H2O(aq) 2H2O(l) + O2(g)
The rate of the decomposition of hydrogen peroxide can be studied using the apparatus shown.
(a) Describe how this apparatus can be used to investigate the effect of temperature on the rate of decomposition of hydrogen peroxide.
2 (b) The graph shows how the rate of the enzyme catalysed reaction changes with
temperature.
Why does the reaction rate decrease above the optimum temperature of 40˚C?
1
(3)

HIGHER CHEMISTRY PAST PAPERS 2000 - 2010
13
2007 12.
A student carried out three experiments involving the reaction of excess magnesium ribbon with dilute acids. The rate of hydrogen production was measured in each of the three experiments.
Experiment Acid 1 100cm3 of 0.10 mol 1-1
sulphuric acid 2 50cm3 of 0.20 mol 1-1
sulphuric acid 3 100cm3 of 0.10 mol 1-1
hydrochloric acid The equation for Experiment 1 is shown.
Mg(s) + H2SO4(aq) MgSO4(aq) + H2(g)
(a) The curve obtained for Experiment 1 is drawn on the graph.
Draw curves on the graph to show the results obtained for Experiment 2 and Experiment 3. Label each curve carefully.
2
(b) The mass of magnesium used in Experiment 1 was 0.50g. For this experiment, calculate the mass of magnesium, in grams, left unreacted.
2 (4)

HIGHER CHEMISTRY PAST PAPERS 2000 - 2010
14
2007 13 Temperature has a very significant effect on the rate of a chemical reaction. (a) The reaction shown below can be used to investigate the effect of temperature on reaction
rate. 5(COOH)2(aq) + 6H+(aq) + 2MnO4-(aq) 2Mn2+(aq) + 10CO2(g) + 8H2O(l) The instructions for such an investigation are shown below.
(i) What colour changes indicates that the reaction is over? 1
(ii) With each of the experiments, the temperature of the solution was measured both during heating and at the end of the reaction. When plotting graphs of the reaction rate against temperature, it is the temperature measured at the end of reaction, rather than the temperature measured while heating, that is used. Give a reason for this.
1
(b) The graph shows the distribution of kinetic energy for molecules in a reaction mixture at
a given temperature.
Why does a small increase in temperature produce a large increase in reaction rate?
1 (3)
Procedure 1. Using syringes, add 5cm3 of sulphuric acid, 2cm3 if potassium
permanganate solution and 40cm3 if water to a 100cm3 dry glass beaker.
2. Heat the mixture to about 40˚C. 3. Place the beaker on a white tile and measure 1cm3 of oxalic acid
solution into a syringe. 4. Add the oxalic acid to the mixture in the beaker as quickly as possible
and at the same time start the timer. 5. Gently stir the reaction mixture with the thermometer. 6. When the reaction is over, stop the timer and record the time.
Measure and record the temperature of the reaction mixture. 7. Repeat the experiment three times but heat the initial sulphuric
acid/potassium permanganate/water mixtures first to 50˚C, then to 60˚C and finally to 70˚C.

HIGHER CHEMISTRY PAST PAPERS 2000 - 2010
15
2008 14. A student carried out the Prescribed Practical Activity (PPA) to find the effect of concentration
on the rate of the reaction between hydrogen peroxide solution and an acidified solution of iodide ions.
H2O2(aq) + 2H+(aq) + 2I-(aq) 2H2O(l) + I2(aq) + I2(aq) During the investigation, only the concentration of the iodide ions was changed. Part of the student’s results sheet for this PPA is shown. Results
(a) Describe how the concentration of the potassium iodide solution was changed during this series of experiments.
1 (b) Calculate the reaction time, in seconds, for the first experiment.
1 (2)
2009
15. An experiment was carried out to determine the rate of the reaction between hydrochloric acid and calcium carbonate chips. The rate of this reaction was followed by measuring the volume of gas released over a certain time.
(a)
Describe a different way of measuring volume in order to follow the rate of this reaction.
1
(b) What other variable could be measured to follow the rate of this reaction? 1
(2)

HIGHER CHEMISTRY PAST PAPERS 2000 - 2010
16
2010
16. The reaction of oxalic acid with an acidified solution of potassium permanganate was studied to determine the effect of temperature changes on reaction rate.
5(COOH)2(aq) + 6H+(aq) + 2MnO4-(aq) 2Mn2+(aq) + 10CO2(g) + 8H2O(l)
The reaction was carried out at several temperatures between 40oC and 60oC. The end of the reaction was indicated by a colour change from purple to colourless.
(a) (i) State two factors that should be kept the same in these experiments. 1
(ii) Why is it difficult to measure an accurate value for the reaction time when the reaction is carried out at room temperature.
1 (b) Sketch a graph to show how the rate varied with increasing temperature.
1 (3)