leslie matrices – simplified€¦ · leslie matrices – simplified in methods we will talk about...
TRANSCRIPT
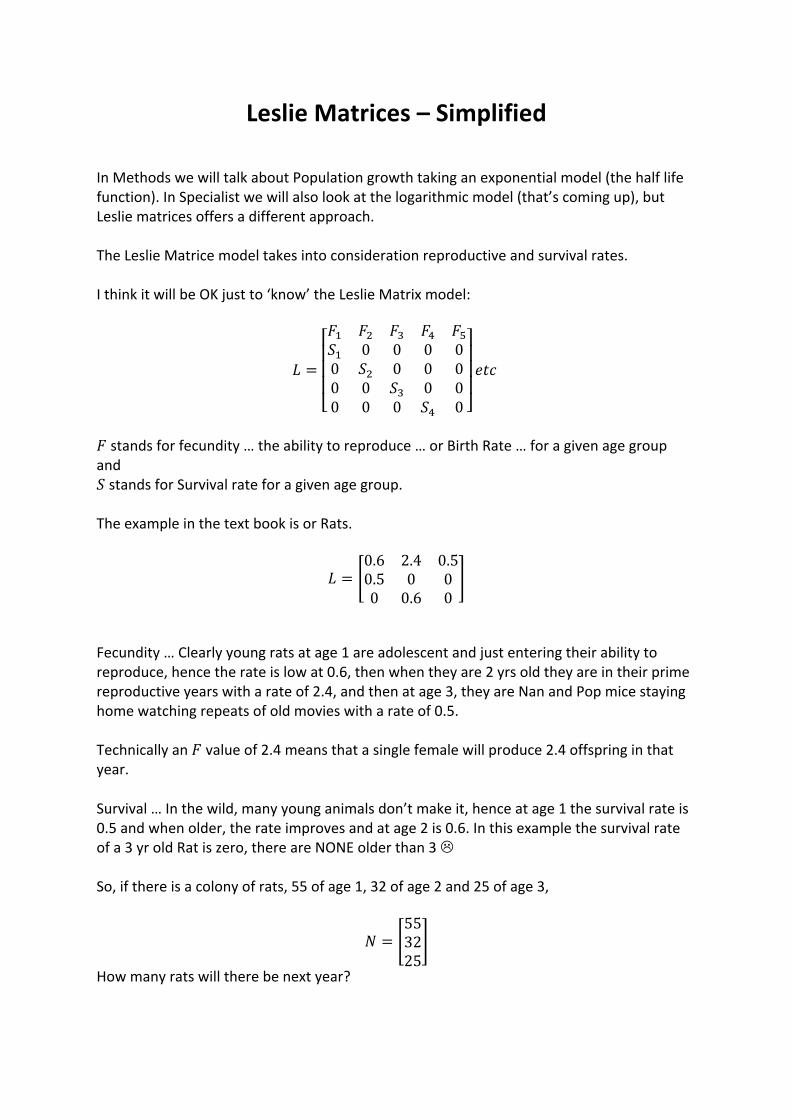
Leslie Matrices – Simplified In Methods we will talk about Population growth taking an exponential model (the half life function). In Specialist we will also look at the logarithmic model (that’s coming up), but Leslie matrices offers a different approach. The Leslie Matrice model takes into consideration reproductive and survival rates. I think it will be OK just to ‘know’ the Leslie Matrix model:
! =
⎣⎢⎢⎢⎡&' &( &) &* &+,' 0 0 0 00 ,( 0 0 00 0 ,) 0 00 0 0 ,* 0 ⎦
⎥⎥⎥⎤123
& stands for fecundity … the ability to reproduce … or Birth Rate … for a given age group and , stands for Survival rate for a given age group. The example in the text book is or Rats.
! = 50.6 2.4 0.50.5 0 00 0.6 0
;
Fecundity … Clearly young rats at age 1 are adolescent and just entering their ability to reproduce, hence the rate is low at 0.6, then when they are 2 yrs old they are in their prime reproductive years with a rate of 2.4, and then at age 3, they are Nan and Pop mice staying home watching repeats of old movies with a rate of 0.5. Technically an & value of 2.4 means that a single female will produce 2.4 offspring in that year. Survival … In the wild, many young animals don’t make it, hence at age 1 the survival rate is 0.5 and when older, the rate improves and at age 2 is 0.6. In this example the survival rate of a 3 yr old Rat is zero, there are NONE older than 3 L So, if there is a colony of rats, 55 of age 1, 32 of age 2 and 25 of age 3,
< = 5553225;
How many rats will there be next year?
C h a p t e r 2 M a t r i c e s a n d a p p l i c a t i o n s 71
Leslie matricesThere are many factors that affect the size of populations of animal species. The first ofthese is the survival rate; that is, the proportion of animals that survive until the nextyear (or whatever time period is being used). Clearly, a more accurate picture of thesurvival rate can be obtained if we use survival rates specific to the different agegroups. For example, a saltwater crocodile may produce many offspring in a year butnot many of the babies survive their first year. However, once they reach 1 year of ageit is much more likely that they will get to 2 years of age.
A second factor influencing the population of a species is its fecundity or how manybabies are produced per year. Again, fecundity rates that are specific to particular agegroups will yield a more accurate analysis.
To see how matrices can be used to model animal populations, consider thefollowing example.
A wildlife officer is interested in the number of a certain species of rat in a habitatand has compiled the following information on this species.
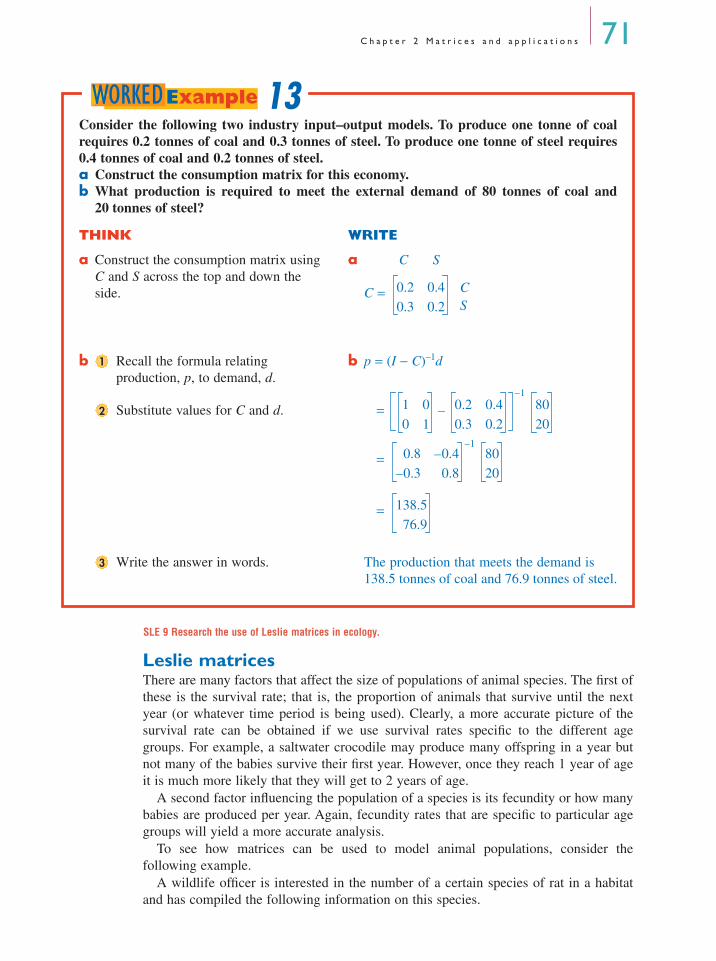
Consider the following two industry input–output models. To produce one tonne of coalrequires 0.2 tonnes of coal and 0.3 tonnes of steel. To produce one tonne of steel requires0.4 tonnes of coal and 0.2 tonnes of steel.a Construct the consumption matrix for this economy.b What production is required to meet the external demand of 80 tonnes of coal and
20 tonnes of steel?
THINK WRITE
a Construct the consumption matrix using C and S across the top and down the side.
a C S
C =
b Recall the formula relating production, p, to demand, d.
b p = (I − C)–1d
Substitute values for C and d. P =
P =
P =
Write the answer in words. The production that meets the demand is 138.5 tonnes of coal and 76.9 tonnes of steel.
CS
0.2 0.40.3 0.2
1
2 1 00 1
0.2 0.40.3 0.2
–1–
8020
0.8 0.4–0.3– 0.8
1–8020
138.576.9
3
13WORKEDExample
SLE 9 Research the use of Leslie matrices in ecology.

50.6 2.4 0.50.5 0 00 0.6 0
; × 5553225; = 5
122.327.519.2
;
There will be 169 Rats … How cute! How many Rats will there be after 2 yrs?
50.6 2.4 0.50.5 0 00 0.6 0
;(
× 5553225; = 5
148.9861.1516.5
;
There will be 226 Rats … How cute ? How many Rats will there be after 5 yrs?
50.6 2.4 0.50.5 0 00 0.6 0
;+
× 5553225; = 5
521.88171.8873.32
;
There will be 767 Rats … Its time for Ratsak! *** Note… the Leslie matrix model is USUALLY only used to model the FEMALE population. ***** caution at the wording of the questions. What is the population after 6 years, versus in the 6th year? Is the first population year 1 or year 0? Be super careful with the wording of the question!
72 M a t h s Q u e s t M a t h s C Ye a r 1 2 f o r Q u e e n s l a n d
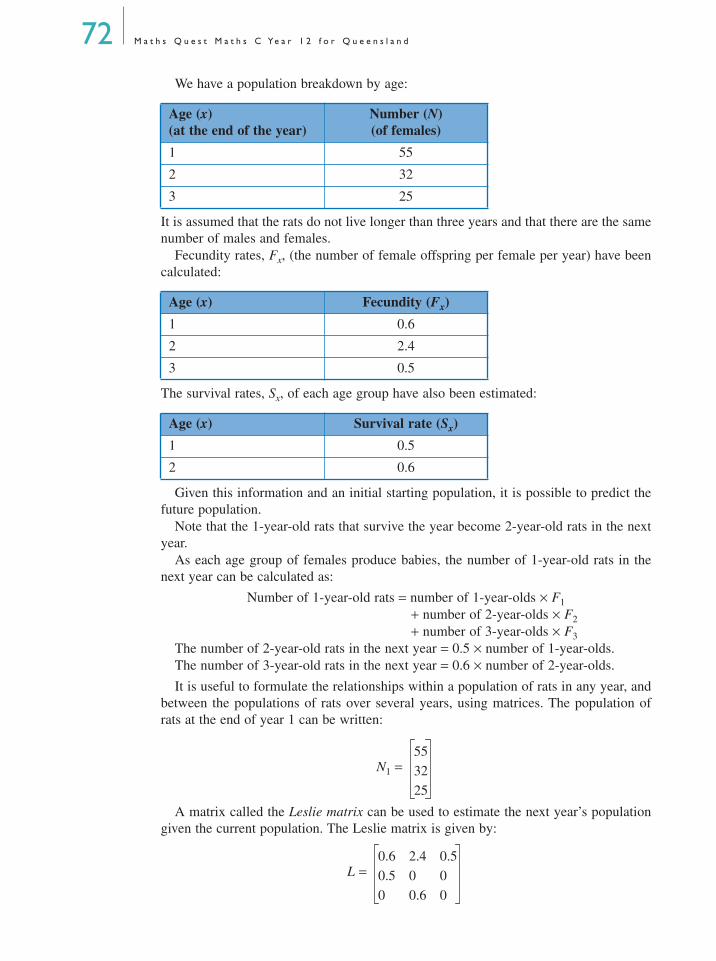
We have a population breakdown by age:
It is assumed that the rats do not live longer than three years and that there are the samenumber of males and females.
Fecundity rates, Fx, (the number of female offspring per female per year) have beencalculated:
The survival rates, Sx, of each age group have also been estimated:
Given this information and an initial starting population, it is possible to predict thefuture population.
Note that the 1-year-old rats that survive the year become 2-year-old rats in the nextyear.
As each age group of females produce babies, the number of 1-year-old rats in thenext year can be calculated as:
Number of 1-year-old rats = number of 1-year-olds × F1 + number of 2-year-olds × F2+ number of 3-year-olds × F3
The number of 2-year-old rats in the next year = 0.5 × number of 1-year-olds.The number of 3-year-old rats in the next year = 0.6 × number of 2-year-olds.
It is useful to formulate the relationships within a population of rats in any year, andbetween the populations of rats over several years, using matrices. The population ofrats at the end of year 1 can be written:
N1 =
A matrix called the Leslie matrix can be used to estimate the next year’s populationgiven the current population. The Leslie matrix is given by:
L =
Age (x)(at the end of the year)
Number (N)(of females)
1 55
2 32
3 25
Age (x) Fecundity (Fx)
1 0.6
2 2.4
3 0.5
Age (x) Survival rate (Sx)
1 0.5
2 0.6
553225
0.6 2.4 0.50.5 0 00 0.6 0
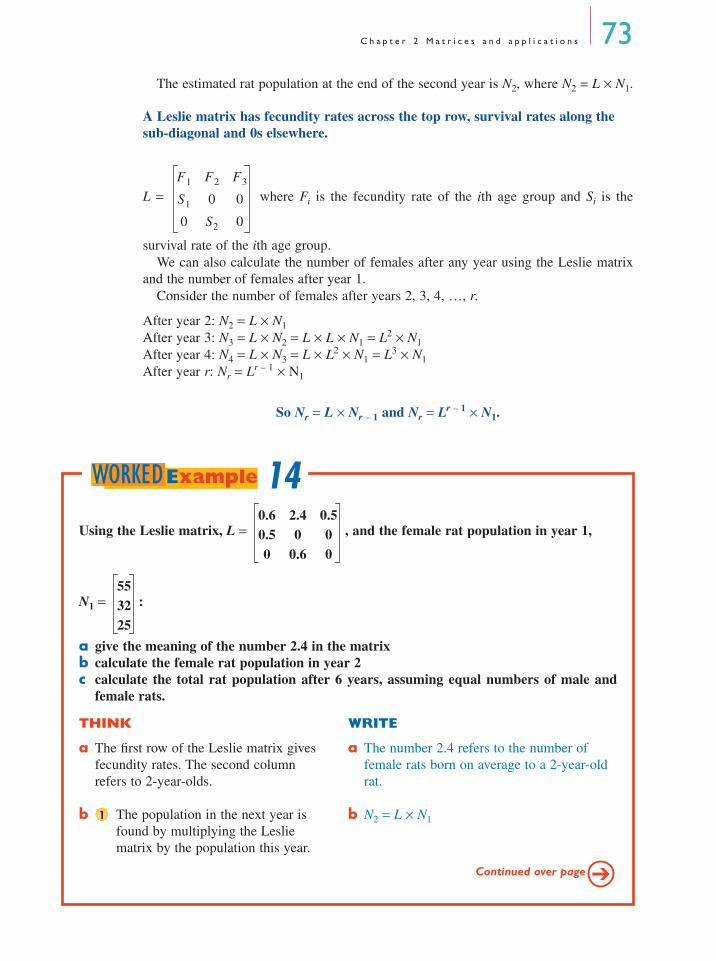
C h a p t e r 2 M a t r i c e s a n d a p p l i c a t i o n s 73The estimated rat population at the end of the second year is N2, where N2 = L × N1.
A Leslie matrix has fecundity rates across the top row, survival rates along the sub-diagonal and 0s elsewhere.
L = where Fi is the fecundity rate of the ith age group and Si is the
survival rate of the ith age group.We can also calculate the number of females after any year using the Leslie matrix
and the number of females after year 1.Consider the number of females after years 2, 3, 4, …, r.
After year 2: N2 = L × N1After year 3: N3 = L × N2 = L × L × N1 = L2 × N1After year 4: N4 = L × N3 = L × L2 × N1 = L3 × N1After year r: Nr = Lr – 1 × N1
So Nr = L × Nr – 1 and Nr = Lr – 1 × N1.
F1 F2 F3
S1 0 0
0 S2 0
Using the Leslie matrix, L = , and the female rat population in year 1,
N1 = :
a give the meaning of the number 2.4 in the matrixb calculate the female rat population in year 2c calculate the total rat population after 6 years, assuming equal numbers of male and
female rats.
Continued over page
THINK WRITE
a The first row of the Leslie matrix gives fecundity rates. The second column refers to 2-year-olds.
a The number 2.4 refers to the number of female rats born on average to a 2-year-old rat.
b The population in the next year is found by multiplying the Leslie matrix by the population this year.
b N2 = L × N1
0.6 2.4 0.50.5 0 00 0.6 0
553225
1
14WORKEDExample

74 M a t h s Q u e s t M a t h s C Ye a r 1 2 f o r Q u e e n s l a n d
THINK WRITE
Perform the matrix multiplications. N2 =
N2 =
Write the answer. The total female population is 122.3 + 27.5 + 19.2 = 169.
c Calculate the population after 6 years using the formula Nr = Lr – 1 × N1.
c N6 = L5 × N1
N6 =
Perform the matrix multiplications. N6 =
Add the female populations. The total female population is 521.9 + 171.9 + 73.3 = 767.1.
Calculate the total rat population assuming that there are equal numbers of males and females.
Number of males and females = 2 × 767.1= 1534.2
Answer the question. The total rat population is 1534 rats.
20.6 2.4 0.50.5 0 00 0.6 0
553225
122.327.519.2
3
1
0.6 2.4 0.50.5 0 00 0.6 0
5553225
2521.9171.973.3
3
4
5
remember1. A Leontief matrix relates input and output in an economy.
(a) p is an n × 1 matrix whose elements are the products of a process.(b) q is an n × 1 matrix whose elements are the inputs needed to produce p.(c) d is an n × 1 matrix whose elements are the external demands in the
economy.(d) C is an n × n matrix with Cij giving the amount of product i needed to make
one unit of product j.q = Cp where q is the input needed to give a production, p.
(e) A production, p, to match a given demand, d, may be found using the equation:p = (I – C)–1d.
2. A Leslie matrix has fecundity rates across the top row, survival rates along the sub-diagonal and 0s elsewhere. Given a Leslie matrix L, and an initial female population N1, then the female population after r years is: Nr = Lr – 1 × N1.
remember

C h a p t e r 2 M a t r i c e s a n d a p p l i c a t i o n s 75
Leontief matrices and Leslie matrices
1 Given the consumption matrix C = , calculate the inputs needed
to produce:
a 1 unit of H
b 12 units of G, 15 units of H and 30 units of T.
2 Given the consumption matrix C = , calculate the inputs needed
to produce:
a 3 units of G
b 8 units of G, 25 units of H and 10 units of T.
3 Given the consumption matrix at right: C =
a calculate the production needed to match the demand, d =
b show that a suitable production can be found to match any demand.
4 Given the consumption matrix C = :
a calculate the production needed to match the demand d =
b show that a suitable production can be found to match any demand.
2C
WWORKEDORKEDEExamplexample
11
G H TGHT
0.3 0.5 0.20.2 0.4 0.30.6 0.1 0.1
G H TGHT
0.2 0.2 0.10.2 0.4 0.30.4 0.1 0.1
WWORKEDORKEDEExamplexample
12
G H TGHT
0.3 0.2 0.10.2 0.4 0.30.6 0.1 0.1
304525
G H TGHT
0.2 0.2 0.10.2 0.4 0.30.4 0.1 0.1
304525
0.5 units of
G
, 0.4 units of
H
, 0.1 units of
T
17.1 units of
G
, 17.4 units of
H
, 11.7 units of
T
0.6 units of
G
, 0.6 units of
H
, 1.2 units of
T
7.6 units of
G
, 14.6 units of
H
, 6.7 units of
T
109 units of
G
, 171 units of
H
, 119 units of
T
|
I
−
C
|
is not zero.
83 units of
G
, 143 units of
H
, 81 units of
T
|
I
−
C
|
is not zero.
76 M a t h s Q u e s t M a t h s C Ye a r 1 2 f o r Q u e e n s l a n d
5 Consider the following three-industryeconomy:The external demands for A, B and C are20, 30 and 10 respectively. The exchange
matrix is: M = .
a What is the meaning of the entry 0.5 inthe matrix?
b Calculate the required output for each ofthe three industries.
6 A two-industry economy consists of coaland steel. To produce one tonne of coalrequires 0.3 tonnes of coal and 0.4 tonnes ofsteel. To produce one tonne of steel requires0.45 tonnes of coal and 0.2 tonnes of steel. a Construct the consumption matrix.b What production is required to meet
the demand of 45 tonnes of coal and25 tonnes of steel?
7 Consider the following hypothetical three-industry economy.
a Construct the consumption matrix for this economy.
b What inputs are required to produce 10 units of A, 20 units of B and 60 units of C?
c How much of each should be produced to meet the external demand of 45 units ofA, 30 units of B and 40 units of C?
8 Suppose that only 15% of baby saltwater crocodiles live to 1 year of age and that 60%of 1-year-olds survive to 2 years of age. In one season, 40 crocodile eggs hatch. Howmany of these survive to: a 1 year of age?b 2 years of age?
9 The change in the rat population in a certain habitat is described by the followingLeslie matrix:
L = .
To manufacture 1 unit of A requires: 0.2 units of A 0.3 units of B 0.1 units of C
To manufacture 1 unit of B requires: 0.1 units of A 0.2 units of B 0.2 units of C
To manufacture 1 unit of C requires: 0.2 units of A 0.1 units of B 0.3 units of C
A B CABC
0 0.1 0.20.1 0.1 0.20.5 0.6 0
WWORKEDORKEDEExamplexample
13
WWORKEDORKEDEExamplexample
14
0.7 1.4 0.70.4 0 00 0.5 0
To produce 1 unit of
A
requires 0.5 units of
C
.
The required output is 37 units of
A
, 50 units 59 units of
C
0.3 0.450.4 0.20
124 tonnes of coal, 93 tonnes of steel
0.2 0.1 0.20.3 0.2 0.10.1 0.2 0.3
16 units of
A
, 13 units 23 units of
C
90 units of
A
, 83 units of
B
, 94 units of
C
63.6
of B ,
of
B
,
C h a p t e r 2 M a t r i c e s a n d a p p l i c a t i o n s 77
The initial female rat population is N1 = .
a Give the meaning of the number 1.4 in the matrix.b Give the meaning of the number 0.5 in the matrix.c Calculate the female rat population for year 3.d Calculate the total rat population after 9 years, assuming equal numbers of male
and female rats.10 The numbers of a particular species of bird have been monitored over three years and
the following Leslie matrix has been developed to model the population. The birds areaged 1, 2 or 3 years.
L =
a How many new birds do 1-year-old birds produce on average?b How many new birds do 2-year-old birds produce on average?c What proportion of 1-year-old birds survive the first year?
d If the female population in year 1 is N1 = , calculate the population offemale birds in year 3.
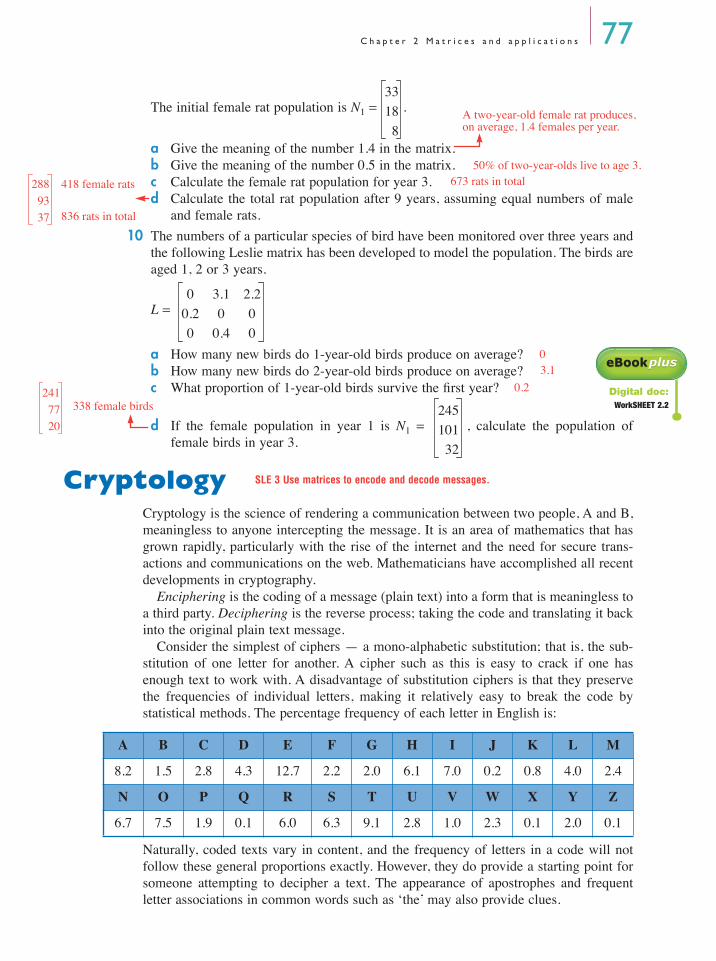
CryptologyCryptology is the science of rendering a communication between two people, A and B,meaningless to anyone intercepting the message. It is an area of mathematics that hasgrown rapidly, particularly with the rise of the internet and the need for secure trans-actions and communications on the web. Mathematicians have accomplished all recentdevelopments in cryptography.
Enciphering is the coding of a message (plain text) into a form that is meaningless toa third party. Deciphering is the reverse process; taking the code and translating it backinto the original plain text message.
Consider the simplest of ciphers — a mono-alphabetic substitution; that is, the sub-stitution of one letter for another. A cipher such as this is easy to crack if one hasenough text to work with. A disadvantage of substitution ciphers is that they preservethe frequencies of individual letters, making it relatively easy to break the code bystatistical methods. The percentage frequency of each letter in English is:
Naturally, coded texts vary in content, and the frequency of letters in a code will notfollow these general proportions exactly. However, they do provide a starting point forsomeone attempting to decipher a text. The appearance of apostrophes and frequentletter associations in common words such as ‘the’ may also provide clues.
A B C D E F G H I J K L M
8.2 1.5 2.8 4.3 12.7 2.2 2.0 6.1 7.0 0.2 0.8 4.0 2.4
N O P Q R S T U V W X Y Z
6.7 7.5 1.9 0.1 6.0 6.3 9.1 2.8 1.0 2.3 0.1 2.0 0.1
3318
8
0 3.1 2.20.2 0 00 0.4 0
eBookpluseBookplus
Digital doc:WorkSHEET 2.2245
10132
A two-year-old female rat produces, on average, 1.4 females per year.
50% of two-year-olds live to age 3.673 rats in total288
9337
418 female rats
836 rats in total
03.1
0.2338 female birds
2417720
SLE 3 Use matrices to encode and decode messages.
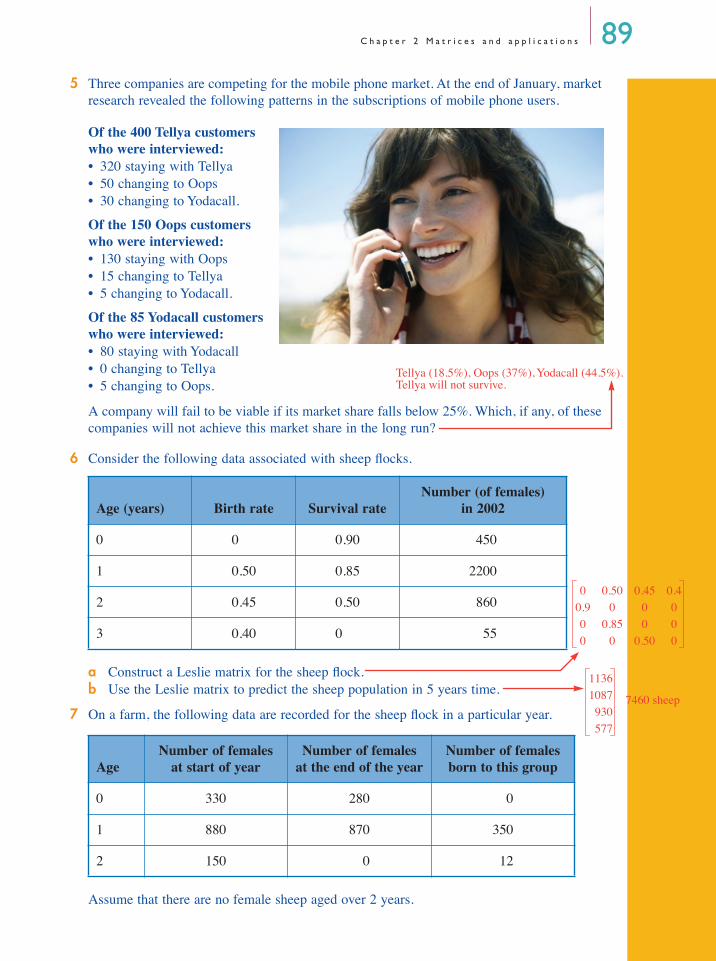
C h a p t e r 2 M a t r i c e s a n d a p p l i c a t i o n s 895 Three companies are competing for the mobile phone market. At the end of January, market
research revealed the following patterns in the subscriptions of mobile phone users.
Of the 400 Tellya customers who were interviewed:• 320 staying with Tellya• 50 changing to Oops• 30 changing to Yodacall.
Of the 150 Oops customers who were interviewed:• 130 staying with Oops• 15 changing to Tellya• 5 changing to Yodacall.
Of the 85 Yodacall customers who were interviewed:• 80 staying with Yodacall• 0 changing to Tellya• 5 changing to Oops.
A company will fail to be viable if its market share falls below 25%. Which, if any, of these companies will not achieve this market share in the long run?
6 Consider the following data associated with sheep flocks.
a Construct a Leslie matrix for the sheep flock.b Use the Leslie matrix to predict the sheep population in 5 years time.
7 On a farm, the following data are recorded for the sheep flock in a particular year.
Assume that there are no female sheep aged over 2 years.
Age (years) Birth rate Survival rateNumber (of females)
in 2002
0 0 0.90 450
1 0.50 0.85 2200
2 0.45 0.50 860
3 0.40 0 55
AgeNumber of females
at start of yearNumber of females
at the end of the yearNumber of females born to this group
0 330 280 0
1 880 870 350
2 150 0 12
Tellya (18.5%), Oops (37%), Yodacall (44.5%). Tellya will not survive.
0 0.50 0.45 0.40.9 0 0 00 0.85 0 00 0 0.50 0
7460 sheep
11361087930577

90 M a t h s Q u e s t M a t h s C Ye a r 1 2 f o r Q u e e n s l a n d
a What is the survival rate of: iii the 0-year-old group?iii the 1-year-old group?iii the 2-year-old group?
b What is the birth rate for:iii the 0-year-old group?iii the 1-year-old group?iii the 2-year-old group?
c Construct a Leslie matrix for the sheep flock.d Use the matrix to predict the sheep population in
3 years time.
8 The numbers of a particular species of lizard, all aged 1, 2 or 3 years, have been monitored over many years and the following Leslie matrix has been developed to model the population.
L =
a On average, how many new lizards do 1-year-old lizards produce?
b On average, how many new lizards do 2-year-old lizards produce?
c What proportion of 1-year-old lizards survive the first year?
d If the initial female population is N1 = , calculate the female population in 3 years time.
0 5.30 3.500.20 0 0
0 0.25 0
354622
0.850.990
00.40.08
0 0.4 0.080.85 0 0
0 0.99 0
769 female sheep182309278
0
5.30.2
77.464.2
1.8