leo romana potential solutions for electric vehicles …lib.tkk.fi/dipl/2010/urn100339.pdf · leo...
TRANSCRIPT

AALTO UNIVERSITY SCHOOL OF SCIENCE AND TECHNOLOGY
Faculty of Electronics, Communications and Automation
Department of Electrical Engineering
Leo Romana
Potential Solutions for Electric Vehicles in
Bus and Delivery Traffic
Master’s thesis submitted for approval for the degree of Master of Science.
Espoo, 1 November 2010
Supervisor Prof. Matti Lehtonen
Instructor Eero Saarijärvi

ii
Preface
This Master’s thesis was made at the Department of Electrical Engineering of the Aalto
University School of Science and Technology. The thesis was carried out in cooperation
with the research project SIMBe (Smart Infrastructures for Electric Mobility in Built
Environments).
There are a few individuals whose support was invaluable to me during the writing of
this thesis. Firstly, I want to express my gratitude to my supervisor, Professor Matti
Lehtonen. He provided me with a lot of useful information, as well as an insight into the
topic of my work. I also want to thank Eero Saarijärvi for instructing, as well as William
Martin and Eva Lönnholm for proofreading my work. An additional thankyou goes to
my colleagues who commented on my work during the writing process.
Finally, I want to acknowledge my family for their consistent support that I have re-
ceived throughout my studies.
Espoo, 1 November 2010
Leo Romana
iii
AALTO UNIVERSITY ABSTRACT OF THE
SCHOOL OF SCIENCE AND TECHNOLOGY MASTER’S THESIS
Author: Leo Romana
Title: Potential Solutions for Electric Vehicles in Bus and Delivery Traffic
Date: 1 November 2010 Number of pages: 10 + 85
Faculty: Faculty of Electronics, Communications and Automation
Department: Department of Electrical Engineering
Professorship: Power Systems and High Voltage Engineering (S-18)
Supervisor: Prof. Matti Lehtonen, D.Sc. (Eng.)
Instructor: Eero Saarijärvi, M.Sc. (Eng.)
The Finnish traffic planning organisation aims for more sustainable vehicular solutions. This thesis pre-
sents the most applicable electric vehicle technologies suitable for colder climates, such as in Finland. The
discussed vehicle technologies contribute to sustainable development. Both public and private sectors are
taken into account. The vehicle electrification in public passenger transport is mainly addressed in the
section for the bus traffic, whereas the private sector comes into play in the context of the delivery traffic.
Rail traffic, however, is not discussed in the thesis. The literature for the study is gathered from various
Internet sources, scientific articles and books. Additionally, two interviews were carried out to gain infor-
mation about the attitudes towards vehicle electrification in the Helsinki metropolitan area. Thus, the used
material covers the present knowledge about the discussed electric vehicle technologies, their prevalence
and typical usage, as well as the level of interest shown towards them.
The major technologies to be considered in vehicle electrification are trolley buses, as well as vehicles
based on battery and hydrogen fuel cell technologies. A comparison of these basic technologies is in-
cluded in the thesis. The sustainability of the different vehicle technologies is largely assessed by the pro-
duction of the used electricity or hydrogen. For making electric vehicles a more viable alternative for bus
and delivery traffic, there is a need for promoting more low-carbon electricity and hydrogen production.
In general, it was discovered that the current battery technologies alone do not provide an economical
alternative for powering buses. Along with fuel cells, batteries are still a high-cost solution to be further
developed. Batteries, however, can reasonably be used for the regeneration of vehicle braking power, as
an APU or for extending the range of the vehicle. Currently, the most applicable solution for buses seems
to be the trolley bus which provides the lowest acquisition price and by far the longest life cycle. Trolley
buses have also been used in colder climates with success. In the delivery vehicle sector, electric vehicles
running on pure batteries will be promoted more strongly. In order to find out the most applicable, practi-
cal electric vehicle technologies, future studies within the subject matter should consider possible combi-
nations of the discussed vehicle technologies.
Keywords: battery, battery-electric bus, electric vehicle, energy storage, fuel cell, plug-in hybrid electric
vehicle, trolley bus
iv
AALTO-YLIOPISTO DIPLOMITYÖN TIIVISTELMÄ
TEKNILLINEN KORKEAKOULU
Tekijä: Leo Romana
Työn nimi: Mahdolliset sähköajoneuvoratkaisut bussi- ja kuljetusliikenteessä
Päivämäärä: 1.11.2010 Sivumäärä: 10 + 85
Tiedekunta: Elektroniikan, tietoliikenteen ja automaation tiedekunta
Laitos: Sähkötekniikan laitos
Professuuri: Sähköverkot ja suurjännitetekniikka (S-18)
Työn valvoja: Professori Matti Lehtonen
Työn ohjaaja: Eero Saarijärvi
Kestävän kehityksen mukaiset ajoneuvoratkaisut ovat osa suomalaista liikennesuunnittelua. Tämän diplo-
mityön tarkoituksena on käydä läpi sellaiset kylmiin olosuhteisiin soveltuvat sähköajoneuvoteknologiat,
joiden voidaan osaltaan katsoa vastaavan kestävän kehityksen asettamiin haasteisiin. Teknologioiden
käyttöä käsitellään niin julkisten kuin yksityistenkin käyttäjäsegmenttien näkökulmasta. Ajoneuvokannan
sähköistämistä julkisessa liikenteessä tarkastellaan bussiliikenteen näkökulmasta. Yksityistä sektoria kos-
kettaa lähemmin työssä käsitelty tavarankuljetusajoneuvojen sähköistäminen. Työ ei käsittele raideliiken-
nettä. Työ on tehty kirjallisuustutkimuksena, johon on kerätty materiaalia useista Internet-lähteistä sekä
tieteellisistä artikkeleista ja kirjoista. Tutkimusta tukevat myös kaksi haastattelua, joista ilmenee Helsingin
seudulla vallitsevia asenteita ajoneuvojen sähköistämistä kohtaan. Käytetyn lähdemateriaalin avulla on
pyritty saavuttamaan mahdollisimman laaja tietämys eri sähköajoneuvoteknologioiden nykytilasta ja käy-
töstä sekä niitä kohtaan osoitetusta mielenkiinnosta.
Merkittävimmät työssä käsiteltävät sähköajoneuvoteknologiat ovat johdinbussi sekä akku- ja polttokenno-
toimiset ajoneuvoteknologiat. Näitä teknologioita on verrattu työssä monipuolisesti. Nykyään paljon pu-
huttavan kestävän kehityksen näkökulmasta sähköajoneuvoteknologioiden mielekkyyteen vaikuttaa mer-
kittävästi sähkön- ja vedyn tuotannon päästöprofiili. Sähköajoneuvojen houkuttelevuutta voidaan parantaa
suosimalla matalapäästöisiä energiantuotantomuotoja. Diplomityössä selviää, ettei pelkän nykyisen akku-
teknologian avulla vielä kyetä bussiliikenteen taloudellisesti kannattavaan sähköistämiseen. Polttokenno-
jen lailla ajoneuvojen akut ovat vielä erittäin kalliita ja teknisesti kehittymättömiä. Akkuja voidaan kui-
tenkin käyttää järkevin perustein ajoneuvojen jarruenergian talteenottoon sekä pidentämään ajoneuvojen
toimintasädettä. Tällä hetkellä soveltuvin sähköajoneuvo bussiliikenteeseen näyttäisi olevan johdinauto,
joka on käsitellyistä vaihtoehdoista halvin ja ennen kaikkea pitkäikäisin. Johdinautoja on myös käytetty
menestyksekkäästi kylmissä olosuhteissa. Tavarankuljetusliikenteen saralla pelkkien akkujen käyttöä
ajoneuvojen energianlähteenä tullaan edistämään voimakkaammin. Jatkotutkimuksissa olisi suotavaa
tutkia työssä käsiteltyjen teknologioiden yhdistelmiä käyttökelpoisimpien sähköajoneuvojen löytymiseksi.
Avainsanat: akku, energiavarasto, johdinauto, ladattava hybridiajoneuvo, polttokenno, sähköajoneuvo,
sähköbussi
v
AALTO-UNIVERSITETET SAMMANDRAG AV DIPLOMARBETE
TEKNISKA HÖGSKOLAN
Författare: Leo Romana
Arbetets namn: Potentiella elfordon för buss- och transporttrafik
Datum: 1.11.2010 Sidantal: 10 + 85
Fakultet: Fakulteten för elektronik, kommunikation och automatik
Institution: Institutionen för elektroteknik
Professur: Elnät och högspänningsteknologi (S-18)
Övervakare: Professor Matti Lehtonen
Handledare: Eero Saarijärvi
Den finska trafikplaneringen har formulerat ambitiösa mål för att styra in utvecklingen mot mera hållbara
fordonstekniker. Detta diplomarbete presenterar de mest användbara elfordonsteknologierna. De tekniker
som diskuteras är lämpliga för kallare klimat och bidrar till hållbar utveckling. Diplomarbetet behandlar
både de offentliga och privata trafiksektorerna. Elektrifieringen av offentliga fordon granskas genom den
offentliga busstrafiken, medan privata fordon analyseras genom varutransporttrafiken. Järnvägstrafiken
behandlas inte i detta diplomarbete. Litteraturen för undersökningen baserar sig på många Internetkällor,
vetenskapliga artiklar och böcker. Därtill utfördes två intervjuer för att få information om attityder till
elektrifieringen av fordon i den finska huvudstadsregionen. Utgående från det använda materialet presen-
terar detta diplomarbete många tidigare erfarenheter och uppdaterad information om elfordonsindustrin –
d.v.s. utbredning, vanliga användningsändamål och intresse för elfordon.
De signifikanta teknologier som bör beaktas vid elektrifieringen av fordon är trådbussar och olika fordon
som använder batteri- eller bränslecellteknologier. En jämförelse mellan de här grundteknologierna är
inkluderad i detta arbete. Hur hållbara de olika teknikerna miljömässigt är beror i hög grad på hur man
producerar el och väte. För att producera mera genomförbara alternativ av elfordon för buss- och trans-
porttrafiken, måste man först och främst främja lågemissionsteknologier inom el- och väteindustrin. Av
detta diplomarbete framgår att elmatningen i elbussar inte kan lyckas med bara fordonsbatterier utan att
dessa måste kompletteras med andra teknologier. Både fordonsbatterier och bränslekällor bör utvecklas
för att möjliggöra lägre marknadspriser och bättre konkurrenskraft. Batterier kan trots allt utnyttjas till att
återvinna bromsenergi samt som räckviddsförlängare eller extra energikälla. För närvarande verkar tråd-
bussen vara det mest användbara alternativet för elektrifiering av busstrafiken. Trådbussar är billiga och
har en mycket lång teknisk livslängd. De har även använts i kalla klimat på ett framgångsrikt sätt. Inom
varutransporter kommer rena batteribilar att befordras kraftigare. För att finna de mest användbara och
praktiska elfordonsteknikerna, rekommenderas det att kommande undersökningar ska granska möjligheter
till kombinationer av olika fordonsteknologier.
Nyckelord: batteri, bränslecell, elbuss, elfordon, energireserv, laddhybridbil, trådbuss

vi
Table of contents
Preface.............................................................................................................................. ii
Abbreviations and terms ............................................................................................. viii
Units ................................................................................................................................. x
1 Introduction............................................................................................................. 1
1.1 General .............................................................................................................. 1
1.2 Aim and scope of the study ............................................................................... 1
1.3 References and methods of research ................................................................. 2
2 Trolley buses............................................................................................................ 4
2.1 Background of the trolley bus – future prospects ............................................. 4
2.2 Basic characteristics of trolley buses ................................................................ 7
2.3 Infrastructure on roads and trolley bus depots ................................................ 10
2.4 Costs of trolley bus investment, maintenance and infrastructure ................... 12
2.5 Impacts on environment .................................................................................. 13
3 Fuel cell buses ........................................................................................................ 14
3.1 A brief history and development of fuel cells ................................................. 14
3.2 PEMFC technology for transport .................................................................... 15
3.3 Use of fuel cells in modern public transport – a look at the available
technology ................................................................................................................... 17
3.4 Technical characteristics of a Mercedes-Benz fuel-cell-Citaro ...................... 22
3.5 New technology – Mercedes-Benz Citaro FuelCELL .................................... 25
3.6 Hydrogen infrastructure basics ....................................................................... 26
3.7 Costs related to fuel cell buses and the hydrogen technology ........................ 28
3.8 Environmental issues ...................................................................................... 30
4 Battery-electric vehicles – buses .......................................................................... 33
4.1 History and status of electric vehicles ............................................................ 33
4.2 The most prominent battery technologies for electric vehicles – Li-ion ........ 34
4.3 Battery manufacturers ..................................................................................... 35
4.4 Battery-electric bus implementations ............................................................. 36
4.5 Plug-in hybrid electric vehicles – implementation in bus traffic .................... 40
4.6 Common challenges for vehicle battery technologies .................................... 41

vii
4.7 The batteries of an electric vehicle as energy storage ..................................... 43
5 Comparing transit bus technologies .................................................................... 45
5.1 In general ........................................................................................................ 45
5.2 Comparison of vehicle technologies ............................................................... 45
5.2.1 Energy efficiency ........................................................................................ 47
5.2.2 Running time energy consumption ............................................................. 50
5.2.3 Other technological characteristics ............................................................. 51
5.2.4 Purchase costs ............................................................................................. 53
5.2.5 Emissions and consequential impacts on environment .............................. 54
5.2.6 Passenger comfort ....................................................................................... 56
6 Definitions of Helsinki area policies .................................................................... 58
6.1 HSL ................................................................................................................. 58
6.2 Charter bus fleet characteristics in the Helsinki region – emissions .............. 58
6.3 Assessment of transport operators and their vehicles – general remarks ....... 60
6.4 Carbon dioxide as a decisive measure ............................................................ 61
6.5 Trolley bus as an alternative ........................................................................... 62
6.6 Other modern bus technologies ...................................................................... 64
6.7 Near future environmental goals for Helsinki city traffic ............................... 64
7 Electrification of delivery traffic ......................................................................... 67
7.1 The trend of growing goods transport ............................................................. 67
7.2 Electrification of delivery traffic – demonstrations and commercial usage ... 67
7.3 Itella Corporation – delivering postal mail and parcels .................................. 70
8 Conclusions ............................................................................................................ 72
References ...................................................................................................................... 74
Appendix A: European emission standards ............................................................... 85

viii
Abbreviations and terms
AC Alternating Current
APU Auxiliary Power Unit
AUD Australian Dollar
BEB Battery-Electric Bus
BEV Battery-Electric Vehicle
CNG Compressed Natural Gas
CO Carbon Monoxide
CO2 Carbon Dioxide
CUTE Clean Urban Transport for Europe
DC Direct Current
DGE Diesel Gallon Equivalent
DMFC Direct Methanol Fuel Cell
ECTOS Ecological City TranspOrt System
EEV Enhanced Environmentally friendly Vehicle
ELCIDIS ELectric vehicles in CIty DIStribution
ESS Energy Storage System
EU European Union
EUR Euro
EV Electric Vehicle
-FC -Fuel Cell
FCB Fuel Cell Bus
FCHV Fuel Cell Hybrid Vehicle
FCV Fuel Cell Vehicle
FTA Federal Transit Administration
HC Hydrocarbon
HESB Hybrid Electric School Bus
HEV Hybrid Electric Vehicle
HSL Helsinki Regional Transport Authority
HSY Helsinki Region Environmental Services Authority
H2 Hydrogen
ICE Internal Combustion Engine
IFEU Institute for Energy and Environmental Research
LCO Lithium-Cobalt Oxide
LEJ Lithium Energy Japan
LFP or LiFePO4 Lithium Iron Phosphate

ix
Li-ion Lithium-ion
LMO Lithium-manganese spinel
LTO Lithium Titanate
NCA Lithium-nickel-Cobalt-Aluminium
NiCd Nickel Cadmium
Ni-MH Nickel-Metal Hydride
NMC lithium-Nickel-Manganese-Cobalt
NOX Mono-nitrogen oxides (nitric oxide and nitrogen dioxide)
OEM Original Equipment Manufacturer
PAFC Phosphoric Acid Fuel Cell
PEM Polymer Electrolyte Membrane/Proton Exchange Membrane
PHEV Plug-in Hybrid Electric Vehicle
PM Particulate Matter
RMFC Reformed Methanol Fuel Cell
SEV Smith Electric Vehicles
STEP Sustainable Transport Energy Project
UITP International Association of Public Transport
USD United States Dollar
V2G Vehicle-to-Grid
tank-to-wheel The efficiency pathway of a certain fuel or electricity from
the tank of a vehicle to propulsive energy
well-to-tank The efficiency pathway of a certain fuel or electricity from
the production to the tank of a vehicle
well-to-wheel The efficiency pathway of a certain fuel or electricity from
the production to propulsive energy
x
Units
A ampere
dB (A) A-weighted desibel
g gramme
kg kilogramme
km kilometre
kWh kilowatt-hour
kWheq kilowatt-hour equivalent
mm millimetre
V volt
W watt
Wh watt-hour
€ Euro

1
1 Introduction
1.1 General
Concerns about the sustainability and adequacy of energy have started a continuous
process of change. Especially, in the industrialised world, people are now trying to find
solutions for improved energy efficiency and cleaner living environments. Under the
pressure of global warming, governments and international organisations have assessed
wide-ranging measures, methods and restrictions for reducing emissions.
Road traffic releases a great amount of harmful emissions. While traffic flows are con-
stantly growing, passenger and delivery transport require implementation of novel, in-
novative solutions in order to have control of traffic-based emissions. Presently, bus and
delivery vehicle fleets mainly consist of vehicles relying on conventional fuels. Despite
the improving engine technologies, the need for alternative fuels and electrification of
vehicles is widely recognised. The electrification of vehicles combined with responsible
production of electricity form a promising combination for making healthier cityscapes
possible.
Electric vehicles (EVs) have been used in Finland before. Decades ago, the cities of
Helsinki and Tampere still ran trolley buses as a part of public transport. However, since
then, conventional vehicle types (e.g., diesel vehicles) have provided a more viable,
economical choice of transport. Trying to reduce the amount of generated emissions and
exhaust gases, several Finnish cities and companies are now striving for sustainability.
Traffic poses one of the main sustainability challenges and is certainly taken into ac-
count in the national policies.
1.2 Aim and scope of the study
This thesis discusses the potential solutions for vehicle electrification considering both
buses and goods delivery, focusing on sustainable implementations best suitable for the
Finnish traffic conditions. The thesis does not cover rail traffic or any hybrid-electric
vehicle (HEV) technologies. Some marginal electric vehicle technologies that do not
seem to be capable of providing respectable enough transit solutions are either left out
2
of the study or discussed very briefly. The study emphasises electric vehicle solutions
that enable an economically viable use of extensive vehicle fleets.
The work contributes to a larger project, also referred to as SIMBe (Smart Infrastruc-
tures for Electric Mobility in Built Environments). The purpose of SIMBe is to acceler-
ate the introduction of sustainable, electric mobility in Finland. This study aims for pre-
senting issues challenging the vehicle electrification in the Helsinki metropolitan area.
One of the goals of this work is to reflect the attitudes of some local transport compa-
nies, which will help understand the level of openness to vehicle electrification in the
Helsinki region.
The beginning of the thesis presents information about trolley buses, fuel cell buses
(FCBs) and battery-electric buses (BEBs) in Chapters 2, 3 and 4, respectively. These
chapters give a view of the basic technical features, related infrastructure, prices, as well
as the current and prior use of the aforementioned vehicle technologies. Also environ-
mental issues – e.g., generated emissions and exhausts – are covered in brief. Vehicle
technology-specific information is given when appropriate. For instance, characteristics
of the hydrogen fuel cell and vehicle battery technologies are addressed in Chapters 3
and 4, respectively. This information is generally applicable to all vehicles (i.e., not only
buses) utilising fuel cells or batteries for propulsion. Chapter 5 condenses the knowl-
edge of the three prior chapters adding some supplementary, supportive information. In
Chapter 6, the attitudes towards electrification and possible vehicle technologies for
regional bus transport are evaluated through an interview with a transport authority op-
erating in the Helsinki metropolitan area. Chapter 7 discusses the role of the delivery of
goods in the introduction of electric vehicles. Moreover, the chapter gives a brief view
of the efforts made for vehicle electrification in the Finnish mail delivery through a
quick interview with a Finnish postal transport company. Finally, Chapter 8 concludes
the thesis by presenting a few essential points about the feasibility of different electric
vehicle technologies in the Finnish bus and delivery traffic.
1.3 References and methods of research
The electric vehicle technologies discussed in the thesis were chosen based on informa-
tion gathered from various Internet sources, scientific articles and books. The emphasis
is on the public Internet sources since there is little information available in scientific
literature about the research subject. Additionally, two major transport companies in the
Helsinki metropolitan area were interviewed. The interviews contribute to the study by
providing information about the current use of different vehicle technologies, as well as
showing the attitudes towards alternative vehicle technologies in the Helsinki region.
3
Thus, the feasibility of the discussed electric vehicle technologies is partly addressed
through these interviews.
The thesis compares several quantitative and qualitative parameters of the considered
electric vehicle technologies with each other. Quantitatively, the technologies are mainly
analysed in terms of efficiency, energy consumption and emissions, as well as vehicle
range, expected lifetime and occurred costs. Moreover, the need for additional infra-
structure and maintenance is examined. The study occasionally uses the terms ‘tank-to-
wheel’, ‘well-to-tank’ and ‘well-to-wheel’ to help define the efficiencies of the vehicles
and the production of electricity or hydrogen fuel (see Abbreviations and terms). The
qualitative comparison takes into account factors like passenger comfort and infrastruc-
ture-related aesthetics. The results and conclusions are mainly presented from a trans-
port operator or passenger point of view.

4
2 Trolley buses
2.1 Background of the trolley bus – future prospects
The past experiences with trolley buses have been versatile. The first attempts using a
trolley bus – that one referred to as Elektromote – were conducted in 1882 without any
appreciable success. Later in the beginning of the twentieth century, Lombart-Gerin
managed to build probably the first working trolley bus line for the Paris Exhibition of
1900. [1] Trolley buses were first introduced in Finland in the late 1940s. Helsinki
started trolley bus traffic on 5th February 1949 [2]. Another town to begin trolley bus
traffic in Finland was Tampere. Compared with diesel buses, trolley buses offered more
effective driving with better acceleration and higher travel speed. The longevity and
economic efficiency also favoured these vehicles. In Helsinki, the largest trolley bus line
comprised 26 operating trolley buses. Figure 1 presents a trolley bus of that time with
the included infrastructure in Helsinki. [3]
Figure 1: A trolley bus on line #14 in Helsinki. Photo by Suomen Raitioseura
ry. [2]

5
However, in Helsinki, diesel buses began their rally in the 1960s, as they started to sub-
stitute trolley buses. Diesel buses developed quickly and displaced the interest in electric
mobility. Diesel now offered better operating characteristics, and as they were seem-
ingly more flexible than trolley buses, they began to increase in popularity. Generally,
environmental factors were not driving technical development. The trolley bus network
did not expand in Finland. In contrast to the Finnish traffic planning, there were other
European countries promoting the use of trolley buses. For instance, in Switzerland,
diesel buses were left as poor challengers. Switzerland had plenty of electricity pro-
duced by hydroelectric power plants, and while the Swiss typically had appreciated
clean, peaceful city surroundings, trolley buses were an advantageous, natural addition
to their traffic planning. Until now, along with some East European countries, Switzer-
land has kept its trolley bus traffic active. [3]
Although the diesel bus was forcefully gaining momentum, the city of Helsinki did not
immediately dispense with all the trolley buses. As late as in 1973, Helsinki tried three
new Russian trolley buses. The results were not admirable. One year after that, it was
decided to close down the trolley bus traffic. Tampere proceeded the same way and quit
the operation two years after Helsinki had come to its decision. Some efforts were made
to give a rebirth to trolley bus traffic after the closures, but these efforts simply came
short of their objective, and trolley buses were continuously seen as a too expensive
option. In Helsinki, it was estimated that the trolley bus system – compared with a simi-
lar traffic arrangement implemented with diesel buses – would incur approximately 15
percent higher costs [2]. In 1985, the city government confirmed the decision concern-
ing the dismantling of the trolley bus line. Yet, the city government stated that the op-
tion of trolley buses would be reconsidered in the future, if the technical or economic
situation would notably change. [3]
Since 1970, the interest towards trolley buses has been increasing on an international
level. There has been more emphasis on environmental thinking, which has favoured
trolley buses in respect to their low noise levels and minimal pollution generation. One
has financially supported public transport, and more emphasis has been put on societal
thinking. Tax subsidies and other economic aid have been allocated for trolley bus sys-
tems [2]. This has helped transport operators boost their environmental attitudes and
awareness. Positive attitudes towards increasing the use of trolley buses have strength-
ened along with the pursuit of reduced oil dependency. [4]
At present, approximately 400 trolley bus systems in various cities around the world are
active. About 300 of these are located in post-Soviet states. Western Europe comprises
around 50 systems. Nordic countries have trolley buses in Bergen, Norway and in
Landskrona, Sweden. Figure 2 illustrates an active trolley bus on the line in Landskrona.

6
The closest trolley bus system from a Finnish perspective can be found in Tallinn, Esto-
nia. [2]
Figure 2: A trolley bus in service in Landskrona, Sweden [5]
Cities that already run trolley buses are now rehabilitating their fleets. During the last
decade, Athens in Greece, Arnhem in Holland and Sarajevo in Bosnia and Herzegovina
among other European cities have expanded their existing trolley bus systems. Old vehi-
cles have been upgraded. Trolley buses have also been used in some Asian and Latin
American countries. Besides the renovation of old systems, several countries – e.g.,
Canada, China, England, Belarus, Czechoslovakia, France, Italy, Russia, Spain, Switzer-
land and the United States – have been introducing new, advanced trolley bus models in
recent years. [2] [4] [6]
Now, some 25 years after the Helsinki city government’s decision to close down the
trolley bus traffic, the concept of trolley bus evokes serious governmental interest again.
Introductions of new trolley bus systems in other countries, as well as strict domestic
and international environmental goals have had a strong influence on the Finnish traffic
planning. In 2009, the planning unit of Helsinki city transport published a feasibility
study on possible trolley bus systems in Helsinki. [3]

7
2.2 Basic characteristics of trolley buses
Trolley buses have some unique features. The steering system and vehicle body of a
trolley bus are practically similar to those of normal diesel buses. Though, there have
been differing vehicle body concepts on the market recently [3]. The newest models are
very similar to modern trams [2]. In contrast to diesel buses, trolley buses are character-
ised by electric propulsion and attachment to overhead wires. This feature – trolley poles
– makes them similar to rail traffic modes. The route of a trolley bus is fixed because of
the stationary essence of the overhead wires that give the vehicle its electric power.
Trolley buses create more powerful traction than diesel buses. They accelerate smoothly
but quickly; excellent torque properties of electric motors help trolley buses climb up
steep hills. [4]
At present, it is very frequently seen that trolley buses carry particular auxiliary power
units (APU) which keep them in motion, whenever the overhead wires are not available.
APUs increase the reliability of trolley buses as a traffic mode. With the help of an
APU, a trolley bus can pass obstacles in traffic, as well as drive differing routes depend-
ing on the traffic demands. Trolley buses are thus not so sensitive to traffic disturbances
as trams or other fixed traffic modes with rails. [3]
Typically, trolley bus APUs are diesel internal combustion engines (ICEs). The most
advanced solutions use chemical batteries and capacitors as an on-board energy storage
system (ESS). Diesel ICEs range normally from a 50-kW booster motor to a 200-kW
engine. With a small booster it is possible to move small distances with low speed. This
makes it possible for trolley buses to avoid stops caused by maintenance work or other
disturbances. The booster also enables moving on depots, if no overhead network is
available. A larger engine can be a real option for electric propulsion supplied by the
overhead network. Vehicles with two concurrent propulsion systems which can be run at
similar power levels are commonly referred to as dual-mode vehicles. The use of a bat-
tery and capacitor assisted ESS induces greater expenses than a correspondent diesel
ICE. However, in the most advanced systems, super capacitors of a greater capacity can
be charged at bus stops, making it possible for the vehicle to have no wire contact en
route. Naturally, such vehicles would not be described as trolley buses, more likely they
would be classified as super capacitor buses. [3]
Trolley buses are mostly equipped with alternating current (AC) motors. Earlier models
often used direct current (DC). However, AC motors are lighter, assembled of less ex-
pensive parts, and their speed regulation is better. Electric traction motors can be used as
effective, advantageous electric brakes. Compared to average mechanical brakes, elec-
tric brakes significantly reduce the wear of mechanical braking components and tyres.
The electric braking energy can either be dissipated in the vehicle’s resistors, when the
8
vehicle decelerates, or used to charge possible batteries and capacitors of the vehicle, or
simply fed back into the overhead network. Conducting the braking energy back into the
system is commonly referred to as regeneration or recuperation of electric energy. [6]
[7]
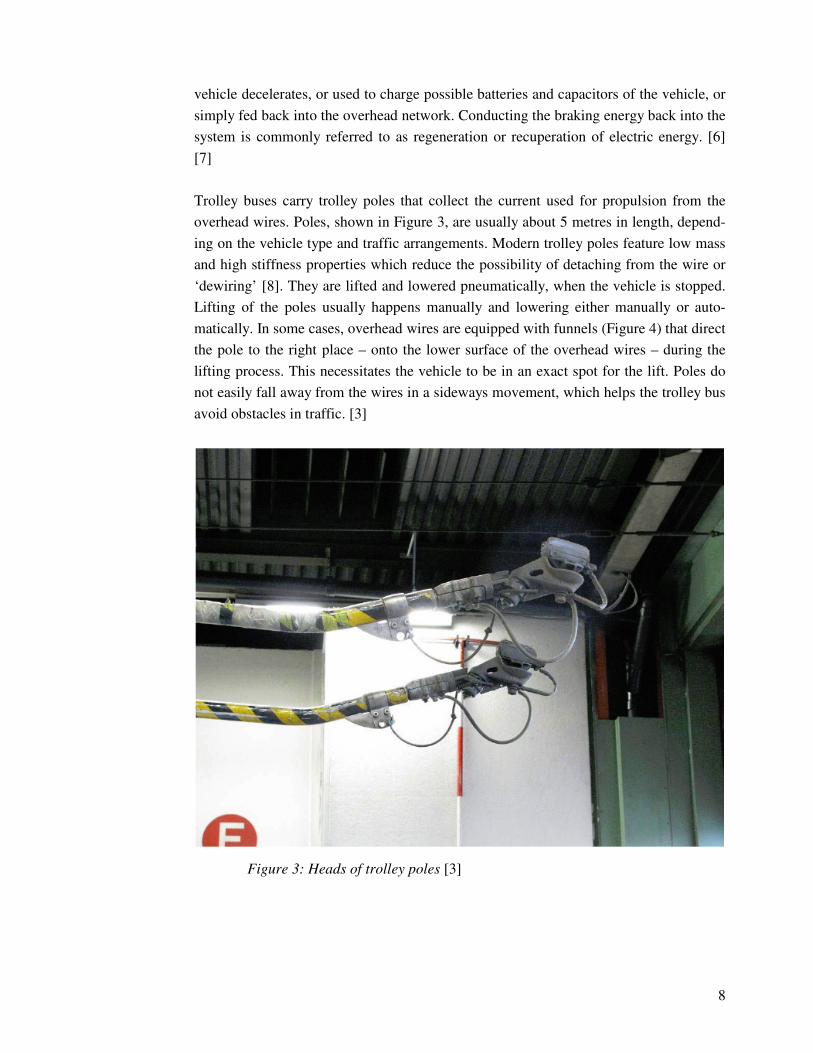
Trolley buses carry trolley poles that collect the current used for propulsion from the
overhead wires. Poles, shown in Figure 3, are usually about 5 metres in length, depend-
ing on the vehicle type and traffic arrangements. Modern trolley poles feature low mass
and high stiffness properties which reduce the possibility of detaching from the wire or
‘dewiring’ [8]. They are lifted and lowered pneumatically, when the vehicle is stopped.
Lifting of the poles usually happens manually and lowering either manually or auto-
matically. In some cases, overhead wires are equipped with funnels (Figure 4) that direct
the pole to the right place – onto the lower surface of the overhead wires – during the
lifting process. This necessitates the vehicle to be in an exact spot for the lift. Poles do
not easily fall away from the wires in a sideways movement, which helps the trolley bus
avoid obstacles in traffic. [3]
Figure 3: Heads of trolley poles [3]

9
Figure 4: Funnels on overhead wires [3]
Trolley buses hold greater transport capacity than normal buses, but lag behind trams in
contrast. Trolley buses are generally articulated with one or two articulations and are in
some cases up to 24 metres long. But even the largest trolley buses hold less transport
capacity than trams because of the size difference. [3]
All new European trolley buses have low floors or at least a kneeling function, which
makes it easier for people to enter and leave the vehicle. Low floors and easy access to
the vehicle creates customer satisfaction and reduces costs generated by the unnecessary
waiting time, when people are boarding or alighting. Noteworthy is that also electric
traction motors contribute to the benefits achieved by low floors. Trolley buses usually
have a single traction motor connected straight to the drive shaft without any gearbox or
clutch [7]. In newer models, motors are often implemented as so called wheel hub drives
which are mounted next to each drive wheel into the wheel hub. Trolley buses with
wheel hub drives do not need long drive shafts, so the whole floor of the vehicle can be
made flat without any angles or elevations. This eliminates the idea of utilising old
buses with drive shafts in trolley bus conversion. Wheel hubs drives enable implement-
ing innovative structures in trolley buses. Seats, for example, can hang from strength-
ened walls to free the even floor space for easy cleaning. [6]
10
Modern trolley buses have various similarities. A closer look at Škoda’s web pages re-
veals that nearly all new or newish trolley bus models are equipped with low-floor fea-
tures. Additionally, they hold a full air conditioning and an audio-visual passenger in-
formation system. Almost all modern trolley buses have a kneeling function to increase
passenger comfort. The trolley bus model in Landskrona, Sweden has NiMH batteries
for autonomous running. Every Škoda trolley bus model also has recuperation function-
ality for braking energy. [9]
The newest trolley bus model of Škoda, the ŠKODA 24 Tr IRISBUS, has an asynchro-
nous traction motor of 210 kW. It holds 28 seats and 58 places for standing passengers.
The vehicle has a modular design, which allows the buying customer to decide the de-
tails implemented in the vehicle. Uncharacteristically, the ŠKODA 24 Tr IRISBUS has
two APUs – a diesel engine and traction batteries alike. [9]
2.3 Infrastructure on roads and trolley bus depots
Even though trolley buses use overhead wires to function, they cannot use the same
wires with trams. An electrotechnical reason limits the use of shared wires. Trams have
a single electric supply wire. They use rails as a return current path, whereas trolley
buses must have two overhead wires, one for the electricity supply and another for the
return current. [3]
An essential part of the trolley bus network is the power supply through electrical sub-
stations. To monitor the return current in an appropriate way, and for the sake of electri-
cal safety, line outputs from substations must be made separately for trolley buses and
trams. Moreover, the adequacy of the substations must be examined. In Helsinki, new
substations are not necessarily needed for new trolley buses, if the overall power re-
quirement of the utilised vehicles stays under the supply capacity of the substations.
Furthermore, the existing substations are most probably dimensioned considering the
energy consumption of trams, which is higher than the consumption of trolley buses.
This supports the idea of trolley buses utilising already existing substations. When
needed, stations can be strengthened with super capacitors to support the voltage level.
However, it would be necessary to build new substations in areas outside the electric
supply for trams. Trolley buses typically require one substation for every three line
kilometres. [3]
Existing systems for trolley bus power supply range from 600 to 1,000 V DC. The most
probable option for Helsinki city traffic would be 750 V DC. The Helsinki city has
planned to reshape the power supply system for trams. The intention is to switch from
600 to 750 V DC. Using a common voltage level would enable the use of identical
11
power supplies for both trams and trolley buses. Using a higher voltage level also makes
it possible to have lighter, cheaper overhead wires because of reduced supply current.
Added to this, lighter wires are visually less disturbing. [3] [8]
A couple of different types of cables and wires are required in a trolley bus network. The
power supply for the overhead wire network consists of cables from tens to a few hun-
dred metres long. Direct current produces an electromagnetic field around the cable.
Electromagnetic fields are phenomena that are intensively studied for health reasons.
Nevertheless, electromagnetic fields generated by overhead wires for trolley buses are
milder than the fields generated by tram lines. The wires for supply current and return
current partly compensate each other. Overhead wires typically hang 5.5 metres above
the street surface. Wires situated very high up weaken the possibility of sideways mo-
tion. Normally, a trolley bus can move about 4 metres to each side. Overhead wires re-
quire supporting structures that are typically used for all the wires simultaneously. A
two-way trolley bus lane consists of four copper wires which can be supported with the
same supporting structures. Trolley buses using partly common driving lanes need
‘points’ or ‘switches’ in the overhead line structure in order to direct trolley poles to the
right place. There are mechanical and electrical points. The operation of electrical points
can be controlled. Mechanical points only have a single functionality. Modern points
and well-functioning overhead wires enable trolley buses to operate without having to
decelerate [8]. An overhead wire network also includes several wire crossing mecha-
nisms, electrical separators, an electrical feeding point infrastructure and supports for
the wiring. [3]
Trolley bus depots generally require an overhead wire network enabling easy movement
of vehicles. Though, it is possible to avoid heavy wiring systems in the depots by de-
ploying trolley buses with APUs. Depots must have equipment for live working and
other maintenance work. For live working, it is necessary to have special hoist frames,
because usually all the electrical equipment is on the roof of the vehicle. In the depot,
trolley buses should be covered by at least some kind of roof. Preferably, they should
stay in a space equipped with both a roof and walls. Depots must have enough room for
washing the trolley bus chassis as well. In Helsinki, the main concern over having trol-
ley buses in the depots is the lack of space or the difficulty of utilising the space in an
effective manner. Special arrangements in maintenance rooms and depot interiors
should be considered at all existing depots, if trolley buses were introduced in Helsinki
city traffic. The use of trolley buses would also affect other traffic – the placement,
maintenance and driving schedules of other vehicles, etc. [3]
Trolley bus systems commonly require street level rebuilding. In addition to the charac-
teristic supporting structures and overhead line networks, the use of trolley buses may
involve arrangements in lane structures. Occasionally, routes with only one lane are

12
built to avoid surplus costs. In that case, the lane should work in both ways without cre-
ating excessive congestion. A typical system involves two lanes, one for each direction,
enabling simultaneous two-way traffic. [3]
2.4 Costs of trolley bus investment, maintenance and in-
frastructure
Acquisition costs of trolley buses have reduced during the twenty-first century. Reasons
behind this originate from increased demand. Trolley bus production has become more
efficient and competition in the market has gained momentum. In recent years, the aver-
age price of a trolley bus offered by most known competitors has varied between EUR
450,000 and EUR 750,000 (2009). An illustrative point of comparison here would be
the price of a diesel bus that is around EUR 250,000 – 350,000 (2009). Certain technical
characteristics affect the price in both cases. Slightly booming trolley bus markets have
generated a secondary market where fully operational vehicles can be bought for under
half price. [3]
An investment in trolley buses necessitates commitment to it. Initial investments and
renewal rates of specific technology-related equipment are clearly higher than those of
average diesel buses. Also the rehabilitation of a trolley bus fleet induces greater expen-
ditures. [3]
On the contrary, the operating life of a trolley bus is significantly higher. It can reach
between 16 – 20 years, whereas diesel buses must be substituted every 14 – 15 years.
The motor of a diesel vehicle creates vibration that fatigues the body of the vehicle.
Therefore, diesel bus fleets must be substituted more often. [3]
The costs of a trolley bus infrastructure consist of different variables. This is shown in
the Helsinki feasibility study on trolley bus systems. Basically, there are two main cost
components. A direct current substation, including its shed, costs around EUR 500,000.
An overhead wire network for a two-way trolley bus lane incurs expenditures of ap-
proximately EUR 300,000 per kilometre including the supporting structures. Addition-
ally, electrical points for choosing the route cost EUR 55,000 each. Overhead wires
typically cross each other on the streets. Mechanisms for these crossings usually cost
tens of thousands of Euros. Poles for supporting the wires cost a few thousand Euros
and remote-controlled electrical separators around EUR 15,000 per piece. An electrical
feeding point without a separator is worth EUR 6,500 including its installation. The
aforementioned prices are from 2009. [3]

13
According to the pronouncement of a Swedish local traffic company, AB Storstock-
holms Lokaltrafik, the overall surplus cost of a trolley bus system compared with an
average bus system would be approximately 6 – 17 percent. This estimation takes into
account expenditures incurred from trolley bus fleet investment, infrastructure, insur-
ance, energy used and maintenance. The operating life of the trolley bus fleet is also
considered. The estimation is based on UITP (International Association of Public
Transport) studies. In some cases, the system implemented could be much more expen-
sive depending on the expensiveness of the overhead wires, related infrastructure and
the size of the system. AB Storstockholms Lokaltrafik names the small-size trolley bus
system of Landskrona, Sweden, to give an example of a system much more expensive
than an average trolley bus system. [10]
2.5 Impacts on environment
Trolley buses carry passengers rather efficiently. Compared to diesel vehicles, trolley
buses provide a few clear advantages. In general, it is seen that every power plant holds
better efficiency producing electricity than the efficiency of a combustion engine. The
Helsinki feasibility study on trolley bus systems suggests that trolley buses consume 2.5
kWh of energy per kilometre. This value considers the total amount of energy used by a
trolley bus with one articulation. The feasibility study brings out an aspect regarding the
location of trolley bus emissions. Nitrogen oxides (NOX) and particulate matter (PM)
emissions of diesel buses endanger the people next to the vehicle, whereas the compara-
ble emissions of trolley buses are concentrated close to the power plant, where the elec-
tricity is produced. [3]
Environmental impacts of a rubber tyred trolley bus remain low. A trolley bus does not
generate exhausts at all. The only harm to the environment occurs from the detrimental
dust that comes off the tyres of a moving trolley bus. Consequently, trolley buses do not
need any exhaust pipes. In auxiliary power unit application cases, trolley buses may also
produce exhausts, but only when working on the APU. The noiselessness of electric
drives also involves added value for the city environment. Occasionally, the overhead
wire networks can be visually disturbing, while especially the junctions of several wires
and switches are dominating the street view. In order to mitigate the visual inconven-
ience, trolley bus systems are increasingly equipped with overhead wires of stainless
steel [6]. [4]
14
3 Fuel cell buses
3.1 A brief history and development of fuel cells
The technology for a fuel cell was first discovered in 1839, when William Grove used
reversed water electrolysis to generate electricity from hydrogen and oxygen. With the
help of fuel and an oxidant, a fuel cell converts chemical energy into electric energy in a
continuous manner. A fuel cell resembles an engine with its continuous fuel consump-
tion, and batteries because of their electrochemical processes. [11]
The first practical application of a fuel cell provided the Gemini and Apollo space pro-
grammes a means to generate electric power and drinking water. Water and heat are the
only by-products generated in the operation of a fuel cell, when pure hydrogen (H2) is
used as fuel [12]. These space programmes utilised polymer electrolyte membrane fuel
cell or proton exchange membrane fuel cell (PEMFC) technology – invented by General
Electric in the 1960s. However, the PEMFC technology was overly expensive because
of the platinum used as a catalyst on the electrodes of the fuel cell. The use of PEMFCs,
which later became extremely important for the transport sector, was restricted to space
applications. [11] [13]
In the early 1980s, a company referred to as Ballard Power Systems Inc. began to rede-
velop the earlier abandoned PEM fuel cell of General Electric. The company pursued for
cheaper materials and methods to produce PEM fuel cells. [13] The late 1980s and early
1990s were a significant period for fuel cells in transport. Conventional diesel-powered
transit buses could not compete with hydrogen and other alternative fuels when the in-
terest in reducing emissions saw its rise. Proofing the reliability of fuel cell buses
(FCBs) under various circumstances as a part of public transport formed the main target
for the industry. Reliability issues are confronted presently as well. However, after vari-
ous fuel cell transit bus demonstrations, it is now truly recognised that fuel cell tech-
nologies can compete with conventional propulsion technologies. [14]

15
3.2 PEMFC technology for transport
The future of modern fuel cells in the transport sector looks optimistic. In general, fuel
cells are extremely attractive because of their capability to emit zero or very low levels
of emissions. Fuel cells are also more efficient than average ICEs (e.g., PEM fuel cells
typically provide efficiencies between 40 and 60 percent) [15]. The high efficiency is
mainly based on the electrochemical characteristics of the fuel cell power generation
process. [11]
PEM fuel cells provide end-user applications in three main categories. Transport appli-
cations include buses, light-duty and specific niche applications. The two other catego-
ries involve stationary use of PEMFCs and portable PEMFC-powered devices. The pro-
portional use of PEMFCs by application area is shown in Figure 5. The transport sector
holds around 15 percent of the total end use. Although PEM fuel cells are mainly used
in not vehicle-related applications and buses embrace only a fraction of the total end
use, PEMFCs are recognised as the most applicable fuel cell type for the automotive
industry, including buses [16]. [15]
Figure 5: Proportions of globally installed PEMFC-powered applications [15]
A simple description is enough to show the basic functionality of a PEM fuel cell. A
thin, permeable polymeric membrane works as the electrolyte in the fuel cell. On both
sides of the membrane, platinum-based electrodes catalyse the electric power-creating
reaction. In the basic process, hydrogen molecules are exposed to the anode, where they
split into hydrogen ions (protons) and electrons. Protons are capable of permeating the
polymeric membrane, whereas the electrons – the electric current – are led to an external
circuit. In vehicular applications, the current is mainly fed to propulsive electric motors.
Oxygen from the air and electrons from the external circuit combine with the hydrogen

16
ions at the cathode to form heat and water. An illustration of the basic fuel cell process
can be found in Figure 6. [15] [17]
Figure 6: The concept of a fuel cell [18]
From various fuel cell types, the PEMFC has proven to be the favourite choice of mod-
ern transport. PEMFCs have the advantage of being both lightweight and compact.
Their power-to-weight-ratios are often high, which is counted as an advantage in auto-
motive usage [18]. The typical electric power attained by a PEM fuel cell is up to 250
kW. The operating temperatures of PEMFCs are low, typically approximating 60 – 80
°C [19]. This makes a quick start-up of the fuel cell vehicle possible. Additionally, a
solid electrolyte membrane enables the use of a less expensive sealing for gases pro-
duced in the anode and cathode. Compared with some other electrolyte materials, the
polymeric membrane also avoids corrosion better, which extends the life expectancy of
the fuel cell. [15]
A few technical difficulties with PEM fuel cells occur from the characteristics of the
fuel cell type. The most commonly used membrane type for PEMFCs is Nafion by Du-
Pont. This membrane type must be saturated with water to achieve appropriate operating
conditions. Local drying of the membrane exposes it to degradation. Another issue con-
cerns the operating temperature. The trade-off with the typically low operating tempera-
ture of PEMFC is the lack of excess heat from the fuel cell. The amount of heat pro-

17
duced is often inadequate for cogeneration. Thus, one must find out other methods to
arrange the heating of the interior in PEMFC-powered vehicles. The heating issue par-
ticularly concerns countries with cold, harsh climates, such as Finland. [15] [20]
As an alternative to PEMFCs that use pure hydrogen as fuel, various automotive manu-
facturers have considered fuel cells that utilise methanol. For instance, reformed metha-
nol fuel cells (RMFCs) and direct methanol fuel cells (DMFCs) use methanol as a car-
rier for hydrogen. An RMFC has an auxiliary reformer for converting methanol to hy-
drogen and other substances. Methanol is relatively easy to transport and could solve
several problems related to the hydrogen storage, transport and distribution. However,
these fuel cell types generate carbon dioxide (CO2) emissions, whereas PEMFCs pro-
vide operation totally free of CO2. [21] [22]
3.3 Use of fuel cells in modern public transport – a look at
the available technology
Hydrogen has been utilised in various public transport projects since the early 1990s.
Hydrogen fuel cell-powered vehicles and hydrogen-fuelled ICEs, as well as other fuel-
ling and related technologies have been promoted widely worldwide. Demonstration
projects in the United States, Europe, China, Japan and Australia have introduced a di-
verse range of new technologies into the markets. Only during the past decade, more
than 20 cities have utilised hydrogen-powered buses in their bus repertoire. [23]
Assessing the durability of hydrogen fuel cell buses has interested several parties, and
therefore, various demonstrations have been used to control the impacts of long duty
cycles on the vehicles. [23] In order to increase competitiveness in the transport sector,
the fuel cell industry has had various practical objectives: reducing the size, as well as
increasing the power density of fuel cell stacks; reducing the overall weight of fuel cell
systems including electric propulsion; developing a hydrogen infrastructure to effi-
ciently service vehicular use; optimising electric motors and control systems; proofing
electric propulsion systems safe for transit vehicles, and capable of operating dependa-
bly under extreme weather conditions. Diverse fuel cell bus demonstration projects im-
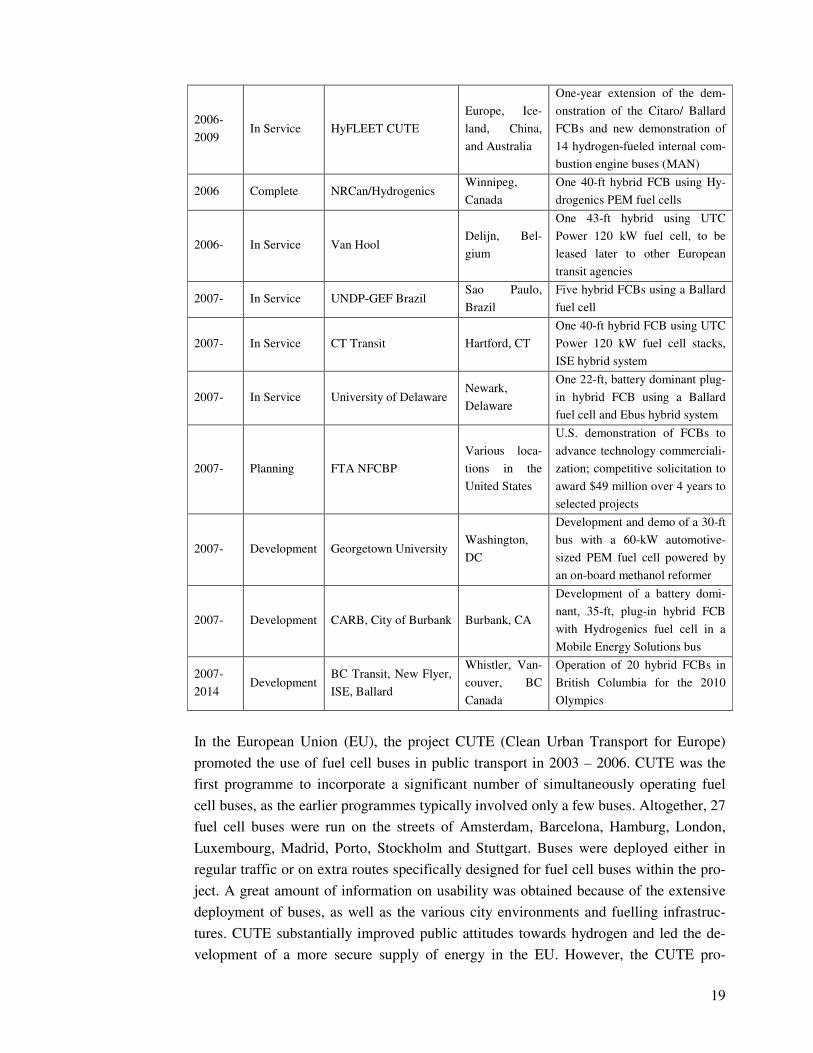
plemented around the world are presented in Table 1. [14]

18
Table 1: An overview of the fuel cell bus demonstrations worldwide [14] [24]
[25]
Project
Dates Status Project Location Description
1994-
1995 Complete
Federal Transit Ad-
ministration
(FTA)/Georgetown
Various
Three 30-ft FCBs operating on
methanol using 100 kW phospho-
ric acid fuel cell (PAFC) stacks
from Fuji
1998 Complete FTA/Georgetown Various
40-ft FCB operating on methanol
using 100 kW PAFC from UTC
Power
1998-
2000 Complete Ballard Phase III
Chigago, IL,
and Vancou-
ver, Canada
Test program with six 40-ft FCBs
using 205 kW proton exchange
membrane fuel cell stacks from
Ballard
2000-
2001 Complete Ballard Phase IV
Thousand
Palms, CA
Test bus using 200 kW PEM fuel
cell stack from Ballard
2000- In Service CityCell Turin, Italy
One UTC Power 60 kW power-
plant, hybrid bus, showcased in
2006 Winter Olympics
2000-
2003 Complete CityCell Madrid, Spain
One UTC Power 60 kW power-
plant, hybrid bus
2001 Development FTA/Georgetown Various
40-ft FCB operating on methanol
using 100 kW PEM fuel cell
stack from Ballard
2002-
2002 Complete
ISE/UTC Power Thun-
derPower
Thousand
Palms and
Oakland, CA
ThunderPower 30-ft FCB using
60 kW PEM fuel cell stack from
UTC Power, ISE hybrid system
2003-
2006 Complete CUTE, ECTOS, STEP
Europe, Ice-
land, and Aus-
tralia
33 40-ft FCBs using Ballard
PEM fuel cell stacks
2003-
2006 In Service
Hino/Toyota FCB -
JHFC Japan
Eight 40-ft hybrid FCBs with
Toyota PEM fuel cell stacks
2004-
2007 In Service VTA San Jose, CA
Three 40-ft FCBs using Ballard
fuel cell stacks
2004-
2006 In Service UNDP-GEF China Beijing, China
Three 40-ft FCBs using Ballard
PEM fuel cell stacks
2004- In Service SunLine Thousand
Palms, CA
One 40-ft FCB using UTC Power
fuel cell stack, ISE hybrid system
2004- In Service Hickam AFB Honolulu, HI
One battery dominant plug-in
hybrid FCB with Hydrogenics
PEM fuel cell and Enova hybrid
system
2005-
2007 In Service AC Transit Oakland, Ca
Three 40-ft FCBs using UTC
Power fuel cell stacks, ISE hybrid
system
19
2006-
2009 In Service HyFLEET CUTE
Europe, Ice-
land, China,
and Australia
One-year extension of the dem-
onstration of the Citaro/ Ballard
FCBs and new demonstration of
14 hydrogen-fueled internal com-
bustion engine buses (MAN)
2006 Complete NRCan/Hydrogenics Winnipeg,
Canada
One 40-ft hybrid FCB using Hy-
drogenics PEM fuel cells
2006- In Service Van Hool Delijn, Bel-
gium
One 43-ft hybrid using UTC
Power 120 kW fuel cell, to be
leased later to other European
transit agencies
2007- In Service UNDP-GEF Brazil Sao Paulo,
Brazil
Five hybrid FCBs using a Ballard
fuel cell
2007- In Service CT Transit Hartford, CT
One 40-ft hybrid FCB using UTC
Power 120 kW fuel cell stacks,
ISE hybrid system
2007- In Service University of Delaware Newark,
Delaware
One 22-ft, battery dominant plug-
in hybrid FCB using a Ballard
fuel cell and Ebus hybrid system
2007- Planning FTA NFCBP
Various loca-
tions in the
United States
U.S. demonstration of FCBs to
advance technology commerciali-
zation; competitive solicitation to
award $49 million over 4 years to
selected projects
2007- Development Georgetown University Washington,
DC
Development and demo of a 30-ft
bus with a 60-kW automotive-
sized PEM fuel cell powered by
an on-board methanol reformer
2007- Development CARB, City of Burbank Burbank, CA
Development of a battery domi-
nant, 35-ft, plug-in hybrid FCB
with Hydrogenics fuel cell in a
Mobile Energy Solutions bus
2007-
2014 Development
BC Transit, New Flyer,
ISE, Ballard
Whistler, Van-
couver, BC
Canada
Operation of 20 hybrid FCBs in
British Columbia for the 2010
Olympics
In the European Union (EU), the project CUTE (Clean Urban Transport for Europe)
promoted the use of fuel cell buses in public transport in 2003 – 2006. CUTE was the
first programme to incorporate a significant number of simultaneously operating fuel
cell buses, as the earlier programmes typically involved only a few buses. Altogether, 27
fuel cell buses were run on the streets of Amsterdam, Barcelona, Hamburg, London,
Luxembourg, Madrid, Porto, Stockholm and Stuttgart. Buses were deployed either in
regular traffic or on extra routes specifically designed for fuel cell buses within the pro-
ject. A great amount of information on usability was obtained because of the extensive
deployment of buses, as well as the various city environments and fuelling infrastruc-
tures. CUTE substantially improved public attitudes towards hydrogen and led the de-
velopment of a more secure supply of energy in the EU. However, the CUTE pro-

20
gramme also showed that fuel cell and related technologies were not perfectly finalised
and the operation of fuel cells should be improved through re-engineering. [24] [26]
An Icelandic project ECTOS (Ecological City TranspOrt System) aimed for demonstrat-
ing the status quo of the modern hydrogen technology in Iceland. ECTOS concentrated
on studying socio-economic influences within changing the energy base of an urban
society. [27] The project ECTOS deployed three fuel cell buses, starting in 2003. The
project was based on a grant of EUR 3.8 million from the European Commission. The
original ECTOS project was closed down in 2005 but run under another programme for
a year afterwards. In total, ECTOS buses travelled nearly 90,000 kilometres using
slightly over 17.3 tonnes of hydrogen. [23]
The STEP (Sustainable Transport Energy Project) project explored the use of alternative
energies in transport in Perth, Australia. STEP was supported by the Australian govern-
ment. [28] The flagship project for the STEP project, the EcoBus fuel cell bus trial,
lasted for two years from 2004 to 2006. EcoBus was a success and contributed to the
STEP project by achieving great environmental savings. 300 tonnes of exhaust carbon
emissions were avoided, and over 320,000 passengers were carried during the trial. Al-
together, the three buses used in the trial travelled 258,000 kilometres and consumed 46
tonnes of hydrogen as fuel. [29]
All three projects were continued under the global HyFLEET:CUTE programme that
was established by the European Commission in January 2006 to follow the productive
work of the former CUTE programme. The projects originally referred to as ECTOS and
EcoBus were run an extra year between 2006 and 2007. The HyFLEET:CUTE project
lasted till the autumn of 2009 and employed 33 fuel cell buses in nine cities around the
world. The CUTE, ECTOS and STEP projects consumed 229 tonnes of hydrogen, while
the HyFLEET:CUTE project had a consumption of 326 tonnes. On-site production of
hydrogen in HyFLEET:CUTE reached 158 hydrogen tonnes. A majority of this hydro-
gen was produced with renewable energy. [23] [25]
Earlier fuel cell bus projects have encouraged transit agencies and other players in the
field to proceed with the development. One illustrative example of the deployment of
fuel cell buses comes from the United States. Transit operators AC Transit, Santa Clara
VTA and SunLine Transit Agency in the United States collected valuable data – to as-
sess costs, fuel consumption, reliability, performance and customer acceptance – from
fuel cell buses from 2005 through 2007. The operators now run fuel cell buses partly on
regular service routes. Some of the buses operate 16 hours per day throughout the whole
week. Currently, more transit agencies are about to join the programme initially fi-
nanced by a federal transit authority. [30] [31]

21
Some of the buses utilised in the latter programme were powered by UTC Power, a unit
of United Technologies Corporation [24]. In January 2010, UTC Power reported that
one of its latest generation PureMotion® Model 120 fuel cell power plants for hybrid-
electric transit buses had surpassed 5,000 hours of operation in common transit service.
Noteworthy is that the buses had only used the original fuel cell stacks with no cell re-
placements. PureMotion® Model 120 is based on PEMFC technology [32]. UTC Power
Vice President (Transport) Ken Stewart highly appreciated the achievement and saw
fuel cell stack durability as the key factor in commercialising fuel cell vehicles (FCVs)
worldwide. The Hydrogen Bus Alliance has set a target concerning commercial fuel cell
stacks in buses. The purpose is to attain 20,000 operational hours by 2015 [33]. [31]
One of the newest PEMFCs for automotive usage is the hydrogen-powered FCveloc-
ity™-HD6 fuel cell of the Canadian Ballard Power Systems Inc. The fuel cell, shown in
Figure 7, is intended for buses and heavy duty vehicles. The two sizes – 75 kW and 150
kW – can supply voltage levels of 275 – 400 V DC and 550 – 800 V DC, respectively.
FCvelocity™-HD6 provides a rated current of 300 A, and has a volume of 0.55 m3. Its
operation temperature is around 63 °C. The protection against dust and moisture fulfils
the requirements of enclosure class IP54. The bigger FCvelocity™-HD6 module weighs
less than 400 kg when dry. The smaller one weighs approximately 50 kg less. The life-
time target for this particular PEMFC is up to 6,000 hours. [19] [34]
Figure 7: The FCvelocity™-HD6 fuel cell [34]
Ballard introduced a fleet of 20 fuel cell buses operating on FCvelocity™-HD6 technol-
ogy for the Olympic and Paralympic Winter Games in Canada (2010). The fleet was
integrated into the regular service of BC Transit – a local transport agency in Whistler,
British Columbia. The BC Transit demonstration programme lasts until 2014 and evalu-
ates costs, performance and service availability of the low-floor, 12-metre New Flyer
buses with hybrid propulsion from ISE/Siemens and valence lithium phosphate batteries

22
for energy storage. The fuel cell system powers the buses with 150 kW. One of the in-
tentions creating the bus was that it would resemble an average bus regarding the driv-
ing behaviour and appearance, and still provide a clean energy future through an envi-
ronmentally advantageous choice of transport. [35] [36] [37]
3.4 Technical characteristics of a Mercedes-Benz fuel-
cell-Citaro
A natural approach for assessing the opportunities to utilise fuel cells in domestic vehi-
cle fleets is to review technological applications promoted elsewhere. To assess the suit-
ability of fuel cell buses for Finnish transport, it is useful to consider bus fleets deployed
in countries with similar weather conditions. The buses used in the project ECTOS in
Iceland are examined to get a view of the technology involved. They have had to operate
under harsh circumstances and thus create extra value for the examination.
Figure 8 represents the actual, wintery weather conditions encountered in Iceland during
the project. This section scrutinises various devices of the fuel cell system in the Mer-
cedes-Benz fuel-cell-Citaro (2003) deployed in the ECTOS project. This bus was also
the choice of the projects CUTE and STEP and has even been used in Beijing, China
[38].
Figure 8: A fuel cell bus on its route in Reykjavik, Iceland [39]
Lately, fuel cell buses have experienced clear improvements in efficiency and technol-
ogy, such as the utilisation of batteries and additional power aggregates. These vehicles

23
are generally referred to as fuel cell hybrid vehicles (FCHV) and use additional power
sources in order to reduce fuel consumption and improve the overall system efficiency.
However, the basic fuel cell system-related components in fuel cell buses can best be
introduced by reviewing the fuel-cell-Citaro deployed in ECTOS. [40]
The conventional Mercedes-Benz Citaro diesel buses served as the physical basis for the
fuel-cell-Citaro buses designed in 1999 – 2000. The intention of the European fuel cell
bus programmes was to demonstrate that hydrogen-powered fuel cell buses could be
utilised as a part of the urban transport in Europe. Thus, the main goal was not to opti-
mise the fuel economy but to attain high reliability and durability typically required by
the transport agencies. This was mainly achieved through utilising standardised series-
production components available for conventional diesel buses [38]. It was presumed
that appealing to the public as a dependable transit solution would boost the future de-
velopment of fuel cell buses. [24]
The drive train of a fuel cell bus consists of several modules, each of which has its own
function. The main devices for Mercedes-Benz fuel-cell-Citaro bus are explained in the
next paragraphs.
The fuel cell system of a 12 metres long, low-floor Mercedes-Benz fuel-cell-Citaro used
in the ECTOS project generates propulsion through a drive train equipped with a Bal-
lard’s HY-205 P5-1 fuel cell engine. The HY-205 drive train is designed to replace the
typical diesel drive train with a minimum amount of technical adjustment. The fuel cell
engine uses hydrogen as fuel and feeds a compact liquid-cooled electric propulsion mo-
tor. [24] [41]
The Mercedes-Benz fuel-cell-Citaro is equipped with an engine containing fuel cell
stacks in discrete cell rows. An electronic measurement system monitors cell voltages
constantly. For maintaining appropriate operation conditions, the module contains air
and hydrogen humidifiers, as well as their associative hardware. Specific hardware con-
trols and handles the recirculation of hydrogen. Fuel cell stacks incorporate a special
minimum current limitation, so the fuel cell system has a resistor for dumping excess
electricity. Basically, in the resistor, the excess electricity transforms to heat which is
then utilised in the heating or cooling units of the vehicle. Fuel cell stacks are typically
mounted on the top of the roof or into the engine room. If the installation is located on
the roof, as in Mercedes-Benz fuel-cell-Citaro, the bus is higher than a normal diesel-
driven bus. [24] [41]
A single electric motor runs various main functions in the fuel cell system of the Mer-
cedes-Benz fuel-cell-Citaro either directly or indirectly. An inverter converts the direct
current supplied from the fuel cell stacks to 3-phase alternating current suitable for the

24
electric motor. The electric motor gives power to the automatic central gearbox and air
conditioning compressor. The electric motor also provides power to the transmission
and transmission retarder which creates additional braking power for the vehicle. Stan-
dard auxiliaries, such as a brake compressor, power steering pump and a hydraulic fuel
cell radiator fan pump are driven by the gearbox through drive belts. Additionally, a 24-
volt electric system in the fuel-cell-Citaro provides power to various auxiliaries. [24]
[41]
Furthermore, the gearbox runs a supercharger that produces pressurised air which is
directed to the fuel cell stacks. The pressurised air passes the stacks and is funnelled to a
turbocharger as exhaust gas. The turbocharger conserves energy from the exhaust pro-
viding more compression. An inter-cooler cools down the air to enable higher compres-
sion efficiency, as cooler air fits to a more compact space. The inter-cooler filters out
contaminants of the air as well. The noise level of the fuel cell air system is diminished
by mufflers on the air intake and exhaust systems. [41]
The operation of fuel cells produces excess heat that must be disposed of to maintain
suitable operating conditions. The Mercedes-Benz fuel-cell-Citaro incorporates specific
cooling circuits with liquid coolant. For the fuel cell stack cooling circuit, the coolant
flow and inlet temperature are measured continuously while extra heat from the coolant
is transferred into the atmosphere. The cooling effect is achieved through hydraulic fuel
cell radiator fans and a specific heat exchanger. Cooling circuits involve the heat ex-
changers of the drive train, the cabin loop and the transmission retarder. The electric
motor cooling oil and electric inverter are also cooled down through these circuits. For
the cabin, cooling circuits provide heating. To have proper heating for the interiors, the
Mercedes-Benz fuel-cell-Citaro also provides a separate heating interface of 40 kW. The
system is capable of producing heat only when the fuel cell engine is active. [41]
Quick-starting the fuel cell engine in the Mercedes-Benz fuel-cell-Citaro is only possi-
ble when the temperature of the engine is above + 5 °C. When the outside temperature
falls below that given value, an electrical block heater equipped with a thermostat
warms up the fuel cell stacks. Fuel cell stack insulation prolongs the cooling time and
thus improves the overall efficiency of maintaining a proper temperature in the engine.
[41]
PEM fuel cells are sensitive to several substances. Fuel cell may become contaminated
by fuel impurities, air pollutants and cationic ions resulting from corrosion of the fuel
cell system components. Particularly, low-temperature fuel cells encounter this problem.
In case of contamination, the performance level of a fuel cell system can drastically de-
crease. A single fuel cell can lose a few per cent of its average voltage level because of
NOX impurities when operating in a dirty city environment. Under extreme conditions,

25
some impurities could even cause power failures. Due to contamination and the accu-
mulated condensate water which occurred during the operation, the fuel cell hydrogen
system is typically cleaned with specific equipment. In the Mercedes-Benz fuel-cell-
Citaro, contaminated hydrogen gas along with water vapour is discharged through a
diffuser into the atmosphere. The discharging occurs on start-ups and shutdowns, as
well as cyclically during driving. To provide safe operation, the contaminated hydrogen
is mixed with an extensive amount of air before ventilation. [41] [42]
Hydrogen has the widest range of flammable concentrations in air among all typical
gaseous fuels. Thus, hydrogen can easily ignite if used against safety regulations. To be
more precise, the auto ignition temperature of hydrogen is low, and it can ignite from a
spark or heating. Hydrogen is an odourless, colourless and tasteless gas that necessitates
leak detectors in buses for safe operation. A leak in the hydrogen system could pose a
threat to those around in an open air fuelling station, as well as in enclosed spaces. Hy-
drogen also causes metal embrittlement in pipes, gaskets and welds when continuously
exposed to the gas. [43]
The fuel-cell-Citaro has nine high-pressure cylinders for storage of hydrogen. These
cylinders hold 40 kg of hydrogen fuel at 350 bars at a temperature of 15 °C. The light-
weight composite storage cylinders are located on the roof of the vehicle. The cylinder
manufacturer guarantees the functionality of its product under the harshest environ-
mental circumstances confronted in automotive usage. The fuel-cell-Citaro hydrogen
storage system enables fast filling. [41]
30 Mercedes-Benz fuel-cell-Citaros were delivered by EvoBus GmbH in 2003 [44].
Three of these became a part of the project ECTOS as described earlier. Because these
buses utilise fuel cells in propulsion, they hold some distinct vehicle characteristics. The
series EvoBus design features a standing platform for the engine and transmission in the
left rear area. As the bus weighs three tons more than a diesel bus, the body work is re-
inforced particularly from the roof area where certain parts of the fuel cell drive train
and cooling system fans are situated. Thus, the most visible change in comparison to a
corresponding diesel vehicle is the increase of height of the bus. The overall height of
the fuel-cell-Citaro is approximately 3,700 mm. The suspension of the fuel-cell-Citaro is
adjusted to efficiently carry the extra weight. [41]
3.5 New technology – Mercedes-Benz Citaro FuelCELL
The up-to-date Mercedes-Benz Citaro FuelCELL-hybrid buses (2010) deploy novel
technologies to improve the efficiency and competitiveness of the fuel cell system. In
addition to the fuel cells, the bus also deploys a 330-kg battery pack. The water-cooled
26
lithium-ion battery pack operates as an intermediate storage for the energy generated by
the fuel cell stacks. The battery pack operates maintenance-free and offers 250 kW of
power, as well as the possibility of recuperating braking energy. For smooth, efficient
operation, the bus model utilises energy stored in batteries while accelerating and
charges the batteries while decelerating. When driving at a constant, higher speed, the
Citaro FuelCELL-hybrid only utilises fuel cell stacks for energy generation; batteries
sustain their charge level. [40] [45]
The Citaro FuelCELL-hybrid incorporates a fuel cell system capable of supplying 120
kW of continuous power, while consuming 10 – 14 litres of hydrogen per 100 km. A
hydrogen storage capacity of 35 kg allows the bus to travel around 250 km in the fuel
cell mode without refuelling. The bus control system incorporates a unit for ancillary
functions that is supplied through the battery pack. An intermediate electric circuit feeds
two wheel hub drives on the drive shaft with a voltage of 650 V DC. These wheel hub
traction motors, similar to those of trolley buses, create a power of 160 kW in total. The
peak power reaches up to 120 kW per motor for 15 – 20 seconds. The approximate ser-
vice life for the fuel cell system according to Mercedes-Benz is six years or 12,000 ser-
vice hours. [40] [45]
The new Mercedes-Benz Citaro FuelCELL-hybrid provides the low-floor feature with a
floor height of 370 mm. The boarding height for three different doors is a little less than
the actual floor height. The bus model has capacity for 76 passengers, 26 of which can
travel using a seat. The height of the bus is 3,400 mm. This is about 300 mm lower than
the height of the earlier fuel-cell-Citaro (2003). The length of the bus has remained
about 12 metres. [45]
3.6 Hydrogen infrastructure basics
The fuel cell technology in automotive usage involves an infrastructure for producing,
storing, as well as transporting and dispending hydrogen. The first step, to produce hy-
drogen, incorporates several possible methods: coal and biomass gasification, natural
gas reformation, water splitting by high-temperature, as well as water and photo-
electrolysis and biological processes [18]. After production, hydrogen must be stored in
a specific manner before transporting it to a place for distribution or end use. A dispens-
ing system services the end-user at a hydrogen fuelling station which functions basically
the same way as common gasoline or diesel fuelling stations.
Storing hydrogen can be implemented in several ways. Liquid state and high pressure
storages, as well as a storage utilising metal hydrides are the possible methods. Storing
hydrogen in liquid state requires an extremely expensive cryogenic storage which neces-
27
sitates a storage temperature that is below hydrogen’s boiling point – i.e., approximately
– 253 °C [46]. The liquid state hydrogen storage makes it possible to store hydrogen in a
smaller space than any other method of storage. [43]
The second storage method is based on bonding hydrogen molecules with metal hy-
drides. To extract hydrogen from the compound requires heat. The compound can only
be stored in small quantities and holds slow intake and outtake kinetic properties, which
is a clear problem in automotive usage. [43]
It is also possible to store hydrogen in high pressure tanks. This method has been widely
used in fuel cell bus projects described earlier. The typical pressure used varies around
340 – 690 bars. High pressure tanks have a couple of superior characteristics which dis-
tinguish them from other storage methods. A high pressure system can be charged and
discharged quickly; the charge time depends solely on the compressor. This particular
method of storing hydrogen is also less expensive to implement in small-scale refuelling
sites than the previous ones. [43]
There are two main categories in hydrogen transport. Hydrogen in a gaseous form has
been transported via pipelines for more than 50 years. Some countries in Europe and a
few states in the United States have pipelines for industrial usage. The difference be-
tween hydrogen pipeline and a natural gas pipeline exists in the material choice. Pipe-
lines for hydrogen transport are made of non-porous materials (e.g., stainless steel),
whereas natural gas pipelines often involve plastic materials that are porous for hydro-
gen. Replacing old pipelines or constructing a new pipeline network with transport and
distribution branches would incur significant costs. Building a pipeline for hydrogen is
estimated to incur roughly six times higher expenses than a natural gas pipeline, mainly
because of the lower energy density of hydrogen. [18]
Hydrogen can also be transported by truck or ship in a liquid form. However, the expen-
siveness of the hydrogen liquefaction process restrains the transport of liquid hydrogen.
Nevertheless, it has been estimated that the liquefaction costs will reduce significantly
by 2030. [18]
Dispending hydrogen to transit or single-occupancy vehicles is possible at a hydrogen
refuelling station with specific equipment similar to gasoline or diesel dispending sys-
tems. Stations typically offer gaseous or liquid hydrogen. The hydrogen is produced
either on-site or received from centralised plants. [18]
It is important to ensure the safety of the refuelling station and control the hydrogen
flow. The dispending system includes a leak detection system and a flow meter. Because
of the wide flammability range of hydrogen, it is necessary that the leak detector detects

28
hydrogen concentration levels in air down to one percent. Safety regulations concerning
the refuelling stations relate to the general design and equipment of the station, as well
as barrier walls, weather protection and on-site hydrogen production. [43]
3.7 Costs related to fuel cell buses and the hydrogen tech-
nology
Fuel cell buses can be seen as a rather newly innovated application, so the prices be-
tween market areas and suppliers vary a lot. The lack of proper series production has
kept vehicle costs high even though there has been a trend of reducing prices. Compar-
ing to a diesel bus, the vehicle body of an FCV requires only a few significant changes
(i.e., the increase in height and reinforcement of the bus structure), and thus, does not
contribute to higher costs. Notable expenses arise from the fuel cell system, as well as
hydrogen production, distribution and storage.
Fuel cell buses will most probably be the trend-setter for fuel cell usage in the automo-
tive industry. In general, buses offer a great platform for proving whether technical solu-
tions are functional since they are often operated long distances in a frequent manner. It
is estimated that the cost of a fuel-cell-Citaro prototype bus in the CUTE programme
was around EUR 1.3 million. The diesel version of the bus cost approximately one mil-
lion Euros less. For the STEP project in Perth, Australia deployed fuel cell buses priced
around AUD 2.0 million in 2006, that equals – considering the exchange rates of March
2006 – approximately EUR 1.2 million [47]. Diesel buses in Perth cost around AUD
360,000 (≈ EUR 218,000) [47], which along with the price information from the CUTE
project implies that the price of a fuel cell bus has typically been fivefold the level of the
diesel alternative. [48] [49]
Regardless of the substantially higher price of fuel cell buses, the overall prices for fuel
cell buses have decreased in recent years. In 2007, Connecticut Transit in the United
States acquired a fuel cell bus (manufactured by Van Hool) that was 25 percent less ex-
pensive than a comparable bus delivered to AC Transit not more than two years before.
Prices for buses have typically been higher in North America than in Europe. An esti-
mated price for a fuel cell bus in 2005 ranged from USD 1 to 3 million (≈ EUR 805 –
2,410) [47] [50]. Fuel cell bus prices altered a lot since they were hand-built prototypes
utilising pre-commercial, obviously expensive technology. [33] [51]
Fuel cell buses in various demonstrations have been prototypes. This reflects in the
maintenance facilities and fuelling stations specifically engineered for fuel cell bus us-
age. Californian transit agencies (i.e., AC Transit, VTA and SunLine) had their mainte-
nance facilities built between 2000 and 2006. Facilities were built to service the varying

29
needs of the fuel cell buses involved. SunLine maintenance facility for two fuel cell
buses is a ventilated tent built right behind the original maintenance building in 2000.
Sensors and a sound alarm for hydrogen leaks were used for safety purposes. This light
construction incurred expenses of USD 50,000. On-site generated hydrogen by a natural
gas reformer at the SunLine fuelling station is provided at approximately 340 bars. The
storage on the site can hold 180 kg of hydrogen. The reformer purchase and installation
cost initially USD 750,000. A six-year maintenance agreement was made for USD
300,000 in 2006. [14]
VTA maintenance built a larger facility with a fuelling station and a bus wash. The
overall costs rose to USD 4.4 million. The facility is a free-standing building with two
maintenance bays, storage and working space. The building has equipment for hydrogen
and flame detection, as well as a sufficient ventilation system and antistatic coating on
doors. The separate initial cost for the fuelling station at VTA was around USD 480,000
after which the agency has paid the station owner contractually USD 4,400 per month
for the maintenance of the fuelling station equipment. The station features a 34,000-litre
cryogenic liquid hydrogen tank and a possibility of dispending gaseous hydrogen at
around 410 bars. [14]
AC Transit’s approach was slightly different from the implementations of SunLine and
VTA. The maintenance facility for fuel cell buses at the transit operator’s premises was
implemented inside an existing maintenance building, separated with a firewall. Other
safety equipment incorporated easily opening doors; ignition-free heating; grounded,
antistatic floors; and hydrogen detection, as well as other sensors. As a safety rule, fuel
cell buses entering the maintenance facility are not allowed to carry gaseous hydrogen at
more than 40 bars. Modification costs to the original maintenance facility totalled about
USD 1.5 million. The fuelling station at AC Transit includes storage for 366 kg of gase-
ous hydrogen with two dispensers. [14]
The main option for storing hydrogen in FCVs is to use high pressure tanks. The tech-
nology for storing gaseous hydrogen is in a mature state. The production of carbon fi-
bres has existed for a long time and its price is not likely to be lowered significantly.
Series production of FCVs could reduce the cost of hydrogen high pressure tanks to
USD 500 – 600/kg H2. Considering the fuel storage capacity of the Van Hool A330
FCB (i.e., 50 kg of hydrogen fuel), the total costs for manufacturing and assembling the
storage would then approximate USD 25,000 – 30,000. [18] [14]
Hydrogen production costs depend on the production method and the scale of produc-
tion. Two interesting alternatives to produce hydrogen are electrolysis and natural gas
reformation. In 2007, the cost of producing hydrogen by electrolysis was typically above
USD 3.6/kg, while the production cost of large-scale natural gas reformation varied
30
around USD 1.2 – 1.8/kg. At smaller reformation plants, the price was more similar to
that of hydrogen production by electrolysis. Decentralised small-scale production could
have exceeded USD 6/kg. [52]
Distribution of hydrogen incurs less significant costs than the production. Gaseous hy-
drogen distributed through pipelines incorporated expenses of around USD 0.12 –
0.24/kg back in 2007. Transporting liquid hydrogen long distances by ship involved
greater costs than transporting liquid natural gas because of the cryogenic technology
and losses related to it. Refuelling stations together with the transport and distribution of
hydrogen increased the overall infrastructure costs of hydrogen by some USD 0.6 –
1.44/kg. [52]
3.8 Environmental issues
Fuel cell buses generate exhausts very limitedly. Since water and heat are the only by-
products generated during the operation of a fuel cell, the rubber tyre dust along with a
slight amount of NOX emissions from possible on-board natural gas reformation are the
only detrimental street-level emissions generated by a fuel cell bus. The production of
hydrogen generates non-local emissions, and thus, extensively assesses the gross level
of overall or well-to-wheel emissions occurred from the use of hydrogen fuel cell tech-
nology. Fuel cell buses can promote the development of a healthy environment by im-
proved fuel economy, reduced exhausts, as well as advanced pedestrian and passenger
comfort levels (i.e., cleaner city surroundings, reduced noise and vibration). [48] [53]
Fuel cell buses often feature higher fuel economies than diesel buses. Thus, FCBs pro-
vide greater vehicle mileage and save energy. However, the fuel cell buses in the dem-
onstration projects – e.g., ECTOS and CUTE – weighed up to three tons more and con-
sumed more equivalent fuel in comparison to normal diesel buses. The extra weight on
the buses mainly occurred from the fuel cell drive train and air conditioning system [38].
Despite the lower fuel economy, the average power train efficiency of the fuel cell buses
varied around 34 – 37 percent which beats the efficiency of fuel input to power the
gearbox of a normal ICE. The objective for the ECTOS and CUTE projects, however,
was not to strive for optimal fuel economy. [24]
Some demonstration projects have shown that the fuel economy of fuel cell buses can be
significantly better than that of diesel buses. Figure 9 represents the fuel economies at-
tained in the aforementioned demonstrations in the United States. The best fuel econ-
omy was attained at SunLine where the baseline buses were powered by compressed
natural gas (CNG). VTA fuel cell buses, on the contrary, presented fuel economies
about 12 percent lower than diesel buses on the site. The deteriorated fuel economy of

31
the fuel cell buses at VTA resulted partly from the absence of both hybrid technology
and braking power recuperation. These technical advancements could easily have im-
proved the fuel economy. [14]
Figure 9: Fuel economies for fuel cell and baseline buses in the demonstration
programme in the United States (diesel gallon equivalent, DGE) [14]
While hydrogen fuel cell buses can positively contribute to the fuel economy of public
transport, and therefore, promote sustainability, hydrogen production alone sets envi-
ronmental challenges. Hydrogen production generates emissions in notable amounts.
Table 2 presents carbon dioxide emissions generated by alternative hydrogen production
methods. The zero emission case only becomes possible when the electricity needed in
the electrolysis process is produced with renewable energy sources, which would elimi-
nate carbon dioxide emissions. [43]
Table 2: Carbon dioxide emissions for various hydrogen production methods
[43]
Production Method kg CO2/kg H2
Coal Gasification 19
Natural Gas Reformation 17.6
Electrolysis – Non-Renewable Power Source 12
Electrolysis – Renewable Power Source 0
32
A kilogramme of hydrogen contains approximately 120 MJ of energy, while a kilo-
gramme of US conventional diesel holds circa 43 MJ [54]. While diesel weighs roughly
0.85 kg per litre and causes CO2 emissions of circa 8.2 kg per a US gallon [43], the
amount of CO2 emitted per a kilogramme of diesel equals 2.5 kg. These figures are
based on complete combustion of octane-rich diesel fuel. Accommodating the informa-
tion in Table 2 and the latter assumption about diesel-related emissions, the production
of hydrogen seems to generate significantly more CO2 emissions than a diesel ICE in
active state, but it is not to forget that the energy content of hydrogen is nearly three
times higher than that of diesel fuel. In other words, 120 MJ of diesel burnt in an ICE
would generate roughly 7.0 kg of CO2. The amount of emissions for a diesel ICE thus is
below the emissions from nearly any kind of hydrogen production. However, hydrogen
production sites can significantly reduce emissions by utilising carbon capture methods.
No means of carbon capture are recognised in the calculations of Table 2. [43]

33
4 Battery-electric vehicles – buses
4.1 History and status of electric vehicles
The first electric vehicle (EV) was introduced in 1834. In 1890s, various producers
manufactured EVs in America, Britain and France. Due to limitations and restrictions of
batteries, the earlier EVs have disappeared from the automotive markets since 1930. In
the beginning of the 20th century, the active and growing deployment of ICEs strongly
diminished the use of EVs. However, there has been progress with electric vehicles
since the 1970s as the energy crisis set the development in motion. The development of
EVs was given an additional impetus some 20 years later by various energy policies
particularly driven in California, the United States to reduce atmospheric pollution [55].
Later on, mandates for zero emission vehicles have increased the popularity of EVs. In
London, there were around 900 new EVs in use in 2007. Currently battery-electric sys-
tems are, however, mainly used for small vehicles and short distances. [56]
At present, batteries are often utilised to offer additional capacity in buses, as in HEVs
which utilise batteries as a secondary equipment for more efficient, less fuel consuming
propulsion. However, more extensive use of batteries is in sight. For instance, trolley
buses could utilise batteries on peripheral parts of their routing. This would save a great
amount of costs typically incurred by the construction of an overhead wire network.
Such solutions have been in use in San Francisco, Vancouver and Beijing. Simultaneous
utilisation of overhead wires and batteries can provide a beneficial solution to transit
agencies, especially, when vehicles utilising those technologies share the same driving
corridors. Driving through the same exact places would enable centralised recharging of
vehicle batteries through trolley poles. [57]
It is noteworthy that the reliability of a transport system is increased when utilising sev-
eral parallel power sources or propulsion systems. However, also pure battery-electric
vehicles (BEVs) may possibly become an efficient, economic alternative for transport
fleets in the future. With a proper charging infrastructure or advanced battery-swapping
stations, it could be possible to create transport systems solely dependent on batter-
ies.[57]
34
4.2 The most prominent battery technologies for electric
vehicles – Li-ion
Nearly all of the batteries used in electric cars on the market are based on some sort of
lithium-ion (Li-ion) technology. Lithium, compared with any other chemical element,
holds the lowest standard redox potential, and thus, is the strongest reductant. Therefore,
lithium offers the potential to be the best material for batteries regarding the energy den-
sity (Wh/kg). Li-ion batteries are rechargeable, efficient, as well as reliable. They are
suitable for both high-energy and low-energy applications. Concerning electric vehicles’
propulsion power management, the automotive industry will naturally focus on high-
energy solutions. [16] [58]
The family of Li-ion batteries comprises battery characteristics that employ various
chemical combinations of anode and cathode materials. Each combination has its advan-
tages in terms of energy density and power density (W/kg), battery lifetime, safety, costs
etc. The energy and power characteristics exclude each other to some extent since in-
creasing the energy density typically decreases the power density of a battery pack. In
other words, the larger the reactive area inside the battery the thinner the wirings for
power transfer. [16] [59]
All the Li-ion technologies require proper monitoring, balancing and cooling systems in
order to manage the chemical energy release, thermal stability and the lifetime of the
battery cells. The currently most prevalent technology used in consumer applications is
lithium-cobalt oxide (LCO) which, however, incorporates some fundamental safety
problems. On the contrary, various promising technologies – i.e., lithium-nickel-cobalt-
aluminium (NCA), lithium-nickel-manganese-cobalt (NMC), lithium-manganese spinel
(LMO), lithium titanate (LTO) and lithium iron phosphate (LiFePO4 or LFP) – are
showing their potential to the automotive industry. [59]
Novel electric vehicles need a reliable power source with high energy density and long
working life. One of the most promising technologies for future automotive applications
is lithium iron phosphate technology. LFP technology enables manufacturing of rela-
tively lightweight batteries that withstand high ambient temperatures up to 60 °C. LFP
cell chemistry offers high reliability and safety levels – i.e., an LFP battery will not ex-
plode or catch fire. Various vehicle battery manufacturers are favouring LFP technol-
ogy, and thus, it is reasonable to discuss the advantages and disadvantages of the tech-
nology more in detail. [60] [61]
LFP batteries are among the most highly developed battery technologies at present.
They avoid the various shortcomings of other technologies. Batteries do not suffer from
any memory effect and they can be recharged at any time. The possibility of rapid re-
35
charging of LFP batteries supports their use in vehicles. LFP batteries attain a high dis-
charge rate with no voltage sag (i.e., flat discharge rate). Additionally, the self-discharge
level of one cell typically stays under one percent per month. LFP batteries can be left
standing in storage even partially discharged. [61]
LFP batteries are maintenance-free for the lifetime of the battery pack, which enables
easy electric vehicle maintenance. In addition, the solid construction of LFP battery cells
prevents damage occurring from the vibration of the vehicle. Containing no toxic heavy
metals, corrosive acids or alkaline, the LFP battery chemistry is the most environmen-
tally friendly option available. [61]
LFP batteries can realistically provide an energy density of 140 Wh/kg, the cyclical life-
time of batteries being around 2,000 – 3,000 charges at 80 percent depth of discharge
[61] [62]. After the lifespan of the LFP battery, the active materials inside the battery
can be removed and recycled in a safe, environmentally friendly manner. Lithium iron
phosphate can be treated with low temperature methods to recover the potential for bat-
tery usage. The treated LFP acts similarly to the primary material. Consequently, LFP is
a durable material which can be recycled and reused. [63]
Nonetheless, LFP technology is not the only suitable Li-ion technology for automotive
usage. For instance, vehicle manufacturers might easily end up favouring lithium titan-
ate technology in the future. Using titanium instead of graphite on the cathode side of
the battery cell – contrary to the LFP technology – lengthens the cyclical lifetime and
improves the power density of the cell. Despite the decrease in energy density, titanium
offers great battery cell durability. Properly developed, LTO batteries could possibly go
through 25,000 recharge cycles without significant degradation of battery cells. [16]
[64]
4.3 Battery manufacturers
Various companies worldwide manufacture high-capacity, high-power Li-ion batteries.
The next paragraphs will briefly introduce some of those manufacturers to give a view
of the Li-ion battery market base. One of the international battery manufacturers is the
Chinese Thunder Sky. The company has, in its own words, created some momentum
among electric bus production in China and Taiwan. Thunder Sky, doing cooperation
with a Chinese First Automobile Works, has a short-term goal of manufacturing 25,000
electric buses annually. Buses would be used in Chinese metropolises. [65]
On 14th April 2010, the Mitsubishi Motors Corporation released news about Lithium
Energy Japan (LEJ) constructing a new plant to Ritto, Japan to begin full mass produc-
36
tion of Li-ion batteries in 2012. LEJ has announced that it aims for annual battery pro-
duction enough to cover 100,000 small EVs. [66]
A North American-based company, Altair Nanotechnologies Inc. manufactures batteries
based on a proprietary, nano-structured lithium titanate. Currently, they guarantee over
12,000 charge cycles (i.e., a lifetime of around 15 years) to be reached with their prod-
ucts. Within the automotive industry, the company channels its interest into HEVs. [67]
A123Systems is another company manufacturing high-power Li-ion batteries for trans-
port. The company, founded in the United States (2001), has patented a Nanophos-
phateTM technology that utilises nanoscale materials. A123Systems has developed a 20
Ah Prismatic battery cell that should offer very low cost watt-hours for battery-electric
transport applications. [68]
In France, a joint venture Johnson Controls-Saft Advanced Power Solutions launched in
2006 is concentrating on high-tech nickel-metal hydride (Ni-MH) and Li-ion batteries
for hybrid electric and electric vehicles. In January 2008, a new manufacturing facility
was opened for Li-ion batteries in Nersac, France. The joint venture has already entered
into a contract with a few international car manufacturers. [69]
Bosch and Samsung established an equally owned joint company, SB LiMotive, in
2008. The company has an ambitious target for developing, manufacturing and selling
Li-ion batteries for automotive applications. Battery cell production will start in 2011.
The amount of investment costs incurred will rise up to USD 500 million over the first
five-year period. [70]
In Finland, European Batteries Ltd. is starting LFP battery manufacturing in a newly
constructed facility. Starting in the first half of 2010, the operation should expand to
enable production of 300 MWh of battery capacity by 2012. European Batteries will
manufacture both battery cells and battery control systems in the same facility, which
enables convenient circumstances for pre-testing and therefore reliable battery opera-
tion. [60]
4.4 Battery-electric bus implementations
The development of battery-electric buses (BEBs) has been rather slow despite the ex-
tensive research and development efforts that have been devoted to improving various
battery technologies. To date, BEBs have mainly been used for slow speeds and short
distances – e.g., a shuttle service. During the 1990s, commercial battery technologies
were not yet able to make a breakthrough to be a natural choice for bus manufacturers.
They lacked some power and offered a poor range of operation. Now, following the lat-

37
est progresses with Li-ion battery technologies, batteries provide a possibly beneficial,
reasonable alternative to other power sources. [50]
Battery-electric buses obtain the power for their movement from similar electric traction
motors to fuel cell buses and trolley buses. Less noisy, more efficient electric motors
provide their maximum torque already at lower speeds, which results in extremely ap-
plicable acceleration rates for generally discontinuous bus traffic. Regeneration of brak-
ing energy and a complex electric drive control system are typically included in BEBs as
well. [50]
BEBs are typically either recharged or their batteries are swapped to other ones at a bat-
tery-swapping station. The time of recharging varies depending on the battery capacity
and the output of the charger. Charging can be implemented at various power levels,
depending on the infrastructure, vehicle type, charging time, etc. For convenient opera-
tion, bus transit agencies could utilise a fast-charging station or a battery-swapping sta-
tion at the end of or in the crossings of bus lines. [50]
Earlier, due to the excess weight and limited range caused by the batteries, the majority
of BEBs in service were small-sized. For instance, until 2005, nearly all the North
American BEB projects utilised under 7-meter electric minibuses. Utilised battery tech-
nologies generally involved no Li-ion battery technology. The largest fleets could be
found in Santa Barbara, California and Chattanooga, Tennessee. [50]
One of the few main suppliers of electric buses to North American projects has been
Ebus. The fast-charging capable battery-electric bus of Ebus cost USD 298,000 (≈ EUR
204,000) in 2008, the charger price being USD 58,000 (≈ EUR 39,600) [47]. This small-
size bus offers room for 22 sitting passengers and 10 standing passengers, and thus,
cannot compete in space with an average bus. The basic battery system of the bus con-
sists of low maintenance nickel cadmium (NiCd) batteries that provide roughly 70 km
of operation between charges. The lifetime expectancy of the Ebus BEB batteries is said
to be up to 2,000 cycles on the company website. [71]
In August 2010, Link Transit, the public transport provider serving two separate coun-
ties in central Washington State, let know about its acquisition of five Ebus electric trol-
ley buses equipped with lithium titanate batteries. Also two fast-charging stations would
be involved in the acquisition. Batteries would serve a range of a little less than 20
kilometres with at least a five-year cycle life. Charging the batteries to 80 – 90 percent
of the full capacity would only take from five to seven minutes. [72]
A cooperative demonstration programme for a Zinc-Air battery bus was initiated in
1998 in Las Vegas, Nevada from the initiative of various partners, one of which was

38
FTA. The patented Zinc-Air battery technology was implemented on a full-size bus
frame. The bus represented one of the very first full-size, full-electric buses driven on
public roads worldwide. In the Zinc-Air battery system, power was produced through
oxidation of zinc. In the programme, the Zinc-Air battery pack supplied 99 kW of power
and 312 kWh of energy. For more powerful traction, the bus had one smaller NiCd bat-
tery pack that offered 125 kW of power. The Zinc-Air battery system typically required
mechanical removal and replacement of spent battery packs. [73]
In the European markets, electric buses have existed already for more than 20 years. In
Italy, for example, small BEBs have been used since 1989. Tecnobus, an Italian minibus
manufacturer, is seemingly the main provider of small electric buses in Europe. Italy’s
transport fleets alone account for over 370 electric minibuses delivered by Tecnobus.
The basic model of the minibus is shown in Figure 10. Other European countries im-
plementing electric buses from the same company include France, Norway, Portugal,
Spain and the United Kingdom. In Rome, Italy, electric minibuses total around
1,500,000 vehicle-kilometres per year carrying 27 passengers at maximum. The re-
chargeable batteries of the Tecnobus buses are based on lead-acid technology enabling a
range of 45 km. [74] [75]
Figure 10: Electric Gulliver (Tecnobus) - basic model [75]
Regardless of the slow development within the electric bus industry, BEBs have re-
cently attracted more attention, and especially, more full-length electric and hybrid elec-
tric buses have entered the market. For instance, the city of Xinxiang in Henan province,
China welcomed an 11.6-meter electric bus launched by Yutong in February 2010 [76].
In February 2008, Proterra, an innovator and manufacturer of commercial transit solu-
tions, commenced a clean bus tour in California. Proterra introduced a fast-charge bat-
tery-electric bus EcoRide BE35 that would create savings of USD 310,000 per bus in
39
total lifetime fuel expenses. While offering a clean ride to Californians, Proterra’s bus
involves a battery pack that can be fully recharged in less than 10 minutes. The EcoRide
BE35 results in up to fourfold fuel economy levels compared with an average urban
diesel bus. The bus can be run in pure battery-electric mode around 45 km or with any
small APU through a convenient vehicle control system. A regenerative braking system
and an up-to-date battery management system optimise the energy efficiency and system
life in Proterra’s BEB. [77] [78]
One of the latest introductions of Li-ion technology combined with an APU is New
York City Transit’s addition to its bus fleet; three hybrid electric buses deploying Des-
ignLine’s spinning turbine that recharges the batteries. The vehicles are not counted as
pure battery-electric buses but are still capable of running on pure battery energy for
extended periods of time. The contract with Designline, a Charlotte, North Carolina-
based manufacturer, includes a 12-year warranty for both the battery pack and turbine.
The bus measures around 10.7 metres in length, carrying up to 37 sitting and 30 stand-
ing passengers. The cost per bus in December 2009 was USD 559,000 (≈ EUR 383,000)
[47]. The pilot project of three buses may lead to a kick-off of a broader use of Des-
ignLine’s buses. The city has planned to order 87 additional buses, if the bus type
proves to be successful. DesignLine operates buses in Charlotte and Baltimore as well.
San Diego and Los Angeles joined the group in 2010. Besides operating in the United
States, the company runs buses in Australia, Japan, New Zealand and the United King-
dom. [79] [80]
Adelaide, Australia has advanced in bus systems through a solar power recharging sta-
tion and a solar-powered electric bus. This pure electric bus carries up to 40 passengers
and relies solely on solar power production. It stores energy in Swiss-made Zebra batter-
ies utilising sodium-nickel chloride technology. The bus offers 200 kilometres of travel
distance between recharges in a common city environment. [81]
Various existing propulsion systems utilised in buses commonly deploy some kind of an
APU. Thus, a full-size, pure battery-electric bus is not a common sight in passenger traf-
fic, though not an excluded option. For instance, Astonbus Inc. provides BEBs depend-
ing solely on batteries. According to the Astonbus web page, their 12-meter, 19.5-tonne
electric bus E-City 12.0 incorporates an LFP battery pack of 360 kWh. The battery pack
with a rated power of 100 kW takes 6 – 8 hours to recharge. The bus provides a capacity
for taking 61 passengers on board. [82]

40
4.5 Plug-in hybrid electric vehicles – implementation in
bus traffic
Plug-in hybrid electric vehicles (PHEV) along with HEVs form a middle stage for pure
BEBs in the automotive industry. Batteries provide these vehicles more efficiency but
not all the energy needed for propulsion. PHEVs are a grid-connectable version of
HEVs. The power grid is utilised for recharging the vehicle batteries. PHEVs commonly
carry more battery capacity than basic HEVs but not nearly as much as typical BEVs
operating solely on batteries. The plug-in functionality of PHEVs enables advanced fuel
economy compared to HEVs. [83]
PHEVs usually carry an ICE and an electric motor. These two operate either in parallel
or in series. A parallel PHEV entails a direct connection between the engine and the
wheels, as well as between the electric motor and the wheels, whereas a series PHEV
only uses the traction power provided by the battery-powered electric motor. A series
PHEV system runs the ICE only to recharge the batteries. In a PHEV, batteries are re-
charged from the electric grid, by regenerative braking or by the ICE. Figure 11 illus-
trates the operation of series and parallel PHEVs. Compared with other electric-drive
vehicles, one major advantage of PHEVs is fuel flexibility. The consumption ratio of
electric energy and liquid fuel can be addressed according to the needs of the user.
PHEVs can be run in pure electric mode, only on liquid fuel, or simultaneously on both.
[84]
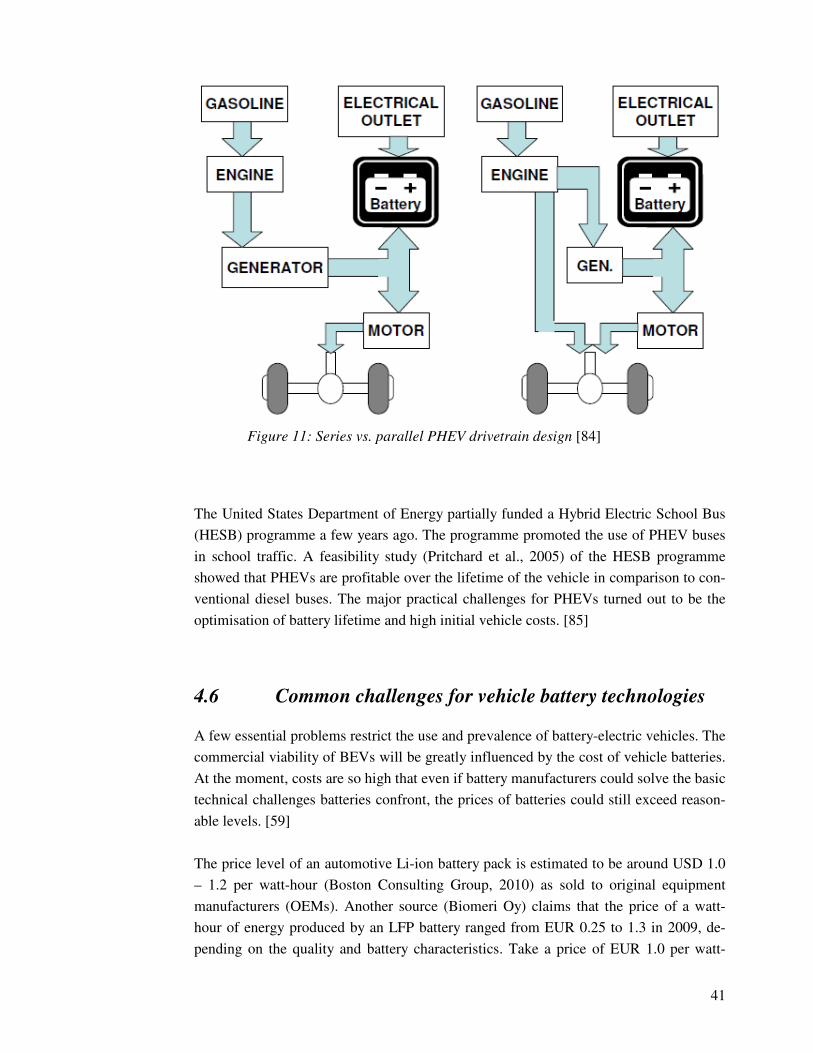
41
Figure 11: Series vs. parallel PHEV drivetrain design [84]
The United States Department of Energy partially funded a Hybrid Electric School Bus
(HESB) programme a few years ago. The programme promoted the use of PHEV buses
in school traffic. A feasibility study (Pritchard et al., 2005) of the HESB programme
showed that PHEVs are profitable over the lifetime of the vehicle in comparison to con-
ventional diesel buses. The major practical challenges for PHEVs turned out to be the
optimisation of battery lifetime and high initial vehicle costs. [85]
4.6 Common challenges for vehicle battery technologies
A few essential problems restrict the use and prevalence of battery-electric vehicles. The
commercial viability of BEVs will be greatly influenced by the cost of vehicle batteries.
At the moment, costs are so high that even if battery manufacturers could solve the basic
technical challenges batteries confront, the prices of batteries could still exceed reason-
able levels. [59]
The price level of an automotive Li-ion battery pack is estimated to be around USD 1.0
– 1.2 per watt-hour (Boston Consulting Group, 2010) as sold to original equipment
manufacturers (OEMs). Another source (Biomeri Oy) claims that the price of a watt-
hour of energy produced by an LFP battery ranged from EUR 0.25 to 1.3 in 2009, de-
pending on the quality and battery characteristics. Take a price of EUR 1.0 per watt-

42
hour. The total cost of a typical 25-kWh battery pack deployed in small electric cars
would equal EUR 25,000. Such a price level is extremely high and uncompetitive.
However, price reductions are anticipated in future. [16] [59]
Another substantial question to overcome concerns the battery infrastructure: whether
the battery pack of a vehicle would be replaced with a newly charged battery pack on a
battery-swapping station, or on-board rechargeable batteries would be fixed to the vehi-
cle. The latter would entail detaching and replacing the battery pack after its lifespan.
Current issues with battery charging for both passenger cars and heavy-duty transit vehi-
cles must be addressed to attain commercial profitability.
Vehicle batteries are still afflicted by long charging times. It takes from 10 to 12 hours
to charge an average 30-kWh car battery using an average one-phase distribution net-
work power outlet (230 V). To charge the same battery pack in less than 30 minutes
would take a specific charger of over 50 kW. Ultra-fast-charging has been planned as
well. A 250-kW charger could recharge a 30-kWh battery pack in only 6 minutes. [86]
Despite the fact that it would take such a long time to charge the batteries with a typical
slow-charging solution, using fixed batteries would possibly be easier and more conven-
ient for private vehicle owners, as battery-swapping would incorporate additional stan-
dardisation requirements and logistical complexity. [59]
The problems with battery costs and charging times accumulate in heavy-duty vehicles
whose battery capacity is notably greater. Larger vehicles, such as transit buses, may
require an approximately tenfold battery capacity compared to smaller passenger cars.
This would signify battery prices and recharging times of around ten times greater than
what is presented above. Charging at home, workplace, car parks, curb side, as well as
shopping centres may work for small electric vehicles, but for transit bus fleets and lar-
ger vehicles, the charging infrastructure must be centralised and specifically planned
taking into account decisive matters, such as vehicle routing. Buses typically operate
long hours with short breaks between shifts. Recharging or swapping batteries of BEBs
should happen quickly, without diminishing the vehicle’s availability. A well-placed
battery-swapping station could provide large vehicles a reliable, practical alternative.
Examples of automated, centralised battery-swapping infrastructures exist. PuroNovo, a
Finnish company specialised in industrial automation, is already marketing its battery-
swapping system [87]. [86]
Not only have the cost issues and charging-related matters hindered battery-electric ve-
hicles’ capability to strongly enter the automotive market. It is extremely challenging to
engineer batteries to function properly in a wide range of temperatures without affecting
the battery performance. This is especially the case in Finland, where the weather ranges
from hot summer to freezing winter. OEMs could prefer an approach where countries
43
with cold weather conditions would be provided with battery-electric vehicles equipped
with proper insulation and heating, whereas countries with hot climates would be of-
fered vehicles relying on battery technology based on electrolytes and materials allowing
high temperature storage. Nonetheless, such an arrangement would prevent battery-
electric vehicles to be moved across regions. Thus, OEMs are likely to favour a per-
formance disadvantage or higher system costs to avoid mobility restrictions. [59] Con-
trary to the thoughts about high mobility, several countries deploy electric mobility in
vehicle fleets designed to serve a certain area inside a city or a region. For traffic ar-
rangements, where vehicles stay inside a particular area, implemented vehicle models
could easily be location-specific designs that serve best in the prevailing, local condi-
tions.
4.7 The batteries of an electric vehicle as energy storage
While using electric energy, a pure battery-electric vehicles’ emission profile is similar
to trolley buses. The energy produced at a generation plant is consumed by the electric
motors of the vehicle practically generating no exhausts. However, vehicle batteries can
be constructed to feed energy into the power grid. Thus, grid-connectable BEVs along
with PHEVs can contribute to electric utilities and power grids by providing additional
energy storage. For an electric utility or power grid, deploying vehicle power would con-
tribute as system benefits, such as reliability and lower costs. Vehicle battery storages
could also facilitate more straightforward integration of intermittent, renewable energy
production – e.g., wind energy and solar energy. Generally, battery storages can be util-
ised in smoothing variable power generation. [88]. [89]
The described way of providing energy is often referred to as vehicle-to-grid (V2G) ser-
vice. During the peak demand of the day, typically around 6pm when high levels of
power consumption are expected, batteries connected to the electricity network could
serve as peak reserves. V2G in peak power might be economic but still difficult to ar-
range in practice due to on-board storage limitations. Secondly, vehicle batteries could
offer power to the grid as a spinning reserve in case of unexpected outages. A spinning
reserve is the fastest, and thus, the most valuable way of providing additional power to
the grid. V2G could offer a highly competitive spinning reserve base since the direct
costs incurred from idling batteries are insignificant. Thirdly, the storage could be used
to fine-tune the supplied frequency and voltage in real-time by matching generation to
load demand – i.e., regulation. At night-time, the vehicle batteries could be charged us-
ing free power generation capacity. [62] [90]
The V2G service could reduce power grid infrastructure costs. The use of vehicle bat-
tery capacity could postpone acquisitions of transmission lines, transformers and other

44
power system components, as well as their upgrade. Additionally, using batteries for the
purposes of power distribution and electric utilities could result in protection of end-user
devices through increased power quality. [62] [88]
In contrast to a stable, fine-tuned charging infrastructure, uncontrolled charging of elec-
tric vehicles in the Finnish power grid could easily necessitate infrastructure reinforce-
ments. Especially, the low voltage distribution network would require new arrange-
ments. Moreover, the transmission of electricity could become more expensive. But if
the electric vehicles’ charging infrastructure is adequately developed, transmission
prices of electricity could even be reduced. In the case of intelligent charging infrastruc-
tures, the power consumption of rechargeable electric vehicles would not create signifi-
cant need for additional power generation. An intelligent charging system could actually
enable more environmentally friendly power generation by decreasing the need for other
short-term power production facilities – e.g., a gas turbine as a spinning reserve. [16]
Although batteries can be facilitated in several ways to serve the electric grid, the im-
plementation of a highly developed, controlled system between vehicle batteries and the
power grid is far from simple. From a realistic point of view, a large amount of batteries
pose a clear issue to be examined more thoroughly. Charging various vehicle batteries
would require a substantial amount of power input and adequate capacity, especially, in
electricity distribution networks. Intelligent charging systems may be the answer some-
what later, but the present situation offers more or less undeveloped solutions for charg-
ing. Particularly, problems are expected in the context of blocks of flats or offices. For
instance, fuses and cables may have to be replaced in several buildings where electric
vehicles are going to be charged. Though in Finland, several houses have heating out-
puts, which might help the creation of electric vehicle charging points. Electrotechnical
factors should be discussed and researched more in detail to form a solid base for large-
scale electric mobility implementation in Finland.
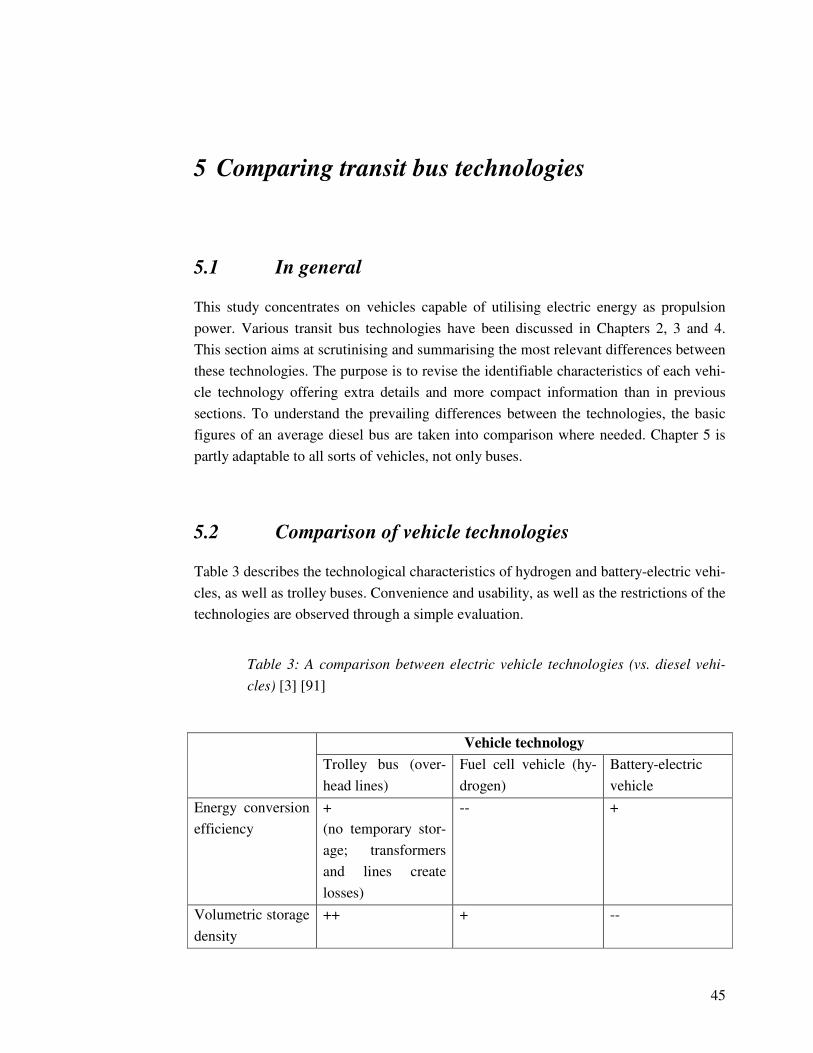
45
5 Comparing transit bus technologies
5.1 In general
This study concentrates on vehicles capable of utilising electric energy as propulsion
power. Various transit bus technologies have been discussed in Chapters 2, 3 and 4.
This section aims at scrutinising and summarising the most relevant differences between
these technologies. The purpose is to revise the identifiable characteristics of each vehi-
cle technology offering extra details and more compact information than in previous
sections. To understand the prevailing differences between the technologies, the basic
figures of an average diesel bus are taken into comparison where needed. Chapter 5 is
partly adaptable to all sorts of vehicles, not only buses.
5.2 Comparison of vehicle technologies
Table 3 describes the technological characteristics of hydrogen and battery-electric vehi-
cles, as well as trolley buses. Convenience and usability, as well as the restrictions of the
technologies are observed through a simple evaluation.
Table 3: A comparison between electric vehicle technologies (vs. diesel vehi-
cles) [3] [91]
Vehicle technology
Trolley bus (over-
head lines)
Fuel cell vehicle (hy-
drogen)
Battery-electric
vehicle
Energy conversion
efficiency
+
(no temporary stor-
age; transformers
and lines create
losses)
-- +
Volumetric storage
density
++ + --

46
Technological
availability
o
(several manufac-
turers)
- -
Additional infra-
structure
- (?)
(overhead lines;
supportive struc-
tures)
- (?)
(storage; dispending)
- (?)
(recharging; bat-
tery-swapping)
Range +
(depends on the
infrastructure)
o
--
Life cycle
(c stands for the
charge-discharge
cycle of a BEV)
+
• 16 – 20 years
-
• PureMotion®
Model 120: 5,000
h
• FCvelocity™-
HD6 target: 6,000
h
• MB Citaro Fuel-
CELL: 12,000 h (~
6 years)
• Hydrogen Bus
Alliance target (by
2015): 20,000 h
--
• realistic for
LFPs: 2,000 –
3,000 c
• Ebus: 2,000 c
• Altair
Nanotech.
(HEVs):
12,000 c (~ 15
years)
• target for LTO
batteries:
25,000 c
Costs
- -- --
Working as energy
storage
Not possible Not considered +
(capable of sup-
porting the grid)
Noise level
+(+) +(+) ++
Exhausts
++ ++ ++
Carbon footprint
* (depends on the
production of elec-
tricity and APUs)
+
*
-/(+)
*, (depends on the H2
production methods)
+
*
Passenger comfort
+ + +
--, Major disadvantage; -, Disadvantage; o, Neutral; +, Advantage; ++, Major advantage
(+) a debatable plus; (?) unclear
47
5.2.1 Energy efficiency
The energy conversion efficiency of an electric vehicle, basically, describes the ratio
between the energy provided by the vehicle – used for the vehicle propulsion and auxil-
iary equipment – and the energy consumed (i.e., in the form of fuel or electricity). Over-
head lines for trolley buses provide one of the most efficient means of utilising electric
energy as propulsion power. Trolley buses do not involve any temporary storage for the
used energy. Trolley bus efficiencies were measured within a Canadian study in 2007.
The study reviewed a New Flyer-Vossloh Kiepe trolley bus, a model produced in 2006
and utilised in a bus fleet at Edmonton Transit in Edmonton, Canada. The measured
efficiencies were evaluated based on power consumption and calculated traction power.
Traction power was produced with an average efficiency of 81 percent. Considering the
voltage losses in transformers and lines to the trolley bus, the average electrical supply
efficiency reached 69 percent. [92]
In contrast to trolley buses, fuel cell buses and battery-electric buses first need to store
the electric energy into a specific medium before utilising it in vehicle propulsion. The
overall efficiency of a battery-electric vehicle – considering the losses of the electric
drive train and vehicle batteries – can reach up to approximately 80 percent [93].
In a study conducted by the IFEU (The Institute for Energy and Environmental Re-
search) in 2009, the round-trip efficiencies – the charge-discharge cycle – of Li-ion ve-
hicle batteries turned out to be around 82 – 85 percent [91]. Another study suggests
round-trip efficiencies of approximately 70 – 90 percent for an LMO Li-ion battery pack
depending on the age and duty cycle of the battery [94]. In the measurements of the
European Batteries Ltd., LFP batteries have presented high efficiencies of up to 96 per-
cent when charging with half nominal current [93].
The well-to-wheel efficiencies of different vehicle propulsion types depend on various
factors. The production and distribution of vehicle fuel or electricity, as well as the ve-
hicle and related equipment assess the efficiency characteristics of the energy pathway.
A United States-based company, Eaves Devices, has published a report (2003) discuss-
ing the efficiencies of FCVs and BEVs. In the study, vehicle batteries were compared
with fuel cells in order to find the most economical vehicle technology. Figure 12 and
Figure 13 illustrate the well-to-wheel energy pathways of BEVs and FCVs, respectively.
It is noteworthy that the study assumed the hydrogen production to be based on elec-
trolysis. Moreover, the production of primary electricity is considered to be produced
from renewable energy sources. The well-to-wheel efficiency of a BEV utilising Li-ion
batteries came close to 77 percent, whereas the well-to-wheel efficiency of an FCV ap-
proximated 30 percent. [95]

48
For the BEV, Eaves Devices assumed a charger efficiency of 89 percent, a Li-ion battery
round-trip efficiency of 94 percent and an electric drive train efficiency of 89 percent.
The fuel cell system – including the storage – was assumed to have an efficiency of 54
percent. The common PEMFC efficiency typically stays under 60 percent, as stated in
Chapter 3. However, the efficiencies presented in Figure 12 and Figure 13 can be seen
as suggestive approximations. [95]
Figure 12: Well-to-wheel energy pathway for BEV [95]
Figure 13: Well-to-wheel energy pathway for FCV [95]
Considering the braking energy recuperation, batteries provide higher efficiencies than
fuel cells. According to the IFEU study, the process of storing regenerative braking en-
ergy back to the vehicle batteries, and then releasing it for propulsion again, can attain
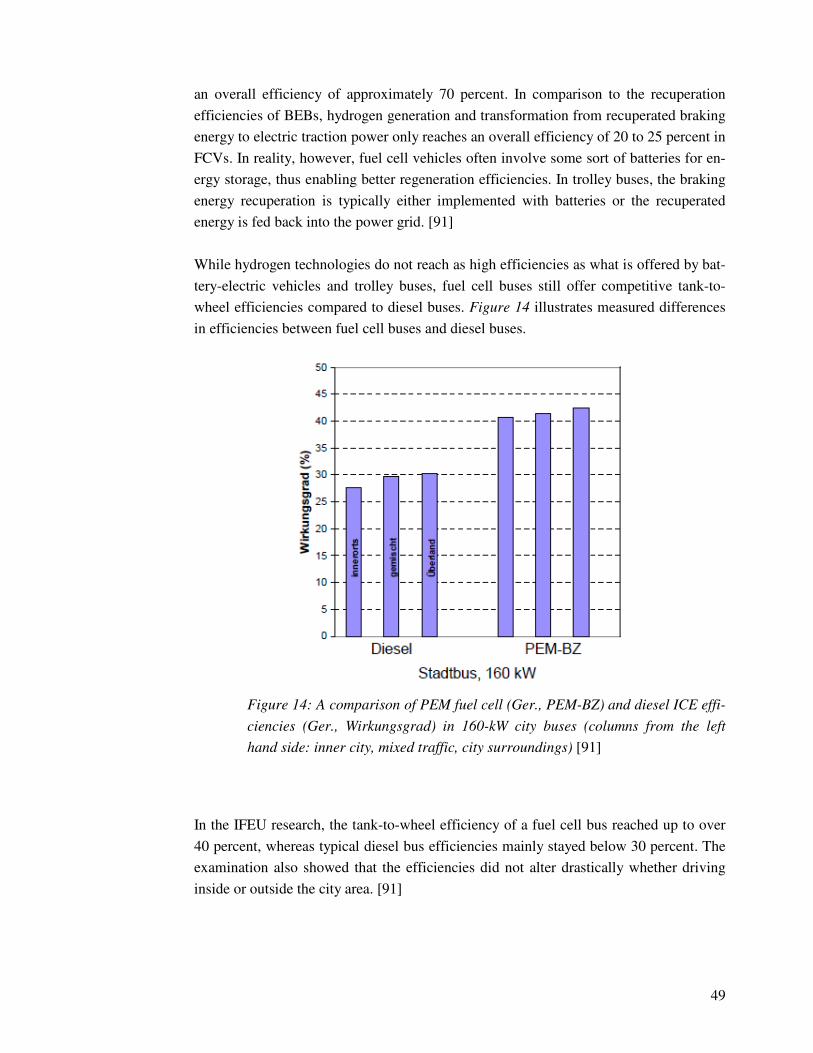
49
an overall efficiency of approximately 70 percent. In comparison to the recuperation
efficiencies of BEBs, hydrogen generation and transformation from recuperated braking
energy to electric traction power only reaches an overall efficiency of 20 to 25 percent in
FCVs. In reality, however, fuel cell vehicles often involve some sort of batteries for en-
ergy storage, thus enabling better regeneration efficiencies. In trolley buses, the braking
energy recuperation is typically either implemented with batteries or the recuperated
energy is fed back into the power grid. [91]
While hydrogen technologies do not reach as high efficiencies as what is offered by bat-
tery-electric vehicles and trolley buses, fuel cell buses still offer competitive tank-to-
wheel efficiencies compared to diesel buses. Figure 14 illustrates measured differences
in efficiencies between fuel cell buses and diesel buses.
Figure 14: A comparison of PEM fuel cell (Ger., PEM-BZ) and diesel ICE effi-
ciencies (Ger., Wirkungsgrad) in 160-kW city buses (columns from the left
hand side: inner city, mixed traffic, city surroundings) [91]
In the IFEU research, the tank-to-wheel efficiency of a fuel cell bus reached up to over
40 percent, whereas typical diesel bus efficiencies mainly stayed below 30 percent. The
examination also showed that the efficiencies did not alter drastically whether driving
inside or outside the city area. [91]

50
5.2.2 Running time energy consumption
A conventional diesel bus runs 100 km on 45 – 50 litres of diesel. One litre of diesel
contains around 36.4 MJ of energy which equals approximately 10 kWh. Thus, a diesel
bus consumes around 4.5 – 5.0 kWh of energy per kilometre. According to the Helsinki
feasibility study on trolley buses, a suitable, comparable figure for trolley buses would
approximate 2.5 kWh/km. However, trolley buses in Landskrona, Sweden, recorded an
even lower energy consumption level of 1.8 kWh/km with 16 percent recuperation of
braking power during their first service year in 2004 [5]. [3] [96]
Fuel cell buses in the STEP and ECTOS programmes consumed approximately 5.9 and
6.4 kWh/km, respectively. The figures are calculated regarding the vehicle mileage
(258,000/90,000 kilometres) and total hydrogen fuel consumption (46.0/17.3 tonnes). In
the United States, three fuel bus demonstration sites – i.e., VTA, SunLine and AC Tran-
sit – averaged 6.15 miles per DGE, which implies an approximate energy consumption
of 3.9 kWh/km. SunLine and AC Transit ran buses which deployed a hybrid propulsion
system with batteries enabling energy recuperation during braking. VTA buses attained
less encouraging fuel economies under the level of diesel average buses on the site. [14]
[54]
The energy demand of an electric traction motor of a battery-electric bus amounts to 1.1
– 1.2 kWh/km. The recuperation of braking energy could reduce the consumption to 1.0
kWh/km. These figures, however, only include the operation of the electric motor; other
power electronics involved raise the vehicle energy demand. Table 4 summarises the
energy consumption of the discussed vehicle technologies. [97]
Table 4: Tank-to-wheel energy consumption of 12-metre buses
Bus technology Tank-to-wheel
energy consump-
tion*, kWh/km
* per person on
average (Helsinki),
kWh/km/person
Sources of infor-
mation
Diesel 4.5 – 5.0 0.38 – 0.42 [3] [96]
Trolley 1.8 (energy recu-
peration); 2.5
0.15; 0.21 [5] [3]
Fuel cell (Sites in
the US; EC-
TOS/STEP)
3.9 (energy recu-
peration); 6.4
0.33; 0.53 [23] [14] [29]
Battery-electric 1.1 – 1.2 (pure elec-
tric motor demand)
0.09 – 0.10 [97]
51
Table 4 also suggests the approximate tank-to-wheel energy consumptions per passen-
ger-kilometre. The approximations are based on the average passenger count of 12 per-
sons for 12-metre buses in the Helsinki city public transport calculated later in Section
6.2. Even though the approximated figures are suggestive, they give a clear view of the
energy consumption levels. Noteworthy is that the Helsinki feasibility study on trolley
buses suggests an energy consumption level of 0.2 kWh/km per passenger, which nearly
equals the approximation presented in Table 4 (i.e., 0.21 kWh/km).[3]
Finally, the amount of energy demanded by a bus depends on the vehicle weight, trac-
tion type, road profile and other related issues. Suggestive figures help to understand the
major energy consumption trends between separate vehicle technologies.
5.2.3 Other technological characteristics
In addition to the efficiencies and consumption levels, there are several other factors
defining the adequacy or feasibility of a vehicle propulsion type. For instance, all vehi-
cle types differ from each other from the perspective of energy storing. Trolley buses are
the only option that does not involve any particular fuel storage. Hydrogen technology
makes it possible to produce small-size, high-capacity fuel storages. Hydrogen enables
from 2 to 5 times smaller, lighter energy storages compared to any manufactured vehicle
battery technologies [91].
Unlike conventional diesel buses, several of the new alternatives have problems with
range. Fuel cell buses compete reasonably well with diesel buses since they possess the
opportunity to store a large quantity of hydrogen fuel into their tanks. By contrast, bat-
tery-electric buses still confront major challenges with the range. Trolley buses, for one,
are restricted to routes equipped with overhead lines. According to HSL (Helsinki Re-
gional Transport Authority), the minimum range for a transit bus required in the re-
gional transport in the Helsinki metropolitan exceeds 300 kilometres [96]. This is con-
cluded from the experiences with CNG buses that offered an approximate range of 300
kilometres and required refuelling during the service day. For adequate operation, transit
buses should only require refuelling once a day (i.e., not during service). For now a 300-
kilometre range is not a possible target for BEBs. However, trolley buses and FCBs are
more likely to provide such distances.
An investment to a certain vehicle type sets a question about the expected service life of
that vehicle. The winner in this category is clearly the trolley bus which offers a longer
life cycle than what is expected from diesel-powered buses (i.e., around 15 years). Trol-
ley buses offer from 16 to 20 years of healthy service life. In contrast to trolley buses,
the propulsion poses a difficulty in FCBs and BEBs. A reasonable approximation for an
FCB life cycle is currently 5,000 service hours without any repairs done to the fuel cell.
52
Considering BEBs, LFP battery technologies realistically provide 2,000 – 3,000 deep
charge-discharge cycles. Table 3 presents the life cycles provided by the different vehi-
cle propulsion types in form of present facts and future estimations. The maximum ve-
hicle mileage made possible by each propulsion technology depends on various factors
and would certainly need more in-depth examination for a reliable comparison.
The suitability of a vehicle type to local transport is also influenced by the demanded
infrastructure. Trolley buses require overhead lines on roads and depots. BEVs necessi-
tate a battery-swapping station or a place for recharging the batteries. Trolley buses and
battery systems would benefit from the existing power grid. Still, the use of electricity
for vehicles’ needs could easily create a need for electricity network reinforcing. For
instance, possible fast-charging stations for heavy-duty vehicles could overload the elec-
tricity network when badly situated. However, fast-charging stations would probably be
best implemented when situated on an upper voltage level, closer to the primary substa-
tion. Positive is that battery-electric systems could support the national electricity grid,
and thus, partially decrease the need for grid reinforcements. Battery storage for heavy-
duty vehicles could comprise a greater amount of batteries than what is needed for vehi-
cles providing continuous support to the power grid.
The use of hydrogen would set challenges for the transport system as well. Fuel cell
buses involve hydrogen delivery and dispending systems, comparable to arrangements
in diesel and gasoline delivery and distribution. Additionally, fuel cell technology re-
quires special indoor safety systems for leak detection. Small-scale, distributed produc-
tion and delivery of hydrogen are currently developed in order to provide more effi-
ciency than what is now seen with common petroleum products. The overall economical
and technological profitability of a certain vehicle-specific infrastructure depends on the
characteristics of the traffic system, as well as the dominating commercial conditions –
i.e., the availability and price of the technology. The viability and cost-effectiveness of
different vehicle type-related infrastructures cannot be compared to diesel or gasoline
delivery chains offhand. On the contrary, the rationality of every system should be con-
sidered in itself.
On the vehicle-level, trolley buses – being continuously used for longer periods of time
now – are offered through more straightforward manufacturing processes, whereas the
production of BEVs and FCVs is still characterised by inconsistency and discrepancy.
The availability of FCVs is rather low [91], which is the case for BEV propulsion sys-
tems as well. Currently, the immature, inadequate state of development of BEV and
FCV technologies restrains cost reductions from occurring. Therefore, the present pur-
chase and maintenance costs for these vehicle types remain high.
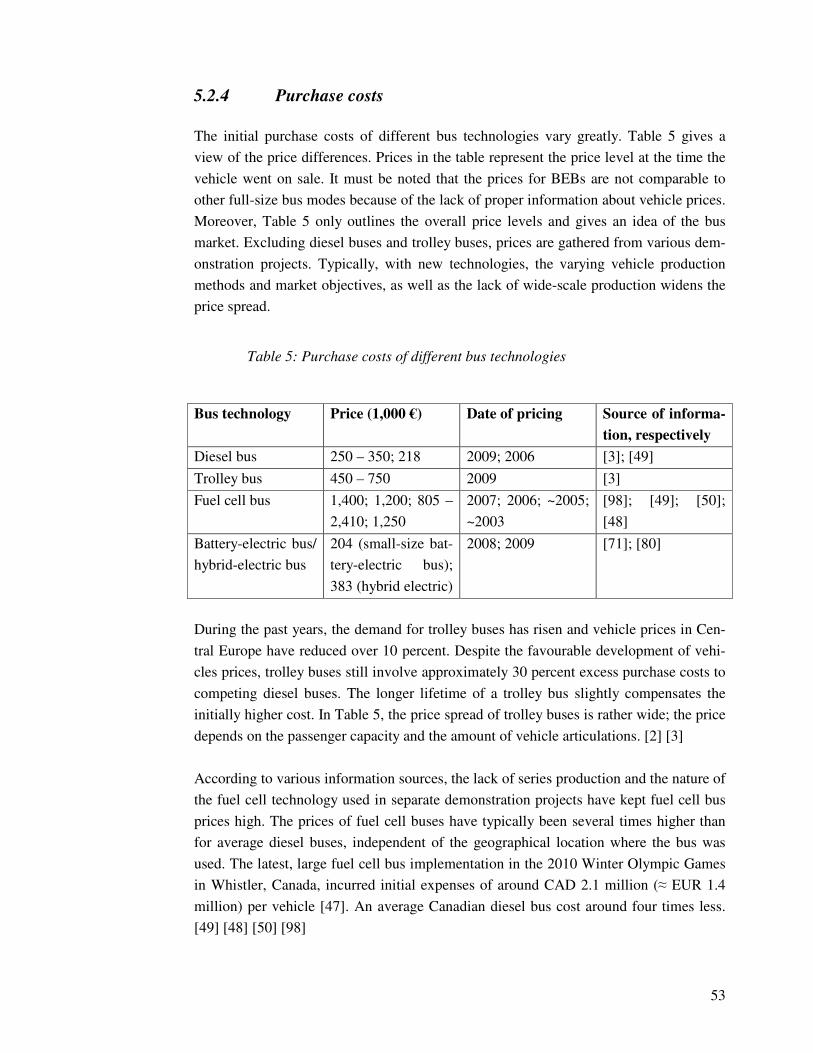
53
5.2.4 Purchase costs
The initial purchase costs of different bus technologies vary greatly. Table 5 gives a
view of the price differences. Prices in the table represent the price level at the time the
vehicle went on sale. It must be noted that the prices for BEBs are not comparable to
other full-size bus modes because of the lack of proper information about vehicle prices.
Moreover, Table 5 only outlines the overall price levels and gives an idea of the bus
market. Excluding diesel buses and trolley buses, prices are gathered from various dem-
onstration projects. Typically, with new technologies, the varying vehicle production
methods and market objectives, as well as the lack of wide-scale production widens the
price spread.
Table 5: Purchase costs of different bus technologies
Bus technology Price (1,000 €) Date of pricing Source of informa-
tion, respectively
Diesel bus 250 – 350; 218 2009; 2006 [3]; [49]
Trolley bus 450 – 750 2009 [3]
Fuel cell bus 1,400; 1,200; 805 –
2,410; 1,250
2007; 2006; ~2005;
~2003
[98]; [49]; [50];
[48]
Battery-electric bus/
hybrid-electric bus
204 (small-size bat-
tery-electric bus);
383 (hybrid electric)
2008; 2009 [71]; [80]
During the past years, the demand for trolley buses has risen and vehicle prices in Cen-
tral Europe have reduced over 10 percent. Despite the favourable development of vehi-
cles prices, trolley buses still involve approximately 30 percent excess purchase costs to
competing diesel buses. The longer lifetime of a trolley bus slightly compensates the
initially higher cost. In Table 5, the price spread of trolley buses is rather wide; the price
depends on the passenger capacity and the amount of vehicle articulations. [2] [3]
According to various information sources, the lack of series production and the nature of
the fuel cell technology used in separate demonstration projects have kept fuel cell bus
prices high. The prices of fuel cell buses have typically been several times higher than
for average diesel buses, independent of the geographical location where the bus was
used. The latest, large fuel cell bus implementation in the 2010 Winter Olympic Games
in Whistler, Canada, incurred initial expenses of around CAD 2.1 million (≈ EUR 1.4
million) per vehicle [47]. An average Canadian diesel bus cost around four times less.
[49] [48] [50] [98]
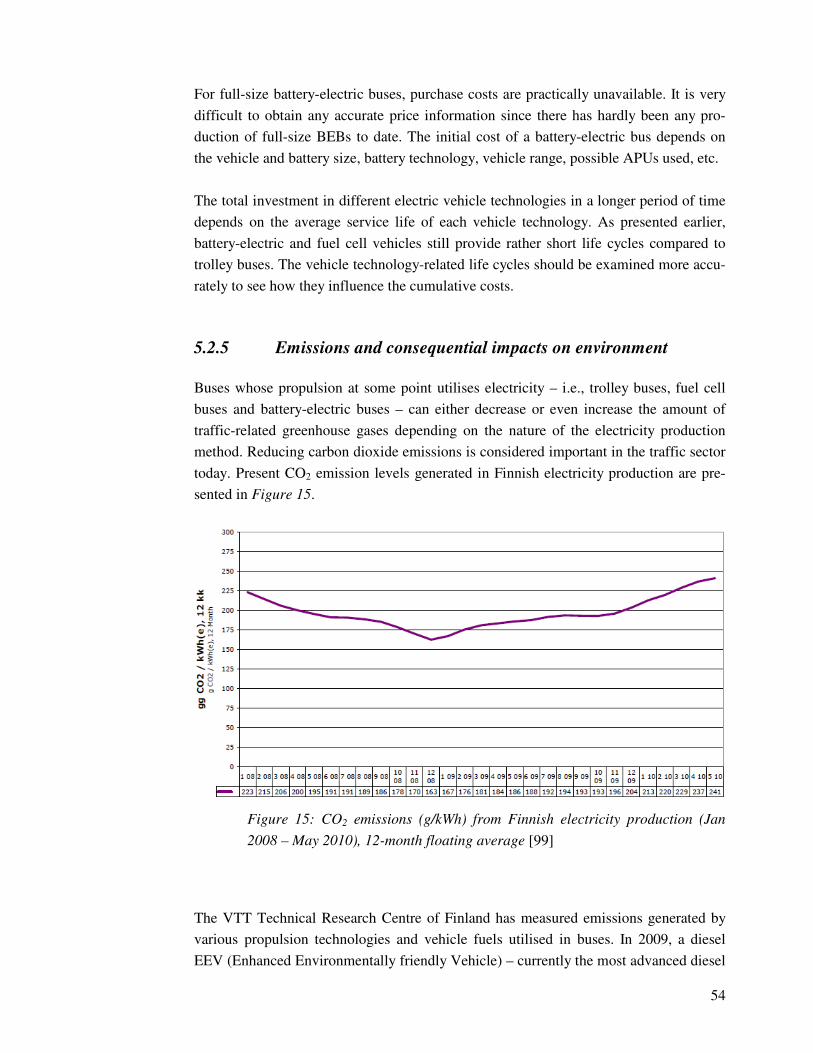
54
For full-size battery-electric buses, purchase costs are practically unavailable. It is very
difficult to obtain any accurate price information since there has hardly been any pro-
duction of full-size BEBs to date. The initial cost of a battery-electric bus depends on
the vehicle and battery size, battery technology, vehicle range, possible APUs used, etc.
The total investment in different electric vehicle technologies in a longer period of time
depends on the average service life of each vehicle technology. As presented earlier,
battery-electric and fuel cell vehicles still provide rather short life cycles compared to
trolley buses. The vehicle technology-related life cycles should be examined more accu-
rately to see how they influence the cumulative costs.
5.2.5 Emissions and consequential impacts on environment
Buses whose propulsion at some point utilises electricity – i.e., trolley buses, fuel cell
buses and battery-electric buses – can either decrease or even increase the amount of
traffic-related greenhouse gases depending on the nature of the electricity production
method. Reducing carbon dioxide emissions is considered important in the traffic sector
today. Present CO2 emission levels generated in Finnish electricity production are pre-
sented in Figure 15.
Figure 15: CO2 emissions (g/kWh) from Finnish electricity production (Jan
2008 – May 2010), 12-month floating average [99]
The VTT Technical Research Centre of Finland has measured emissions generated by
various propulsion technologies and vehicle fuels utilised in buses. In 2009, a diesel
EEV (Enhanced Environmentally friendly Vehicle) – currently the most advanced diesel

55
technology on the vehicle market – accounted for the following emissions in the Braun-
schweig city driving cycle: NOX, 5.9 g/km; PM, 0.06 g/km; CO2, 1120 g/km [100]. Ta-
ble 6 presents Euro VI emission standard and emissions generated by a couple of other
vehicle technologies in relation to diesel EEV. The measured PM and NOX emissions
represent exhausts emitted in traffic.
Table 6: A comparison of vehicle emissions generated by various vehicle tech-
nologies [100]
Percentage
(%)
Diesel EEV Euro VI (heavy-
duty vehicles
[101])
Hybrid-
electric diesel
bus (US)
Trolley bus
Emission
NOX 100 20 70 0
PM 100 50 10 0
CO2 100 100 70 35; 66 [99]
To assess the CO2 generation of a vehicle that primarily consumes electricity, the char-
acteristics of the electricity production matter the most. The figures in Table 6 are based
on an electricity mix which contains 59 percent of renewable electricity sources along
with 22 percent of nuclear power and 19 percent of electricity from fossil fuels. The
specific emissions for the used electricity mix total CO2 emissions of 103 g/kWh which
equals the emissions generated by the production of the electricity sold by Nord Pool,
the single financial energy market for Denmark, Finland, Norway and Sweden. Carbon
dioxide emissions of a trolley bus reach barely over one third of that of diesel EEV –
approximately 390 g/km. [100]
If the carbon dioxide emissions from Finnish electricity production (Figure 15) were
used for calculating the impact of trolley buses in Table 6, and assuming the same vehi-
cle energy demand, the amount of trolley bus emissions would rise to nearly double.
Trolley buses would generate approximately 66 percent of the amount of emissions gen-
erated by diesel EEV, which implies a figure of over 730 g/km.
Table 6 also shows that trolley buses do not bring in any exhaust-pipe emissions. Bat-
tery-electric buses are to large extent similar to trolley buses when considering gener-
ated emissions and exhausts. For these vehicle types, electricity production defines the
overall emission levels. Presently, one of the major aims stated by policy makers and
industry representatives is to reduce exhaust levels along with carbon dioxide emissions.
All the discussed alternative vehicle technologies contribute to these aims.

56
Since fuel cell buses typically utilise hydrogen for the production of electricity to elec-
tric propulsion motors, they generate only water vapour and heat as output. Therefore,
analysing hydrogen production would make a sensible contribution to getting a view of
hydrogen fuel cell-related carbon dioxide emissions. Earlier, in Chapter 3, the CO2 pro-
duced in hydrogen production was defined for various production methods. The emis-
sions from basic, non-sustainable production methods totalled from 12 to 19 kg CO2/kg
H2. The discussed fuel cell bus demonstration sites in the United States presented an
average fuel economy of 6.15 miles per DGE. Thus, the average consumption of hydro-
gen per kilometre for these vehicles approximates 116 grammes [54]. Considering the
CO2 emission levels from hydrogen production, these particular fuel cell buses would
total hydrogen production-based emissions of around 1,400 – 2,200 g CO2/km which is
clearly more than the measured diesel EEV emissions. Again, these emission levels do
not involve any carbon capture methods in hydrogen production.
Hydrogen production can be much more environmentally friendly when utilising sus-
tainable hydrogen production methods. An IEA study from 1999 reveals the huge differ-
ence in carbon dioxide emissions depending on the nature of hydrogen production. In
1999, diesel was said to generate well-to-wheel CO2 emissions from 52 to 74 percent of
the amount of emissions from gasoline. In the same comparison, total CO2 emissions
from hydrogen infrastructure ranged from 5 to 362 percent (i.e., compared to gasoline),
the amount of emissions depending largely on the hydrogen production method and
primary energy used for production. Thus, sustainable hydrogen production methods
would clearly be beneficial for hydrogen’s status among other vehicle fuels in terms of
generated greenhouse gases. [102]
The efficiency of the most prevalent hydrogen production technology – hydrocarbon
steam reforming – ranges from 65 to 75 percent, one of the highest efficiency rates con-
sidering current commercially available methods of production [103]. Close to 95 per-
cent of the existing hydrogen refineries are based on hydrocarbon steam reforming.
However, one tonne of refined hydrogen will create around 9 – 12 tonnes of carbon di-
oxide emissions as a by-product. Therefore, possible methods of carbon sequestration
(i.e., carbon capture, transport and disposal) are intensively examined. These methods
are still costly, as well as rarely implemented. Sequestration costs are estimated to ap-
proximate USD 20 - 100 per tonne of sequestered carbon [104]. For small-scale produc-
tion, carbon capture is not likely to be a feasible solution [18]. [105]
5.2.6 Passenger comfort
Comparing different vehicle types by technical features, related infrastructure and costs,
as well as environmental impacts covers a wide range of the necessary study. However,
one of the most important factors is missing, and that is the passenger using the vehicle.

57
Conventional diesel vehicles produce a great amount of exhausts that deteriorate the
healthy cityscape. Diesel-powered vehicles are typically generating high noise levels as
well.
Trolley buses, fuel cell buses and battery-electric buses are favouring the passenger
since they generate less or zero detrimental exhausts. They are also equipped with elec-
tric motors which clearly bring down the vehicle noise levels. Trolley buses and FCBs
may utilise APUs for additional propulsion power, which may involve increased noise
levels. However, compared to diesel buses, all these vehicle types provide smoother,
less bumpy rides and a healthier, less stressing travelling environment.

58
6 Definitions of Helsinki area policies
6.1 HSL
Helsinki Regional Transport Authority (HSL), established on 1st January 2010, is re-
sponsible for the planning and organisation of public transport within the Helsinki met-
ropolitan area. The joint local authority currently comprises six member municipalities:
Helsinki, Espoo, Vantaa, Kauniainen, Kerava and Kirkkonummi. The organisation that
is yet to be joined by several other municipalities in the Helsinki region carries on with
the work done by two different organisations before. HSL is responsible for improving
operating conditions for public transport, service procurements for bus, tram, metro,
ferry and commuter train traffic, as well as the drafting of the Helsinki Region Transport
System Plan. One of the duties of HSL is acquiring or chartering buses for the Helsinki
region traffic. Moreover, the organisation is responsible for public transport-related
marketing, as well as passenger information and ticket inspection. [106]
6.2 Charter bus fleet characteristics in the Helsinki region
– emissions
The morning traffic in Helsinki city comprised altogether 491 buses at the beginning of
2009. The buses which were mostly of the low-floor type were on weighted average 6.3
years old. In calculations concerning the average age of equipment, peak time buses
carry five times less weight than other buses. This evens out the associated statistical
distortion, the imbalance between less frequently used peak time buses and vehicles
with higher mileage. A bus should be replaced not later than at the age of 16 years. Cur-
rently, the annual need for new buses is close to 200 vehicles. HSL’s bus fleets hold
roughly 1,450 buses in total. [107] [96]
The degree of use of public transport assesses the levels of emissions produced per pas-
senger-kilometre and actual, driven kilometres. In 2009, the total mileage of Helsinki
city charter buses reached 32.64 million kilometres. 391.3 million passenger-kilometres
were recorded on the same stretch of time, which implies an average passenger count of
around 12. [107]

59
The actual amount of emissions generated by the bus traffic depends highly on the vehi-
cle technology. A common way to divide technologies into groups is to classify them
regarding the emission levels they generate. The European Union has adopted the Euro-
pean emission standards for heavy-duty diesel vehicle engines (see Appendix A: Euro-
pean emission standards). Table 7 divides the Helsinki city charter bus traffic by emis-
sion standards, hence casting light on the rate of use of various bus technologies.
Table 7: Chartered bus traffic by emission rates (Helsinki) [107]
Emission standard Bus mileage (million
km/year)
Share of total mileage
(%)
Euro I 0.17 1
Euro II 10.75 33
Euro III 10.26 31
Euro IV 3.34 10
Euro V 0.79 2
EEV 5.20 16
EX-gas-CNG 2.12 6
The acquisition of new buses is restricted to vehicles fulfilling the requirements of at
least the Euro V emission standard. A voluntary, additional emission class EEV presents
even lower emission rates. Even though EEV buses total 16 percent of the total mileage
in the Helsinki bus traffic, one third of mileage still consists of journeys driven by Euro
II buses with much higher emission levels. Anyhow, the trend is to minimise the exhaust
gases produced by public transport. For instance, a modern system for following the fuel
consumption of a certain vehicle or driver has been promoted and should come into play
during 2010. In around 2012 – 2013, all buses below the requirements of the Euro III
standard in Helsinki should be withdrawn from circulation because of the normal aging
of the vehicles [108]. [107]
Table 8 presents the average emission levels occurred from the Helsinki city bus traffic.
The VTT Technical Research Centre of Finland has measured the emission rates of dif-
ferent motor types by utilising the Braunschweig cycle. Figures are calculated based on
driven kilometres.

60
Table 8: Average city bus emissions (Helsinki, 2009) [107]
Emissions Tonnes g/passenger-
kilometre
g/driven kilometre
CO 42.06 0.107 1.283
HC 8.66 0.022 0.264
NOX 318.01 0.813 9.747
PM 5.03 0.013 0.156
CO2 39,428 100.76 1,207.95
6.3 Assessment of transport operators and their vehicles –
general remarks
Transport operators for charter bus traffic in the Helsinki city region are commonly cho-
sen through an open bidding competition. Tenders are reviewed carefully by estimating
their overall cost-effectiveness. The overall price and equipment quality comprise the
most relevant factors in the comparison of new buses. The price of a vehicle is weighted
in relation to the cheapest tender addressed to the transport authority. The vehicle is then
granted a certain amount of points that eventually determine the most suitable transport
operator and vehicle for a certain bus route. [109]
Equipment quality involves various technical features and physical measures. Fully low-
floor buses are valued higher than the ones with partly low floors. It is obligatory for
new vehicles to have some kind of a low-floor solution [110]. NOX and PM emissions
are rated through the Euro standards. The smaller the amount of emissions, the higher
the points for the vehicle examined. Maximum points are given for the motors fulfilling
the EEV standards. The vehicle is rewarded with extra points if the noise generated by
the motor and tyres stays at 75 dB(A) or less. [109]
In addition, vehicle seating is considered as a part of the equipment quality. To gain
extra points from the interiors, new buses should have seats with a clearance of 710 mm
or more. Collapsible chairs with the same minimum clearance are also favoured. To
reach the maximum points from the seating, seats should offer 750 mm of clearance.
[109]
Proper electrical ancillary equipment improves the quality of a vehicle. The transit au-
thority appreciates ancillary equipment, such as automatic air-conditioning, automatic
fire extinguishing and an extra heater for the vehicle idling time. Passenger air condi-

61
tioning should include filters for fresh air intake and cabin air. The air conditioning sys-
tem should create a cooling power of 20 kW, and as the Finnish winter is rather cold,
the system should possess the option of providing 25 kW of heating power. [109]
Besides the cheap price and equipment quality, it is preferred that bus operators orien-
tate and train bus drivers for their job. Bus drivers should go through an annual training
day or half-day. The transit authority (HSL) is prepared to arrange and facilitate a certain
amount of training. Otherwise, the transport operator organises the training sessions.
[109]
In order to maintain easy, safe conditions for passengers, all acquired vehicles must hold
several other characteristics. Effortless boarding and alighting, accessibility for the
handicapped and enough space for two perambulators are minimum requirements. Pas-
senger comfort should be improved through firm handrails and handles that provide
enough support for the passengers. Bus doors should be equipped with safety mecha-
nisms and the vehicle should have safety brakes that prevent the bus from moving while
the doors are opened. Clear identification, decent indoor lighting and lighting at bus
stops, as well as information material to be provided to passengers contribute to conven-
ient travelling. [110]
6.4 Carbon dioxide as a decisive measure
Prior to the new trend for measuring and assessing emission reductions, carbon dioxide
emissions were not directly regarded as a pollutive substance. They were not considered
in specifying the cleanliness of vehicles for public transport. Now, however, HSL is
beginning to emphasise the relevancy of CO2 emission reductions after a number of
studies and general opinions about the effect of greenhouse gases on global warming.
[96]
In the future, up to one third of the points granted for the equipment quality in the com-
parison process of new vehicles could be based on the generated CO2 levels. Emphasis-
ing the role of CO2 lessens the significance of other emissions and bus characteristics.
For instance, the meaningfulness of proper seating and low levels of NOX and PM emis-
sions will decline to some degree. [96]
HSL is ready to make investments in cleaner, environmentally friendly transport solu-
tions. The transport authority is willing to increase the contract time of new vehicles
from the present five years to seven years in the future [96]. This kind of development
could realistically lead to more intelligent, innovative vehicle solutions servicing the
needs of HSL.
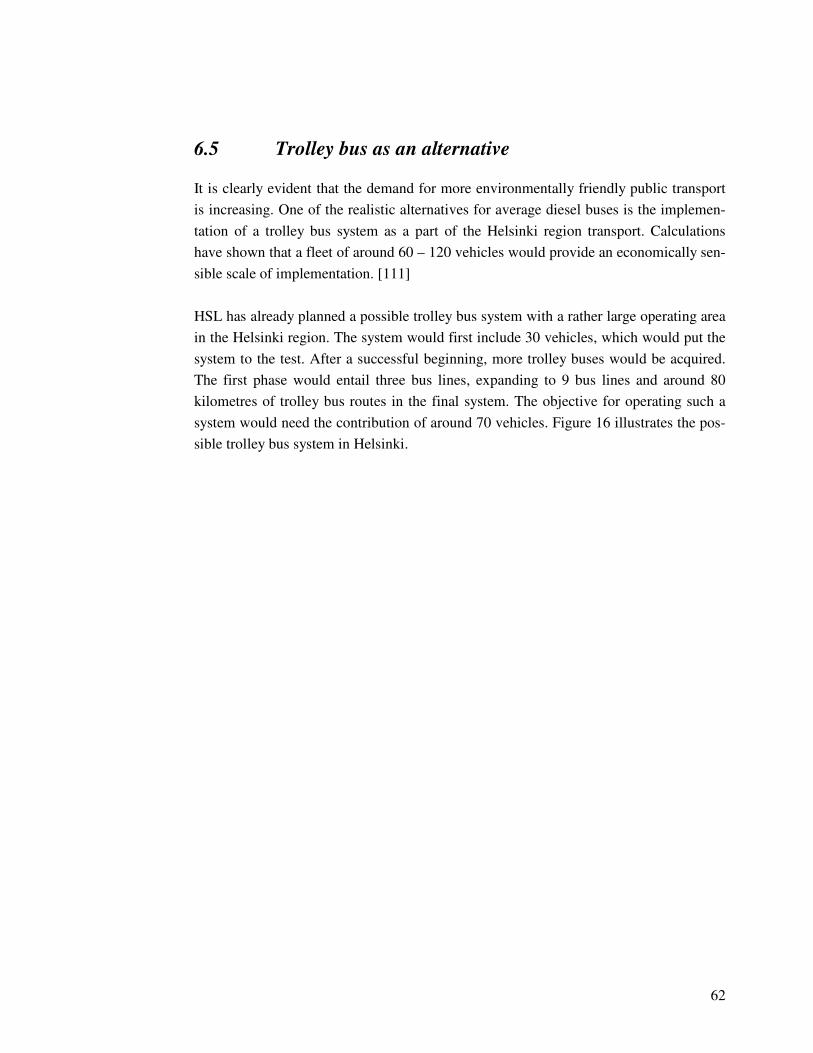
62
6.5 Trolley bus as an alternative
It is clearly evident that the demand for more environmentally friendly public transport
is increasing. One of the realistic alternatives for average diesel buses is the implemen-
tation of a trolley bus system as a part of the Helsinki region transport. Calculations
have shown that a fleet of around 60 – 120 vehicles would provide an economically sen-
sible scale of implementation. [111]
HSL has already planned a possible trolley bus system with a rather large operating area
in the Helsinki region. The system would first include 30 vehicles, which would put the
system to the test. After a successful beginning, more trolley buses would be acquired.
The first phase would entail three bus lines, expanding to 9 bus lines and around 80
kilometres of trolley bus routes in the final system. The objective for operating such a
system would need the contribution of around 70 vehicles. Figure 16 illustrates the pos-
sible trolley bus system in Helsinki.
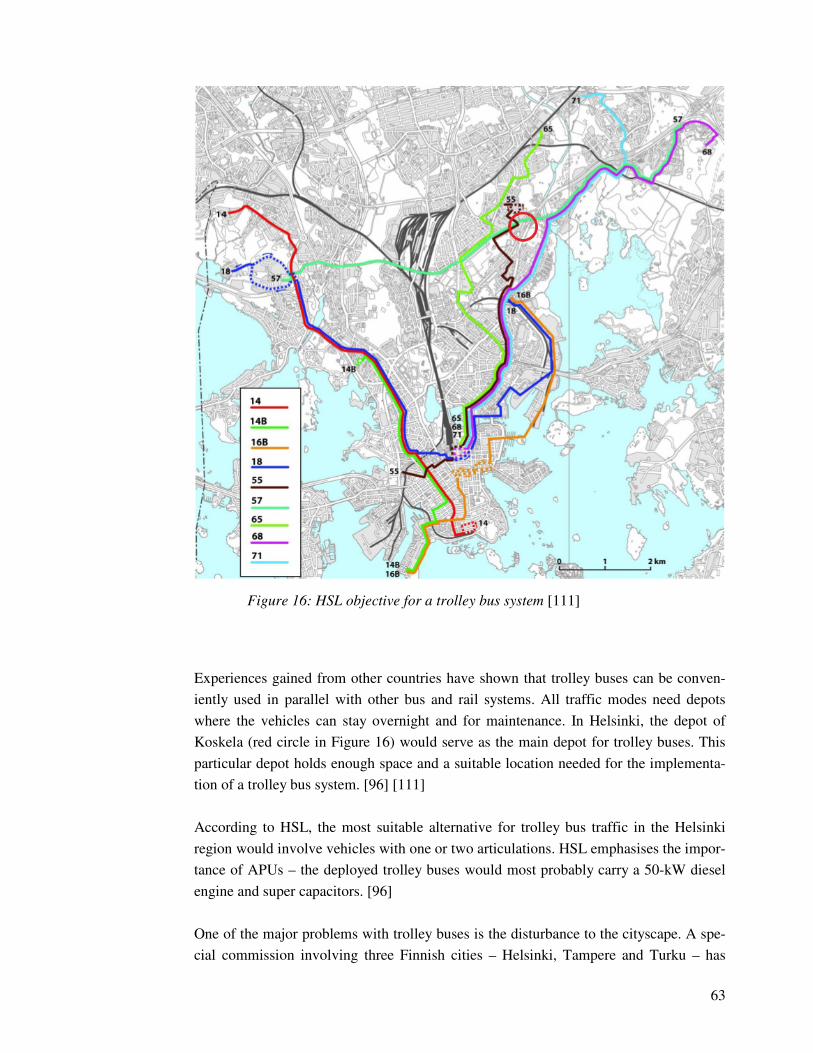
63
Figure 16: HSL objective for a trolley bus system [111]
Experiences gained from other countries have shown that trolley buses can be conven-
iently used in parallel with other bus and rail systems. All traffic modes need depots
where the vehicles can stay overnight and for maintenance. In Helsinki, the depot of
Koskela (red circle in Figure 16) would serve as the main depot for trolley buses. This
particular depot holds enough space and a suitable location needed for the implementa-
tion of a trolley bus system. [96] [111]
According to HSL, the most suitable alternative for trolley bus traffic in the Helsinki
region would involve vehicles with one or two articulations. HSL emphasises the impor-
tance of APUs – the deployed trolley buses would most probably carry a 50-kW diesel
engine and super capacitors. [96]
One of the major problems with trolley buses is the disturbance to the cityscape. A spe-
cial commission involving three Finnish cities – Helsinki, Tampere and Turku – has

64
been concentrating on defining transport systems and solutions that do not disturb the
cityscape too much. When implemented, a trolley bus system should incorporate a light
overhead line system and other infrastructure in the streets and depots. Diesel generators
could be used as the main propulsion provider when driving in the depot. [96]
6.6 Other modern bus technologies
In the long run, HSL envisages an increase in the use of electricity within the vehicle
industry. Fuel cell buses are technologically available and possible solutions for envi-
ronmentally friendly public transport but still involve some major difficulties with the
price issues and non-conformity. Battery-electric buses and related infrastructure require
more development, and thus, are not yet considered as an alternative. HSL is not yet
ready to add such vehicles to its fleets.
HSL has sized up fuel cell buses as an option for public transport. However, the expen-
siveness of the hydrogen fuel makes fuel cell buses an unattractive alternative. Also
with the high vehicle purchase price, it would not be beneficial to deploy fuel cell buses
in HSL’s fleets. The cheapest, and only, tender addressed to HSL for hydrogen fuel has
stayed at 9 €/kg (Woikoski Ab). Considering the hydrogen fuel consumption of the
FCBs in the ECTOS and CUTE projects (i.e., approximately 0.2 kg/km), the price of
each driven kilometre would rise up to an unacceptably high level of 1.8 €/km. More-
over, HSL estimates that the actual hydrogen fuel consumption could even rise up to
0.26 kg/km. [96]
For battery-electric buses, the restrictions mainly consist of poor availability, as well as
highly priced batteries and non-standardised infrastructure. In novel vehicle solutions,
batteries are typically used for additional propulsion power. The immaturity of the tech-
nology and the lack of standards hold back BEBs, and therefore, they are not a short-
term option for public transport organised by HSL. [96]
6.7 Near future environmental goals for Helsinki city traf-
fic
A working party of the Helsinki city for climate protection has proposed criteria for low-
emission vehicles. Objectives of the working party include finding solutions for creating
incentives to increase the use of low emission vehicles, as well as establishing a low
emission zone to the city centre. [112]
65
There are several ways for increasing the use of low emission vehicles. Improving the
dissemination of information, following experiences gained in other cities and countries,
acquiring only low emission vehicles for communal use and promoting additional bene-
fits for low emission vehicles could contribute to the development. In respect to electric
vehicles, the city should also define its opportunities to support the expansion of an
electricity distribution network. Moreover, Helsinki could make an appeal to the Finnish
state for creating tax incentives for low emission vehicles. [112]
For improving the quality of air in the city centre, a special low emission zone is rec-
ommended. The special zone would bring restrictions pertaining to the bus traffic and
communal waste transport. Thus, it could lead to enhancing the technology used in re-
lated vehicles. Emission limits should be created by the transport authorities for com-
munal bus traffic and waste transport – i.e., HSL and the Helsinki Region Environ-
mental Services Authority (HSY). Figure 17 illustrates the proposed low emission zone
(green), as well as the area currently restricted from vehicles over 12 metres long (or-
ange). The restriction area does not apply to buses. [112]
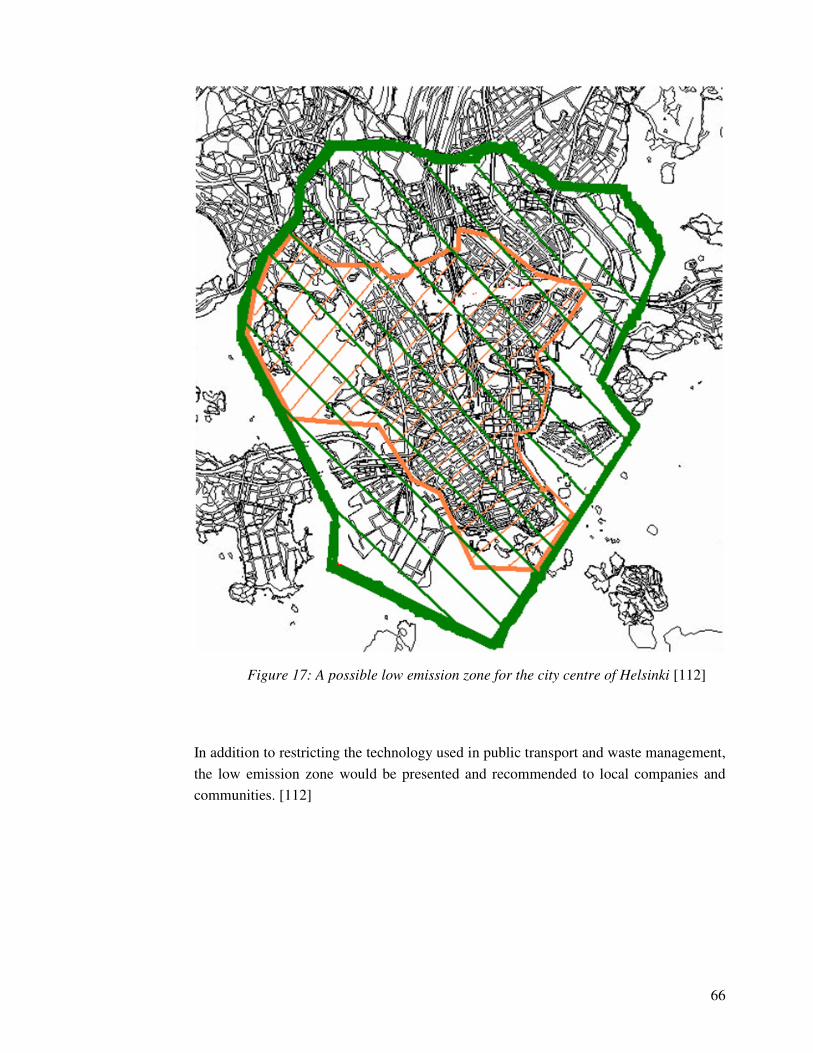
66
Figure 17: A possible low emission zone for the city centre of Helsinki [112]
In addition to restricting the technology used in public transport and waste management,
the low emission zone would be presented and recommended to local companies and
communities. [112]
67
7 Electrification of delivery traffic
7.1 The trend of growing goods transport
Urban environments are full of freight flows heading to various destinations. Not only
passengers, but things – e.g., consumer goods, building materials, communal waste, and
post – need to be delivered continuously. The nature of the typically unforeseeable de-
livery traffic differs greatly from the pre-planned passenger transport. The internal struc-
ture of average cities does not contribute to the delivery of goods. Freight is often deliv-
ered by using inflexible, uneconomical delivery methods and routes. Although the over-
all delivery of goods lacks sufficiency and efficiency, deliveries must be done in one
way or another. [113]
Therefore, efforts made to improve the vehicle technologies used in delivery transport
will be highly valuable for the environment. Studies have showed, that freight flows
constitute about one fourth of the street traffic of a typical city [113]. The significant
amount of goods transport on city roads opens up possibilities for novel, more environ-
mentally friendly propulsion and vehicle technologies. The European Union has set an
ambitious goal of decreasing carbon dioxide emissions by 20 percent from the level of
1990 by 2020 [114]. It is a fact that road transport causes 25 percent of all human-based
carbon dioxide emissions [115], thus pursuing the goal of the EU necessitates actions
not least in the sector of delivery traffic.
7.2 Electrification of delivery traffic – demonstrations and
commercial usage
In order to improve the sustainability of local communities, actions for implementing
electrification of delivery vehicle fleets have been taken in various countries worldwide.
Not every demonstration project of electrification has been successful, but all develop-
ment and testing of new technologies might be informative benefitting future efforts.
The reasonable possibilities for delivery vehicle electrification are mainly provided by
battery and fuel cell technologies.

68
Battery technologies for electric vehicles have faced several difficulties. One of the
demonstrations of electric vehicles ending up in a disappointment was arranged in Rot-
terdam, the Netherlands. In 2001, Rotterdam deployed seven electric delivery vehicles
for commercial transport. After several electrical problems with battery management,
the operation of vehicles was quit during 2004. The vehicles could not operate effi-
ciently in the daily distribution because of battery system-related breakdowns. The Rot-
terdam demonstration was carried out in the framework of the project ELCIDIS (ELec-
tric vehicles in CIty DIStribution), co-financed by the EU. [116]
However, the continuous development of battery-electric vehicles has made them a real
competitor to more conventional vehicle technologies. One of the newest collaborations
in electric vehicle distribution will happen between the Scandinavian THINK and the
French Mobivia Groupe, a company that recently has established a division for sustain-
able mobility, also referred to as the O2City. The partnership with the Mobivia Groupe
provides THINK a great opportunity for large-scale electric vehicle distribution. [117]
The THINK City electric vehicle contains a plug-in electric power train and provides a
range of 160 km. Reaching an 80-percent state of charge takes approximately 9.5 hours
with slow-charging the vehicle in distribution network (230 V AC, 14 A). Reaching a
full charge takes around 13 hours. The batteries used in THINK City involve two differ-
ent functionalities. Zebra’s sodium batteries (MES DEA) operate in temperatures of
between 260 °C and 360 °C, while Li-ion batteries from EnerDel provide operation in
ambient temperatures. EnerDel batteries make it possible for the vehicle to be un-
plugged while not in use. The batteries from Zebra provide high energy density maxi-
mising the vehicle range. In total, the batteries offer 45 kWh of energy. A rather moder-
ate maximum power of the vehicle power train peaks at 30 kW. The current price for the
THINK City electric vehicle in Finland is a little under EUR 50,000 [118]. [117]
THINK and EnerDel have also collaborated before. In 2008, the Japanese postal service
went on to start a process of converting its gasoline-fuelled postal truck fleets to battery-
electric. The two companies specialised in electric vehicle technologies provided the
electric drive system to a Japanese automotive company working under Japan Postal.
Conversions were made using the same battery system of EnerDel as in THINK City.
The deal was significant since it covered around 5,500 trucks under the operation of the
postal service. [119]
The electrification of delivery traffic does not always need to involve small vehicles.
Also heavy-duty solutions have been presented for shorter distances within the limits of
battery range. An example of heavy-duty electrification comes from Los Angeles (LA),
the United States. The port of LA invested in a cooperative project with the South Coast
Air Quality Management District in 2007 to demonstrate an electrified heavy-duty truck.

69
The short-range vehicle was designed by Balqon, a Santa-Ana, California-based devel-
oper and manufacturer of heavy-duty electric trucks and tractors. The vehicle is capable
of hauling a 40-foot cargo container in full load. The maximum range for the vehicle
carrying a full load was stated to be around 48 kilometres. The electric heavy-duty truck
is recharged through an existing power system operating at 440 V. Reaching a full state
of charge takes around 3 – 4 hours. One hour of charging is enough to provide a state of
charge of 60 percent. The LA port reported a clear energy consumption reduction from
the earlier 5 kWheq/km of diesel trucks to 1.25 kWh/km consumed by the battery elec-
tric trucks. In 2007, the price of the Balqon heavy-duty vehicle cost circa USD 200,000.
[120]
During 2010, Balqon has now established six international dealer agreements after an
order for electric drive systems worth USD 490,000 from the China-based DynaProTech
in August. The Chinese company has planned to integrate Balqon’s electric drive train
with electric buses, heavy-duty trucks, light commercial vehicles and passenger cars.
DynaProTech will provide Chinese vehicle markets servicing and parts for Balqon’s
products. [121]
Thus, there is certainly interest towards electrification of various kinds of delivery vehi-
cles. Some electric vehicle manufacturers have reached an economically profitable, solid
market base. The industry leader and the world’s largest manufacturer of commercial
electric vehicles is the United Kingdom-based Smith Electric Vehicles (SEV), a com-
pany that produces battery-electric vans and trucks. SEV delivers vehicles ranging from
approximately 5.2 to 8.8 metres in length primarily to North America, Europe and
South-East Asia. In the United Kingdom alone, SEV has a service and support network
that maintains over 5,000 vehicles for major fleet operators. [122] [123]
Another means for vehicle electrification is offered by fuel cells. Within the bus indus-
try, fuel cells seemed to incur great costs. The prices of smaller fuel cell vehicles are
high as well. However, the technology provides well-functioning solutions already in
use. One existing example of utilising fuel cells successfully comes from Toyota’s hy-
brid hydrogen fuel cell vehicle development programme. The FCHV designs by Toyota
are based on the Toyota Highlander production sport utility vehicle. The FCHV-adv,
from 2008, carries a permanent magnet electric motor and a Toyota PEM fuel cell stack
both providing a 90-kW maximum output. Additionally, the FCHV-adv is equipped
with nickel-metal hydride batteries providing 21 kW. The competitive range of the vehi-
cle comes close to 700 kilometres with the help of two high-pressure, 700-bar hydrogen
tanks carrying in total 6.31 kilogrammes of hydrogen. [124]
70
7.3 Itella Corporation – delivering postal mail and parcels
One of the main players to pursue for vehicle electrification in Finland is the Itella Cor-
poration which delivers the daily mail throughout the country. Nearly 17,000 mail carri-
ers and sorters work to ensure the delivery of various kinds of postal items to Finnish
households. Around Finland, there are approximately 8,000 letterboxes for smaller mail.
Parcels are usually sent from one of the 1,100 Itella post offices. [125]
Itella deploys in total over 5,000 vehicles in mail delivery and logistics services. The
combined mileage of these vehicles totals approximately 170 million kilometres per
year. For mail delivery, Itella deploys around 3,200 motor vehicles. 3,000 of these are
vans or cars, whereas the remaining 200 vehicles are smaller mopeds. Excluding mo-
peds, Itella needs annually from 400 to 700 new motor vehicles for its fleets. Itella typi-
cally leases its delivery cars and vans in six-year periods. Currently, the shortest mail
delivery route for cars and vans approximates 70 kilometres. The longest routes are
around 350 – 400 kilometres long, mostly in Northern Finland. In some cases, the deliv-
ery vehicle serving a specific route may have to pick up one or several additional loads
of mail from a centralised mail storage point. This increases the daily mileage. [125]
[126]
Thus, the operation of the postal service highly depends on motor vehicles. The most
efficient way of improving sustainability for Itella is to reduce emissions related to the
operation of delivery and logistics vehicles. Besides reducing fuel consumption and car-
bon dioxide emissions by efficient route planning, combined deliveries and environmen-
tally friendly way of driving, Itella has opted to promote green electricity, vehicle elec-
trification and usage of alternative fuels. [125]
Itella has committed to reduce 10 percent of its carbon dioxide emissions by 2012 and
30 percent by 2030. According to the estimations of Itella, the first goal can be achieved
by utilising electric mopeds, but the later aim necessitates other solutions, such as de-
ploying battery-electric vans and cars. The Finnish mail delivery already has experience
of electric cars. In the past, the former Finnish mail delivery company, Posti, used over
70 Elcat electric vehicles to deliver mail. Due to the poor battery technologies and in-
competent range offered by the EVs, these vehicles were not used for long. In 2008, a
three-year tryout of Itella, utilising an electric Citroen Berlingo, ended after the lead-
based batteries reached the end of their life cycle. New batteries would have cost around
EUR 10,000 – 15,000. After summing up the pros and cons, the vehicles were not util-
ised anymore. Currently, Itella has plans to convert a couple of Volkswagen vans to bat-
tery-electric. A partner in this project will be the Finnish battery manufacturer European
Batteries Ltd. [126]

71
Itella will also use electric carts, scooters and mopeds. Figure 18 illustrates a Swedish
electric moped largely used by Itella in Sweden. This moped type has also been in re-
stricted use in Finland. Itella’s plans for the future electric moped fleets include deploy-
ing small wind power plants for recharging the mopeds. The wind power plants would
probably be located next to the head office in Helsinki. [126]
Figure 18: An electric moped produced by Norsjö Moped AB [127]
Battery-electric cars on the market today offer a driving distance of approximately 150
kilometres. Regarding the energy consuming, cyclical driving profile of the mail deliv-
ery (i.e., frequent stopping and accelerating), the range car manufacturers promise, will
decrease significantly. This means that the electric cars and vans in mail delivery should
be recharged, possibly, several times a day to cover the whole delivery route. Such ar-
rangement necessitates centralised fast-charging solutions.
72
8 Conclusions
This Master’s thesis presented the potential electric vehicle technologies for bus and
delivery traffic, particularly to be implemented in the Finnish traffic sector. The study
concentrated on vehicle technologies already demonstrated or consistently utilised in
regional or local traffic fleets around the world. To get an extensive view of the used
technologies, the study described various separate vehicle demonstrations. Two inter-
views were used to reflect the attitudes towards vehicle electrification in the Helsinki
region.
From an economical point of view, an apparently reasonable short-term alternative for
the Helsinki region bus traffic is the trolley bus. The city of Helsinki already has some
earlier experience of trolley buses from the past decades. Considering the demonstration
projects implemented elsewhere, modern trolley buses function well enough in cold
climates. The investment price of one vehicle is the cheapest among the discussed bus
alternatives. The lifetime of the vehicle also presents a major advantage. One of the dif-
ficult issues with trolley buses is the needed infrastructure. A costly, visible overhead
network might invoke displeasure.
Fuel cell vehicles and battery-electric vehicles are to be developed further for proper
implementation in the future. At the moment, these vehicle technologies are typically
either very expensive or provide a short life cycle. The fuel cell and battery technologies
are being strongly developed, also subsidised by governments. In Finland, the knowl-
edge of the battery technologies and fuel cells increases all the time. Several state-
supported projects aim for the development of these technologies.
Vehicular solutions purely depending on batteries are not seen as a lucrative solution for
the bus traffic in the near future. However, demonstrations utilising battery-switching
stations or fast-charging points could be used for promoting the future development of
vehicle battery technologies, as well as improving the attitudes shown towards battery-
electric vehicles. Despite the technological restrictions, batteries might be utilised in
buses to provide auxiliary or regenerative power for extending the vehicle range and
reducing the amount of generated exhaust gases. In contrast to buses, there are already
electric cars on the Finnish automotive market. Thus, it is likely that we will see some
kind of electric delivery vehicles or more EVs for car rental soon. The Itella Corpora-
tion, for instance, has informed about its interest towards vehicle electrification.

73
The viability of the different vehicle technologies in public transport or delivery traffic
depends highly on the production and costs of consumed fuel or electricity. Hydrogen
production and distribution in Finland are clearly not widely enough established to pro-
vide a sufficient hydrogen infrastructure for a large-scale vehicular use. The production
of hydrogen poses two fundamental problems: high emission levels (i.e., carbon diox-
ide) and expensive carbon sequestration. These issues hinder the use of hydrogen by
making it a very expensive fuel. The Finnish electricity production aims for increased
utilisation of renewable energy in order to reduce emissions and hit the emission targets
assessed by the EU. The trend of growing renewable electricity production will directly
improve the sustainability of battery-electric vehicles and trolley buses.
This thesis discussed electric vehicles capable of utilising external or stored electricity
or hydrogen for propulsion. Several electric vehicle technologies were examined one by
one to find out the most suitable options for bus and delivery traffic. For more practical
results, it is recommended that different combinations of these vehicle technologies
(e.g., dual-mode vehicles) and the use of APUs would be examined more thoroughly to
find out the most feasible electric vehicle solutions for bus and delivery traffic.

74
References
[1] VUCHIC, Vukan R. Urban Transit Systems and Technology. Hoboken, New Jersey & Canada: John Wiley & Sons, Inc., March 2007. ISBN: 978-0-471-75823-5.
[2] LEHMUSKOSKI, Ville et al. Ympäristöystävällisen Kaupunkiliikenteen Kehittämi-nen Helsingissä. [D: 9/2007] Helsinki, Finland: HELSINKI CITY TRANSPORT Plan-ning Unit. 27 November 2007.
[3] EKLUND, Pipsa e. a. Johdinautoliikenteen Toteutettavuusselvitys. [HKL:n jul-kaisusarja D: 2/2009] Helsinki, Finland: HELSINKI CITY TRANSPORT Planning Unit. 16 April 2009.
[4] Trolleybus UK. Trolleybuses: Characteristics and Applications. [accessed 3 March 2010] Available from: <http://www.tbus.org.uk/vuchic.htm>.
[5] ANDERSSON, P. G. Trolleybus Landskrona - the World's Smallest Trolleybus "Sys-tem". Trivector Traffic AB, 20 June 2006. [accessed 20 July 2010] Available from: <http://www.trolleymotion.com/common/files/uitp/Anderson_Landskrona.pdf>.
[6] BJÖRKLUND, Stefan, et al. New Concepts for Trolley Buses in Sweden. Nya Kon-cept För Trådbussar i Sverige. KFB - Swedish Transport and Communications Re-search Board. December 2000. ISSN: 1104-2621, ISBN: 91-89511-25-5.
[7] BELL, Irvine. Engineering. Trolleybus UK. [accessed 10 March 2010] Available from: <http://www.tbus.org.uk/engineering.htm>.
[8] BELL, Irvine. Why the Trolleybus? Trolleybus UK. [accessed 6 March 2010] Avail-able from: <http://www.tbus.org.uk/article.htm>.
[9] Škoda Holding. Trolleybuses. ŠKODA HOLDING. [accessed 6 March 2010] Avail-able from: <http://www.skoda.cz/en/skoda-holding/products/products-transportation/trolleybuses>.
[10] ZIEGLER, Ingemar. Yttrande Över Motion 2008:39 Om Trådbussar i Stockholms Innerstad. VON SCHANTZ, Johan. Pronouncement. 3 June 2009.
[11] HOOGERS, Gregor. Fuel Cell Technology Handbook. Boca Raton, Florida: CRC Press, 2003. ISBN: 0849308771.
[12] What is a Fuel Cell? Fuel Cells 2000. [accessed 16 March 2010] Available from: <http://www.fuelcells.org/>.
[13] COOK, B. Introduction to Fuel Cells and Hydrogen Technology. Engineering Sci-ence and Education Journal, 2002, vol. 11, no. 6. pp. 205-216. ISSN 0963-7346.

75
[14] EUDY, L. et al. Fuel Cell Buses in U.S. Transit Fleets: Summary of Experiences and Current Status. [NREL/TP-560-41967] 1617 Cole Boulevard, Golden, Colorado: NREL National Renewable Energy Laboratory. September 2007. [accessed 27 March 2010] Available from: <http://www.nrel.gov/hydrogen/pdfs/41967.pdf>.
[15] CRAWLEY, Gemma. Proton Exchange Membrane (PEM) Fuel Cells. Fuel Cell Today. March 2006. [accessed 17 March 2010] Available from: <http://www.fuelcelltoday.com/media/pdf/archive/Article_1084_PEM%20article.pdf>.
[16] Biomeri Oy. Sähköajoneuvot Suomessa - Selvitys. Biomeri Oy. 6 August 2009.
[accessed 23 February 2010] Available from:
<http://www.tem.fi/files/24099/Sahkoajoneuvot_Suomessa-selvitys.pdf>.
[17] How Fuel Cells Work. Ballard Power Systems Inc. [accessed 17 March 2010] Available from: <http://www.ballard.com/About_Ballard/Resources/How_Fuel_Cells_Work.htm>.
[18] GIELEN, Dolf and SIMBOLOTTI, Giorgio. Energy Technology Analysis - Pros-pects for Hydrogen and Fuel Cells. © OECD/IEA. , 2005. ISBN : 92-64-109-579 2005. [accessed 1 April 2010] Available from: <http://www.iea.org/textbase/nppdf/free/2005/hydrogen2005.pdf>.
[19] FCvelocity(TM)-HD6. Ballard Power Systems Inc., December 2010. [accessed 17 March 2010] Available from <http://www.ballard.com/Motive_Power/Heavy_Duty_Market/Product_Specifications.htm>.
[20] KAURANEN, Pertti and IHONEN, Jari. Synthesis and Durability of Carbon Nano-tube Based Membrane Electrode Assemblies for PEM Fuel Cells. VTT, 17 September 2007. [accessed 13 April 2010] Available from: <http://www.vtt.fi/liitetiedostot/cluster6_rakentaminen_yhdyskuntatekniikka/nanodurameapublic.pdf>.
[21] EGGERT, A. R., et al. Characteristics of an Indirect-Methanol Fuel Cell System. Energy Conversion Engineering Conference and Exhibit, 2000. (IECEC) 35th Interso-ciety, vol. 2, pp. 1326-1332.
[22] Fuel Cell. Answers.com. [accessed 13 April 2010] Available from: <http://www.answers.com/topic/fuel-cell>.
[23] CURTIN, Sandra E. et al. A Report on Worldwide Hydrogen Bus Demonstrations, 2002-2007. [FTA-GA-04-7001-2009.01] U.S. Department of Transportation - Federal Transit Administration. 2009. [accessed 16 March 2010] Available from: <http://www.fta.dot.gov/documents/ReportOnWorldwideHydrogenBusDemonstrations_2002to2007.pdf>.
[24] SAXE, M. et al. Energy System Analysis of the Fuel Cell Buses Operated in the Project: Clean Urban Transport for Europe. Energy, 5, 2008, vol. 33, no. 5. pp. 689-711. ISSN 0360-5442.
[25] STOLZENBURG, Klaus and SCHNELL, Patrick. Hydrogen Infrastructure: What have we Learned from HyFLEET:CUTE. Hamburg: HyFLEET:CUTE. [accessed 22 March 2010] Available from:

76
<http://hyfleetcute.com/data/Schnell_Stolzenburg_H2_Infrastructure_What_Have_we_Learned.pdf>.
[26] CUTE. HyFLEET:CUTE. [accessed 12 March 2010] Available from: <http://www.global-hydrogen-bus-platform.com/About/History/CUTE>.
[27] ECTOS. HyFLEET:CUTE. [accessed 12 March 2010] Available from: <http://www.global-hydrogen-bus-platform.com/About/History/ECTOS>.
[28] STEP. HyFLEET:CUTE. [accessed 12 March 2010] Available from: <http://www.global-hydrogen-bus-platform.com/About/History/STEP>.
[29] EcoBus - Perth Fuel Cell Bus Trial. Government of Western Australia - Depart-ment of Transport. [accessed 13 March 2010] Available from: <http://www.transport.wa.gov.au/greentransport/19524.asp>.
[30] Transit Buses. © California Fuel Cell Partnership. Available from: <http://www.cafcp.org/transit-buses>.
[31] UTC Power Attains 5,000-Hour Durability Milestone with Transit Bus Fuel Cell System. South Windsor, Connecticut, USA: UTC Power, 13 January 2010. [accessed 25 March 2010] Available from: <http://cafcp.org/sites/files/UTCPowerFCBsystemattainsdurabilitymilestone.pdf>.
[32] VAN DOKKUM, Jan and DASINGER, Andrew. Meeting the Challenges in the Transport Sector. Journal of Power Sources 181 (2008) 378-381. [accessed 25 March 2010] Available from: <http://www.sciencedirect.com/science?_ob=MImg&_imagekey=B6TH1-4S21TM9-1-3&_cdi=5269&_user=8758044&_pii=S0378775308004412&_origin=search&_coverDate=07%2F01%2F2008&_sk=998189997&view=c&wchp=dGLbVlW-zSkWA&md5=323af9db4b22c244a4136def3debc051&ie=/sdarticle.pdf>.
[33] JERRAM, Lisa C. 2008 Bus Survey. Fuel Cell Today. December 2008. [accessed 31 March 2010] Available from: <http://www.fuelcelltoday.com/media/pdf/surveys/2008-Bus-Survey.pdf>.
[34] PEM Fuel Cell Product Portfolio. Ballard Power Systems Inc., April 2009. [ac-cessed 18 March 2010] Available from: <http://www.ballard.com/Motive_Power/Heavy_Duty_Market/Product_Specifications.htm>.
[35] Fuel Cells in Mass Transit: A Cost-Benefit Perspective. Ballard Power Systems Inc., May 2009. [accessed 17 March 2010] Available from: <http://www.ballard.com/Motive_Power/Heavy_Duty_Market/Knowledge_Library.htm>.
[36] Ballard to Power SunLine Transit Agency Buses. Ballard Power Systems Inc. 2 march 2010. [accessed 18 March 2010] Available from: <http://phx.corporate-ir.net/phoenix.zhtml?c=76046&p=irol-newsArticle&ID=1397804&highlight=>.
[37] EUDY, L.et al. Fuel Cell Buses in U.S. Transit Fleets: Current Status 2009. [NREL/TP-560-46490] NREL National Renewable Energy Laboratory. October 2009.
77
[accessed 31 March 2010] Available from: <http://www.nrel.gov/hydrogen/pdfs/46490.pdf>.
[38] MAACK, Maria H. and SCHUCAN, Thomas H. ECOLOGICAL CITY TRANS-PORT SYSTEM. Icelandic New Energy Ltd., IEA Hydrogen Implementing Agreement. January 2006. [accessed 24 March 2010] Available from: <http://www.ieahia.org/pdfs/ECTOS.pdf>.
[39] SKÚLASON, Jón B. Deliverable 19: Final Public Report. [EVK-CT-2000-00033] Icelandic New Energy Ltd., The ECTOS project, Iceland. 2006. [accessed 26 March 2010] Available from: <http://www.newenergy.is/newenergy/upload/files/utgefid_efni/ectos_19-_final_report.pdf>.
[40] Der Citaro FuelCELL-Hybrid. GENERATION ZERO-EMISSION. Mercedez-Benz. [accessed 22 March 2010] Available from: <http://www.mercedes-benz.de/content/germany/mpc/mpc_germany_website/de/home_mpc/bus/home/new_buses/models/regular_service_busses/citaro/FuelCELL_Hybrid.html>.
[41] SKÚLASON, Jón B. Delivery 11: Report on Specification and Features of the Fuel Cell Busses. [Contract no: EVK4 -CT-2000-00033, Proposal no EVK 2000-00698] Ice-landic New Energy Ltd., The ECTOS project, Iceland. 2004. [accessed 19 March 2010] Available from: <http://www.newenergy.is/newenergy/upload/files/utgefid_efni/ectos_11-specification_of_fc_buses.pdf>.
[42] CHENG, Xuan et al. A Review of PEM Hydrogen Fuel Cell Contamination: Im-pacts, Mechanisms, and Mitigation. Journal of Power Sources 165 (2007) 739-756, 8 January 2007. [accessed 19 March 2010] Available from: <http://www.sciencedirect.com/science?_ob=ArticleURL&_udi=B6TH1-4MS9RF8-1&_user=8758044&_coverDate=03%2F20%2F2007&_rdoc=1&_fmt=high&_orig=search&_sort=d&_docanchor=&view=c&_searchStrId=1257543769&_rerunOrigin=google&_acct=C000109213&_version=1&_urlVersion=0&_userid=8758044&md5=9b29e80249c7c38db861c2eccfeccc8f>.
[43] BAILEY, J. R., PhD; and HAIRR, Mark E. East Tennessee Hydrogen Initiative, Chattanooga. Chattanooga, Tennessee, United States: Center for Energy, Transportation and the Environment, University of Tennessee at Chattanooga (Sponsored by: U.S. De-partment of Transportation - Federal Transit Administration). 30 September 2009. [ac-cessed 29 March 2010] Available from: <http://www.fta.dot.gov/documents/EastTennesseeHydrogenInitiativeChattanooga.pdf>.
[44] EvoBus History, Highlights 1995 - 2008. © 2001 - 2010 EvoBus GmbH. [accessed 29 March 2010] Available from: <http://www.evobus.com/inter-evobus/0-674-399764-1-1034841-1-0-0-0-0-1-6984-399764-0-0-0-0-0-0-0.html>.
[45] The Citaro FuelCELL Hybrid - Generation Zero Emission. Mannheim, Germany: EvoBus GmbH, Mercedes-Benz Bus and Coach unit. [accessed 30 March 2010] Avail-able from: <http://www.mercedes-benz.de/content/media_library/hq/hq_mpc_reference_site/bus_ng/services_accessories/brochures/FUEL_CELL/fuel_cell_technical_data_2009_en_pdf.object-Single-MEDIA.tmp/MBO09003_Citaro_FuellCELL-Hybrid_EN.pdf>.

78
[46] Element Hydrogen - H. Copyright 1995 - 2010 Kenneth L. Barbalace (J.K. Barbal-ace, inc). 2007. [accessed 3 June 2010] Available from: <http://environmentalchemistry.com/yogi/periodic/H.html>.
[47] Historical Exchange Rates - FXHistory(R): Quality Rates from 1990. OANDA Corporation. 2009. [accessed 7 April 2010] Available from: <http://www.oanda.com/currency/historical-rates>.
[48] KARLSTRÖM, Magnus. Local Environmental Benefits of Fuel Cell Buses - a Case Study. Journal of Cleaner Production 13 (2005) 679-685, 2005. [accessed 7 April 2010] Available from: <http://www.sciencedirect.com/science?_ob=MImg&_imagekey=B6VFX-4BNMHVF-6-1&_cdi=6022&_user=8758044&_pii=S095965260400023X&_orig=search&_coverDate=06%2F30%2F2005&_sk=999869992&view=c&wchp=dGLbVlW-zSkzV&md5=48e431d01e6b30a1341592eefd4e8273&ie=/sdarticle.pdf>.
[49] OWEN, Anthony D. and COCKROFT, Colin. A Cost-Benefit Analysis of Perth's
Hydrogen Fuel Cell Buses. Murdoch University. March 2006. [accessed 7 April 2010]
Available from: <http://www.dpi.wa.gov.au/mediafiles/alt_cba.pdf>.
[50] CALLAGHAN, Lisa; and LYNCH, Sheila. Analysis of Electric Drive Technologies for Transit Applications: Battery-Electric, Hybrid-Electric and Fuel Cells. [FTA-MA-26-7100-05.1] Federal Transit Administration, U.S. Department of Transportation. Au-gust 2005. [accessed 12 April 2010] Available from: <http://www.fta.dot.gov/documents/Electric_Drive_Bus_Analysis.pdf>.
[51] FULTON, Lew. SUSTAINABLE TRANSPORT: New Insights from the IEA's Worldwide Transit Study. IEA. 2001. [accessed 7 April 2010] Available from: <http://www.iea.org/papers/2001/cop7achsus.pdf>.
[52] IEA Energy Technology Essentials - Hydrogen Production & Distribution. © OECD/IEA, April 2007. [accessed 7 April 2010]. Available from: <https://www.iea.org/techno/essentials5.pdf>.
[53] HARALDSSON, K. et al. Fuel Cell Buses in the Stockholm CUTE project—First
Experiences from a Climate Perspective. Journal of Power Sources, 8/18, 2005, vol.
145, no. 2. pp. 620-631. ISSN 0378-7753. Available from:
<http://www.sciencedirect.com/science/article/B6TH1-4G992PR-
3/2/3e3188cea4839943073f29b975fefdc0>.
[54] Lower and Higher Heating Values of Fuels. Hydrogen Analysis Resource Center (US Department of Energy). March 2006. [accessed 31 March 2010] Available from: <http://hydrogen.pnl.gov/cocoon/morf/hydrogen/site_specific/fuel_heating_calculator?canprint=false>.
[55] VINCENT, C. A. Battery Systems for Electric Vehicles. 2000. Electric, Hybrid and Fuel Cell Vehicles (Ref. No. 2000/050), IEE Seminar.
[56] CHAN, C. C. The State of the Art of Electric, Hybrid, and Fuel Cell Vehicles. Pro-ceedings of the IEEE, 2007, vol. 95, no. 4. pp. 704-718. ISSN 0018-9219.

79
[57] FULTON, Lew, et al. Transport, Energy and CO2: Moving Toward Sustainability. IEA PUBLICATIONS, 9, rue de la Fédération, 75739 PARIS CEDEX 15: © IEA/OECD, 2009. ISBN: 978-92-64-07316-6.
[58] ELIAS, M. F. M., et al. Lithium-Ion Battery Charger for High Energy Application. 2003. Power Engineering Conference, 2003. PECon 2003. Proceedings, pp. 283-288.
[59] DINGER, Andreas, et al. Batteries for Electric Cars - Challenges, Opportunities, and the Outlook to 2020. The Boston Consulting Group, Inc. January 2010. [accessed 19 April 2010] Available from: <http://www.bcg.com/documents/file36615.pdf>.
[60] European Batteries. European Batteries Oy. 2010. [accessed 20 April 2010] Avail-able from: <http://www.europeanbatteries.com/>.
[61] ZUPA, T. and LISKA, O. Charging Module for Newest Types of Rechargeable Batteries LiFePO4. IEEE 8th International Symposium on Applied Machine Intelligence and Informatics (SAMI), 2010. Proceedings, pp. 241-242.
[62] JOSEPH, A. and SHAHIDEHPOUR, M. Battery Storage Systems in Electric Power Systems. 2006. Power Engineering Society General Meeting, 2006. IEEE.
[63] KOTAICH, K. and SLOOP, S. E. Cobalt-Free Batteries, a New Frontier for Ad-vanced Battery Recycling. 2009. IEEE International Symposium on Sustainable Systems and Technology, 2009. ISSST '09. Proceedings, p. 1.
[64] HOUSE, V. E. and ROSS, Fayth. How to Build a Battery that Lasts Longer than a Car. Altairnano Inc. 2007. [accessed 20 April 2010] Available from: <http://www.automotivedesignline.com/howto/201803283>.
[65] Thunder Sky. Thunder Sky Energy Group Limited. 2010. [accessed 19 April 2010] Available from: <http://www.thunder-sky.com/home_en.asp>.
[66] Lithium Energy Japan Commits to Construction of New Plant - New Ritto Plant (Japan) to Begin Full Mass Production of Lithium-Ion Batteries for 50,000 Electric Vehicles Per Year in 2012 -. Mitsubishi Motors Corporation. [accessed 19 April 2010] Available from: <http://www.mitsubishi-motors.com/publish/corporate/pressrelease/corporate/2010/news/detaila414.html>.
[67] Altair Nanotechnologies Inc. [accessed 20 April 2010] Available from: <http://www.altairnano.com/profiles/investor/fullpage.asp?f=1&BzID=546&to=cp&Nav=0&LangID=1&s=0&ID=10724>.
[68] A123Systems. 2010. [accessed 20 April 2010] Available from: <http://www.a123systems.com/>.
[69] Saft. [accessed 20 April 2010] Available from: <http://www.saftbatteries.com/Home/tabid/54/Language/en-US/Default.aspx>.
[70] SB LiMotive - A Joint Company of Samsung and Bosch. SB LiMotive. [accessed 20 April 2010] Available from: <http://www.sblimotive.com/en/home.html>.
[71] Ebus - Clean. Reliable. Fuel-Efficient. Ebus. 2008. [accessed 29 April 2010] Available from: <http://www.ebus.com/>.

80
[72] The Nation's First Ultra Quick Charge Transit Trolleys are Coming to Wenatchee, Wash. Mass Transit. 10 August 2010. [accessed 23 August 2010] Available from: <http://www.masstransitmag.com/web/online/Industry-Announcements/The-Nations-First-Ultra-Quick-Charge-Transit-Trolleys-are-Coming-to-Wenatchee--Wash/1$12174>.
[73] Zinc–Air Battery - all Electric Bus Demonstration Project. [FTA Project No. NV-26-7001-02] Federal Transit Administration, U.S. Department of Transportation. March 2004 [accessed 29 April 2010] Available from: <http://www.electric-fuel.com/evpro/Phase3.pdf>.
[74] Clean Public Transport Fleet in Rome: Electric Buses. © Copyright 2009 CIVI-TAS VANGUARD. 2007. [accessed 29 April 2010] Available from: <http://www.civitas-initiative.org/measure_sheet.phtml?related=1&id=36>.
[75] Tecnobus S.p.a. [accessed 4 May 2010] Available from: <http://www.tecnobus.it/>.
[76] Demonstration Run of Yutong Electric Bus in Xinxiang. Yutong. 2010. [accessed 29 April 2010] Available from: <http://www.yutong.com/english/news/press_index.jsp>.
[77] Proterra Brings Future of Green Commercial Transit to California Cities with Zero Emission Clean Bus Tour. © 2010 Proterra Inc. 2010. [accessed 3 May 2010] Available from: <http://www.proterraonline.com/pressrelease.asp?id=5>.
[78] Hydrogen Hybrid Bus Ferried People at Winter Olympics. USA TODAY. , 2010. [accessed 3 May 2010] Available from: <http://content.usatoday.com/communities/driveon/post/2010/03/hydrogen-hybrid-bus-ferried-people-at-winter-olympics/1>.
[79] DesignLine. 2010. [accessed 3 May 2010] Available from: <http://www.designlinecorporation.com/>.
[80] GRYNBAUM, Michael M. New Buses Bring Silence to the Streets
. The New York Times. 6 December 2009. [accessed 3 May 2010] Available from: <http://www.nytimes.com/2009/12/07/nyregion/07bus.html?_r=1>.
[81] Tindo Solar Bus - the World's First Solar Electric Bus. Adelaide City Council. [ac-cessed 4 May 2010] Available from: <http://www.adelaidecitycouncil.com/environment/energy/tindo-solar-bus.html>.
[82] Astonbus Inc. [accessed 4 May 2010] Available from: <http://www.astonbus.com/>.
[83] Plug-in Hybrid Electric School Bus. © Advanced Energy. [accessed 28 May 2010] Available from: <http://www.advancedenergy.org/corporate/initiatives/heb/hybrid_tech.php>.
[84] AXSEN, Jonn et al. Batteries for Plug-in Hybrid Electric Vehicles (PHEVs): Goals
and the State of Technology Circa 2008. [UCD-ITS-RR-08-14] Davis, CA: Institute of
Transportation Studies - University of California. May 2008. [accessed 31 May 2010]
Available from: <pubs.its.ucdavis.edu/download_pdf.php?id=1169>.

81
[85] PRITCHARD, Ewan et al. HYBRID ELECTRIC SCHOOL BUS PRELIMINARY BUSINESS FEASIBILITY REPORT. Raleigh, N.C.: Hybrid Electric School Bus Pro-gram. 3 June 2005. [accessed 31 May 2010] Available from: <http://www.advancedenergy.org/corporate/initiatives/heb/pdfs/HESB%20Business%20Feasibility%20Study.pdf>.
[86] Green Light for EV Charging (Ensto Green Park - Plug into a Fresh Today). Ensto Group. [accessed 17 May 2010] Available from: <http://www.ensto.com/instancedata/prime_product_julkaisu/ensto/embeds/enstowwwstructure/16743_EV_charging_pole.pdf>.
[87] PuroNovo - Green Energy Logistics. PuroNovo. [accessed 17 May 2010] Available from: <http://www.puronovo.com/index.html>.
[88] PETERSON, Scott et al. Lithium-Ion Battery Cell Degradation Resulting from Re-alistic Vehicle and Vehicle-to-Grid Utilization. Journal of Power Sources, 4/15, 2010, vol. 195, no. 8. pp. 2385-2392. ISSN 0378-7753.
[89] KEMPTON, Willett and LETENDRE, Steven E. Electric Vehicles as a New Power Source for Electric Utilities. Transportation Research Part D: Transport and Environ-ment, 9, 1997, vol. 2, no. 3. pp. 157-175. ISSN 1361-9209.
[90] KEMPTON, Willett and TOMIĆ, Jasna. Vehicle-to-Grid Power Fundamentals: Calculating Capacity and Net Revenue. Journal of Power Sources, 6/1, 2005, vol. 144, no. 1. pp. 268-279. ISSN 0378-7753.
[91] PEHNT, Martin and HÖPFNER, Ulrich. Kurzgutachten - Wasserstoff- Und Strom-speicher in Einem Energiesystem Mit Hohen Anteilen Erneuerbarer Energien: Analyse Der Kurz- Und Mittelfristigen Perspektive. Heidelberg, Germany: ifeu - Institut für En-ergie- und Umweltforchung, Heidelberg GmbH. May 2009. [accessed 2 May 2010] Available from: <http://www.bmu.de/files/pdfs/allgemein/application/pdf/ifeu_kurzstudie_elektromobilitaet_wasserstoff.pdf>.
[92] CHECKEL, David. Hybrid Diesel-Electric Bus / Trolley Bus Demonstration Pro-ject: Technical Comparison of in-use Performance - APPENDIX H, ENERGY DE-MAND AND EFFICIENCY OF THE TRANSLINK (NEW FLYER / KIEPPE) TROLLEY. Alberta, Canada: University of Alberta, Mechanical Engineering. 18 April 2008. [ac-cessed 3 June 2010] Available from: <http://www.edmonton.ca/transportation/transit/App_H_Trolley_Energy_Factors.pdf>.
[93] ALATALO, Martti. Personal Communication. European Batteries Oy.
[94] VALØEN, Lars O. and SHOESMITH, Mark I. THE EFFECT OF PHEV AND HEV DUTY CYCLES ON BATTERY AND BATTERY PACK PERFORMANCE. Miljø Innovasjon AS (Norway), E-One Moli Energy (Canada) Ltd. 10 October 2007. [ac-cessed 9 June 2010] Available from: <http://www.pluginhighway.ca/PHEV2007/proceedings/PluginHwy_PHEV2007_PaperReviewed_Valoen.pdf>.
[95] EAVES, Stephen; and EAVES, James. A Cost Comparison of Fuel-Cell and Bat-tery Electric Vehicles. Eaves Devices, Charlestown, RI, Arizona State University-East,

82
Mesa, AZ. 2003. [accessed 21 September 2010] Available from: <http://www.modenergy.com/BEVs%20vs%20FCVs%20EavesEaves%20120603.pdf>.
[96] SAARI, Petri. 2010. Helsinki Region Transport (HRT). Helsinki, PO BOX 100, 00077 HSL. Interview 7 June 2010.
[97] NYLUND, Nils-Olof. Personal Communication. VTT Technical Research Center of Finland.
[98] Fuel-Cell Buses Promised for 2010 Olympics. Vancouver Sun - © CanWest Me-diaWorks Publications Inc. 4 August 2007. [accessed 2 June 2010] Available from: <http://www.canada.com/topics/sports/story.html?id=7b9c39e1-7de0-4184-af7a-21c6610670e5>.
[99] Sähköntuotannon Polttoaineet Ja CO2-Päästöt. Energiateollisuus ry. 15 June 2010. [accessed 16 June 2010] Available from: <http://www.energia.fi/fi/tilastot/pikatilasto/s%C3%A4hk%C3%B6ntuotannon%20polttoaineet%20ja%20co2-p%C3%A4%C3%A4st%C3%B6t.pdf>.
[100] SAARI, Petri. Joukkoliikenteen Sähköistäminen. HRT Helsinki Region Transport. 24 May 2010. [accessed 11 June 2010] Available from: <http://www.transeco.fi/files/218/Petri_Saari_HSL.pdf>.
[101] The European Parliament. Regulation (EC) no 595/2009 of the European Par-
liament and of the Council of 18 June 2009 on Type-Approval of Motor Vehicles and
Engines with Respect to Emissions from Heavy Duty Vehicles (Euro VI) and on Ac-
cess to Vehicle Repair and Maintenance Information and Amending Regulation (EC)
no 715/2007 and Directive 2007/46/EC and Repealing Directives 80/1269/EEC,
2005/55/EC and 2005/78/EC (1). ISSN 1725-2555. 18 July 2009. [accessed 17 June 2010] Available from: <http://eur-lex.europa.eu/LexUriServ/LexUriServ.do?uri=OJ:L:2009:188:0001:0013:EN:PDF>.
[102] International Energy Agency Implementing Agreement on Advanced Motor Fuels. Automotive Fuels for the Future : The Search for Alternatives / IEA-AFIS, IEA-AMF. Paris: OECD/IEA, 1999. ISBN 9264169601. Available from: <http://nla.gov.au/nla.cat-vn1760739>.
[103] Hydrogen Production - Steam Methane Reforming (SMR). Albany, NY: New York State Energy Research and Development Authority. 2005. [accessed 27 July 2010] Available from: <http://www.getenergysmart.org/files/hydrogeneducation/6hydrogenproductionsteammethanereforming.pdf>.
[104] GUPTA, Ram B. Hydrogen Fuel : Production, Transport, and Storage. Boca Raton: CRC Press, cop. 2009. ISBN 9781420045758.
[105] COLLODI, Guido. Hydrogen Production Via Steam Reforming with CO2 Cap-ture. Milan, Italy: Foster Wheeler. 2010. [accessed 27 July 2010] Available from: <http://www.aidic.it/CISAP4/webpapers/7Collodi.pdf>.
[106] HSL/HRT - Helsinki Region Transport. HSL, Helsinki Regional Transport Au-thority. [accessed 22 June 2010] Available from: <http://www.hsl.fi/EN/Pages/default.aspx>.

83
[107] Ympäristöraportti 2009. HKL. 7 June 2010. [accessed 23 June 2010] Available from: <http://www.hel.fi/wps/wcm/connect/238759804ff247f6873397a4cf6ee88a/ymparistoraportti_2009web.pdf?MOD=AJPERES>.
[108] VÄKEVÄ, Outi. Vähäpäästöisten Ajoneuvojen Edistäminen Ja Ympäristövyöhyk-keen Perustaminen Helsingissä - Ilmansuojelutyöryhmän Ehdotus Toimenpiteiksi. City of Helsinki - Environment Centre. 14 September 2009. [accessed 15 July 2010] Avail-able from: <http://www.hel.fi/wps/wcm/connect/1f4bc4004f960ed2a0abe2808dff864f/OVvahapaastoiset.pdf?MOD=AJPERES&CACHEID=1f4bc4004f960ed2a0abe2808dff864f>.
[109] KALLIONPÄÄ, Leo. TARJOUSPYYNTÖ HELSINGIN KAUPUNGIN SISÄISTEN BUSSILINJOJEN LIIKENNÖINNISTÄ - KILPAILU 19/2009. Helsinki, Finland: HELSINGIN KAUPUNKI, HKL-liikelaitos, suunnitteluyksikkö. 4 December 2009.
[110] KALLIONPÄÄ, Leo. KILPAILUTETTAVAN LIIKENTEEN LINJA-AUTOKALUSTON RAKENNE- JA VARUSTETASOVAATIMUKSET. Helsinki, Finland: HELSINGIN KAUPUNKI, HKL-liikelaitos, suunnitteluyksikkö. 26 January 2007.
[111] Johdinauton Hankeselvityksen Tilannekatsaus 16.04.2010. HSL, Helsinki Re-gional Transport Authority. 16 April 2010.
[112] ILMANSUOJELUTYÖRYHMÄN EHDOTUS VÄHÄPÄÄSTÖISTEN AJONEUVO-JEN EDISTÄMISESTÄ JA YMPÄRISTÖVYÖHYKKEEN PERUSTAMISESTA. City of Helsinki. 30 March 2010. [accessed 15 July 2010] Available from: <http://www.hel.fi/wps/wcm/connect/8120da804e563cae8bf5dfed6b1ccc6d/ISehdotusFINAL.pdf?MOD=AJPERES>.
[113] DABLANC, Laetitia. Goods Transport in Large European Cities: Difficult to Or-ganize, Difficult to Modernize. Transportation Research Part A: Policy and Practice, 3, 2007, vol. 41, no. 3. pp. 280-285. ISSN 0965-8564.
[114] Yleistajuinen Tiivistelmä - EU:N Ilmasto- Ja Energiapaketti. European Union. 2008. [accessed 24 August 2010] Available from: <http://ec.europa.eu/climateaction/docs/climate-energy_summary_fi.pdf>.
[115] TÁNCZOS, Katalin and TÖRÖK, Ádám. Impact of Transportation on Environ-ment. Periodica Polytechnica. Transportation Engineering., 2008, vol. 36, no. 1-2, pp. 105-110. [accessed 24 August 2010] Available from: <http://www.pp.bme.hu/tr/2008_1/pdf/tr2008_1_19.pdf>.
[116] Electric Vehicle for Goods Distribution. CIVITAS. 14 February 2010. [accessed 27 August 2010] Available from: <http://www.civitas-initiative.org/measure_sheet.phtml?lan=en&id=180>.
[117] THINK. [accessed 27 August 2010] Available from: <http://www.thinkev.com/>.
[118] THINK City. Valmet Automotive. 2010. [accessed 16 September 2010] Available from: <http://www.thinkcity.fi/index.html>.
[119] KING, Danny. EnerDel, Think Lithium-Ion Battery Systems Going Postal in Ja-pan. 28 July 2009. [accessed 28 August 2010] Available from:
84
<http://blogs.edmunds.com/greencaradvisor/2009/07/enerdel-think-lithium-ion-battery-systems-going-postal-in-japan.html>.
[120] ADAMS LOPEZ, Theresa. Electric Truck Demonstration Project Fact Sheet. Port of Los Angeles. 2008. [accessed 28 August 2010] Available from: <http://www.portoflosangeles.org/DOC/Electric_Truck_Fact_Sheet.pdf>.
[121] Balqon Receives Initial $490,000 Purchase Order from New China-Based Dis-tributor, DynaProTech - Order Expands Distribution of Balqon's Leading Zero-Emissions Electric Drive Systems into China. Marketwire. 25 August 2010. Available from: <http://finance.yahoo.com/news/Balqon-Receives-Initial-iw-2300877491.html?x=0>.
[122] PINKSTON, Christian. President Obama Speaks at Smith Electric Vehicles Headquarters - CEO Bryan Hansel Responds to the President’s Remarks on the Econ-omy. Smith Electric vehicles. 2010. [accessed 30 August 2010] Available from: <http://www.sev-us.com/pdf/081540-Release%20-%20POTUS%20SEV%20-%20%20Final.pdf>.
[123] Plug-in. Swith on. Smith Electric vehicles. 2010. [accessed 30 August 2010] Available from: <http://www.smithelectricvehicles.com/NewtonFullSpecs.pdf>.
[124] WIPKE, Keith et al. Evaluation of Range Estimates for Toyota FCHV‐adv Under Open Road Driving Conditions. [SRNS‐STI‐2009‐00446] Savannah River National Laboratory, National Renewable Energy Laboratory. 10 August 2009. [accessed 17 Sep-tember 2010] Available from: <http://www.nrel.gov/hydrogen/pdfs/toyota_fchv-adv_range_verification.pdf>.
[125] Itella. Itella Corporation. [accessed 16 September 2010] Available from: <http://www.itella.fi/>.
[126] KORKIA-AHO, Sampo. Itella Corporation. P.O. Box 1, FI-00011 Itella, Finland. Interview 15 September 2010.
[127] Norsjö. Norsjö Moped AB. [accessed 16 September 2010] Available from: <http://norsjo.com/index.php?page=start>.
[128] Regulatory Framework. DieselNet. Copyright © 1997 - 2010 Ecopoint Inc. 2010. [accessed 12 October 2010] Available from: <http://www.dieselnet.com/standards/eu/hd.php>.
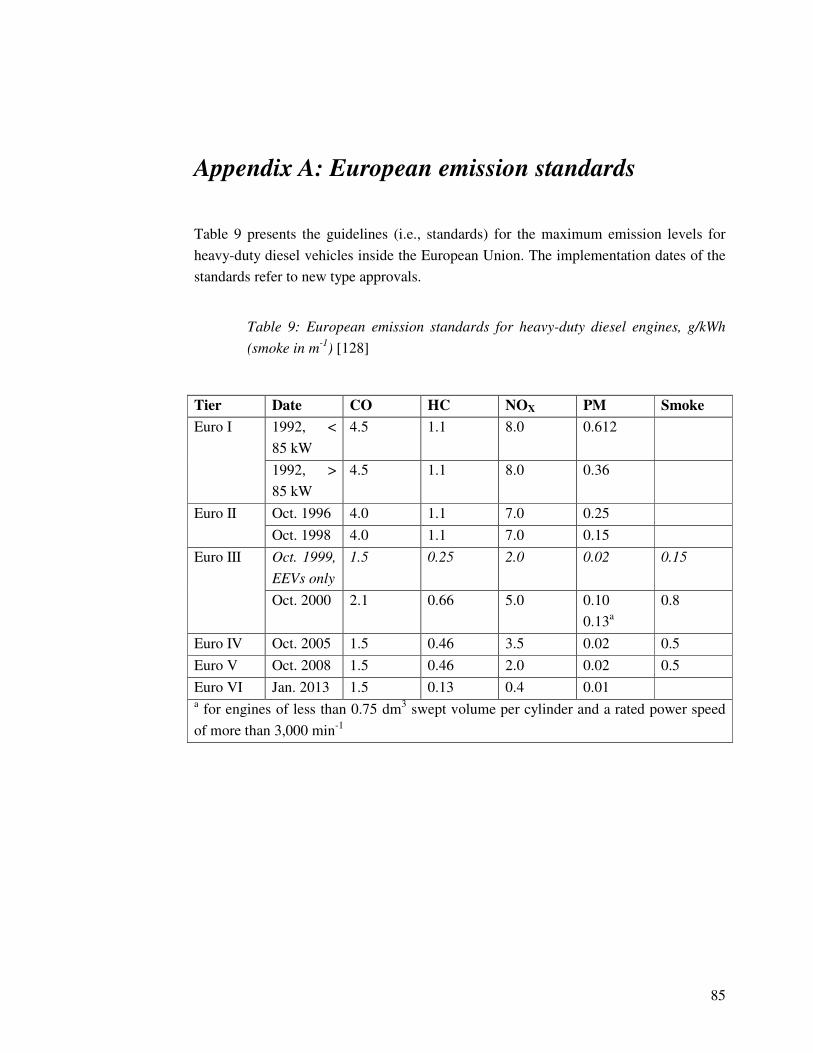
85
Appendix A: European emission standards
Table 9 presents the guidelines (i.e., standards) for the maximum emission levels for
heavy-duty diesel vehicles inside the European Union. The implementation dates of the
standards refer to new type approvals.
Table 9: European emission standards for heavy-duty diesel engines, g/kWh
(smoke in m-1) [128]
Tier Date CO HC NOX PM Smoke
Euro I 1992, <
85 kW
4.5 1.1 8.0 0.612
1992, >
85 kW
4.5 1.1 8.0 0.36
Euro II Oct. 1996 4.0 1.1 7.0 0.25
Oct. 1998 4.0 1.1 7.0 0.15
Euro III Oct. 1999,
EEVs only
1.5 0.25 2.0 0.02 0.15
Oct. 2000 2.1 0.66 5.0 0.10
0.13a
0.8
Euro IV Oct. 2005 1.5 0.46 3.5 0.02 0.5
Euro V Oct. 2008 1.5 0.46 2.0 0.02 0.5
Euro VI Jan. 2013 1.5 0.13 0.4 0.01 a for engines of less than 0.75 dm3 swept volume per cylinder and a rated power speed
of more than 3,000 min-1