lecture14 engs41 class - dartmouth collegecushman/courses/engs41/mark borsuk's... ·...
TRANSCRIPT

5/28/2015
1
Measuring Sustainability
• Problems with GDP and GNP as development indicators• Alternative indicators addressing sustainability▫ Net or ‘Genuine’ Saving▫ Human Development Index (HDI)▫ Environmental Performance Index (HPI)▫ Gross National Happiness (GNH)• Issues, concepts, measurement• Precautionary principle
2
Indicator Gross Domestic Product Gross National Product
Definition An estimated value of the total worth of a country’s production and services, within its boundary, by its nationals and foreigners, calculated over the course on one year.
An estimated value of the total worth of production and services, by citizens of a country, on its land or on foreign land, calculated over the course on one year.
Formula for Calculation GDP = consumption + investment + (government spending) + (exports − imports).
GNP = GDP + NR (Net income inflow from assets abroad or Net Income Receipts) - NP (Net payment outflow to foreign assets).
Layman Usage Total value of Goods and Services produced within the territorial boundary of a country.
Total value of Goods and Services produced by all nationals of a country (whether within or outside the country).
Country with Highest Per Capita (US$)
Qatar ($102,785) Luxembourg ($45,360).
Country with Lowest Per Capita (US$)
Malawi ($242). Mozambique ($80).
Country with Highest (Total) USA ($17.42 Trillion in 2014). USA (~ $11.5 Trillion in 2005).
GDP/GNP

5/28/2015
2
Problems with using GDP/GNP• Distribution of income▫ How is the income distributed – does a small proportion of
the population earn a high percentage of the income or is income more evenly spread?
• Quality of life▫ Can changes in economic growth measure changes in the
quality of life?▫ Does additional earnings power bring with it additional stress,
increases in working hours, increased health and family problems?
• Impact of exchange rate▫ Difference in exchange rates can distort the comparisons –
need to express in one currency, but which one and at what value?
Problems with using GDP/GNP• Informal economy▫ Some economic activity not recorded – subsistence farming
and barter activity, for example▫ Some economic activity is carried out illegally – ‘cash in hand’,
drug dealing, etc. ▫ Work of the non-paid may not be considered but may
contribute to welfare – charity work, housework, etc.
• Indiscriminate▫ Makes no distinction between beneficial and harmful economic
activity. ▫ Gun sales, oil spills, and demolitions all generate economic
activity and all count as additions to GDP. ▫ Accelerating the depletion of precious nonrenewable resources
like oil and coal accelerates GDP growth even as it destroys the essential resource on which that growth depends.

5/28/2015
3
Desirable characteristics for sustainable development indicator
• Sound underlying framework
• Numeraire / aggregation rules
• Clear interpretation regarding sustainability
• Linkage to policy levers through aggregates or sub-aggregates
• Internationally comparable, available for many countries
Alternative indicators• Net or ‘Genuine’ Saving
• Human Development Index (HDI)
• Environmental Performance Index (HPI)
• Gross National Happiness (GNH)

5/28/2015
4
Net (Genuine) Saving• Rate of savings after taking into account investment
in human capital, depletion of natural resources and damage caused by pollution.
Principles of Net (Genuine) Saving• Asset accounts in monetary units provide a consistent
framework and yardstick for measuring development prospects.• The components of net saving (gross saving, depletion,
damage) can be affected by policy, permitting tradeoffs in the pursuit of sustainability.• The saving measure is related to a loose definition of
sustainability: non-decreasing present value of social welfare.• Positive genuine saving indicates rising social welfare;
negative genuine saving suggests that social welfare will fall in the future.• Negative net saving implies unsustainability.

5/28/2015
5
Representative Composition of Net Saving
Gross domestic savings
Consump- tion of fixedcapital
Energy depletion
Mineral depletion
Net forest depletion
Carbondioxidedamage
Education expenditure
Adjusted net savings
Low income 20.3 8.3 3.8 0.3 1.5 1.4 2.9 7.8 Middle income 26.1 9.6 4.2 0.3 0.1 1.1 3.5 14.3 Low & middle income 25.2 9.4 4.1 0.3 0.4 1.2 3.4 13.3 High income 22.7 13.1 0.5 0.0 0.0 0.3 4.8 13.5 East Asia & Pacific 36.1 9.0 1.3 0.2 0.4 1.7 1.7 25.2 Europe & Central Asia 24.6 9.1 6.0 0.0 0.0 1.7 4.1 11.9 Latin America & Carib. 19.2 10.0 2.8 0.4 0.0 0.4 4.1 9.6 Middle East & N. Africa 24.2 9.3 19.7 0.1 0.0 1.1 4.7 -1.3 South Asia 18.3 8.8 1.0 0.2 1.8 1.3 3.1 8.3 Sub-Saharan Africa 15.3 9.3 4.2 0.6 1.1 0.9 4.7 3.9
Negative terms Positive term
Net (Genuine) Saving Comparisons
GNI is the GDP along with the income obtained from other countries (dividends, interests).

5/28/2015
6
Adjusted Net Saving vs GDP/cap
-30.0
-20.0
-10.0
0.0
10.0
20.0
30.0
40.0
50.0
100 1000 10000 100000
GDP per capita
Ad
just
ed n
et s
avin
g, %
of
GD
P
Net (Genuine) Saving
• Looking at an extended but incomplete range of assets may produce a result further from the truth
• What’s Missing?▫ Health▫ Literacy ▫ Education

5/28/2015
7
Human Development Index (HDI)• Summary measure of three basic dimensions of
human development:
• A long and healthy life, as measured by life expectancy at birth
• Knowledge, as measured by adult literacy rate (2/3) and combined primary, secondary & tertiary gross enrollment ratio (1/3)
• A reasonable standard of living (GDP/capita)
Human Development Index (HDI)• The HDI is “an index just as vulgar as GDP but
it stands for better things” (Amartya Sen)
• Human-centered vs. commodity-centered

5/28/2015
8
Goalposts for calculating HDI**UNDP(2005): Human Development Report
Indicator Max. value Min. Value
Life expectancy at birth 85 25
Adult literacy rate (%) 100 0
Combined gross enrollment ratio(%)
100 0
GDP per capita (PPP US$)
40,000 100
HDI Calculation
• HDI = 1/3 (D1+D2+D3)where: D1=longevity index; D2= knowledge index D3= standard of living index.
• Individual indices are calculated as:D1 = (actual – min) / (max – min)D2 = 2/3 adult literacy index + 1/3 gross enrollment indexD3 = (log actual – log min) / (log max– log min)
▫ HDI>0.8 represents “high”▫ 0.5<HDI<0.8 represents “medium”▫ HDI<0.5 represents “low”

5/28/2015
9
HDI Trends by Region
17
HDI Rankings (2006)
1 Iceland (.968) 11 Finland (.951)
2 Norway (.968) 12 United States (.951)
3 Australia (961) 13 Spain (.949)
4 Canada (.960) 14 Denmark (.949)
5 Ireland (.959) 15 Austria (.948)
6 Sweden (.956) 16 United Kingdom (.946)
7 Switzerland (.955) 17 Belgium (.946)
8 Japan (.953) 18 Luxembourg (.944)
9 Netherlands (.953) 19 New Zealand (.943)
10 France (.952) 20 Italy (.941)

5/28/2015
10
GDP Rankings (2006)
1 Luxembourg ($80,471) 11 United Kingdom ($35,051)
2 Ireland ($44,087) 12 Finland ($34,819)
3 Norway ($43,574) 13 Belgium ($34,478)
4 United States ($43,444) 14 Sweden ($34,409)
5 Iceland ($40,277) 15 Qatar ($33,049)
6 Switzerland ($37,369) 16 Australia ($32,938)
7 Denmark ($36,549) 17 Singapore ($32,867)
8 Austria ($36,031) 18 Japan ($32,647)
9 Canada ($35,494) 19 Germany ($31,095)
10 Netherlands ($35,078) 20 Italy ($30,732)
20
GDP per capita HDI
Comparison of IndicatorsNet Saving
5/28/2015
11
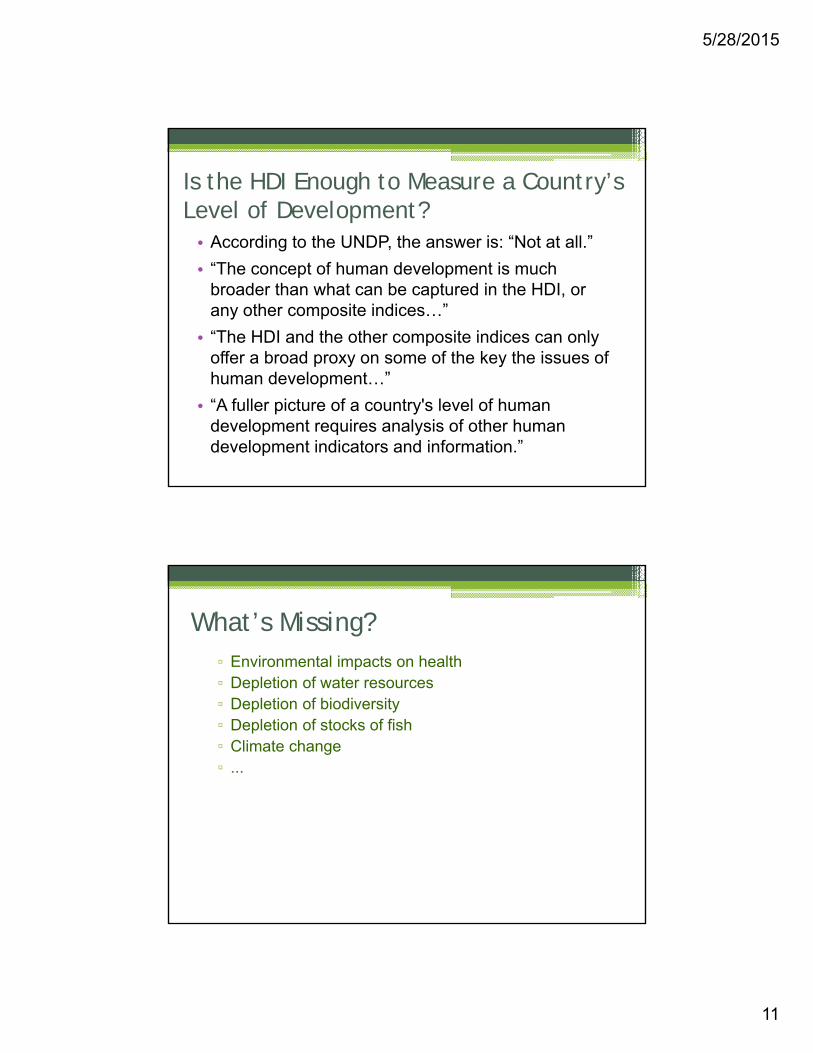
Is the HDI Enough to Measure a Country’s Level of Development?• According to the UNDP, the answer is: “Not at all.”
• “The concept of human development is much broader than what can be captured in the HDI, or any other composite indices…”
• “The HDI and the other composite indices can only offer a broad proxy on some of the key the issues of human development…”
• “A fuller picture of a country's level of human development requires analysis of other human development indicators and information.”
▫ Environmental impacts on health▫ Depletion of water resources▫ Depletion of biodiversity▫ Depletion of stocks of fish▫ Climate change▫ ...
What’s Missing?

5/28/2015
12
Environmental Performance Index (EPI)• Based on 20 variables
• 9 issues
• 2 objectives: Reduce environmental stress on human health and promote ecosystem vitality and sound natural resources management
• EPI measures proximity-to target for each indicator (established by international agreements, national standards or scientific consensus with a range of 0-100), which does not vary by country.
• Scores are calculated as average of the score of the 2 objectives
24

5/28/2015
13
25

5/28/2015
14
27
▫ Psychological well-being▫ Community vitality▫ Cultural diversity▫ Good governance▫ ...
What’s Missing?

5/28/2015
15
Gross National Happiness (GNH)
30
Gross National Happiness (GNH)

5/28/2015
16
Three Issues to Consider When Evaluating Indexes
1) Validity
2) Reliability
3) Parsimony
Validity
• What is the index supposed to measure?
• What indicators make up the index?
• Are these the best indicators for this index?
• How are the indicators calculated?
• Are there better ways to calculate these indicators?
• In short, how well does the index actually measure what it is supposed to be measuring?

5/28/2015
17
Reliability
• Who or what organization collected the data?
• How were the data collected?
• In short, if you or someone else were to try to replicate the index would you end up with more or less the same results?
Parsimony
• The whole point of an index is to simplify the measurement of a particular phenomenon.
• In short, does the index rely upon as few indicators as reasonably possible without undermining its validity?

5/28/2015
18
Break
35
Decisions under Ignorance
Choice Good chef Bad chef
LobsterGood
lobsterTerrible Lobster
HamburgerEdible
hamburgerEdible
hamburger
Nothing Hungry Hungry
I am eating at a new restaurant, for which I don’t have any information about the chef.

5/28/2015
19
HungryHungryNothing
Edible hamburger
Edible hamburger
Hamburger
Terrible Lobster
Good
lobsterLobster
Bad chefGood chefChoice
HungryHungryNothing
Edible hamburger
Edible hamburger
Hamburger
Terrible Lobster
Good
lobsterLobster
Bad chefGood chefChoice
22Nothing
33Hamburger
14Lobster
Bad chefGood chefChoice
22Nothing
33Hamburger
14Lobster
Bad chefGood chefChoice
Having a Hamburger dominates Nothing.
So there is no reason to choose Nothing.
Weak Dominance:
Strong Dominance:
).,(),(such that s state some is and there
stateevery for ),(),( ifonly and if
n njni
mmjmiji
savsav
ssavsavaa
. stateevery for ),(),( ifonly and if ssavsavaa jiji
Decisions under Ignorance
Dominance
Probabilities are not required to assess dominance.
However, dominance often fails to single out a particular decision alternative.
So, it is not an entirely sufficient decision criterion.

5/28/2015
20
Maximin
HungryHungryNothing
Edible hamburger
Edible hamburger
Hamburger
Terrible Lobster
Good
lobsterLobster
Bad chefGood chefChoice
HungryHungryNothing
Edible hamburger
Edible hamburger
Hamburger
Terrible Lobster
Good
lobsterLobster
Bad chefGood chefChoice
22Nothing
33Hamburger
14Lobster
Bad chefGood chefChoice
22Nothing
33Hamburger
14Lobster
Bad chefGood chefChoice
If we are pessimistic, we might want to maximize the worst possible outcome.
Maximin criterion:
So what should we order?
Again, probabilities are not required.
. states allover )min()min( ifonly and if saaaa jiji
Precautionary Principle The precautionary principle states that if an action has a
suspected risk of causing harm to the public or to the environment, then the burden of proof that it is not harmful falls on those taking an action.
The principle implies that there is a social responsibility to protect the public from exposure to harm, when scientific investigation has found a plausible risk.
In some legal systems, as in the law of the European Union, the application of the precautionary principle has been made a statutory requirement in some areas of law.
Practically, the precautionary principle implies a maximindecision criterion.

5/28/2015
21
Maximax
HungryHungryNothing
Edible hamburger
Edible hamburger
Hamburger
Terrible Lobster
Good
lobsterLobster
Bad chefGood chefChoice
HungryHungryNothing
Edible hamburger
Edible hamburger
Hamburger
Terrible Lobster
Good
lobsterLobster
Bad chefGood chefChoice
22Nothing
33Hamburger
14Lobster
Bad chefGood chefChoice
22Nothing
33Hamburger
14Lobster
Bad chefGood chefChoice
If we are optimistic, we might want to maximize the best possible outcome.
Maximax criterion:
So what should we order?
Again, probabilities are not required.
. states allover )max()(ax ifonly and if saamaa jiji
Minimax Regret
HungryHungryNothing
Edible hamburger
Edible hamburger
Hamburger
Terrible Lobster
Good
lobsterLobster
Bad chefGood chefChoice
HungryHungryNothing
Edible hamburger
Edible hamburger
Hamburger
Terrible Lobster
Good
lobsterLobster
Bad chefGood chefChoice
22Nothing
33Hamburger
14Lobster
Bad chefGood chefChoice
22Nothing
33Hamburger
14Lobster
Bad chefGood chefChoice
What if we order the lobster and it turns out to be terrible?
What if we order the hamburger, and we find out that the lobster is good?

5/28/2015
22
HungryHungryNothing
Edible hamburger
Edible hamburger
Hamburger
Terrible Lobster
Good
lobsterLobster
Bad chefGood chefChoice
HungryHungryNothing
Edible hamburger
Edible hamburger
Hamburger
Terrible Lobster
Good
lobsterLobster
Bad chefGood chefChoice
What if we order the lobster and it turns out to be terrible?
What if we order the hamburger, and we find out that the lobster is good?
Minimax regret criterion:
Will we actually learn whether the lobster was any good?
12Nothing
01Hamburger
20Lobster
Bad chefGood chefChoice
12Nothing
01Hamburger
20Lobster
Bad chefGood chefChoice
Regret TableMinimax Regret
What if the waiter now tells us that the special of the day is Lobster Thermidor?
HungryHungryNothing
Horrible!Outstanding!Lobster
Thermidor
Edible hamburger
Edible hamburger
Hamburger
Terrible Lobster
Good
lobsterLobster
Bad chefGood chefChoice
HungryHungryNothing
Horrible!Outstanding!Lobster
Thermidor
Edible hamburger
Edible hamburger
Hamburger
Terrible Lobster
Good
lobsterLobster
Bad chefGood chefChoice
Minimax Regret

5/28/2015
23
22Nothing
-1010Nothing
33Hamburger
14Lobster
Bad chefGood chefChoice
22Nothing
-1010Nothing
33Hamburger
14Lobster
Bad chefGood chefChoice
18Nothing
130Nothing
07Hamburger
26Lobster
Bad chefGood chefChoice
18Nothing
130Nothing
07Hamburger
26Lobster
Bad chefGood chefChoice
Regret Table
LobsterThermidor
LobsterThermidor
So what meal is preferred option now?
Minimax regret is sensitive to irrelevant alternatives.
Minimax Regret
Principle of Insufficient Reason If one has no reason to think that one state of the world is more
probable than another, then all states should be assigned equalprobability.
This transforms a decision problem under ignorance into a decision problem under uncertainty (or risk).
This implies that we should maximize expected utility.
22Nothing
-1010Nothing
33Hamburger
14Lobster
Bad chefGood chefChoice
22Nothing
-1010Nothing
33Hamburger
14Lobster
Bad chefGood chefChoice
LobsterThermidor

5/28/2015
24
Extremely sensitive to delineation of states.
What if we divided ‘Good chef’ into ‘Excellent chef’ and ‘Mediocre chef’?
Which meal is preferred now?
In general, why favor ‘equal’ probabilities over anything else?
222Nothing
0
3
0
Mediocre chef
-1020Lobster
Thermidor
33Hamburger
18Lobster
Bad chefExcellent chefChoice
222Nothing
0
3
0
Mediocre chef
-1020Lobster
Thermidor
33Hamburger
18Lobster
Bad chefExcellent chefChoice
6 2
Principle of Insufficient Reason
Ellsberg’s Paradox
I have an urn containing 90 balls:
30 are red
The remaining 60 are either black or yellow or a mix.
Which would you prefer?
Gamble 1: Receive $100 if a red ball is chosenGamble 2: Receive $100 if a black ball is chosen
Gamble 3: Receive $100 if a red or yellow ball is chosenGamble 4: Receive $100 if a black or yellow ball is chosen

5/28/2015
25
Ellsberg’s Paradox
It is inconsistent to prefer G1 and G4 (or G2 and G3), yet that is what most people state.
Rather than certainty principle, it seems that people want to avoid ambiguity.
Perhaps we should add ambiguity aversion to risk aversion.
Remainder of Term:• No class on Tuesday, June 2
• Help session on Thursday, June 4, 2:00-3:00 PM
• TA office hours (Time and Location TBA)
• Prof. Borsuk office hours (C131)▫ Thursday, June 4, 3:00-5:00 PM▫ Friday, June 5, 3:00-5:00 PM
• Final Exam: Sunday, June 7, 11:30 AM