lecture 8 welfare analysis - university of … 8 welfare analysis february 9, 2017 i. o verview ii....
TRANSCRIPT

Economics 2 Professor Christina Romer Spring 2017 Professor David Romer
LECTURE 8
WELFARE ANALYSIS
February 9, 2017
I. OVERVIEW
II. CONCEPT OF ECONOMIC SURPLUS
A. Consumer Surplus
B. Producer Surplus
III. ALLOCATIVE EFFICIENCY
A. Definition
B. Conditions for allocative efficiency
C. Are competitive market outcomes efficient?
IV. EQUITY AND EFFICIENCY
A. Equity concerns
B. Can we have both efficiency and equity?
V. WELFARE ANALYSIS OF A PRICE CEILING
A. Example: Rent control
B. Deadweight loss related to the reduced quantity bought and sold
C. Misallocation among consumers
D. Empirical evidence on misallocation (Glaeser and Luttmer)
E. Equity effects
VI. WELFARE ANALYSIS OF A TAX
A. Example: Per-unit tax on a good
B. Deadweight loss and its determinants
C. No misallocation among consumers
D. Alternative ways to visualize tax revenue
E. Preview of externalities

LECTURE 8 Welfare Analysis
February 9, 2017
Economics 2 Christina Romer Spring 2017 David Romer

Announcements
• Problem Set 2:
• Due next Tuesday (February 14th)
• Problem set work session tomorrow (February 10), 4–6 p.m. in 648 Evans.
• First Midterm:
• Tuesday, February 21
• We will give you more information and a sample midterm next Tuesday.

Announcements
• Please don’t pack up before 5 p.m.
• It is distracting for other students.
• You are missing important information.

I. OVERVIEW

Welfare Analysis
• An extension of the supply and demand framework:
• Makes use of the optimization analysis we have been doing.
• It is a tool that helps us evaluate the desirability of market outcomes.
• It is a tool that we will use over and over: • To evaluate the effects of government
intervention. • To understand market failures.

II. CONCEPT OF ECONOMIC SURPLUS

Economic Surplus
• A measure of the amount by which buyers and sellers benefit from participating in the market.
• The total economic surplus is the sum of:
• Consumer surplus
• Producer surplus
• Government revenue (if relevant)

Demand
q
P
Q
P
Individual Consumer Market
Utility Maximization: MUx/Px = MUy/Py
d,mb D,MB

Marginal Benefit (or Reservation Price)
• The dollar value to consumers of another unit of a good.
• What they would be willing to pay for one more unit.

D1,MB Q
P S1
P1
Q1
Consumer Surplus
Consumer Surplus
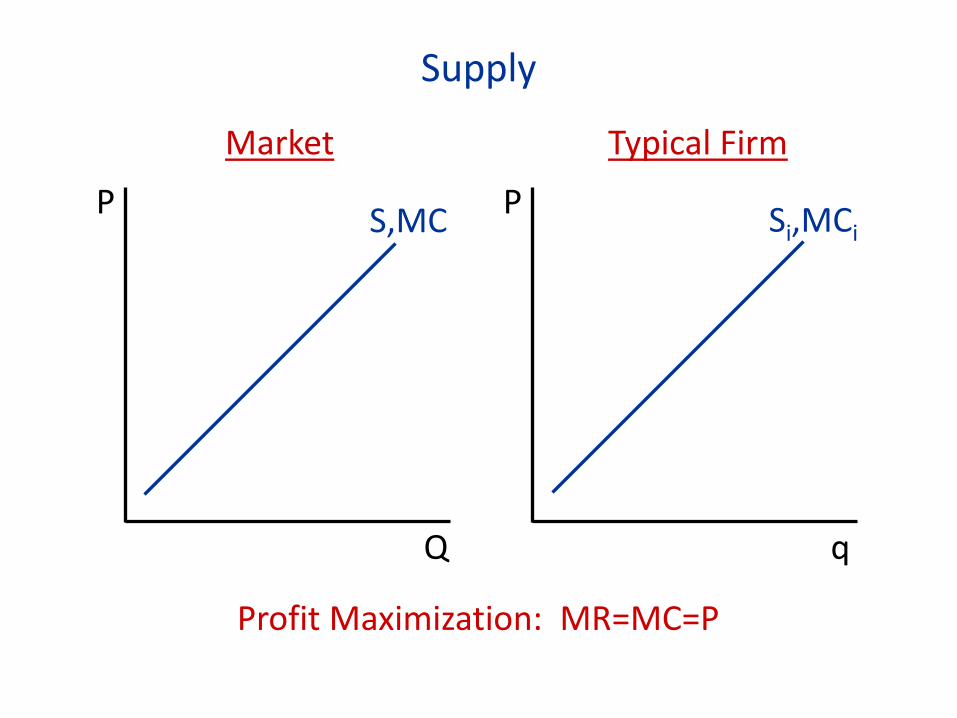
Supply
Q
P
q
P
Market Typical Firm
Profit Maximization: MR=MC=P
S,MC Si,MCi

D1,MB Q
P S1,MC
P1
Q1
Producer Surplus
Producer Surplus
Producer Surplus = Total Revenue − Variable Cost

III. ALLOCATIVE EFFICIENCY

D1,MB Q
P S1,MC
P1
Q1
Total Surplus = Consumer Surplus + Producer Surplus
Area between the MB and MC curves up to the level bought and sold.

Allocative Efficiency (Also Called Pareto Efficiency)
• The total surplus is as large as possible.

Conditions for Allocative Efficiency
• The good is produced up to the point where MB = MC.
• The good is allocated to the consumers with the highest MB.
• The good is produced by the producers with the lowest MC.

Allocative Efficiency of the Competitive Market Outcome
At Q1, MB = MC.
Consumer Surplus
D1,MB Q
P S1,MC
P1
Q1
Producer Surplus

IV. EQUITY AND EFFICIENCY

Equity Issues
• Willingness to pay (which underlies consumer surplus) depends in part on income.
• Economists’ measure of welfare doesn’t take into account that consumers may enter the market with vastly different incomes.

Equity and Efficiency
• Allocative efficiency is still a worthy goal.
• Interfering with the price system to improve equity may be costly. (And may not improve equity much.)
• There are ways to improve equity without sacrificing what is good about the price system.

V. WELFARE ANALYSIS OF A PRICE CEILING

Effects of a Price Ceiling
D1 Q
P S1
P1
Q1
PC
QS QD
Shortage

Welfare Analysis of a Price Ceiling
Free Market (Q1) Price Ceiling (QS) Consumer Surplus a+b (less than) a+c Producer Surplus c+d+e e Total Surplus a+b+c+d+e a+c+e Deadweight Loss b+d (+ misallocation)
PC
QS D1
Q
P S1
P1
Q1
a
c
b d
e

Deadweight Loss
• Any shortfall in total surplus from its maximum level.
• The deadweight loss of a price ceiling is surely larger than b+d because there is misallocation among consumers.
• Consumer surplus is, in fact, less than a+c because the good is allocated in some way other than by price.

Glaeser and Luttmer “The Misallocation of Housing under Rent Control”
• Look at the overlap percentage: The fraction of time a member of the group we expect to consume fewer rooms actually consumes more than a member of the group we expect to consume more.
• Empirical strategy: Look at the difference in the overlap percentage between a city with rent control (NYC) and a number of cities without rent control.

Glaeser and Luttmer The Misallocation of Housing under Rent Control
Source: Glaeser and Luttmer, “The Misallocation of Housing under Rent Control.”

VI. WELFARE ANALYSIS OF A TAX

Effect of a Tax S2
Q2
P2
P2−tax
D1 Q
P S1
P1
Q1
tax

Welfare Analysis of a Tax (Version 1)
Free Market (Q1) Tax (Q2) Consumer Surplus a+b+c+d a Producer Surplus e+f+g+h+i h+i Government Revenue b+c+e+f Total Surplus a+b+c+d+e+f+g+h+i a+b+c+e+f+h+i Deadweight Loss d+g
S2
d
Q2
P2
P2−tax
D1 Q
P S1
P1
Q1
a
e b c
h
f g
i
tax
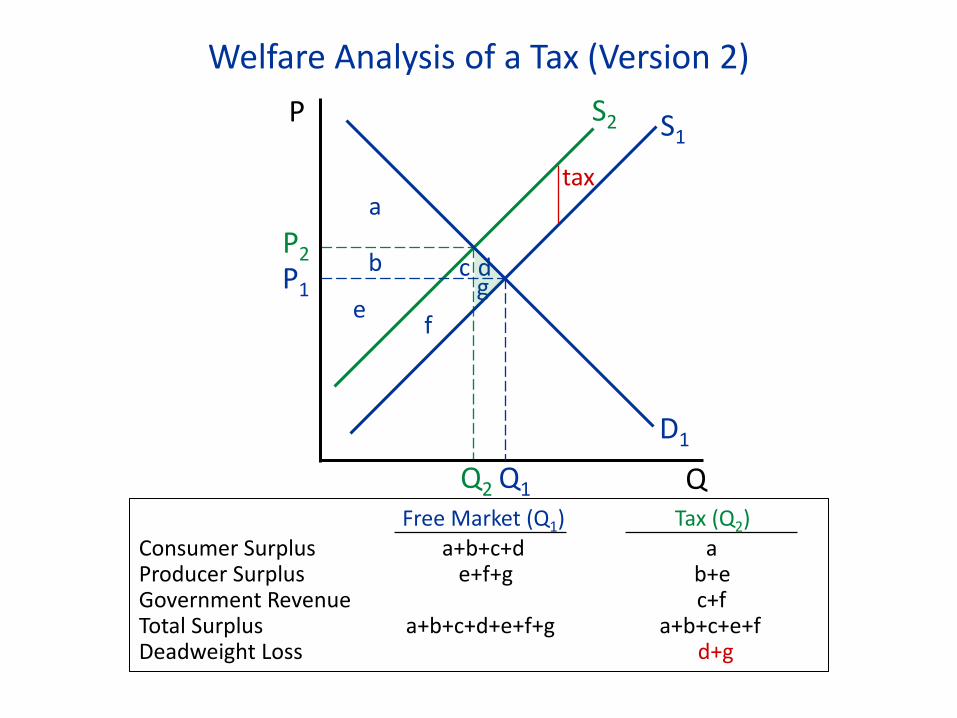
Welfare Analysis of a Tax (Version 2)
Free Market (Q1) Tax (Q2) Consumer Surplus a+b+c+d a Producer Surplus e+f+g b+e Government Revenue c+f Total Surplus a+b+c+d+e+f+g a+b+c+e+f Deadweight Loss d+g
S2
d
Q2
P2
D1 Q
P S1
P1
Q1
a
e
b c
f g
tax

Some Points about the Welfare Effects of a Tax
• A tax distorts production away from the competitive equilibrium, so at the resulting level of production and consumption MB>MC.
• Production and consumption are still allocated according to willingness to pay and willingness to supply, so there is no misallocation.
• The standard welfare analysis of a tax is incomplete for goods that have effects on people outside the market.