lecture 7: computer aided drug design: statistical approach. lecture 7: computer aided drug design:...
TRANSCRIPT

Lecture 7: Computer aided drug design: Lecture 7: Computer aided drug design: Statistical approach.Statistical approach.
Chen Yu ZongDepartment of Computational Science
National University of Singapore
Introduction of methodology. 2D QSAR and Pharmacophore SVM study of drug absorption,
excretion, side-effect

Strategies for improving drug design cycle:
Computer-aided drug design:
• Receptor 3D structure unknown: • QSAR (Quantitative Structure-Activity
Relationship).Pharm. Res. 10, 475-486 (1993).

Basic Idea:
Binding => Activity (Reaction):
• Binding: • Binding free energy G
– Intermolecular forces (interactions).– Hydrophobic effect, solvation.
• Activity:• Reaction constant Keq
Relationship:
G = -RT ln Keq

Basic Idea:
Objective:
Derive a function that links biological activity of a group of related chemical compounds with parameters that describe a structural feature of these molecule.
This feature also reflects the property of binding cavity on protein target.
The derived function is used as a guide to select best candidate for drug design.

Illustration:
Log(Biological activity) = f(structural, physical, chemical parameters) Example:
Log(Biological activity) => Size of a side chain of a compound => Size and shape of protein cavity

Illustration:Log(Biological activity) =>
Size of a side chain of a compound => Size and shape of protein cavity

2D QSAR:LogA = cc fchem(xc) + ch fhydr(xh) + ce felec(xe) + cst fst(xs)
Abbreviation Meaning
mg / L, mol / L (and similar)
milligram per litre, mole per litre etc.
log P logarithm of the octanol-water partition coefficient
log D distribution coefficient
pi, Pi Hansch hydrophobic substituent constant
MW, Mol Wt molecular weight
LUMO, Elumo energy of the lowest unoccupied molecular orbital
HOMO, Ehomo energy of the high occupied molecular orbital
HofF, Heat Form heat of formation
Dipole dipole moment
sigma, sigmaX Hammett constant (on position X)
I-X indicator variable for presence of X
RX indicates substituent at position X
MR molar refractivity

Construction of Pharmacophore: Superimposing common molecular interaction field contour resulted in the identification of the consensus pharmacophore
The Concensus Pharmacophore:
purple = hydrophobic area green = electron-deficient aromatic system red = electronegative heteroatoms pink = protonated nitrogen blue = large planar ring system.
Prediction of drug transport by statistical method:
Absorption at intestine CNS activity BBB penetration Drug excretion (Multidrug resistance, P-glycoprotein
substrates)
Drug safety prediction by statistical method:
Prediction of a minor side-effect TdP

Membrane transport:

Membrane transport:

Membrane transport:

Drug data:
Substrates and non-substrates of P-glycoproteins
116 P-gp substrates and 85 P-gp nonsubstrates
Human intestine absorbing and non-absorbing drugs
167 HIA positive and 20 HIA negative drugs
TdP inducing and non-inducing drugs
85 TdP inducing agents and 162 non-TdP causing agents

SVM Classification of drugs :
How to represent a drug?
Each drug represented by specific feature vector assembled from encoded representations of tabulated physicochemical properties:
• Global properties (Total number: 18)• Connectivity (Total number: 20)• Shape and flexibility (Total number: 8)• Electrotopological states (Total number: 84)• Quantum chemical (Total number: 13)• Geometrical properties (Total number: 16)
SVM Classification of drugs :
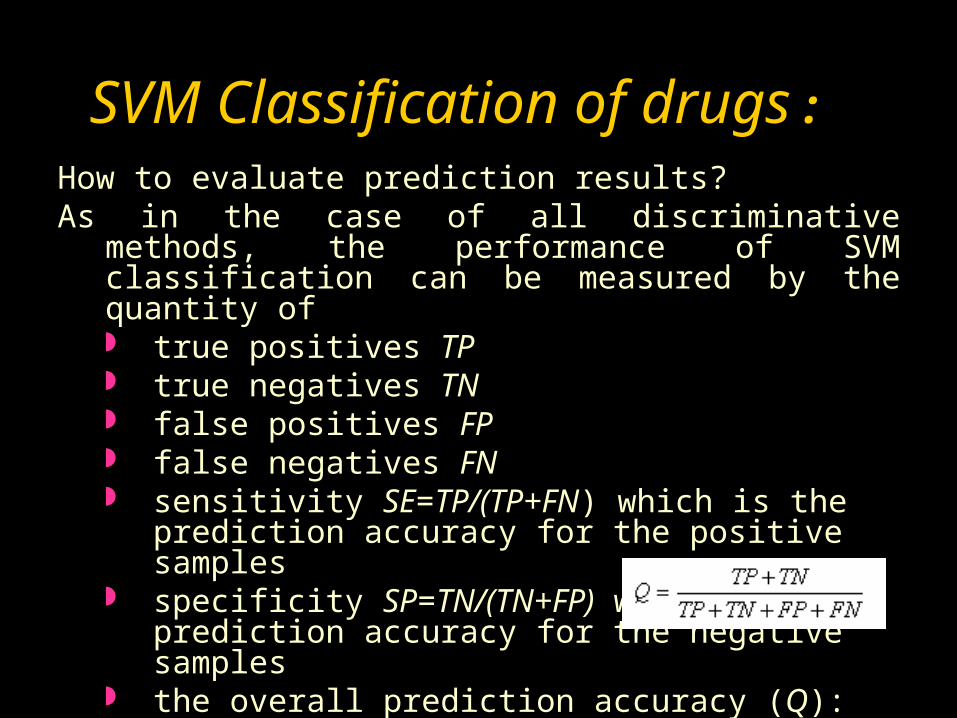
How to evaluate prediction results?As in the case of all discriminative methods, the performance of
SVM classification can be measured by the quantity of true positives TP true negatives TN false positives FP false negatives FN sensitivity SE=TP/(TP+FN) which is the prediction
accuracy for the positive samples specificity SP=TN/(TN+FP) which is the prediction
accuracy for the negative samples the overall prediction accuracy (Q):
(8)

Drug descriptors:
Class Descriptors
Global properties (Total number: 18)
Molecular weight, Numbers of rings, rotatable bonds, H-bond donors, H-bond acceptors, Element counts
Connectivity(Total number: 20)
Molecular connectivity indices, Valence molecular connectivity indices
Shape and fexibility (Total number: 8)
Molecular shape Kappa indices, Kappa alpha indices, flexibility index
Electrotopological state (Total number: 84)
Electrotopological state indices and Atom type electrotopological state indices
Quantum chemical (Total number: 13)
Atomic charge on the most positively charged H atom, Largest negative charge on an non-H atom, Polarizability index, Hydrogen bond acceptor basicity (covalent HBAB), Hydrogen bond donor acidity (covalent HBDA), Molecular dipole moment, Absolute hardness, Softness, Ionization potential, Electron affinity, Chemical potential, Electronegativity index, Electrophilicity index
Geometrical properties (Total number: 16)
Length vectors (longest distance, longest third atom, 4 th atom), Molecular van der Waals volume, Solvent accessible surface area, Molecular surface area, van der Waals surface area, Polar molecular surface area, Sum of solvent accessible surface areas of positively charged atoms, Sum of solvent accessible surface areas of negatively charged atoms, Sum of charge weighted solvent accessible surface areas of positively charged atoms, Sum of charge weighted solvent accessible surface areas of negatively charged atoms, Sum of van der Waals surface areas of positively charged atoms, Sum of van der Waals surface areas of negatively charged atoms, Sum of charge weighted van der Waals surface areas of positively charged atoms, Sum of charge weighted van der Waals surface areas of negatively charged atoms

Prediction of drug human intestine absorption:
Cross validation
Feature selection
Absorbing agents Non-absorbing agents Q(%)
TP FN SE(%) TN FP SP(%)
1 No 24 2 92.31 4 9 30.77 71.8
2 No 23 3 88.46 9 4 69.23 82.1
3 No 24 2 92.31 12 1 92.31 92.3
4 No 22 4 84.62 10 3 76.92 82.1
5 No 27 0 100.00 4 9 30.77 77.5
average No 91.54 60.00 81.1
1 RFE 21 5 80.77 11 2 84.62 82.1
2 RFE 24 2 92.31 10 3 76.92 87.2
3 RFE 24 2 92.31 12 1 92.31 92.3
4 RFE 22 4 84.62 10 3 76.92 82.1
5 RFE 24 3 88.89 10 3 76.92 85.0
average RFE 87.78 81.54 85.7

Prediction of drug CNS activity:
Method No. of
agentsCNS +
(%)CNS –
(%)reference
Bayesian neural network
275 92.0 71.0 Ajay et al
Principle component analysis
120 90.0 65.0 Crivori et al
Support vector machine
304 78.9 60.4 Trotter et al
Support vector machine
52 97.6 90.0 This work

Prediction of drug BBB penetration:
Cross validation
Feature selection
BBB penetrating drugs BBB non-penetrating drugs Q(%)
TP FN SE(%) TN FP SP(%)
1 No 20 3 86.96 8 9 47.06 70.0
2 No 18 5 78.26 10 7 58.82 70.0
3 No 23 0 100.00 6 11 35.29 72.5
4 No 16 7 69.57 11 6 64.47 67.5
5 No 19 5 79.17 12 5 70.59 75.6
average No 82.79 55.25 71.1
1 RFE 19 4 82.61 14 3 82.35 82.5
2 RFE 17 6 73.91 12 5 70.59 72.5
3 RFE 23 0 100.00 14 3 82.35 92.5
4 RFE 17 6 73.91 11 6 64.71 70.0
5 RFE 20 4 83.33 13 4 76.47 80.5
average RFE 82.75 75.29 79.6

Prediction of drug TdP side-effect:
Cross validation
Feature selection
TdP-inducing drugs Non-TdP-causing agents Q(%)
TP FN SE(%) TN FP SP(%)
1 No 9 8 52.94 50 5 90.91 81.9
2 No 9 8 52.94 51 4 92.73 83.3
3 No 7 10 41.18 51 4 92.73 80.5
4 No 8 9 47.06 52 3 94.55 83.3
5 No 7 10 41.18 52 4 92.86 80.8
average No 47.06 92.76 82.0
1 RFE 11 6 64.71 53 2 96.36 88.9
2 RFE 10 7 58.82 52 3 94.55 86.1
3 RFE 7 10 41.18 51 4 92.73 80.5
4 RFE 13 4 76.47 51 4 92.73 88.9
5 RFE 10 7 58.85 51 5 91.07 83.6
average RFE 60.01 93.49 85.6