lecture 7 bookkeeping disruptive technology continued learning curve engineering economics (if time)
Post on 21-Dec-2015
217 views
TRANSCRIPT

Lecture 7•Bookkeeping•Disruptive Technology continued•Learning curve•Engineering Economics (if time)

Bookkeeping
• Wednesday Pizza Lecture 5:30-7:00 PM
• Next week- note change– Henry Kressel Case Tuesday– Midterm Thursday
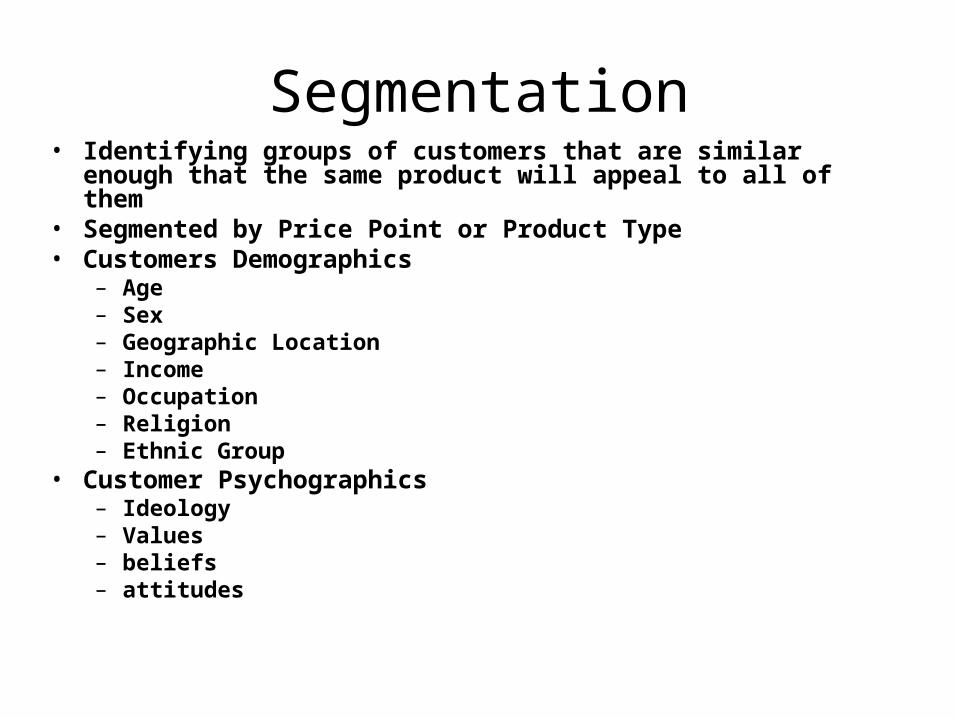
Segmentation• Identifying groups of customers that are similar enough that
the same product will appeal to all of them• Segmented by Price Point or Product Type• Customers Demographics
– Age– Sex– Geographic Location– Income– Occupation– Religion– Ethnic Group
• Customer Psychographics– Ideology– Values– beliefs – attitudes

What market segment (s) are your companies/technologies suited for?• Alt energy
– Med-large– Not experts
Memory
leading edge companies consumer apple
server companies

The Technology Adoption Model as the Basis for Segment Focus
A measure of the rate of adoption of a cluster of new technologies by a community over time
Early Majority
Innovators
Rate
of A
dopt
ion
Laggards
Late Majority
Early Adopters
Time
How do you get from innovators to early adopters?

“Predictable” Marketing• Customers have “jobs” that need to be done• They “hire” a product to get the job done.• Need to know the circumstances in which the customer
finds himself and target the circumstance, rather than the customer himself.
• Market research focuses then on observing what people seem to be trying to do for themselves and then asking them about it.
• Example Sony’s Akio Morita and 5 associates introduced- Transistor radio, solid state B&W TV, videocassette players, Walkman, floppy disk drives

New Market Disruptions• Transistor was invented- first thought was replace
vacuum tubes in traditional applications• Sony competed against non-consumption, targeted
teenagers who – Wanted to be cool– Had little money– Did not worry about sound quality– Required low power advantage of new technology– Portability enabled them to hear R&R with friends out of
parents earshot
• Competition was no radio at all

Road Warrior
• Answer e-mail
• Areturn phone calls
• Chat
• Book hotel rent car
• Entertainment
• Web surfing
• remote desk top
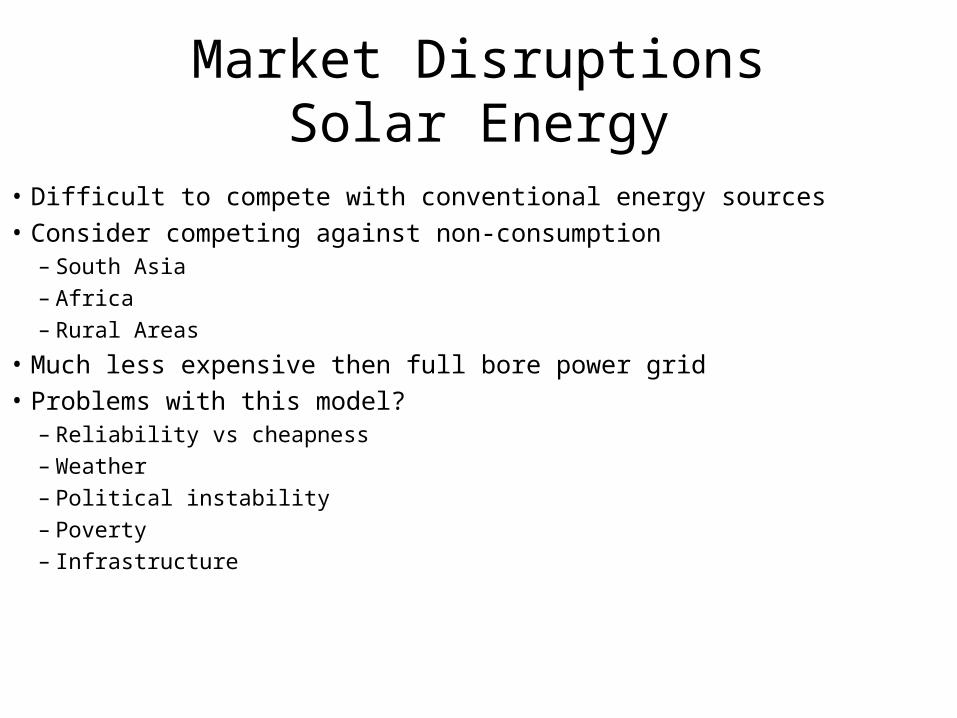
Market DisruptionsSolar Energy
• Difficult to compete with conventional energy sources
• Consider competing against non-consumption– South Asia– Africa– Rural Areas
• Much less expensive then full bore power grid
• Problems with this model?– Reliability vs cheapness– Weather– Political instability– Poverty– Infrastructure

Market DisruptionsCell phone
• Compete with poorly managed, government-controlled telephone systems
• Poor infrastructure
• Cheaper than wire-line
• Grows incrementally

Market Disruptions• Low Cost Airlines
• Compete against Auto and Bus
• Makes air travel possible for people who can’t manage high fairs
• People ignored by major airlines in favor of business travelers
• Point to point convenience and speed
• Fun

Is the I Phone disruptive?

Extracting Growth from non-consumption
• Target customers are trying to get a job done but lack money or skill- simple, inexpensive solution did not exist
• These customers compare disruptive product with having nothing at all. Delighted to buy even though it may not be as good as other offerings
• Technology might be sophisticated but “user interface” simple, convenient and foolproof
• Disruptive innovation creates new value network. New customers often purchase through new channels
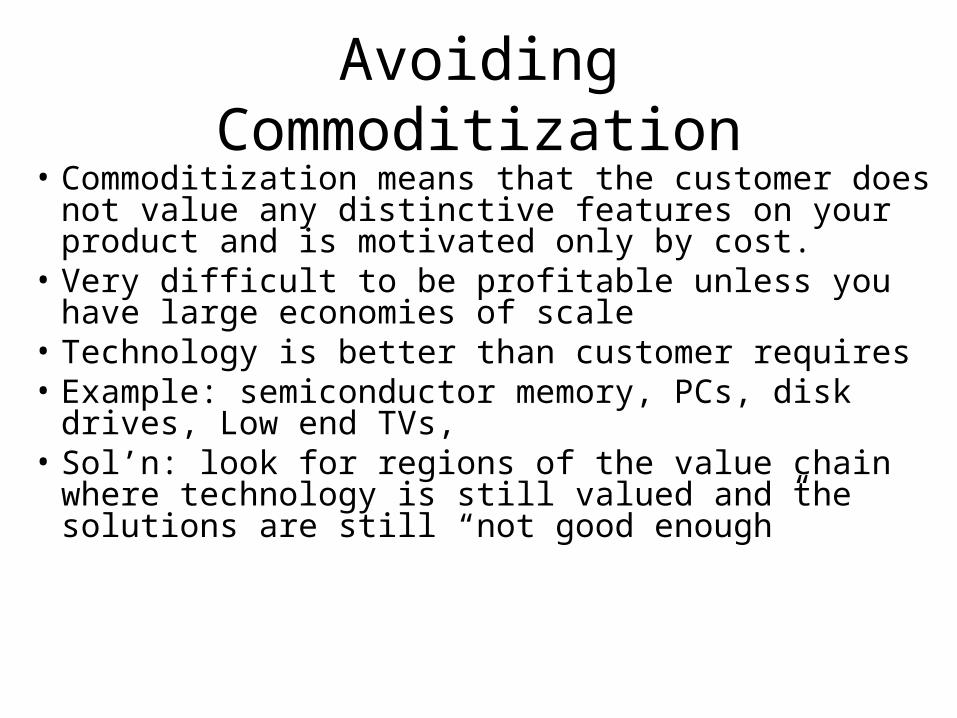
Avoiding Commoditization• Commoditization means that the customer does not
value any distinctive features on your product and is motivated only by cost.
• Very difficult to be profitable unless you have large economies of scale
• Technology is better than customer requires• Example: semiconductor memory, PCs, disk drives,
Low end TVs, • Sol’n: look for regions of the value chain where
technology is still valued and the solutions are still “not good enough”
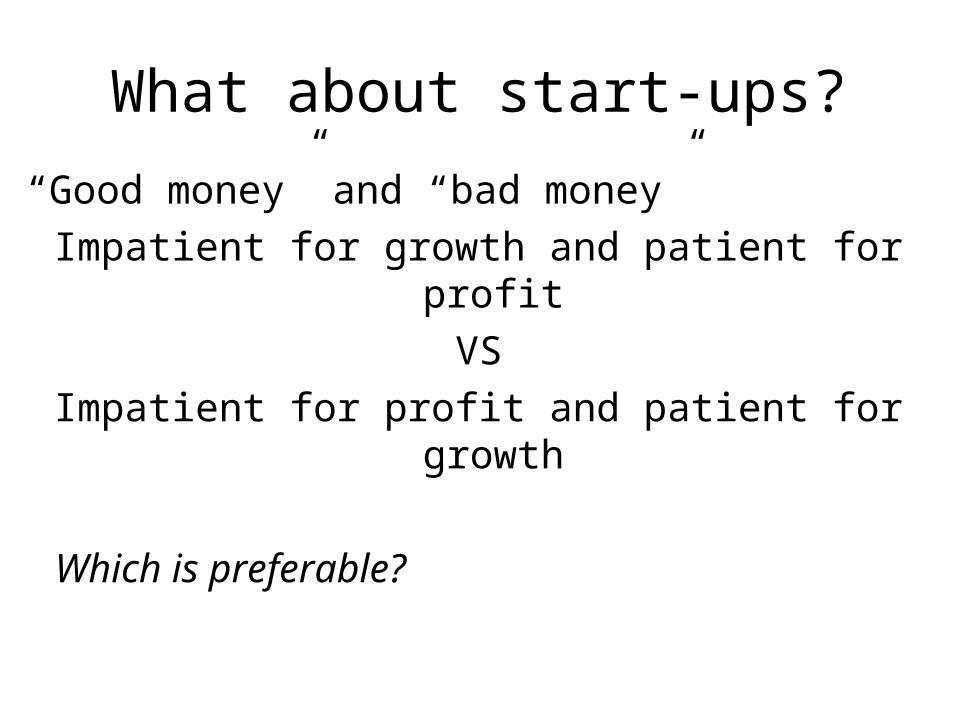
What about start-ups?
“Good money” and “bad money”
Impatient for growth and patient for profit
VS
Impatient for profit and patient for growth
Which is preferable?

Growth Patience
• Disruptive markets take time to develop–Competing against non-consumption–Moving disruptively up market–Fast growth means that high volume
users switch en masse to new product. This occurs only with sustaining innovation.
Profit impatience• Management is forced to test ASAP that
customers will pay a profitable price for the product.
• Real products must be shown to have real value and earn real money
• Need to rapidly experiment with market• If no pressure, management can postpone
this test, burning cash and finding out that the business is unprofitable

1990s Internet business model
• Measuring business success by “eyeballs”, Revenue, not profits
• What about social networking in 2008?

Rules for successful growth in larger companies
• Start Early- plan to continuously grow new businesses while the core is healthy
• Acquire new businesses in a predetermined rhythm- look for disruptive potential
• Start Small- keep dividing operating units– Small is beautiful
• Demand early success– Don’t waste a lot of money subsidizing businesses
that don’t meet their goals

Conclusions
• Most businesses- even “good” businesses- eventually fail
• The processes that drive this are beginning to be understood
• Disruptive technologies can be a weapon to sustain and grow a business
• It is difficult to emerge from a “death spiral” • Big is not necessarily better except if big is made
up of small entrepreneurial units• Growth requires impatience for profits
References
• See especially,
• Christensen: “The Innovator’s Dilemma” and “The Innovator’s solution
addenda
• Porters Six Forces and disruptive technology

Six Forces Diagram to Determine how Competitive a Company is (Porter)
The Business
Power, Vigor and Competence of Existing Competitors
Power, Vigor and Competence of Customers
Power, Vigor and Competence of Complementors
Power, Vigor and Competence of Suppliers
Power, Vigor and Competence of Potential Competitors
Possibility that what your business is doing can be done in a different way

Strategic Inflection Point Six Forces Diagram with a “10X” Force
The Business
Power, Vigor and Competence of Existing Competitors
Power, Vigor and Competence of Customers
Power, Vigor and Competence of Complementors
Power, Vigor and Competence of Suppliers
Power, Vigor and Competence of Potential Competitors
Possibility that what your business is doing can be done in a different way
Disruptive!

Learning Curve

Calculating the Best Alternative and Net Present
Value
Investment Alternatives
• The object is to take capital earned, borrowed or from investors and allocate it in a fashion that earns the highest return for the shareholders of the company.
• There needs to be an appropriate balance of long and short term returns.
• More complex and as simple as a matter of dollars and cents.
Question: What are some investment alternatives for a company?

What CEOs do for a living
CEO
Business1
Business2
Opportunity1
Opportunity2
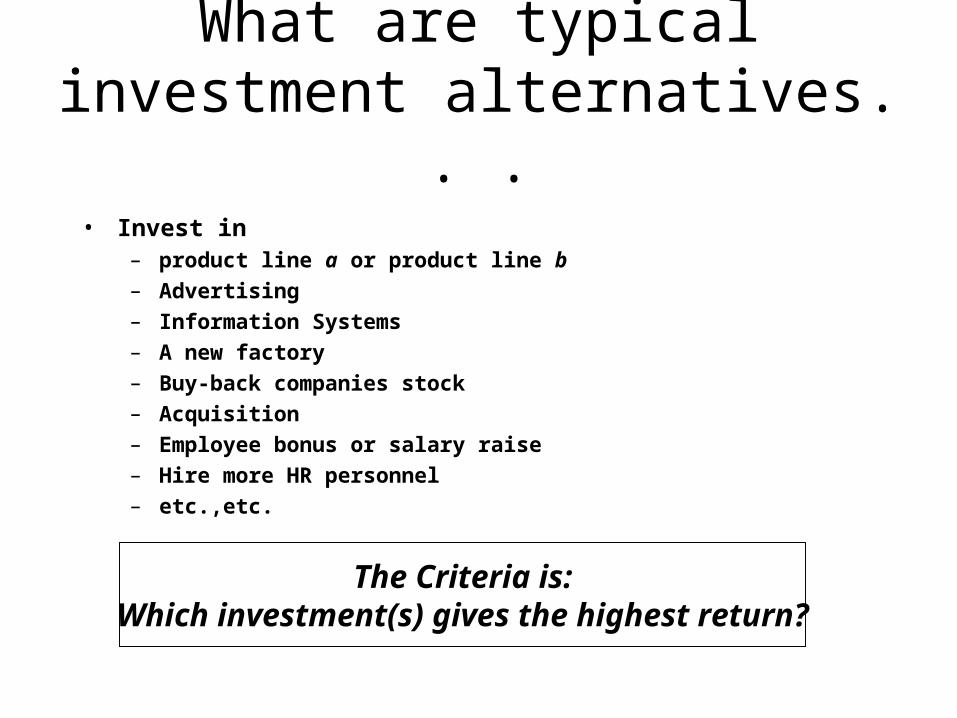
What are typical investment alternatives. . .
• Invest in – product line a or product line b– Advertising– Information Systems– A new factory– Buy-back companies stock– Acquisition– Employee bonus or salary raise– Hire more HR personnel– etc.,etc.
The Criteria is:Which investment(s) gives the highest return?

Question
• How do you calculate which gives the highest return?

Principal of Equivalence
• The state of being equal in value– amount– discount assumptions– Time transactions occur
All investments must be normalized to give equivalence so comparisons can be made

Net Present Value of an Investment
• Holds for all investments
• Takes into account inflation, cost of capital, corporate expectations of return
• Reduces all times to a common point

Calculation of Net Present Value
n
tt
t
k
ANPV
0 1
Where k is the expected rate of return
A sub t is the cash flow in the period t
Choose the programs whose NPV is highest consistent with strategy, risk, resource, etc.

Calculation of Payback Period
0
10
n
tt
t
r
A
Where r = discount rate
is the cash flow in period t
tAtA
tA
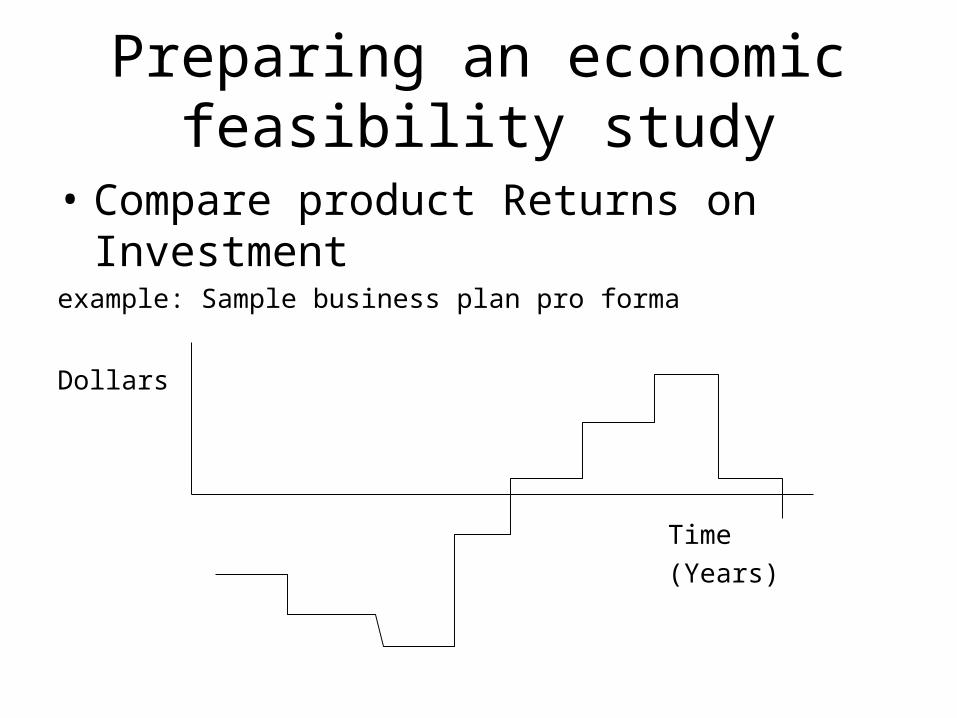
Preparing an economic feasibility study
• Compare product Returns on Investmentexample: Sample business plan pro forma
Dollars
Time
(Years)

What should the discount rate be
• For a start-up
• For a growth company
• For a mature company
• For an Aerospace company

To calculate NPV, first assume a cash flow
-4000
-2000
0
2000
4000
6000
8000
10000
1 2 3 4 5 6 7 8 9 10 11 12Time (Years)
CashFlow
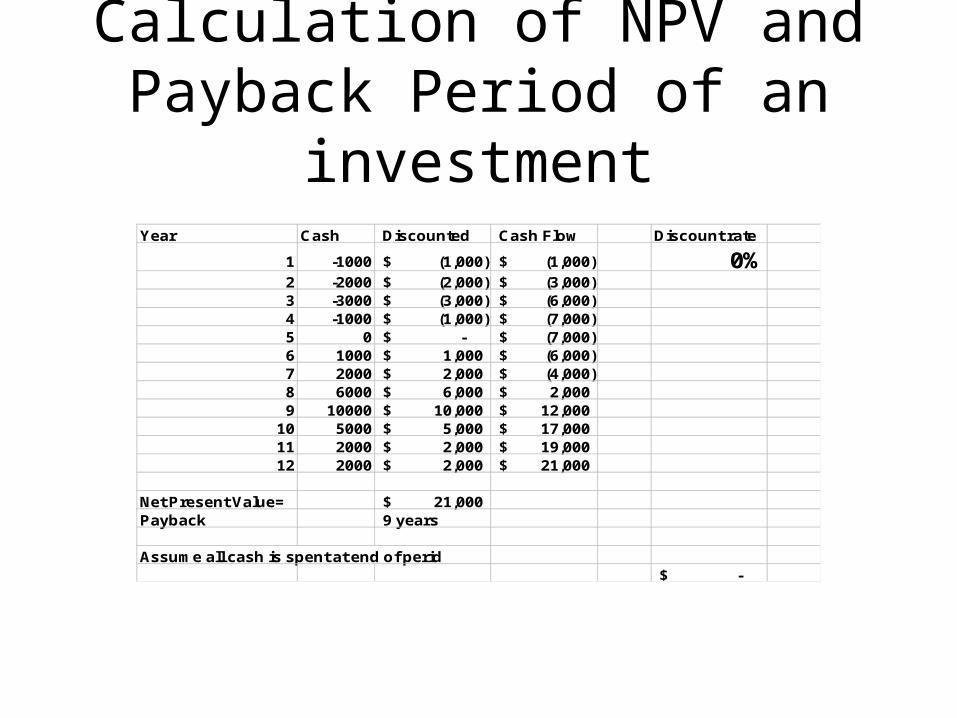
Calculation of NPV and Payback Period of an
investmentYear Cash Discounted Cash Flow Discount rate
1 -1000 (1,000)$ (1,000)$ 0%2 -2000 (2,000)$ (3,000)$ 3 -3000 (3,000)$ (6,000)$ 4 -1000 (1,000)$ (7,000)$ 5 0 -$ (7,000)$ 6 1000 1,000$ (6,000)$ 7 2000 2,000$ (4,000)$ 8 6000 6,000$ 2,000$ 9 10000 10,000$ 12,000$
10 5000 5,000$ 17,000$ 11 2000 2,000$ 19,000$ 12 2000 2,000$ 21,000$
Net Present Value= 21,000$ Payback 9 years
Assume all cash is spent at end of perid-$
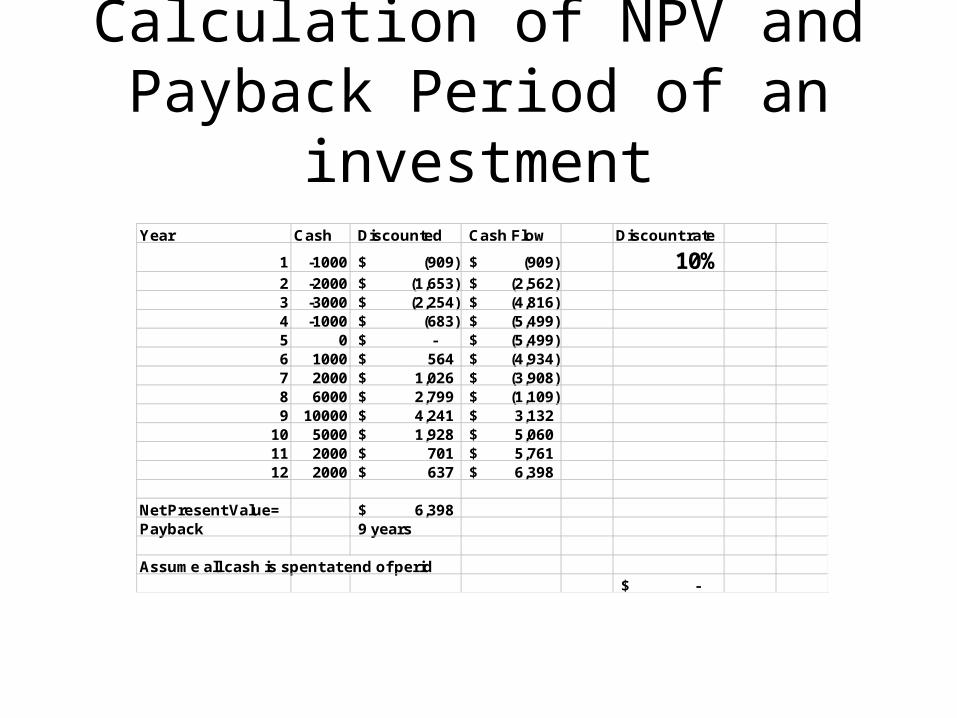
Calculation of NPV and Payback Period of an
investmentYear Cash Discounted Cash Flow Discount rate
1 -1000 (909)$ (909)$ 10%2 -2000 (1,653)$ (2,562)$ 3 -3000 (2,254)$ (4,816)$ 4 -1000 (683)$ (5,499)$ 5 0 -$ (5,499)$ 6 1000 564$ (4,934)$ 7 2000 1,026$ (3,908)$ 8 6000 2,799$ (1,109)$ 9 10000 4,241$ 3,132$
10 5000 1,928$ 5,060$ 11 2000 701$ 5,761$ 12 2000 637$ 6,398$
Net Present Value= 6,398$ Payback 9 years
Assume all cash is spent at end of perid-$

Calculation of Internal Rate of Return (IRR) for a project
• Calculate a discount rate (k) that reduces the NPV of a project to zero
n
tt
t
k
ANPV
0 10

Calculation of Internal Rate of Return IRR) of an investment
-1000
-500
0
500
1000
1500
20 21 22 23 24 25 26 27 28 29
NPV($) VsDiscount Rate(%)
IRR=24.3%
Net Present Value
• What are the Problems with this analysis methodology?
Trying to predict many years in advance
Adjust it to give you the “right” number
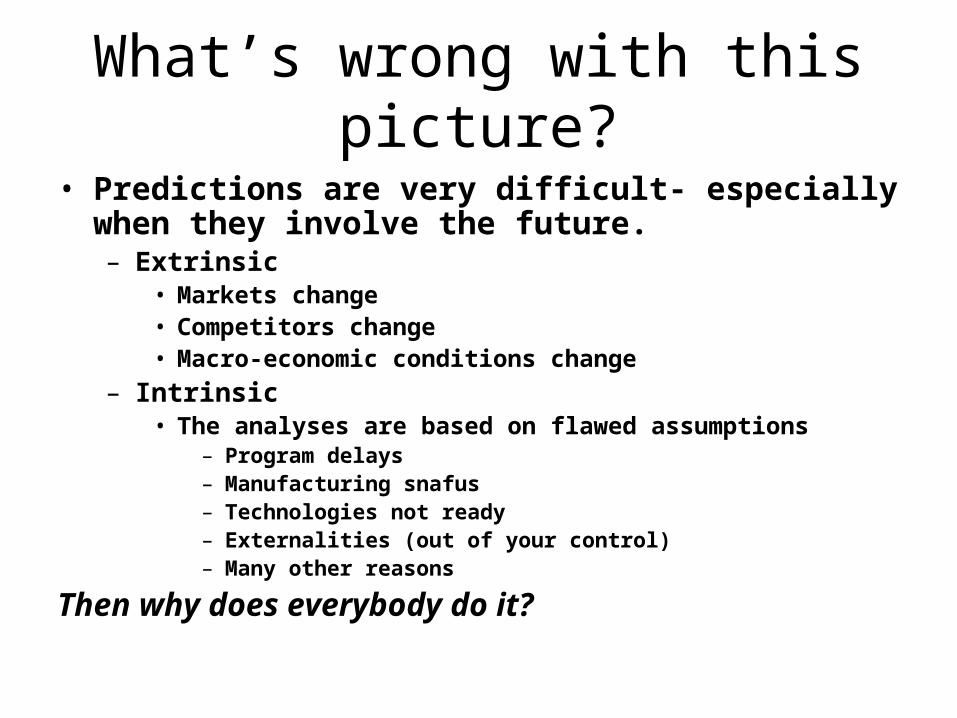
What’s wrong with this picture?
• Predictions are very difficult- especially when they involve the future.– Extrinsic
• Markets change• Competitors change• Macro-economic conditions change
– Intrinsic• The analyses are based on flawed assumptions
– Program delays– Manufacturing snafus– Technologies not ready– Externalities (out of your control)– Many other reasons
Then why does everybody do it?
Advantages of a quantitative methodology

Sensitivity Analysis
• Reduce (Increase) Price
• Change Product Development Time
• Consider competitive response
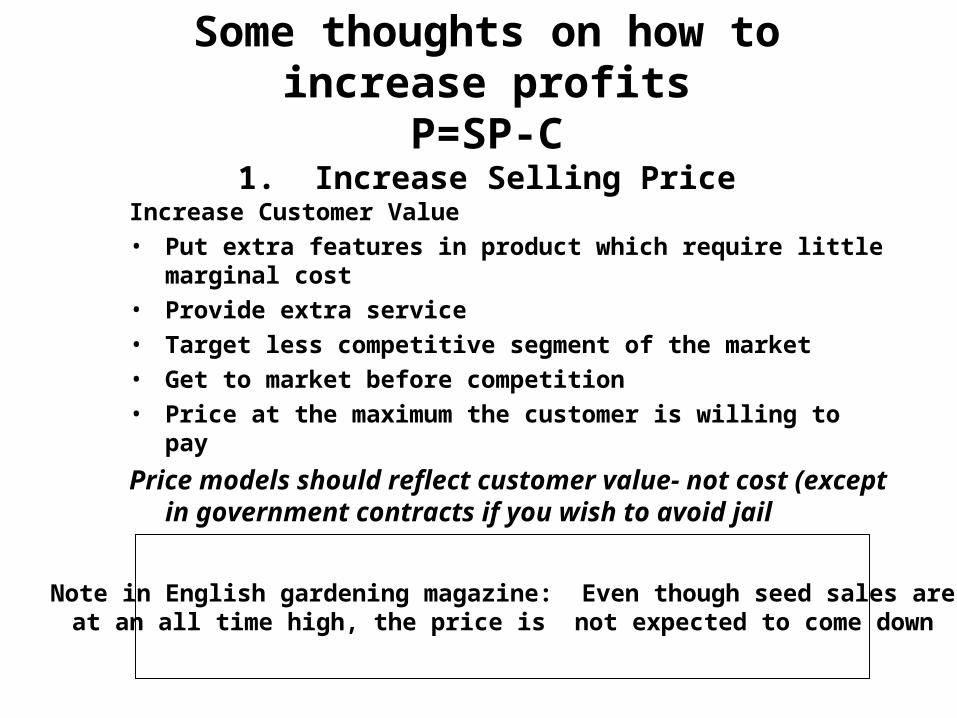
Some thoughts on how to increase profitsP=SP-C
1. Increase Selling PriceIncrease Customer Value
• Put extra features in product which require little marginal cost
• Provide extra service
• Target less competitive segment of the market
• Get to market before competition
• Price at the maximum the customer is willing to pay
Price models should reflect customer value- not cost (except in government contracts if you wish to avoid jail
Note in English gardening magazine: Even though seed sales are at an all time high, the price is not expected to come down
• Why?
Some thoughts on how to increase profitsP=SP-C
2. Decrease Selling Price

• Do it right the first time
• Don’t commit to detailed design until you have customers specs firmthen don’t change
• Build a manufacturable product. Bring manufacturing in early
• Don’t overload with features that the customer doesn’t want that are costly to develop
• Manage tightly to schedule with appropriate risk and risk reduction plans
• Use rigid phase exit criteria
All of these consistent with Fast C/T
Some thoughts on how to increase profitsP=SP-C
3. Decrease Product Development (NRE) and Manufacturing (RE) costs
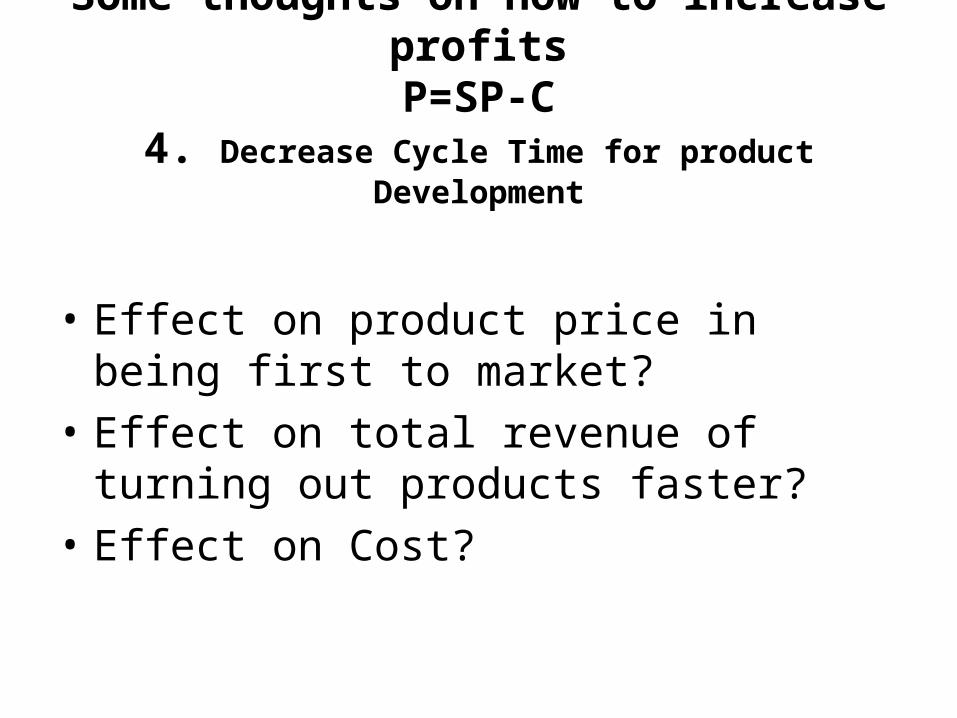
• Effect on product price in being first to market?
• Effect on total revenue of turning out products faster?
• Effect on Cost?
Some thoughts on how to increase profitsP=SP-C
4. Decrease Cycle Time for product Development
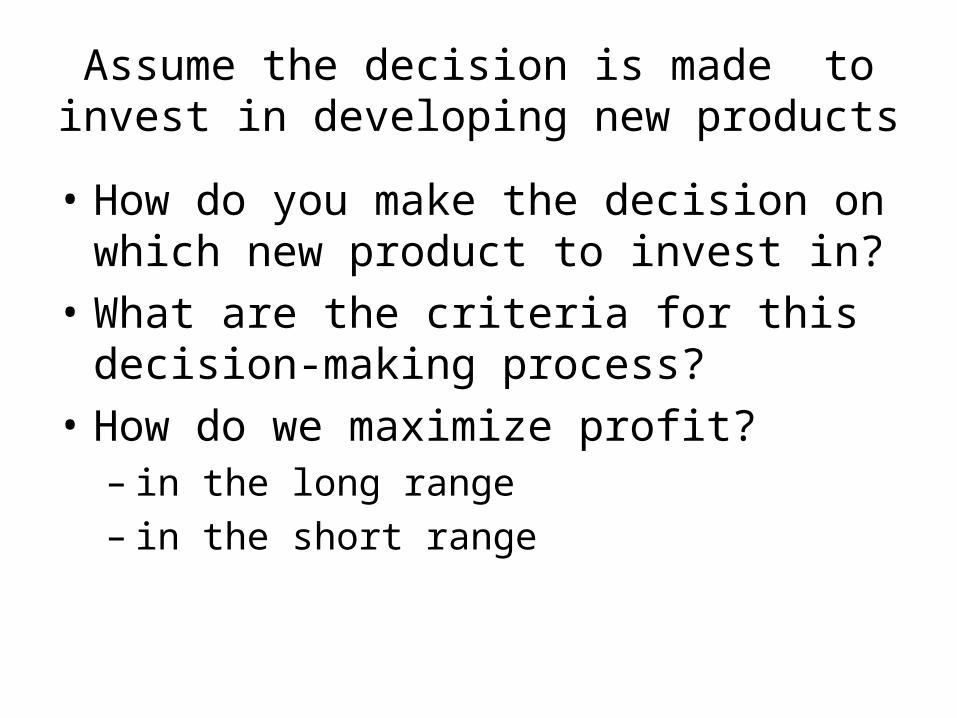
Assume the decision is made to invest in developing new products
• How do you make the decision on which new product to invest in?
• What are the criteria for this decision-making process?
• How do we maximize profit? – in the long range– in the short range

Portfolio Analysis
Reward (NPV)
Risk
Game Changers
KillBread and Butter
Pearls

D
C
B
A
Reward (NPV)
Risk
Kill
Game Changers
Bread and Butter
Pearls
A Portfolio of 6 programs
G
F
Note: area = program cost
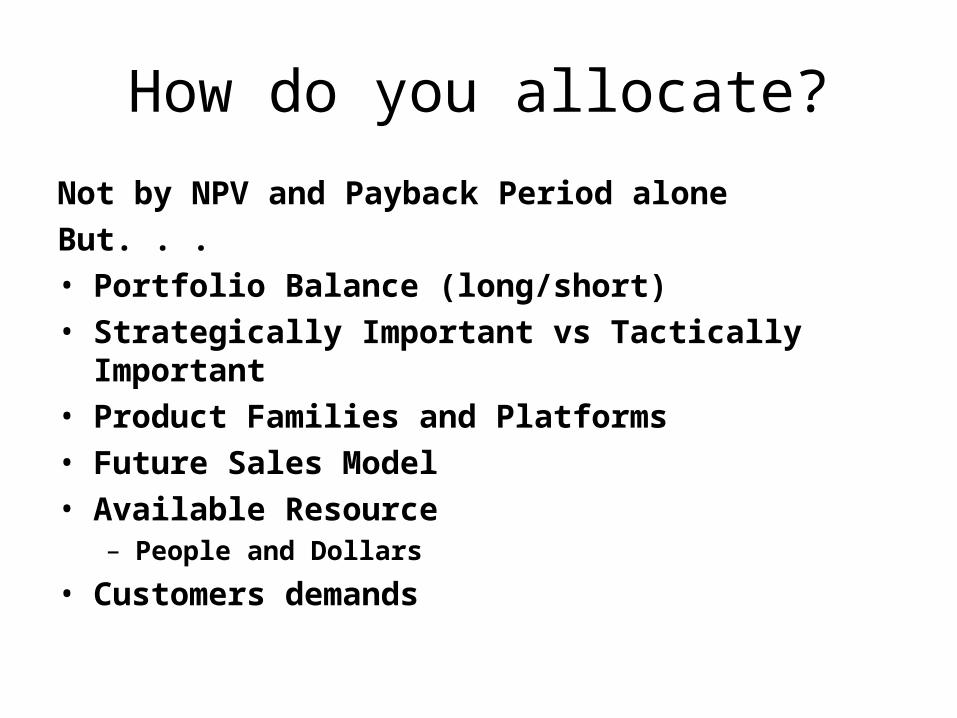
How do you allocate?
Not by NPV and Payback Period alone
But. . .• Portfolio Balance (long/short) • Strategically Important vs Tactically Important• Product Families and Platforms• Future Sales Model• Available Resource
– People and Dollars
• Customers demands

Data for Rank ordered List
Project Name IRR NPV StrategicImportance
Probability ofTechnical Success
Alpha 20% 10.0 5 80%
Beta 15% 2.0 2 70%
Gamma 10% 5.0 3 90%
Delta 17% 12.0 2 65%
Epsilon 12% 20.0 4 90%
Omega 22% 6.0 1 85%

Rank Ordered by discounting returns by probability of success
Project Name IRR NPV StrategicImportance
Ranking Score
Alpha 16.0 (2) 8.0 (2) 5 (1) 1.67 (1)
Epsilon 10.8 (4) 18.0 (1) 4 (2) 2.33 (2)
Delta 11 (3) 7.8 (3) 2 (4) 3.33 (3)
Omega 18.7 (1) 5.1 (4) 1 (6) 3.67 (4)
Gamma 9.0 (6) 4.5 (5) 3 (3) 4.67 (5)
Beta 10.5 (5) 1.4 (6) 2 (4) 5.0 (6)