lecture 6: linear regression ii
DESCRIPTION
Lecture 6: Linear Regression II. Machine Learning CUNY Graduate Center. Extension to polynomial regression. Extension to polynomial regression. Polynomial regression is the same as linear regression in D dimensions. Generate new features. Standard Polynomial with coefficients, w. Risk. - PowerPoint PPT PresentationTRANSCRIPT
Machine Learning
CUNY Graduate Center
Lecture 6: Linear Regression II

Extension to polynomial regression
2

Extension to polynomial regression
• Polynomial regression is the same as linear regression in D dimensions
3
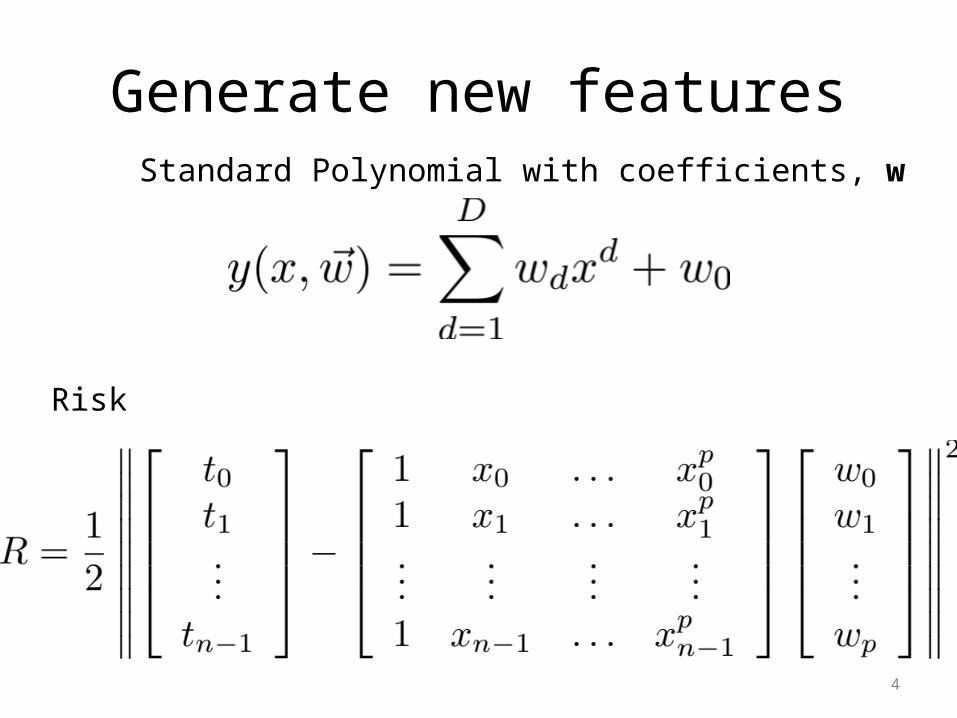
Generate new features
4
Standard Polynomial with coefficients, w
Risk
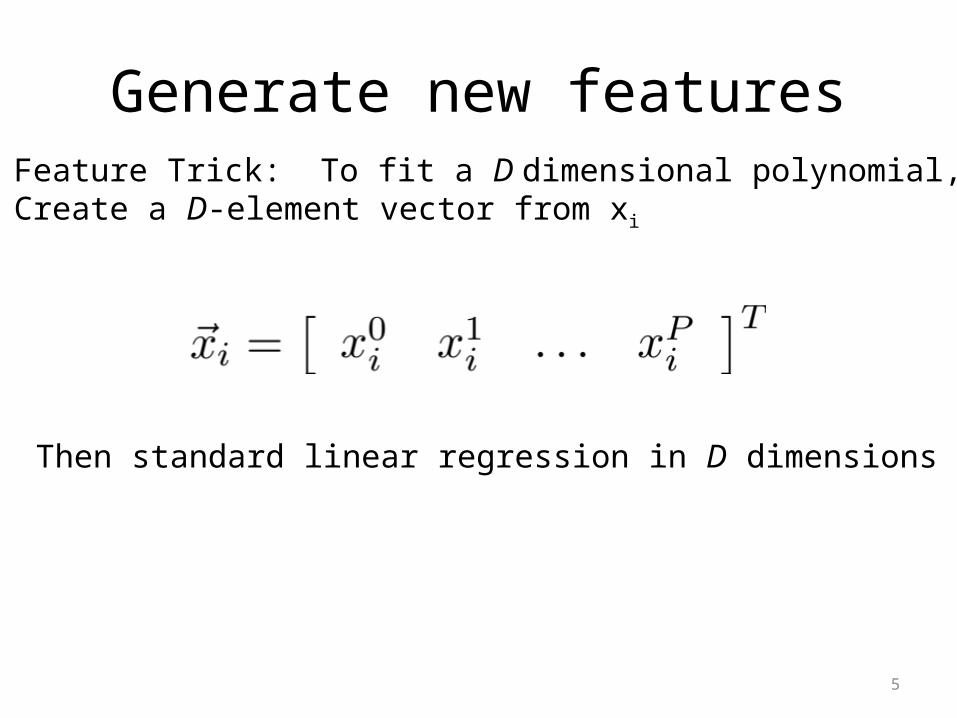
Generate new features
5
Feature Trick: To fit a D dimensional polynomial,Create a D-element vector from xi
Then standard linear regression in D dimensions
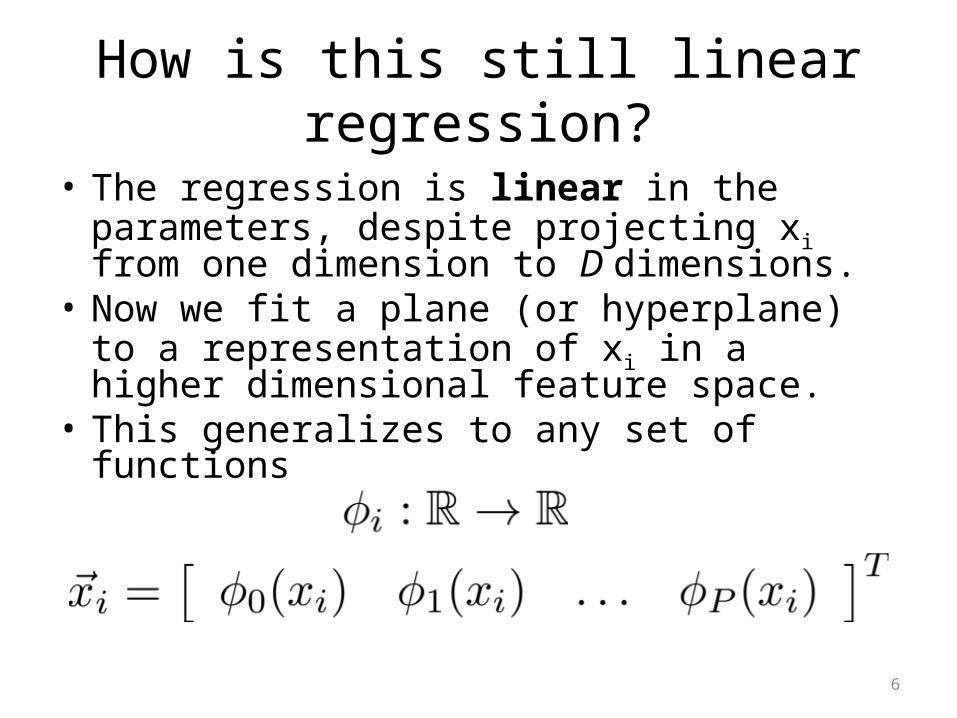
How is this still linear regression?
• The regression is linear in the parameters, despite projecting xi from one dimension to D dimensions.
• Now we fit a plane (or hyperplane) to a representation of xi in a higher dimensional feature space.
• This generalizes to any set of functions
6

Basis functions as feature extraction
• These functions are called basis functions.– They define the bases of the feature space
• Allows linear decomposition of any type of function to data points
• Common Choices:– Polynomial
– Gaussian
– Sigmoids
– Wave functions (sine, etc.)
7

Training data vs. Testing Data
• Evaluating the performance of a classifier on training data is meaningless.
• With enough parameters, a model can simply memorize (encode) every training point
• To evaluate performance, data is divided into training and testing (or evaluation) data.– Training data is used to learn model parameters
– Testing data is used to evaluate performance
8

Overfitting
9

Overfitting
10

Overfitting performance
11

Definition of overfitting
• When the model describes the noise, rather than the signal.
• How can you tell the difference between overfitting, and a bad model?
12

Possible detection of overfitting
• Stability – An appropriately fit model is stable under
different samples of the training data– An overfit model generates inconsistent
performance
• Performance– A good model has low test error– A bad model has high test error
13

What is the optimal model size?
• The best model size generalizes to unseen data the best.
• Approximate this by testing error.• One way to optimize parameters is to
minimize testing error.– This operation uses testing data as tuning or
development data• Sacrifices training data in favor of parameter
optimization• Can we do this without explicit evaluation
data?
14
Context for linear regression
• Simple approach
• Efficient learning
• Extensible
• Regularization provides robust models
15

Linear Regression
• Identify the best parameters, w, for a regression function
16

Overfitting
• Recall: overfitting happens when a model is capturing idiosyncrasies of the data rather than generalities.– Often caused by too many parameters
relative to the amount of training data.– E.g. an order-N polynomial can intersect any
N+1 data points
17

Dealing with Overfitting
• Use more data
• Use a tuning set
• Regularization
• Be a Bayesian
18

Regularization
• In a linear regression model overfitting is characterized by large weights.
19
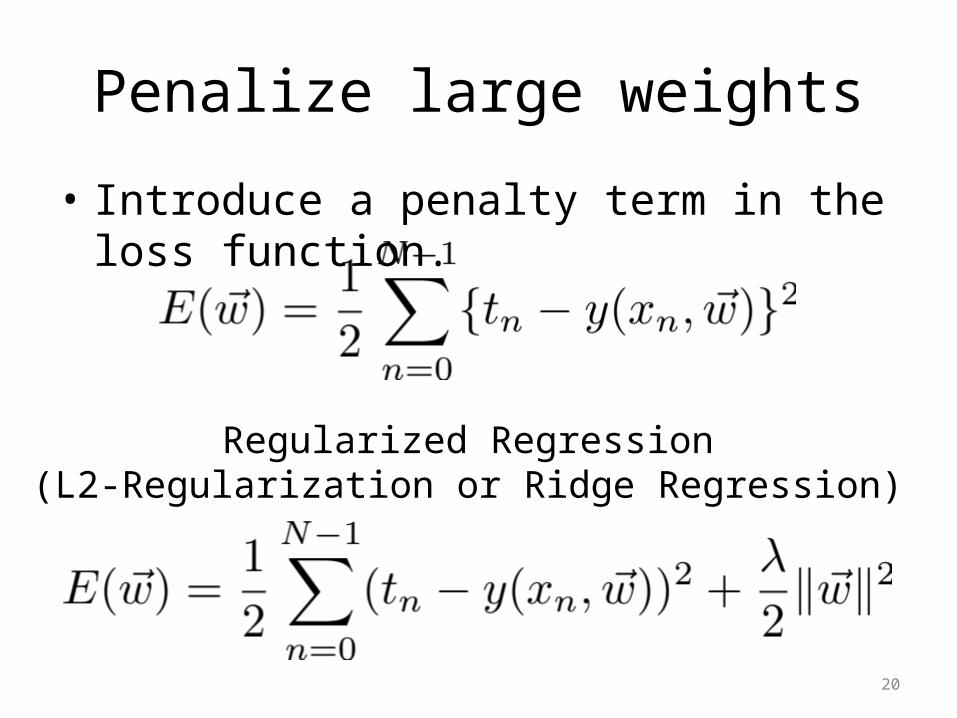
Penalize large weights
• Introduce a penalty term in the loss function.
20
Regularized Regression(L2-Regularization or Ridge Regression)

Regularization Derivation
21

22
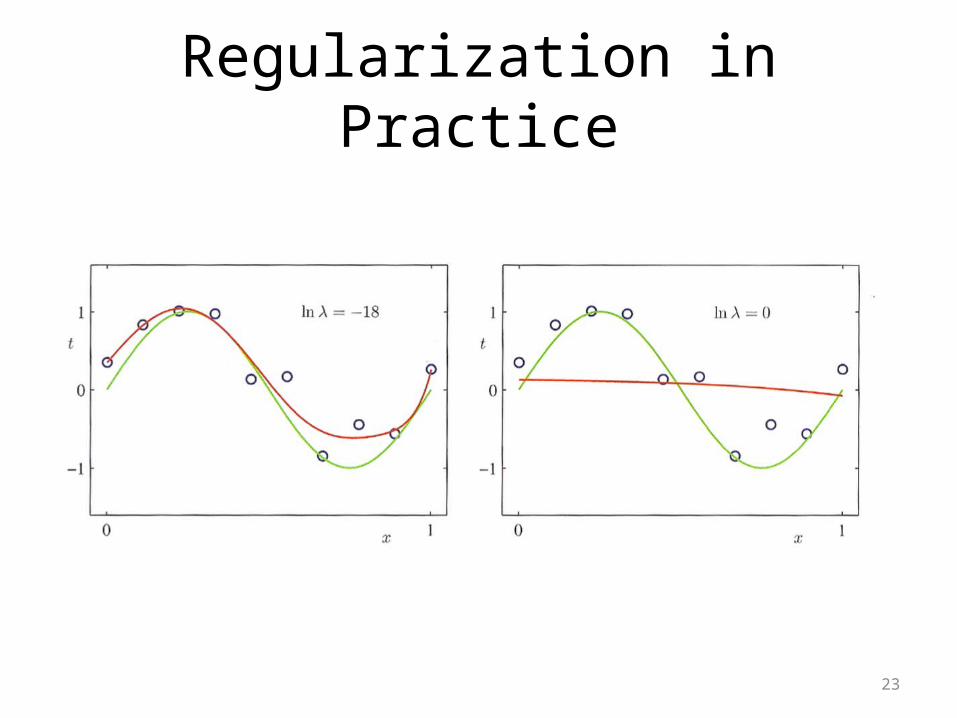
Regularization in Practice
23
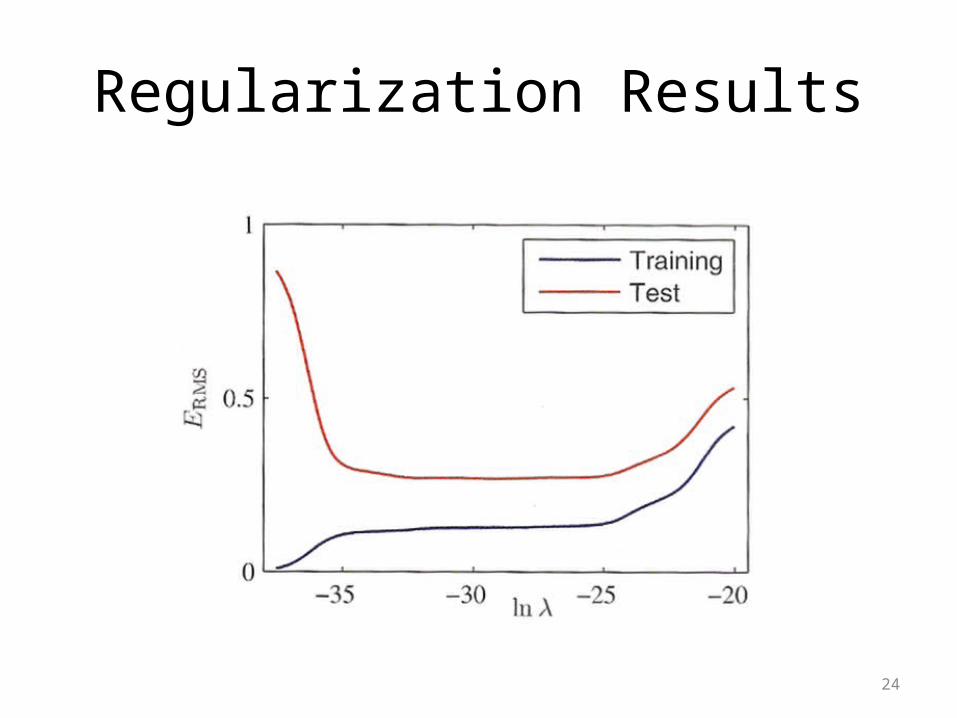
Regularization Results
24

More regularization
• The penalty term defines the styles of regularization
• L2-Regularization• L1-Regularization• L0-Regularization
– L0-norm is the optimal subset of features
25
Curse of dimensionality
• Increasing dimensionality of features increases the data requirements exponentially.
• For example, if a single feature can be accurately approximated with 100 data points, to optimize the joint over two features requires 100*100 data points.
• Models should be small relative to the amount of available data
• Dimensionality reduction techniques – feature selection – can help.– L0-regularization is explicit feature selection– L1- and L2-regularizations approximate feature selection.
26

Bayesians v. Frequentists
• What is a probability?• Frequentists
– A probability is the likelihood that an event will happen– It is approximated by the ratio of the number of observed events to the
number of total events– Assessment is vital to selecting a model– Point estimates are absolutely fine
• Bayesians– A probability is a degree of believability of a proposition.– Bayesians require that probabilities be prior beliefs conditioned on data.– The Bayesian approach “is optimal”, given a good model, a good prior
and a good loss function. Don’t worry so much about assessment.– If you are ever making a point estimate, you’ve made a mistake. The
only valid probabilities are posteriors based on evidence given some prior
27

Bayesian Linear Regression
• The previous MLE derivation of linear regression uses point estimates for the weight vector, w.
• Bayesians say, “hold it right there”.– Use a prior distribution over w to estimate parameters
• Alpha is a hyperparameter over w, where alpha is the precision or inverse variance of the distribution.
• Now optimize:
28

Optimize the Bayesian posterior
29
As usual it’s easier to optimize after a log transform.

Optimize the Bayesian posterior
30
As usual it’s easier to optimize after a log transform.

Optimize the Bayesian posterior
31
Ignoring terms that do not depend on w
IDENTICAL formulation as L2-regularization
Context
• Overfitting is bad.
• Bayesians vs. Frequentists– Is one better?– Machine Learning uses techniques from both
camps.
32

Next Time
• Logistic Regression
33