lecture 4
DESCRIPTION
Lecture 4. Chinagro model structure and classifications W.C.M. van Veen. Presentation available: www.sow.vu.nl/downloadables.htm www.ccap.org.cn. Current status of the welfare model. Chinagro model presented in 4 lectures Lecture 4Structure and classifications Lecture 5Consumer demand - PowerPoint PPT PresentationTRANSCRIPT

Chinagro model structure and
classifications
W.C.M. van Veen
Presentation available:www.sow.vu.nl/downloadables.htm
www.ccap.org.cn
Lecture 4

Current status of the welfare model
Chinagro model presented in 4 lectures
Lecture 4 Structure and classificationsLecture 5 Consumer demandLecture 6 Farm supplyLecture 7 Feed accounting methodology
Contents of lecture 4
Recapitulation of yesterday's lectures aggregation messages structure Chinagro welfare model
Classifications Chinagro consumers producers markets: sites, commodities
Recapitulation aggregation (1)
Two types of aggregation from individual 'nano' (spatial
or social continuum) to operational 'micro' level:
exact optimal (best approximation)

Recapitulation aggregation (2)
Is exact aggregation feasible?
for profit maximizing farmers: yes for consumers maximizing utility subject to a
budget constraint (demand system): yes, provided marginal utility of income is fixed (true in welfare programme since transfers adjust)
for markets and commodities: no (compromise unavoidable in applications)

Recapitulation aggregation (3)
Is optimal aggregation feasible?
for profit maximizing farmers: yes for consumers maximizing utility subject to a
budget constraint (demand system): yes for markets and commodities: no (compromise
unavoidable in applications)

Recapitulation aggregation (4)
Importance of aggregation messages for Chinagro welfare model:
provides underpinning of operational specification of representative farmers and consumers (in terms of both exact and optimal aggregation)
possibility to use 'nano'-level information in estimation procedure
Structure of Chinagro welfare model (1)
profit maximizing farmers at detailed spatial level utility maximizing consumers at detailed spatial
level spatially aggregated markets for commodities
traded outside the own site, possibly also from/to abroad
local markets for sources at detailed spatial level
detailed level: county aggregated level: region

Structure of Chinagro welfare model (2)
Full static version:
j s s s ss s s sv 0;g 0;c ,y 0;z ,z 0;w ,w 0
s S j j s Ss j j s
j s Sj j s s s s
s s s s
max u ( c )
subject to
c g v w v y w (p )
g v z z
(p w p w ) B
c z y z
s
s s s
(p )F ( y ,e ) 0
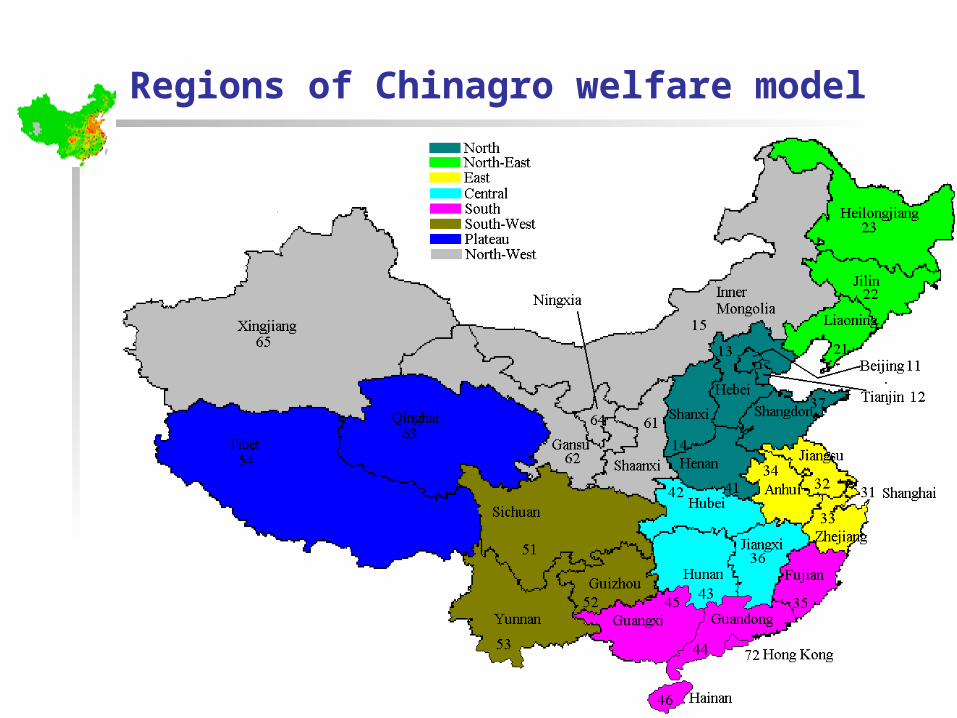
Regions of Chinagro welfare model
Classification of consumers
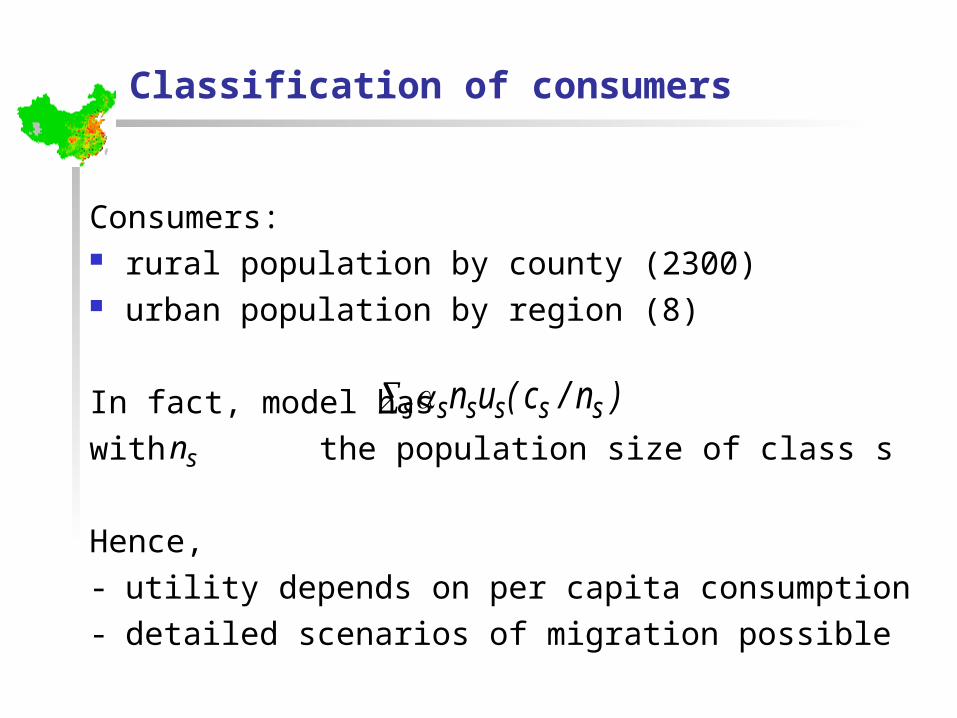
Consumers: rural population by county (2300) urban population by region (8)
In fact, model has with the population size of class s
Hence,- utility depends on per capita consumption- detailed scenarios of migration possible
s sssss )n/c(unsn
Classification of producers
In each county: two crop farmers: rainfed, irrigated number of livestock farmers: under discussion one fisherman (exogenous output)In each region: one non-agricultural producer (exogenous output)
(each producer characterized by own transformation function and own optimal behaviour)

Relative importance livestock activities 1997
(in million of RSLU)
CattleBuffalo Goat Sheep Pigs Poultry
Grazing 21.9 - 5.2 8.8 - -Trad. mixed 51.3 22.1 10.5 4.2 32.2
20.5Specialized 2.0 0.1 2.0 1.6 3.1
10.5Industrial 1.5 - 0.5 1.5 1.8 1.9
Source: CCAP/IIASA

Possible classification livestock farmers
By system: meat/milk ruminants, grazing meat/milk ruminants, mixed draught animals pigs/poultry, mixed pigs, intensified poultry, intensified

Model specification intensified livestock
production adjusts, within bounds, to demand spatial distribution of production adjustment
specified exogenously
In model formula, for instance:with
instead of
0)e,y(F sss 21
0)e,y(F sss
Classification of markets
For tradable commodities spatial aggregation into 8 regions commodity aggregation into 14 commodities:
food (12)non-agriculture (1)marketed feed (1)
Furthermore, 3 types of local sources (county markets)feeds operating capacityplant nutrients

Relative importance of food commodities (in % of total food expenditures, 1997)
Rural UrbanRice 18.8 9.6Wheat 12.8 5.1Maize 2.9 0.5Other staple 6.4 1.4Veget.oil 6.2 4.6Sugar 1.2 1.7Fruit 4.1 8.7Vegetables 16.5 14.8Rumin.meat 3.0 7.4Pork 16.8 14.6Poultry 7.5 19.6Fish 4.0 11.9Source: CCAP/IIASA

Relative importance of feed types, 1997
Supply in million GcalLocal feed Marketed feed
North 89 124Northeast 78 68East 50 40Central 71 35South 55 23Southwest 101 55Northwest 147 49
Source: CCAP/IIASA/SOW-VU
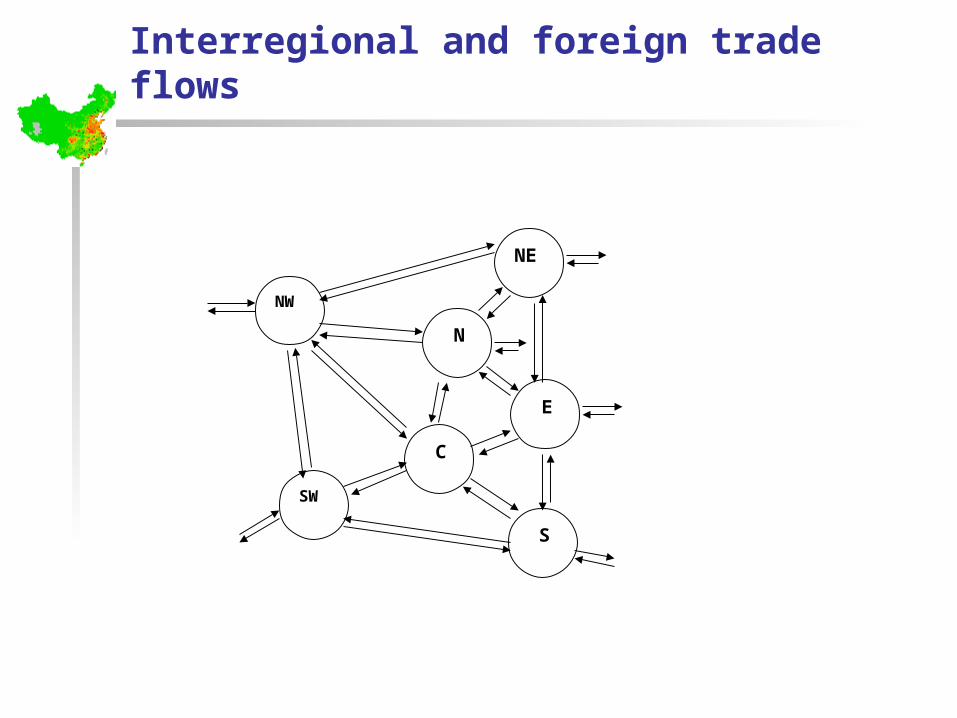
Interregional and foreign trade flows
NE
NW
N
E
C
SW
S

Net import flows by region, 1997, 1000 Mton
Milled rice PorkNorth 3273 -115Northeast 1362 330East -360 760Central -5181 -1084South 4969 1239Southwest -5830 -1214Northwest 1218 -337
China -549 -421
Source: calculated from baseyear data set of the project

Trade flows inside the regions
Market region r (centre of gravity)
Rural consumercounty 1
Rural consumer
county S(r)
Farmgate county 1
Farmgate county S(r)
Urban consumer
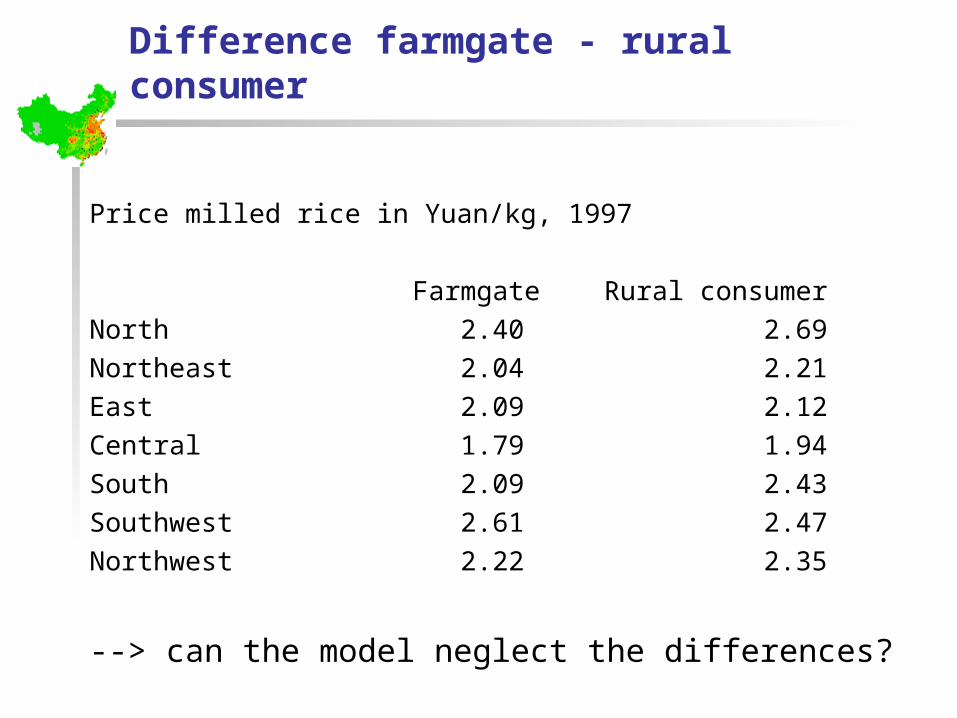
Difference farmgate - rural consumer
Price milled rice in Yuan/kg, 1997
Farmgate Rural consumerNorth 2.40 2.69Northeast 2.04 2.21East 2.09 2.12Central 1.79 1.94South 2.09 2.43Southwest 2.61 2.47Northwest 2.22 2.35
--> can the model neglect the differences?

Solving the welfare model
solution algorithm in GAMS dimensions large (2300 counties!) therefore, decomposition of welfare model:
- regional variables and markets in main programme- county variables in feedback loop- iteration between main programme and feedback
specification of farm supply and rural consumption should allow solution in closed form (at given regional prices)