lecture 3-we don't tenure mother teresa · we don’t tenure mother teresa 1. the climate...
TRANSCRIPT
4/15/16
1
DanielKammen
Classof1935Distinguished Professor ofEnergyEnergyandResources Group |Goldman School of
Public PolicyDirector, Renewable andAppropriate Energy
LaboratoryUniversity ofCalifornia, Berkeley
April 11,2016
Lecture 3:We Don’t Tenure Mother Teresa
1.Theclimatecrisis reinvented (3.28.2016)Klein, chapters1&2|Optional:Dove&Kammen,chapter1
2.Ourmistrustofthefuturemakesithardtogiveupthepast (4.4.16)Klein, chapters3|Optional:Dove&Kammen,chapter5
3.Wedon’ttenureMotherTeresa (4.11.2016)Klein, chapter9|Optional:Dove&Kammen,chapter2
4.Whatarethebarriers toaction? (4.18.2016)Klein, chapter6- 8|
5.Aneweconomicsoftheplanet (4.25.2016)Klein, chapter4|Optional:Dove&Kammen,chapter3;Klein12
6.Pasteur’sQuadrant (5.2.2016)Klein, chapter7,11|Optional:Dove&Kammen,chapter4
Homework #1:Dueinclass forL#3List oneitem raisedbyKleinin Chapters1– 3whereyou:
a)wantmoreinformation
b)haveastrongfactual agreement ordisagreement
c)haveastrongvisceralagreementordisagreement
(b)isoptionalTwitter:@dan_kammen
Website:http://rael.berkeley.edu
Resources:
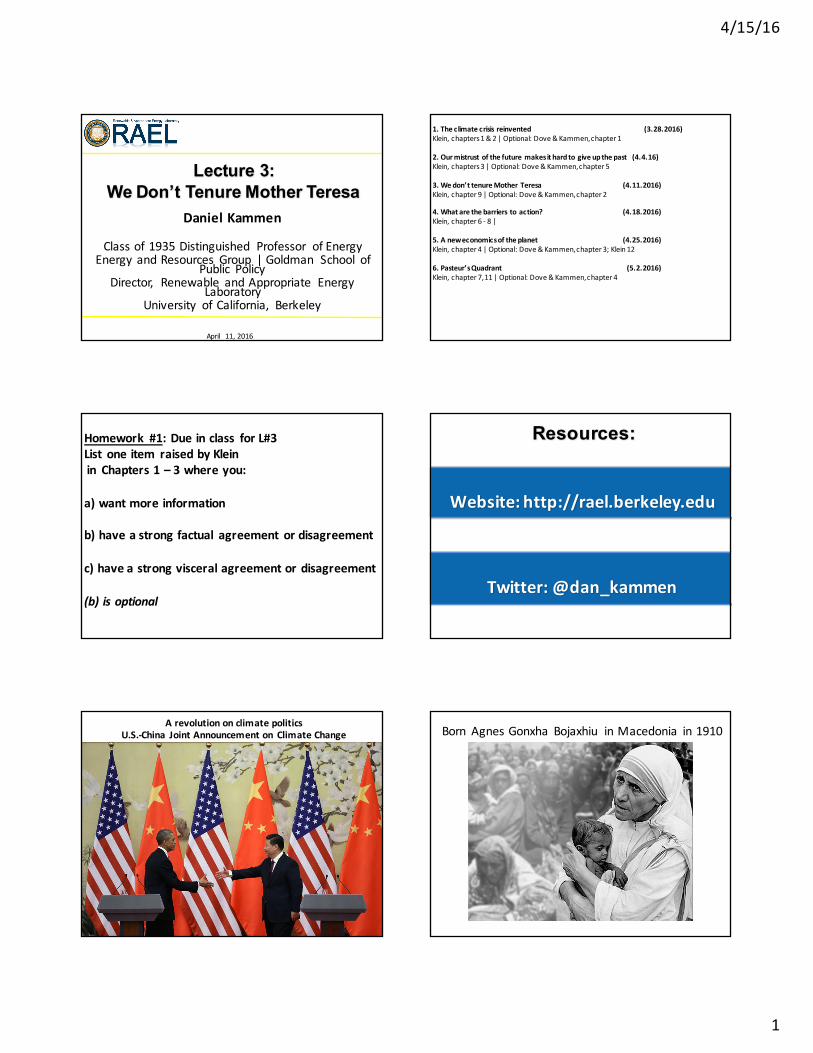
ArevolutiononclimatepoliticsU.S.-China JointAnnouncementon ClimateChange Born AgnesGonxha Bojaxhiu inMacedonia in1910

4/15/16
2
Laudato SiEncyclical Letteron CareforourCommon Home
UNGeneralAssemblyresolution65/151rael.berkeley.eduOctober 2011
EnergyPoverty:There are 1.4 billion people lacking access to electricity todayBased on current trends, 1.2 billion people will still lack access in 2030 Another 1+ billion have intermittent/unreliable access
International Energy Agency, 2010
Fig.3
9 UN General Assembly resolution 65/151rael.berkeley.edu
Liter of Light
UN General Assembly resolution 65/151rael.berkeley.edu
Technological and Entrepreneurial Opportunity: Lighting Africa
QuantitativeAssessments:EnergyandHumanDevelopmentSustainableEnergyforAll(UN)
Literacy
Mortality(Children)
Poverty
Education
Mortality(Infants)
Sanitation
Goldemberg (1979),
updated byAlstone,Gershenson &Kammen,NatureClimateChange

4/15/16
3
ER1 0 0 - Lectu re 5 Pag e 1 3
Biomass Resources andUse
ER1 0 0 - Lectu re 5 Pag e 1 4
Otherapproaches
ER1 0 0 - Lectu re 5 Pag e 1 5
source: WHO, 1999
23.7%
10.7%
Resp. Infections
6.5%N.C. Respiratory
5.6%
30.9%
Cardiovascular
Resp. Tract Cancer
4.1%Diarrheal Diseases
Malaria
Other
Injur ies
4%Perinatal Conditions
Childhood Diseases3.1%
4.2% HIV / AIDS
TB2.8%
Total54 M
TheGlobal Distribution ofDisease(Mortality)
ER1 0 0 - Lectu re 5 Pag e 1 6
GlobalDistributionofDisease:Mortality
ER1 0 0 - Lectu re 5 Pag e 1 7
source: WHO, 1999
32.9%
16%
Resp. Infections
6.2%N.C. Respiratory
4.5%
10.3%
Cardiovascular
Resp. Tract Cancer
5.3%
Diarrheal Diseases
2.8%Malaria
4.2%
Depression
Other
Injur ies
5.8%Perinatal Conditions
Childhood Diseases4.1%
5.1% HIV / AIDS
TB
Total1.4 B
TheGlobal Distribution ofDisease (DALY)DALY = disability
adjusted life year(= healthy years)
ER1 0 0 - Lectu re 5 Pag e 1 8

4/15/16
4
19
HotTopic:KeroseneforLighting
Source: Lam et al., EST (2012)
• 7-9%ofkerosenebecomeblackcarbon(BC--strongforcer)– Warmingof1kgofBC=700kgofCO2over100years
• Loworganiccarbonemissions(OC)• Lungfunction,asthma,cancerrisks
ER1 0 0 - Lectu re 5 Pag e 2 0
Biomass Resources andUseTime/Activity/Personal Exposure Daily Histories
ER1 0 0 - Lectu re 5 Pag e 2 1
0 - 5 5 - 15 15 - 50 > 50
Demographic Subgroups
Aver
age
PM10
Expo
sure
(µg
/ m3 )
0
2000
4000
6000
8000
F M F M F M F M
Exposure Calculated Using AverageEmissions at One Point
N = 342
Underestimation from ActualExposure (% Total)
35% 41%
73%
47%
81%
59%
67%
52%
TheEffect ofExposure Patterns
ER1 0 0 - Lectu re 5 Pag e 2 2
PM10
Conc
entra
tion
(µg
/ m3 )
Stove-Fuel Combination
0
1000
2000
3000
4000
5000
3-Stone Ceramic Wood Old Charcoal New Charcoal
n=105
n=16
n=6
Recall: OECD do-not-exceed PM10 standards are 50 - 150 µg/m3
Stove and Fuel Comparison (Average Emissions)
ER1 0 0 - Lectu re 5 Pag e 2 3
0
1000
2000
3000
4000
5000
F M F M F M F M F M3-Stone, Inside Ceramic, Inside Charcoal, Inside 3-Stone, Outside Ceramic, Outside
MeanLower 95% confidence interval
Upper 95% confidence interval
47%
38%
95% 83%
52%
74%
74%
79%
Age group: 15 - 49 years (n = 120)
Exposure in Rural Kenya: Age and Gender
Ezzati and Kammen (1995 - 2002):http://socrates.berkeley.edu/~rael/papers.html#cook ER1 0 0 - Lectu re 5 Pag e 2 4
% I
ncre
ase i
n Hos
pital
Adm
issio
ns
PM Concentration (µg / m3)
• Valid for Concentrations below 200 µg / m3
WHO Air Quality Guidelines , 1999
0
20
40
60
0 50 100 150 200
PM10
PM2.5
Developed Country Studies

4/15/16
5
ER1 0 0 - Lectu re 5 Pag e 2 5
Prob
abilit
y (A
RI)
Average Daily Exposure (µg / m3)
0
0.05
0.1
0.15
0 2000 4000 6000 8000
Charcoal
Ceramic Wood Stoves3-Stone Fire
Illness Reduction ObservedinKenya(ARI=acuterespiratoryinfection)
All ARI
ALRI, Lower respiratoryInfections only
$0.01
$0.10
$1.00
$10.00
$100.00
1 10 100 1,000 10,000 100,000 1,000,000
Cumulative Capacity Installed (MW)
Capi
tal C
ost (
2004
$/W
att)
PV1975-03
Wind1981-01
Sol. ThermalElec. 1985-91
NOx controls1974-03
Ethanol 1978-96
Nuclear1970-96
86025EnergySystemsAnalysis ArnulfGrubler
LearningRatesof108Technologies
45 20 10 -10
Freq
uenc
y (%
)
Learning rate40 35 30 25 15 5 0 -5
15
10
5
0
Positive learning
Negativelearning
Sourc e: Argote&Epple, 1990
Negative learning:Lockheed TristarFrench nuclear reactors
AREAREQUIRED..tosupply50%ofU.S.Passengervehiclemiles
JBStraubel, Tes laMotors28
Homework #1:Dueinclass forL#3List oneitem raisedbyKleinin Chapters1– 3whereyou:
a)wantmoreinformation
b)haveastrongfactual agreement ordisagreement
c)haveastrongvisceralagreementordisagreement
(b)isoptional